Article

Genome-Wide Profiling of the Genes Resistant to Bursaphelenchus xylophilus in Pinus tabuliformis Carriere

State Key Laboratory of Tree Genetics and Breeding, College of Biological Sciences and Technology, Beijing Forestry University, Beijing 100083, China
*
Author to whom correspondence should be addressed.
These authors contributed equally to this work.
Forests 2025, 16(4), 677; https://doi.org/10.3390/f16040677
Submission received: 12 February 2025 / Revised: 25 March 2025 / Accepted: 10 April 2025 / Published: 12 April 2025
(This article belongs to the Special Issue Latest Progress in Research on Forest Tree Genomics)

Abstract

:
Bursaphelenchus xylophilus is a pine wood nematode capable of destroying pine forests. Exploring the genes providing resistance to this pathogen and understanding their resistance mechanisms is thus necessary and constitutes an effective way to tackle this problem. We used Pinus tabuliformis Carriere to dissect its response to B. xylophilus strain BxFC. The 30 d inoculation results showed that the P. tabuliformis germplasms exhibited a wide resistance spectrum. Some lines were sensitive with the needles fully wilted and the MDA content and the relative conductivity of needles greatly increased, while some lines demonstrated strong resistance with good needle vigor and better physiological conditions. Moreover, the transcriptome analysis revealed 7928 differentially expressed genes (DEGs) between the resistant and sensitive germplasm pools, including 3754 upregulated and 4174 downregulated genes in the resistant lines. These DEGs were specially enriched in the pathways of plant–pathogen interaction (318 genes), phenylpropanoid biosynthesis (108 genes), ubiquitin-mediated proteolysis (47 genes), carotenoid biosynthesis (18 genes), and monoterpenoid biosynthesis (9 genes). Accordingly, P. tabuliformis utilized multiple ways to control the proliferation and activity of B. xylophilus, such as immune response, ubiquitination, thickening plant cell walls, and increasing its terpenoid and antioxidant contents. Our results could thus help in better understanding the resistance process of P. tabuliformis against B. xylophilus and offer some new strategies and gene resources for a molecular breeding program of resistant P. tabuliformis.

1. Introduction

Bursaphelenchus xylophilus is a nematode parasitic in pine wood and transmitted through Monochamus alternatus. It can destroy the conducting tissue of the tree and lead to a decrease in plant transpiration and resin secretion, finally resulting in plant wilting and death [1,2]. Currently, the pine wood nematode (PWN) is mainly controlled through chemical, biological, and physical methods (burning and clearing of infected wood) that demand vast investments but are inefficient [3]. With the development of molecular biotechnology, exploring genes that provide resistance, understanding their resistance mechanism, and breeding resistant germplasms have become effective ways to control PWN.
Several studies have made significant progress in this field. For example, in the resistant line of P. thunbergii infected with B. xylophilus, 864 differentially expressed genes (DEGs) were identified, and these were enriched in the pathways of mitogen-activated protein kinase (MAPK) signaling, linoleic acid metabolism, plant–pathogen interactions, phytohormone signaling, alpha-linolenic acid metabolism, flavonoid biosynthesis, diterpene biosynthesis, and protein processing in the endoplasmic reticulum [4]. In contrast, only 67 DEGs were identified in the susceptible P. thunbergii, and they were mainly enriched in the MAPK signaling pathway and the biosynthesis of various secondary metabolites. In the resistant variety of P. massoniana GD5 inoculated with PWN, 387 DEGs were common during the infestation that were significantly enriched in the pathways of flavonoid biosynthesis, endoplasmic reticulum protein processing, protein digestion and uptake, and linoleic acid metabolism [5]. In PWN-infected P. densiflora, the DEGs were significantly involved in cell wall modification, jasmonic acid signaling, and phenylpropane-associated processes [6]. Evidently, the mechanisms against PWN are specific in different pine species.
P. tabuliformis, another important pine species, is widely used for greening and timber materials. The spreading of B. xylophilus has seriously damaged pine forest development and had adverse effects on the ecological environment [7]. Though various P. tabuliformis germplasms have demonstrated a wide resistance spectrum to B. xylophilu [8], their resistance mechanism remains understudied. This study thus aimed to evaluate the gene behaviors in different P. tabuliformis germplasms that suffer from B. xylophilus and to explore their possible mechanisms of resistance. The results enhanced our understanding of P. tabuliformis’ resistance mechanism to PWN and provided new strategies and gene resources for future breeding programs of PWN-resistant pine lines.

2. Materials and Methods

2.1. Plant Materials and B. xylophilus Inoculation

Three-year-old seedlings of P. tabuliformis were planted in soil-based pots (25 cm × 25 cm) and watered twice a week. The B. xylophilus strain BxFC, obtained from susceptible P. koraiensis plants, was preserved on PDA medium with Botrytis cinerea. The nematode suspension was prepared with sterile water at a concentration of 10,000 worms/mL. When performing the inoculation, a 1–2 cm wound was made vertically on the xylem at 1/3 height of the plant. The nematode suspension (200 μL) was injected into the wound, stuffed with sterile cotton, and wrapped with a sealing film (Figure 1). The plants grew in the greenhouse for 30 d. The stems and leaves, 2 cm up the inoculation zone, were sampled for the transcriptome sequencing and the physiological index tests, respectively.

2.2. Physiological Index Assay

After inoculation for 30 d, the needles of each line were sampled for physiological index tests. Three replicates were conducted. The SPSS 23.0 software was used for significant difference analysis between the different germplasms at p value < 0.05.
Chlorophyll content: 0.1 g needles were cut to 0.5 cm in length and immersed in 10 mL DMSO solution in the dark at room temperature until they exhibited discoloration. The absorbance values of the extraction solution were measured at 663 nm and 645 nm with a spectrophotometer. The total chlorophyll content was calculated by (0.00802 × OD663 + 0.00021 × OD645) × total volume of extract (mL)/fresh weight of sample (g).
Relative electrical leakage (REL) [9]: 0.1 g leaves were cut into 0.5 cm × 0.5 cm pieces, soaked in a tube containing 30 mL distilled water, and shaken at 180 rpm at 28 °C overnight. The electrical conductivity was measured as R1 with an Electrical Conductivity Meter DS-307 (Enfan, Shanghai, China). It was then autoclaved at 121 °C for 20 min, and shaken overnight again. The electrical conductivity was measured as R2. REL was calculated by R1/R2 × 100%.
Malondialdehyde content (MDA) [10]: 0.1 g leaves were ground in 1 mL 10% trichloroacetic acid (TCA) solution. The homogenate was centrifuged at 12,000 rpm for 5 min. The supernatant was mixed with 1 mL 0.6% thiobarbituric acid and placed in boiling water for 15 min. After centrifuge at 12,000 rpm for 5 min, the absorption values of the supernatant were measured at 532 nm, 600 nm and 450 nm wavelengths. MDA content (μmol/g) was calculated by [6.45 × (OD532 − OD600) − 0.56 × OD450] × total volume of extract (mL)/fresh weight of sample (g).
Soluble sugar content: 0.1 g fresh leaves in 2 mL deionized water was boiled for 20 min. Then, 50 μL of the supernatant was mixed with 450 μL distilled water and 2.5 mL anthrone reagent, then boiled again for 10 min. The absorbance value of the solution was measured at a wavelength of 620 nm by using a UV-754N Spectrophotometer. The soluble sugar content (μg/g) was calculated by W1 × V1 × dilution factor/(V2 × W2 × 106). (W1, soluble sugar content from the standard curve; V1, extraction volume; V2, test sample volume; W2, fresh sample weight).

2.3. Transcriptome Analysis

At 30 d after inoculation of the pine lines with the BxFC strain, the total RNA was extracted from the stem segments of five sensitive and five resistant lines (based on the phenotypic and physiological performance) individually using a plant RNA rapid extraction kit (Tiangen, Beijing, China). The samples of the resistant plants and sensitive plants were pooled to form the R and S groups separately and then subjected to transcriptome sequencing. RNA sequencing (Biomarker, Beijing, China) was performed via the Illumina HiSeq platform. The sequencing data were assembled using STAR by comparing clean reads to the full-length transcriptome data. The expression level of the transcripts was evaluated by FPKM. The differentially expressed genes (DEGs) between the two groups were identified with a fold change ≥ 2 and an error detection rate of FDR < 0.01. The DEGs were annotated using the NR, Swissprot, GO, KEGG, COG, KOG, and Pfam databases, and the enrichment results were visualized as bubble and histograms using ClusterProfiler.

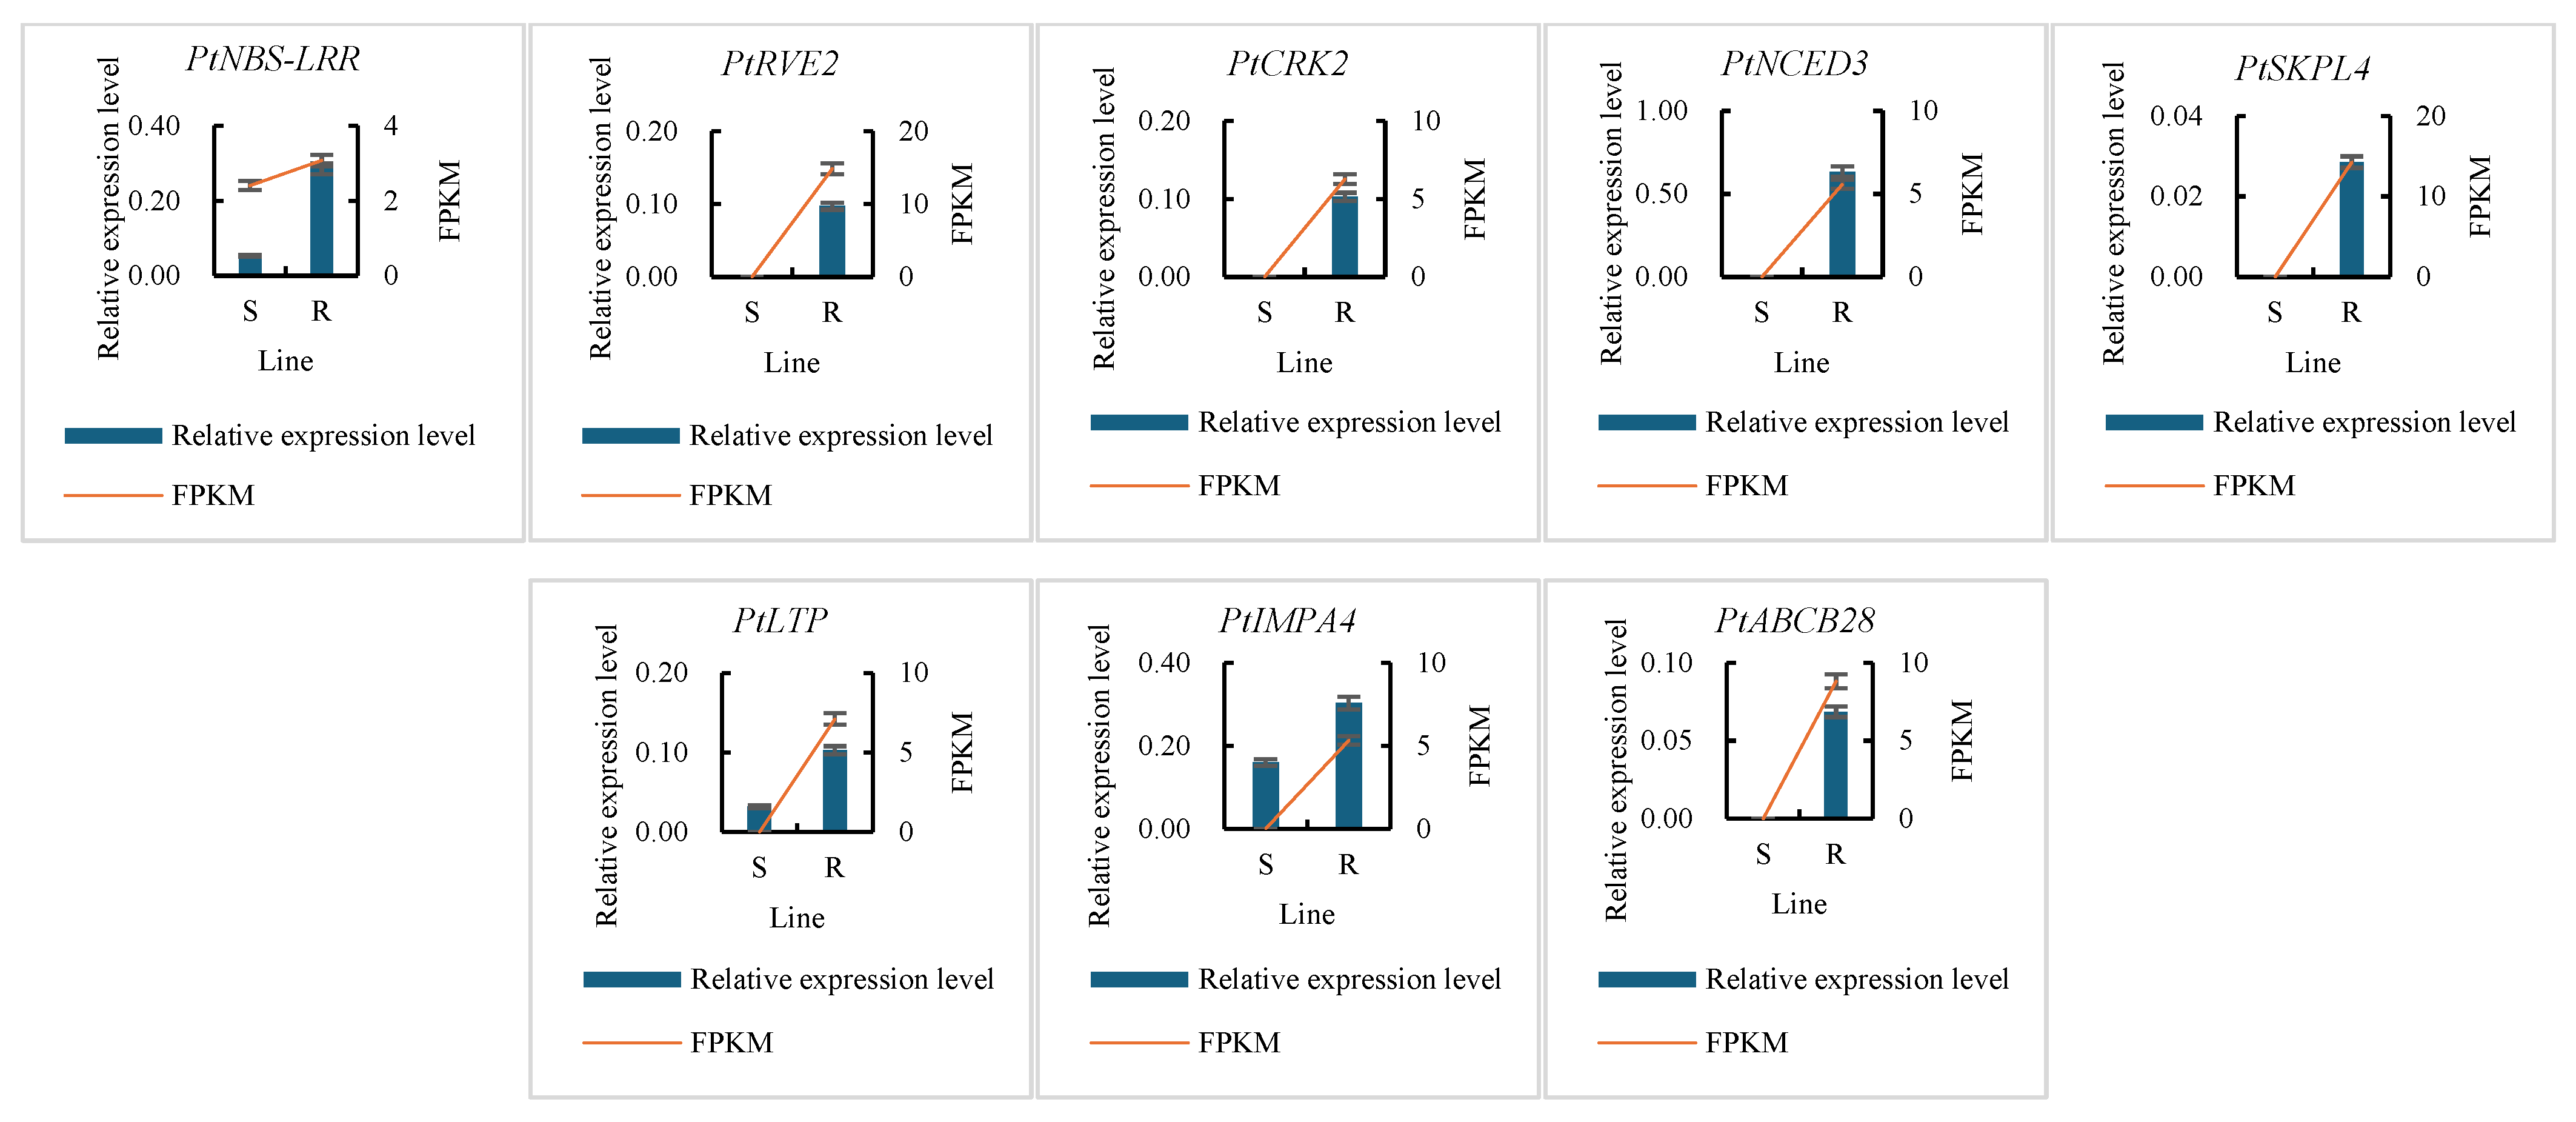
2.4. Gene Expression Assay

The total RNA was extracted from the leaves of the individual pine lines and reverse transcribed into cDNA using TIANScript II cDNA kit KR107 (Tiangen, Beijing, China). The gene-specific primers (Supplement Table S1) were designed. The qRT–PCR was performed using a SYBR Green qPCR kit (TaKaRa, Tokyo, Japan) and an iQ5 Multicolor Detection System (BioRad Laboratories, Hercules, CA, USA). The PCR system contained 10 µL of 2× EasyTaq PCR SuperMix, 7 µL of ddH2O, 2 µL of a pair of primers, and 1 µL of the cDNA sample. The reaction conditions were as follows: denaturation at 95 °C for 3 min, followed by 35 cycles of 95 °C for 30 s, 55 °C for 30 s, and 72 °C for 1 min. The 18S rRNA gene was taken as the reference. The relative expression values are the means of five replicates ± SD.

3. Results and Discussion

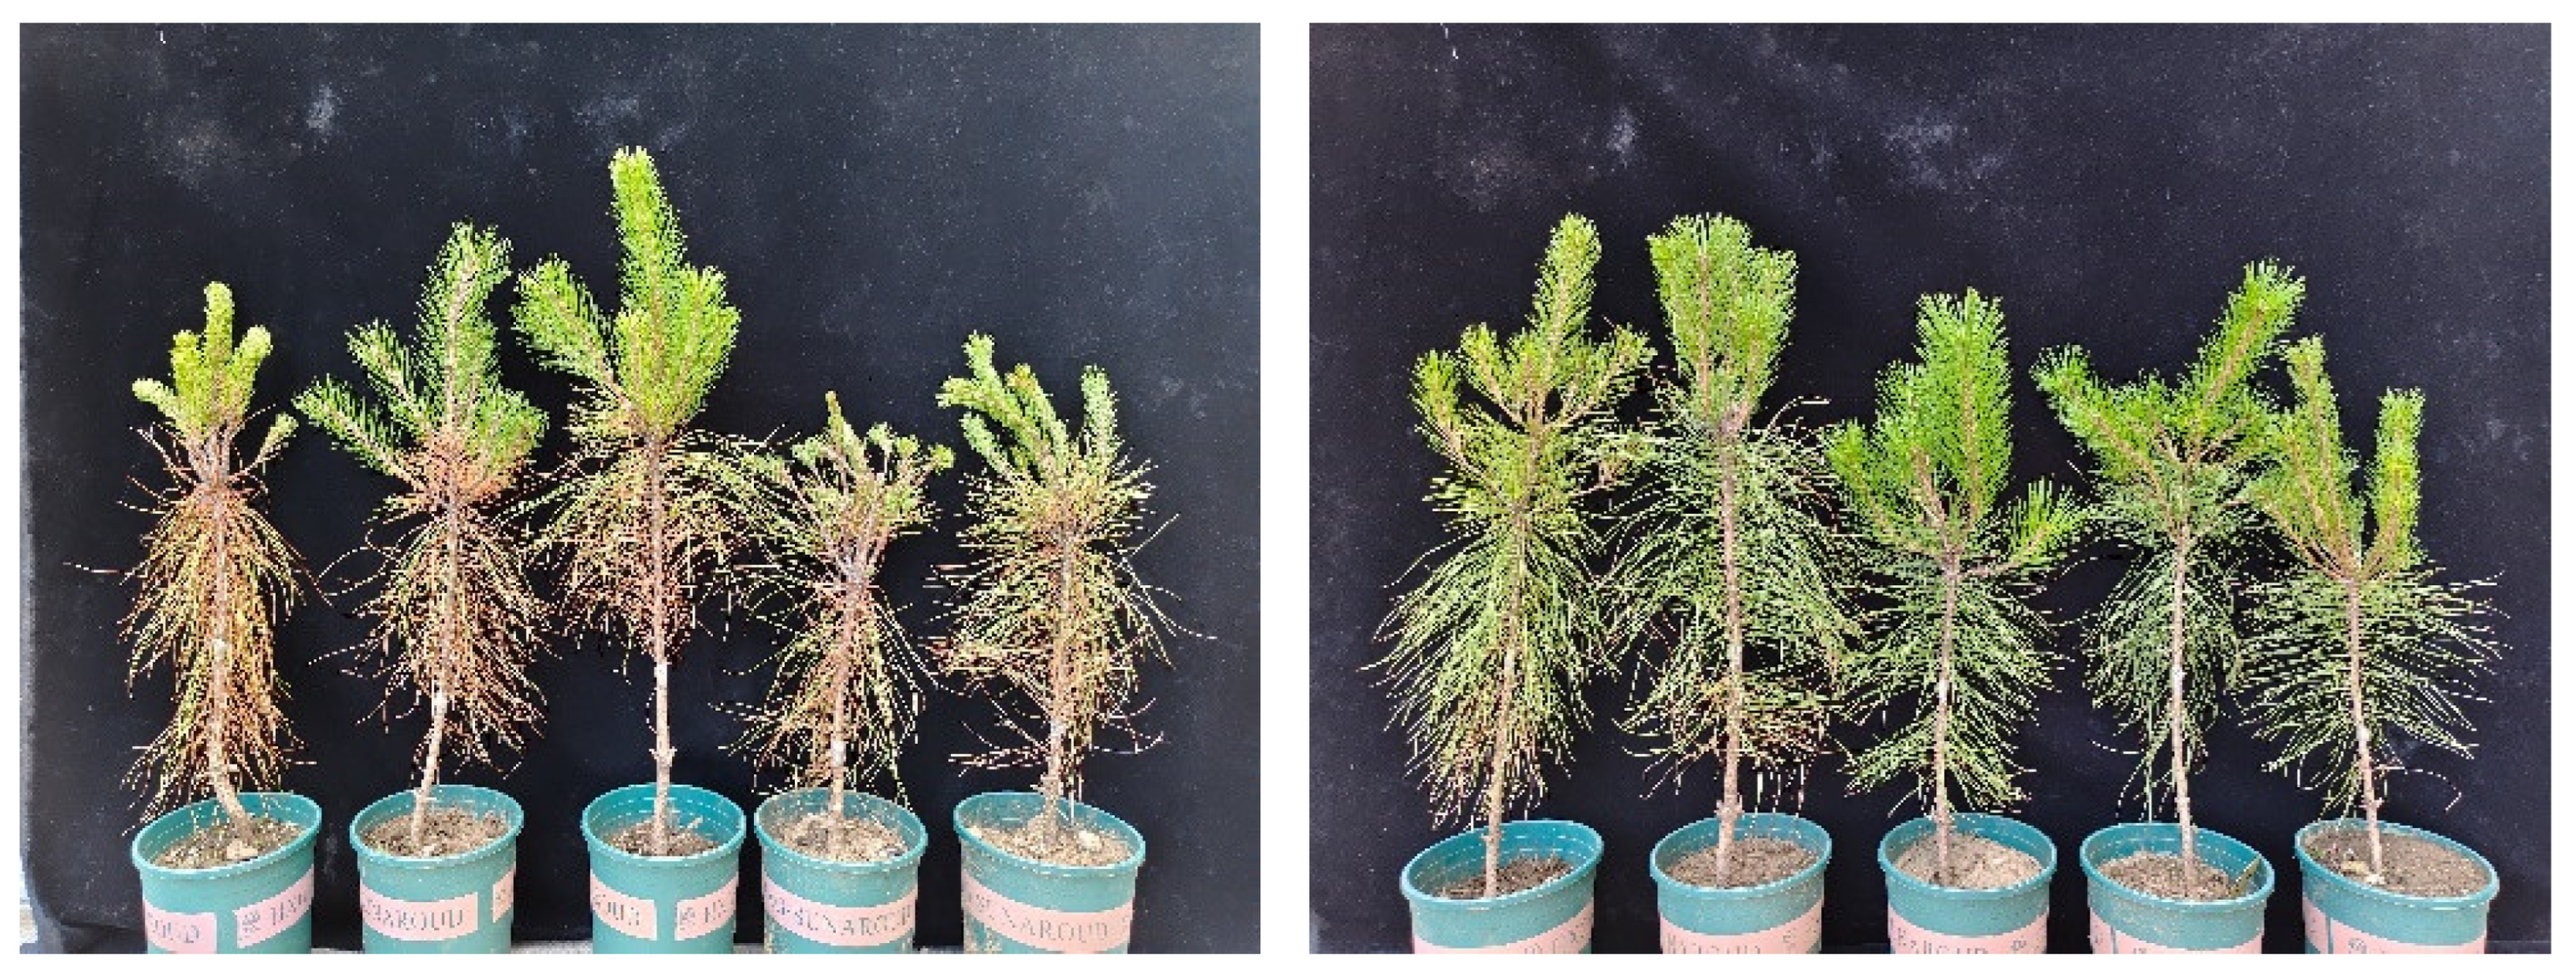
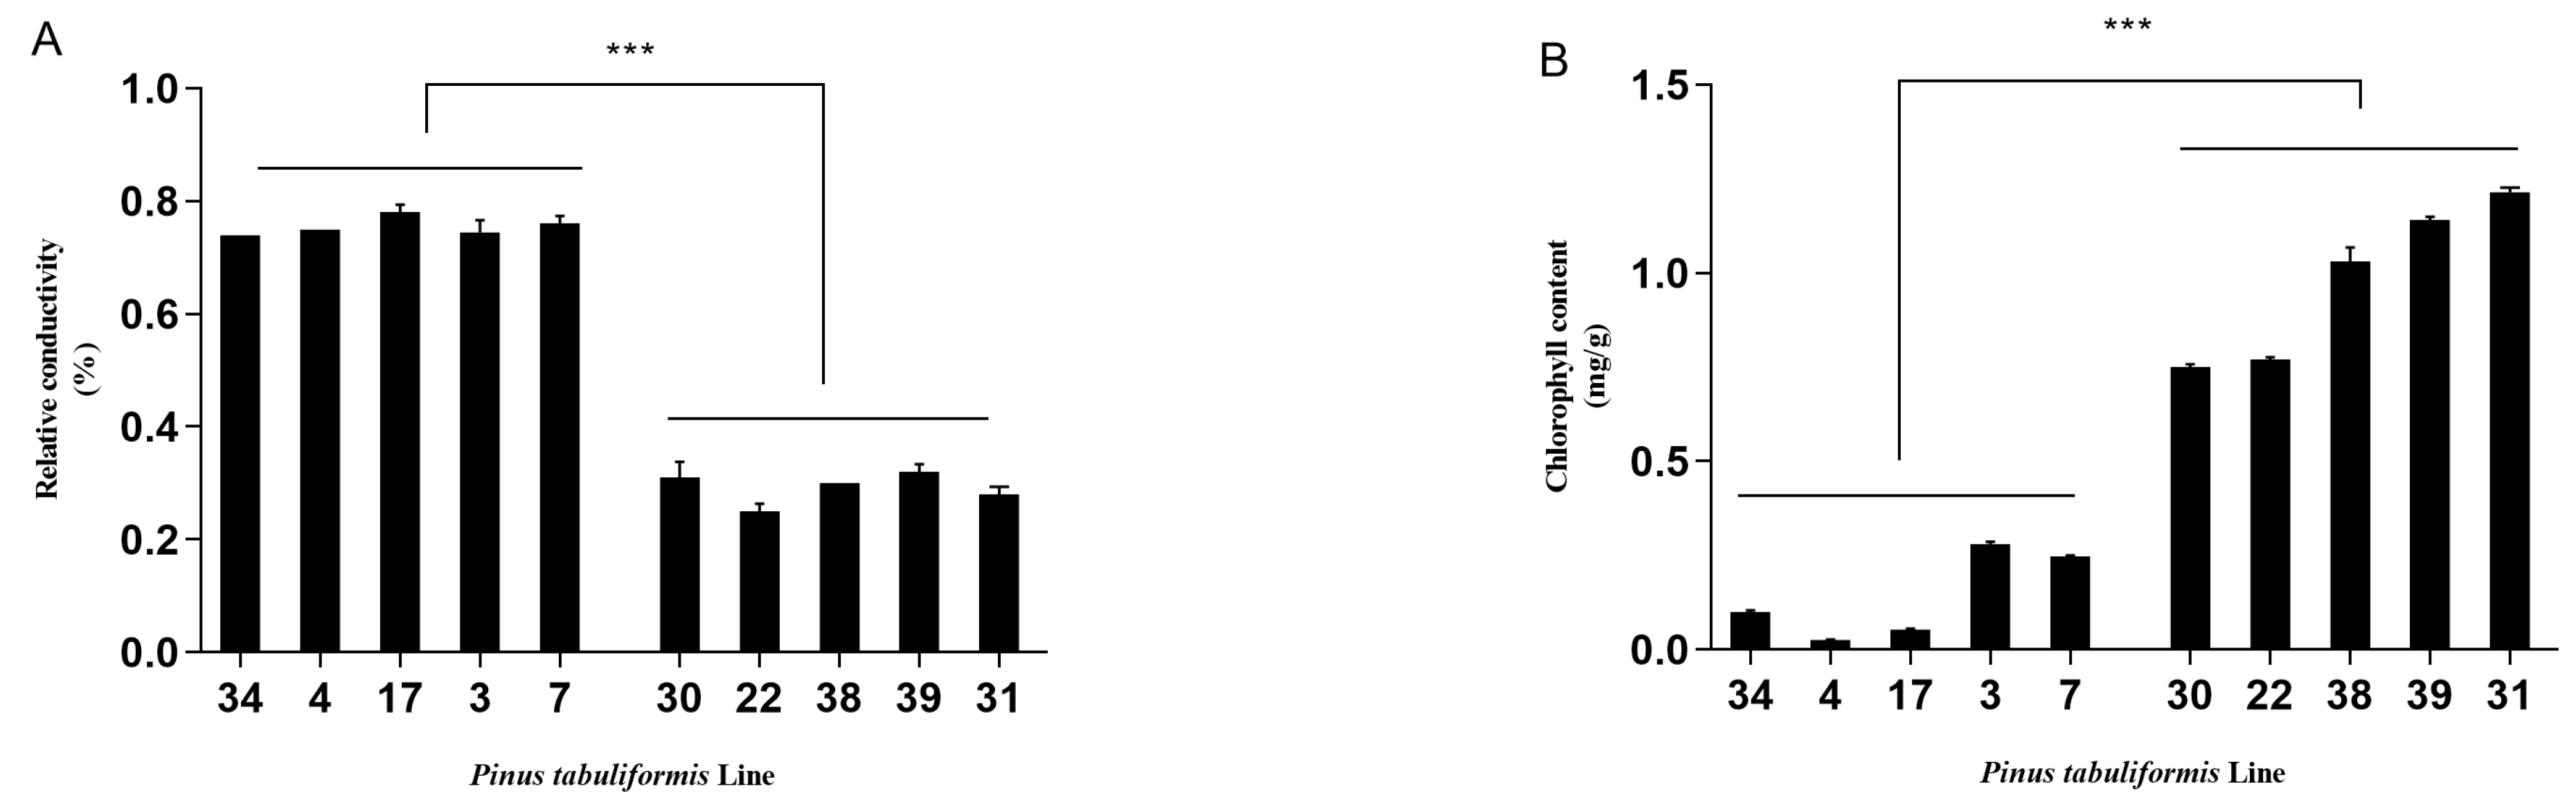
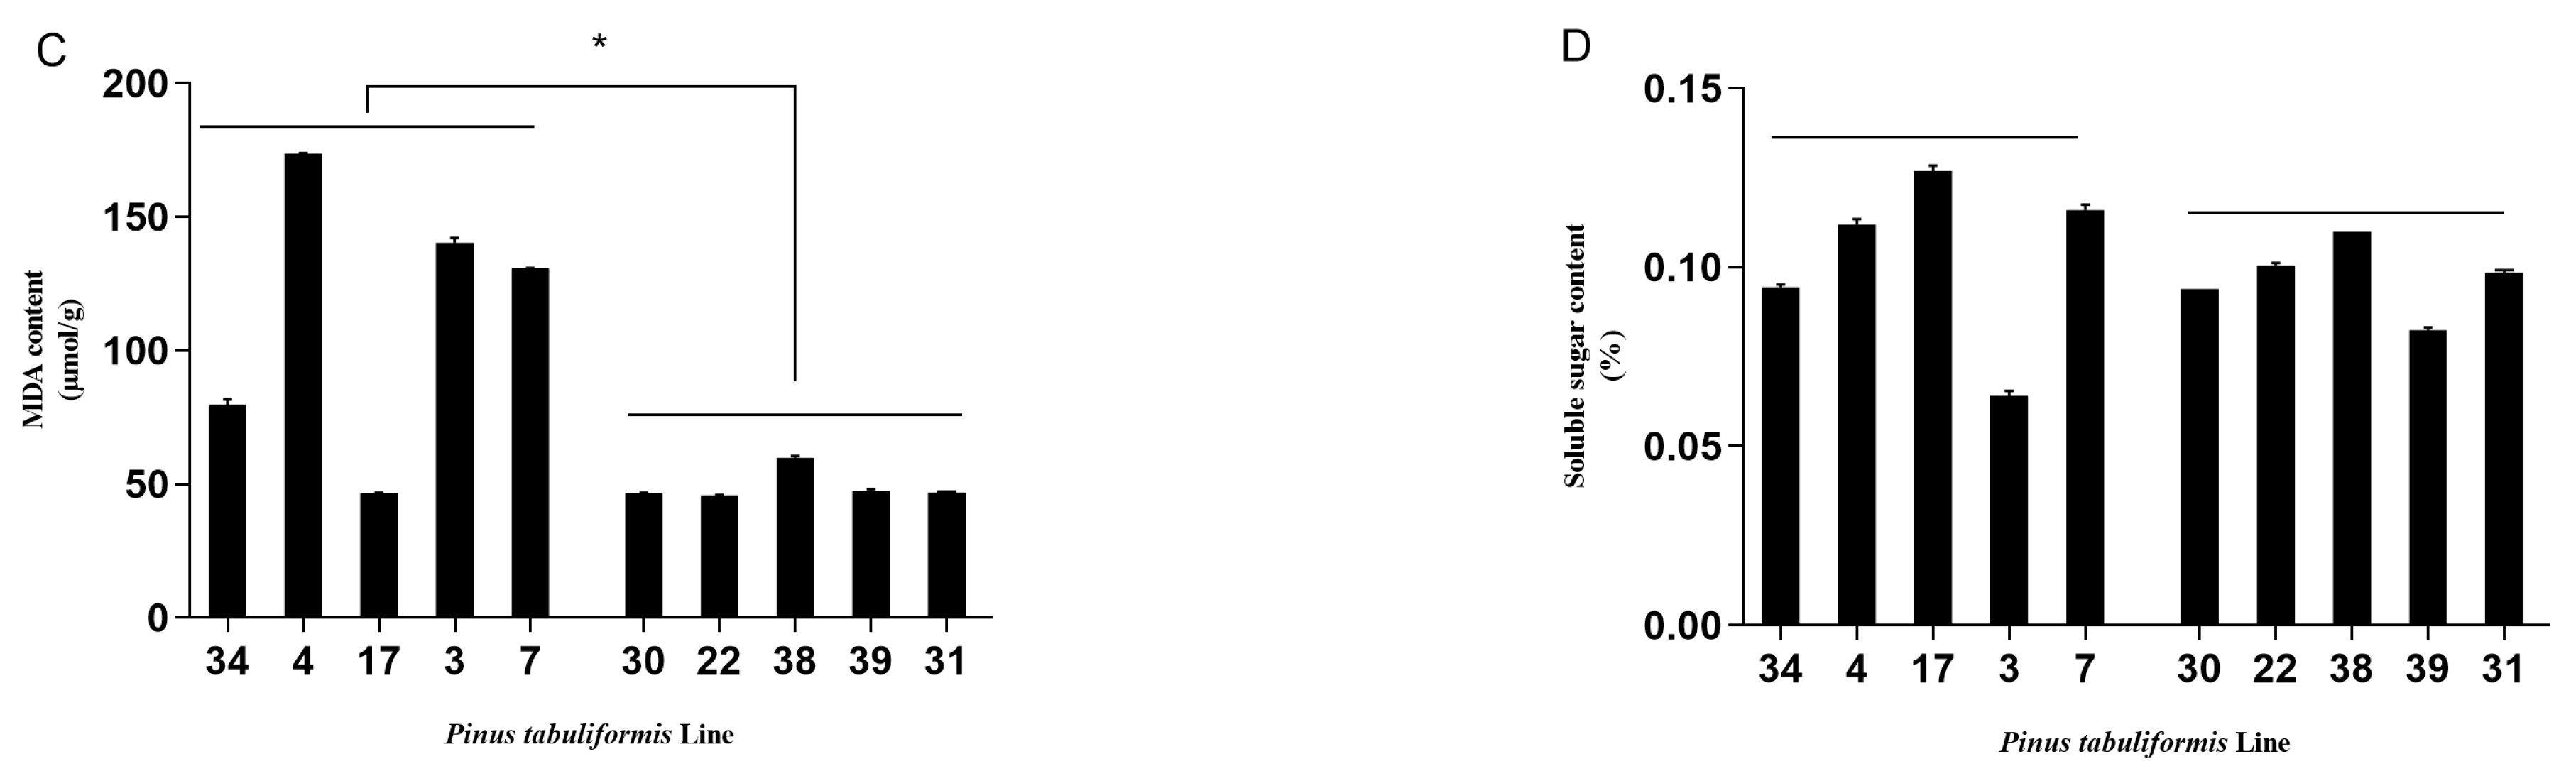
3.1. Evaluation of the Resistance of P. tabuliformis’ Germplasms to B. xylophilus

Fifty pine seedlings were inoculated with the BxFC stain. After 30 d of interaction between the plant and PWN, the pine lines clearly performed differently (Figure 2). Some lines, such as 22, 30, 31, 38, and 39, exhibited good growth conditions, with green and vigorous needles, and were of the resistant type; while some lines, such as 3, 4, 7, 17, and 34, performed badly, with their full needles withered, and were of the susceptible type. Some others displayed intermediately with the base of the needle leaves withered.
Five sensitive and five resistant lines were used for the physiological index tests. The sensitive lines were found to be greatly affected by B. xylophilus, while the resistant lines demonstrated no significant changes (Figure 3). The mean REL value and malondialdehyde content of the sensitive lines were 0.75 μmol/g and 114.80 μmol/g and 1.56 fold and 1.32 fold higher than that of the resistant lines [(sensitive − resistant)/resistant], respectively. The mean total chlorophyll content of the sensitive lines was 0.14 mg/g, which was 0.86 fold lower than that of the resistant lines, and the mean soluble sugar content of the sensitive lines and the resistant lines were 0.103 μg/g and 0.097 μg/g, respectively, which revealed no significant difference. The physiological index data of the lines were consistent with their morphological performance. B. xylophilus infection resulted in a certain fragility of pine plants.
Moreover, the physiological performance indicated significant changes that could reflect the pines’ resistance level to PWN. For example, the chlorophyll content of P. tabuliformis in this study decreased by 0.86-fold in the susceptible lines compared to the resistant lines. Similarly, the chlorophyll a and chlorophyll b content of P. sylvestris at 30 d of B. xylophilus inoculation were reduced by 38.6% and 50.9% compared to the control, respectively [11]. Further, pathogen infection could greatly damage the host cell membrane by increasing membrane lipid peroxidation and altering membrane permeability. A study on P. sylvestris showed that the MDA content in the infected plants with B. xylophilus was 449% higher than the control. Comparably, the REL and MDA content of the susceptible trees in the present study increased by 1.56-fold and 1.32-fold compared to that of the resistant plant (Figure 3). The physiological level could thus well evaluate the resistance process of pine germplasms to PWN.

3.2. Transcriptome Analysis of P. tabuliformis Infected by B. xylophilus

The five sensitive lines were mixed as the R-pool and the five resistant lines were mixed as the S-pool for RNA sequencing. After performing the sequencing quality control, a total of 5.84 Gb and 5.87 Gb clean data were obtained for the R and S samples. The average GC content was 45.12%, and the Q30 value was over 94.04% (Table 1). The reads of each sample were aligned with the reference genome of P. tabuliformis with a map rate over 85.11%. Evidently, the sequence data demonstrated sufficient quality.
Eight genes were randomly selected for further confirmation. The results were found to be quite consistent with the transcriptome data (Figure 4), indicating the reliability of these data and their suitability for use in the subsequent analysis of resistance mechanisms.

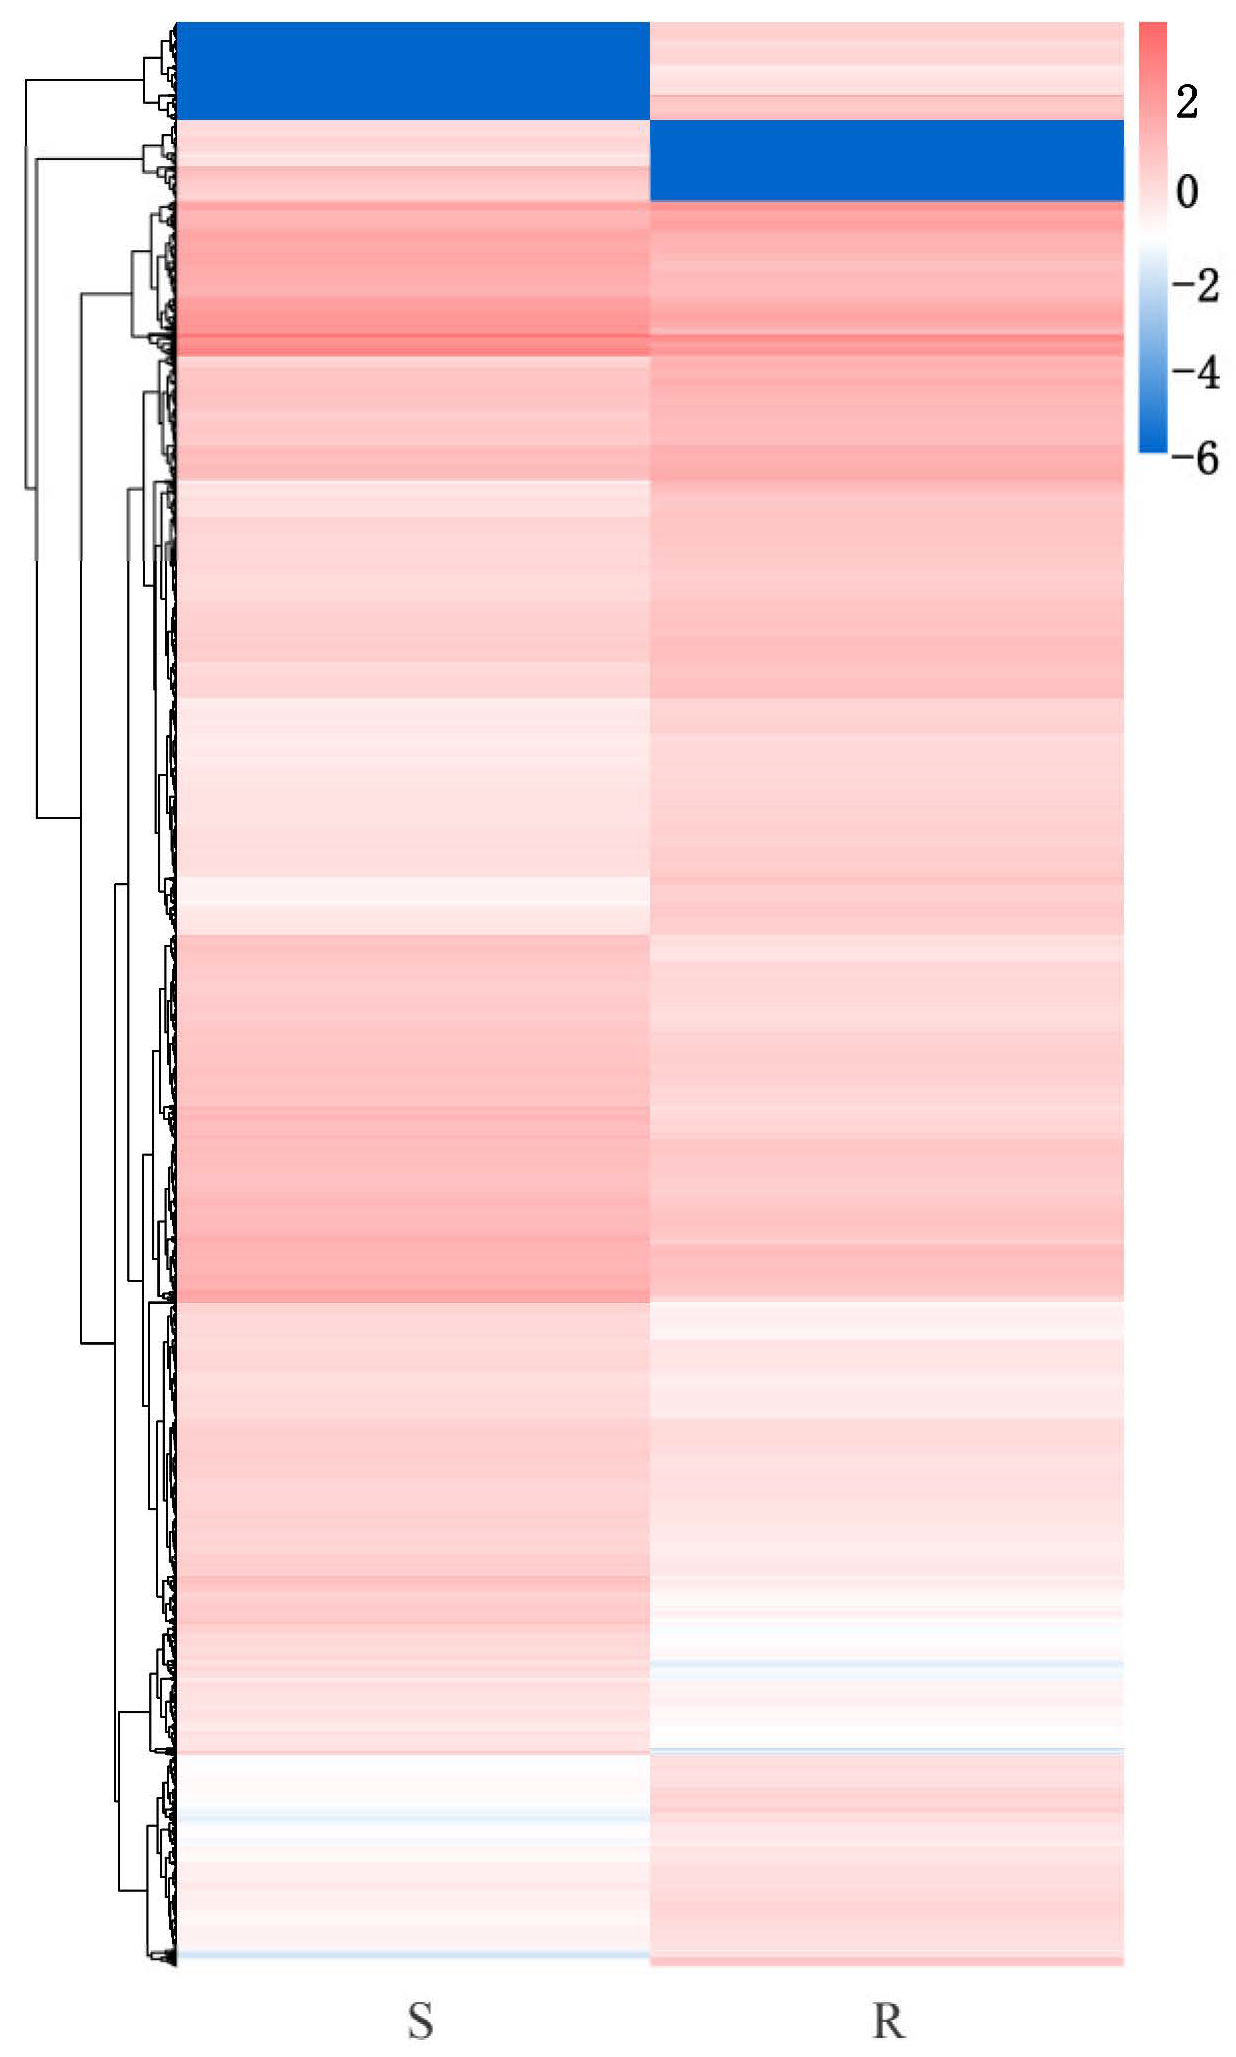
3.3. Identification of Differentially Expressed Genes (DEGs) Between the Resistant and Susceptible P. tabuliformis Lines to B. xylophilus

A total of 7928 DEGs were obtained between the susceptible and resistant lines of P. tabuliformis at 30 d of inoculation, and 3754 genes were upregulated and 4174 genes were downregulated in the R-pool compared to the S-pool (Figure 5). Of these, PtABCB28, PtCRK2, PtNCED3, and PtCYP704C1 expressed in the resistant lines were 788.46, 4198.32, 2593.68, and 1783.93 fold higher than that of the susceptible lines, while PtNAD-ME2, PtPP2B7, and PtERF018 in the susceptible lines were 477.64, 356.32, and 841.62 fold higher than that of the resistant lines, respectively. Obviously, P. tabuliformis responded to the PWN greatly, no matter the gene number or gene expression level.
A total of 5869 DEGs were annotated in the database, including 4780 genes in the GO database (Table 2). The GO annotations categorized the DEGs into three major groups: in biological processes, they were mainly concentrated in the entries of cellular processes (1049 upregulated and 1114 downregulated genes in the R-pool) and metabolic processes (997 up- and 1213 downregulated genes in the R-pool); in cellular components, the DEGs were mainly focused on the cellular structural components (1190 upregulated and 1242 downregulated genes in the R-pool); in molecular functions, the DEGs were mainly concentrated in the entries of binding (1210 upregulated and 1244 downregulated genes in the R-pool) and catalytic activity (1137 upregulated and 1364 downregulated genes in the R-pool) (Figure 6).
A total of 4095 DEGs were annotated in KEGG, which were mainly enriched in the pathways of plant–pathogen interaction, phenylpropanoid biosynthesis, ubiquitin mediated proteolysis, carotenoid biosynthesis and monoterpenoid biosynthesis (Figure 7). Therefore, P. tabuliformis resisted the PWN via multiple ways.

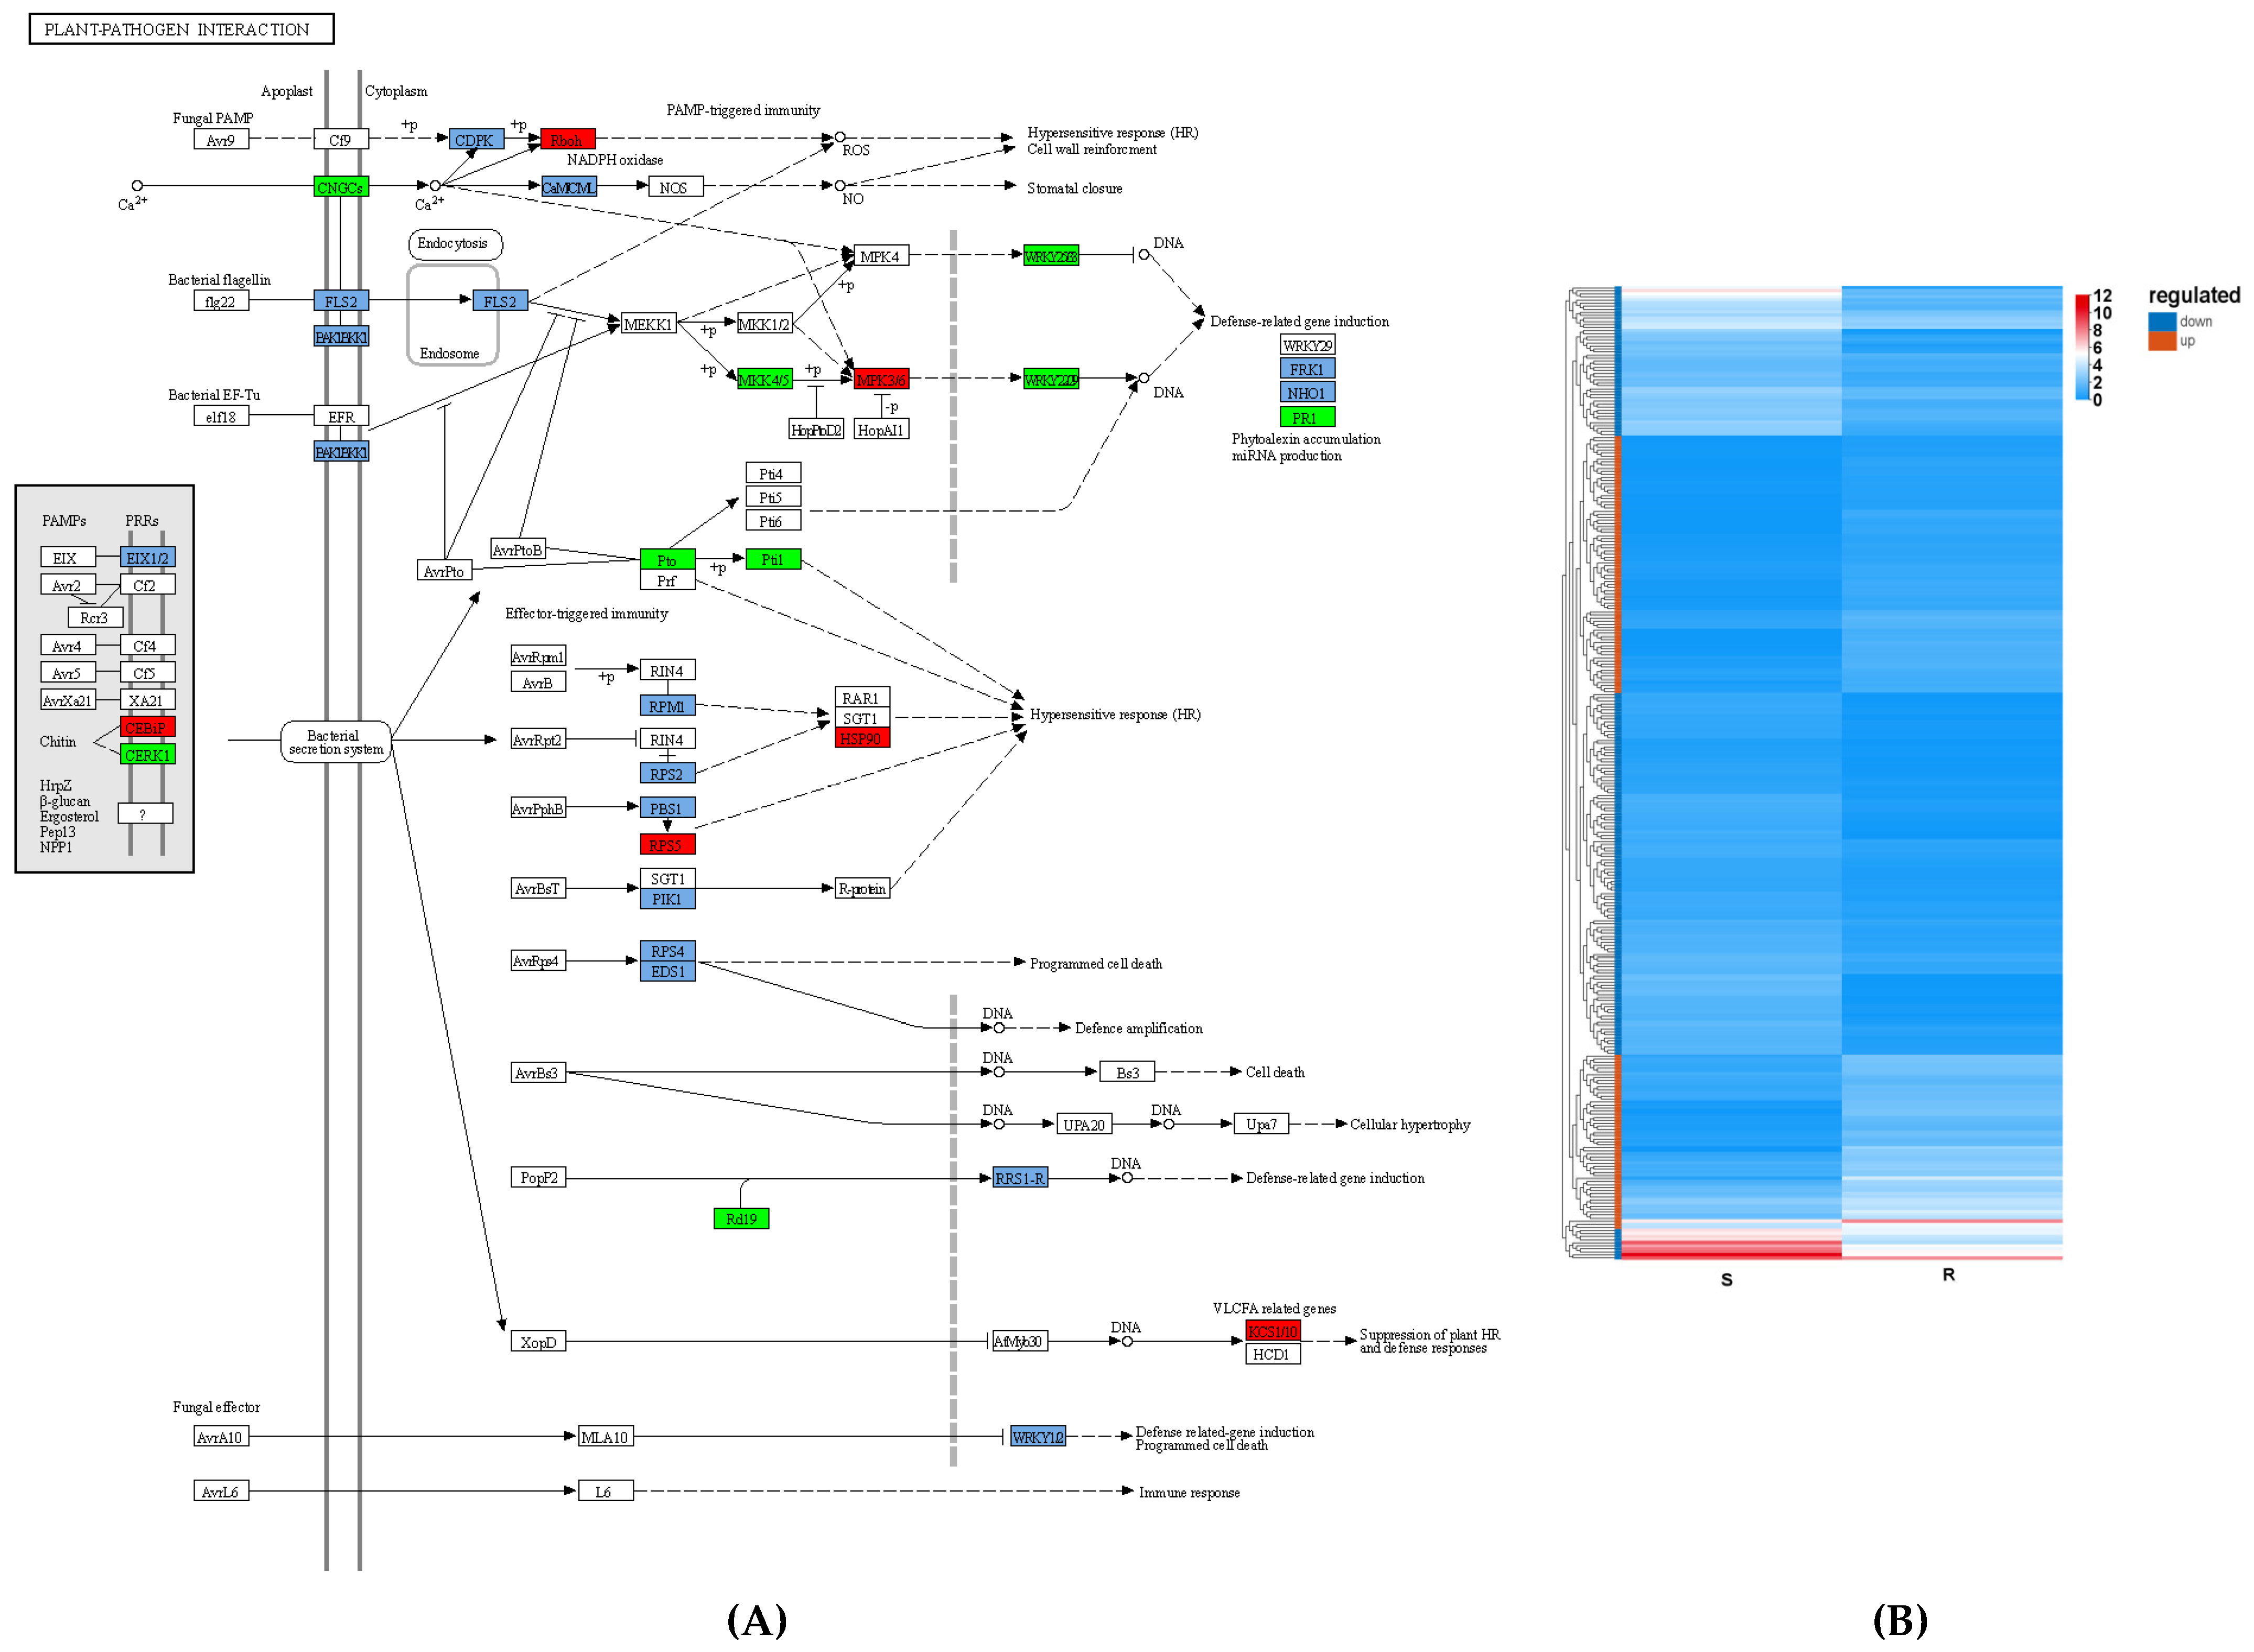
3.4. Immune System in PWN Resistance

When a pathogen infects a plant, the plant cell surface receptors recognize and receive the pathogen signals and induce the plant’s immune system. Plant cells have two major types of immune receptors, pattern recognition receptors (PRRs) located on the surface of plant cells and nucleotide binding leucine-rich repeat receptors (NLRs). PRRs can recognize conserved pathogen-associated molecular patterns (PAMPs) and activate pattern-triggered immunity (PTI), thus limiting pathogenicity. Pathogens escape or suppress PTI by secreting effector molecules, which leads to effector-triggered susceptibility (ETS). NLRs can sense effectors and activate effector-triggered immunity (ETI) [12].
In the current study, a total of 318 DEGs were involved in these plant–pathogen interactions; 141 genes were upregulated and 177 genes were downregulated (Figure 8). Among them, 171 PTI-related genes that resisted PWN were identified (67 upregulated and 104 downregulated in the R-pool). Of them, PtCDPK17, encoding a calcium-dependent protein kinase, was expressed in the R-pool 2.35 fold greater than in the S-pool. PtRBOHD, encoding an NADPH oxidase, was expressed in the R-pool 3.82 fold greater than in the S-pool. Potentially, the receptor protein Cf9 received a signal from PWN and activated PtCDPK17 expression, which, in turn, phosphorylated RBOHD and strengthened the plant’s resistance to PWN invasion. Similar cases were also reported in P. massoniana. PmRLKs32, located in the plasma membrane of P. massoniana, can bind to extracellular effectors to activate immunity, stimulate the synthesis of related hormones, and participate in signal transduction [13]. The overexpression of PmRLKs32 in P. massoniana seedlings stimulated the expression of the downstream genes of the PTI resistance pathway—MPK9, MPK, MMK1, and SERK1—and enhanced plant resistance [14].
A total of 147 ETI-related genes that resisted PWN were identified in this study (74 upregulated and 73 downregulated in the R-pool). Of them, PtRPS2, encoding an NLR immune receptor, was expressed in the R-pool at 150.63 fold greater than that in the S-pool. The encoded protein could interact with the RIN4 protein and recognize the effector protein AvrRpt2, which triggered a series of signaling processes and initiated an immune reaction [15,16]. PtRPS2 also induced the expression of the heat shock protein gene PtHSP83A in the R-pool 4.92 fold greater than in the S-pool, and this could reduce the nematode’s cell destruction via signal transduction regulation. PAD4 in the ETI system could interact with the lipase-like protein EDS1 and form a hub complex in the plant immune signaling network that promotes programed cell death [17,18]. The expression of the PtPAD4 gene in the R-pool was 4.87 fold greater than that in the S-pool, which possibly limited the nutrient absorption of nematodes from plant cells and inhibited the spread of PWN.

3.5. Influence of Terpenoids on the Resistance of B. xylophilus

A total of nine monoterpenoid biosynthesis-related genes were identified in the S_vs_R DEGs (six upregulated and three downregulated in the R-pool), including the genes encoding neomenthol dehydrogenase (two upregulated) and (E)-8-carboxy linalool synthase (four upregulated and three downregulated) (Figure 9). Of these, PtCYP76T24, encoding a cytochrome P450 enzyme for the synthesis of 8-oxo-linalool, was expressed 7.45 fold greater in the R-pool than that in the S-pool. PtSDR2b, encoding a neomenthol dehydrogenase for neomenthol synthesis, was expressed 3.62 fold greater in the R-pool than that in the S-pool. Both participated in the biosynthesis of terpenoids such as linalool and menthol and impacted the cell membrane activity of PWN.
Terpenoids are the main components of pine resin, in which α-pinene and β-pinene inhibit the activity of the WPN. When subjected to a treatment of α-pinene, β-pinene, and their mixed solutions from the pine resin of P. massoniana, the survival rate of B. xylophilus was found to be significantly reduced, and the inhibitory effect of the mixed solution was significantly higher than that of each of these compounds alone [19]. The terpene synthase genes PmTPS4 and PmTPS21, which were significantly upregulated in the resistant germplasms of P. massoniana after PWN inoculation, promoted the accumulation of terpenes (α-pinene, β-pinene, β-myrcene, D-limonene, and longifolene) in the pine resins, and enhanced the plant’s resistance to PWN [20]. Accordingly, the nine monoterpene biosynthesis-related DEGs identified here might be significant to inhibit the reproduction of B. xylophilus in P. tabuliformis.

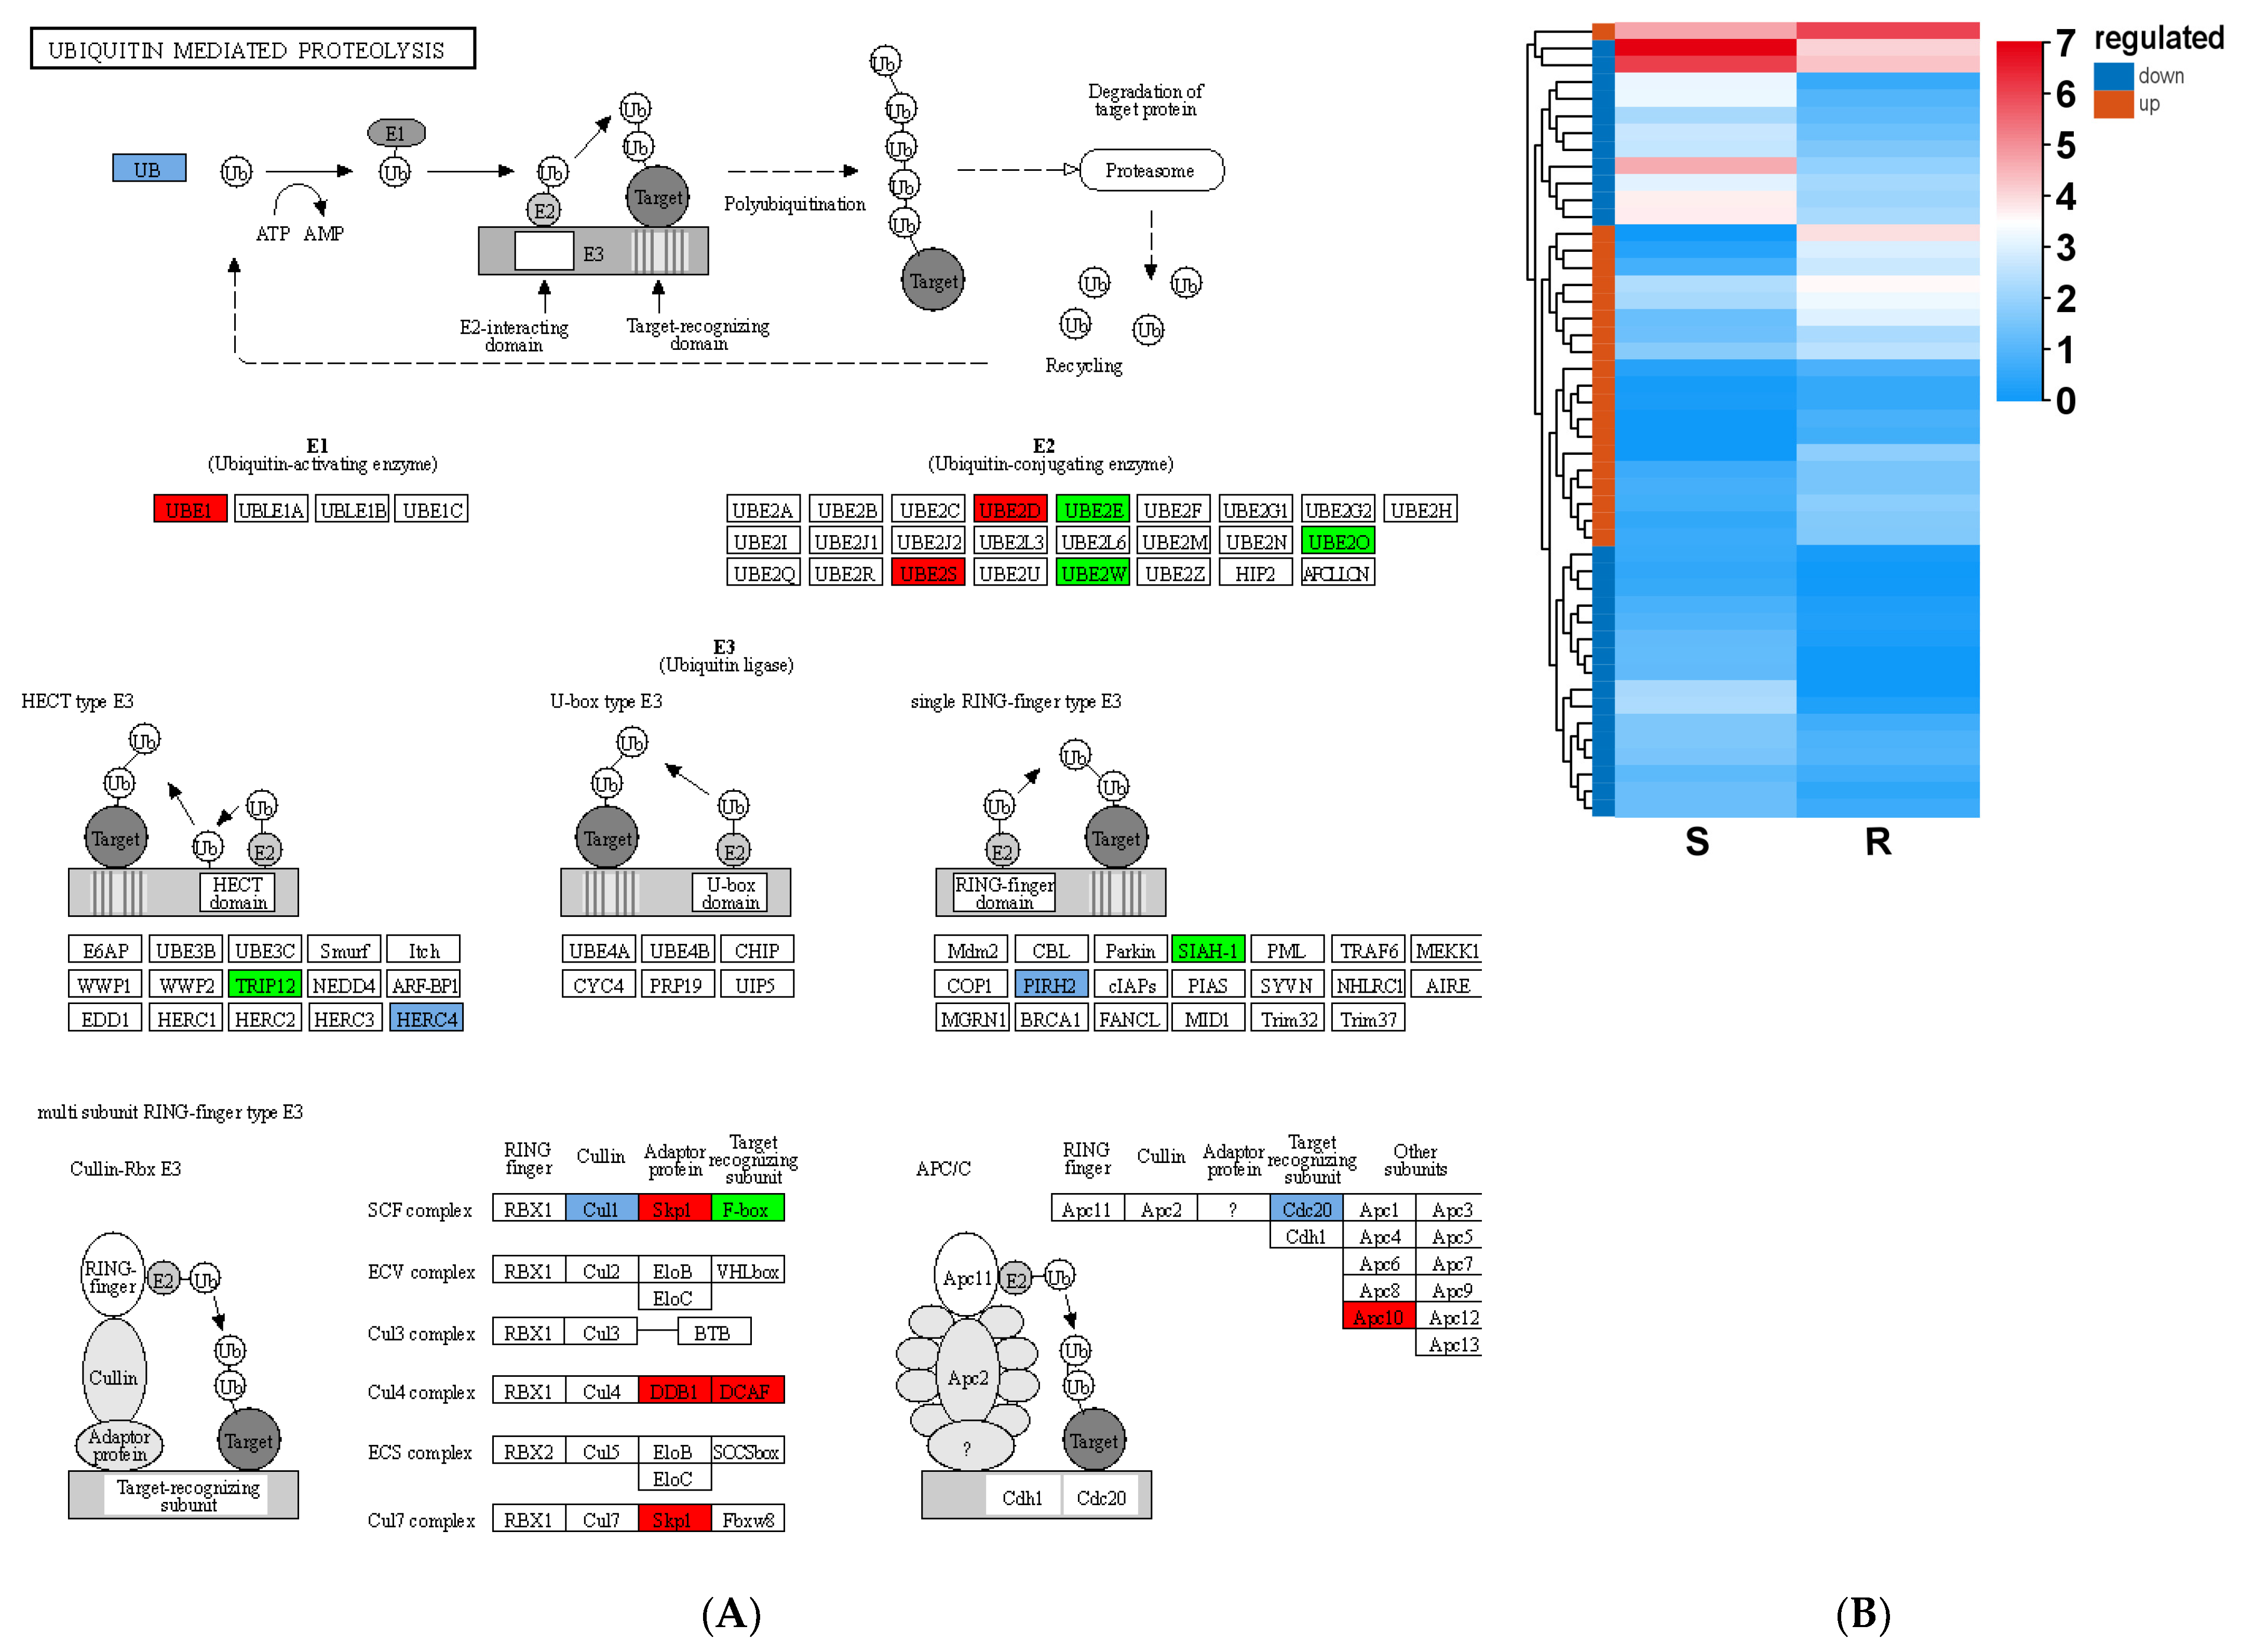
3.6. Resistance to B. xylophilus Stress Through Ubiquitination in Pine Plants

Ubiquitination is widely involved in the regulation of plant growth, development, and stress resistance by degrading specific target proteins [21]. In this study, a total of 47 genes related to ubiquitin-mediated proteolysis were identified in the S_vs_R DEGs, including 20 upregulated and 27 downregulated genes in the R-pool (Figure 10). Of these, PtUBA2, encoding ubiquitin-activating enzyme, was expressed 498.74 fold greater in the R-pool than that in the S-pool. PtSKPL4, encoding a ubiquitin ligase, could bind to cullin and F-box proteins and transfer ubiquitin to the target protein. Its expression level was significantly increased in the R-pool: 639.88 fold greater than that in the S-pool. Obviously, ubiquitination is heavily involved in the resistance to B. xylophilus. Several other cases also revealed its contribution and application in pathogen resistance. For example, the expression of the ubiquitin-activating enzyme genes—NtUBA1 and NtUBA2—was upregulated in Nicotiana tabacum when infected by the Tobacco mosaic virus and Tomato mosaic virus [22]. The heterologous expression of OgUBC1, encoding a ubiquitin-conjugating enzyme, in Arabidopsis thaliana promoted the accumulation of anthocyanins and induced the expression of pathogenesis-related genes [23]. In soybeans, the expression levels of several ubiquitin system-related genes—Glyma.05G048800, Glyma.17G098000, and Glyma.01G131800—were increased by 10.00, 6.71, and 4.67fold, respectively, when suffering from soybean cyst nematode (SCN-117) [24]. Also, the pathogenic factor could be recognized as a target protein of ubiquitination in the host cells and be degraded, such as βC1 in the tomato yellow leaf curl China virus, which was ubiquitinated by the tobacco ubiquitin ligase NtRFP1, consequently reducing the incidence of complications [21].
A report showed that F-box protein COI1 and the jasmonic acid signaling inhibitor (JAZ) protein could form a receptor complex and lead to the ubiquitination and degradation of JAZ [25]. TIFY is a subfamily protein of JAZ, and three related genes—PtTIFY9, PtTIFY10B, and PtTIFY3B—were significantly downregulated in the R-pool after PWN invasion, at 6.04, 8.39, and 2.47 fold lower than that in the S-pool, respectively. The enhanced ubiquitination and lowered JAZ levels in the R plants thus potentially increased the JA level and JA signaling, which improved the immune response of pine trees to B. xylophilus [21]. Similarly, the expression of BFP1, encoding an F-box protein 1, was induced by Botrytis cinereal, and it ubiquitinated and degraded its target jasmonate oxidase, which then increased JA levels significantly [26]. All these reports revealed that ubiquitination-triggered JAZ degradation might be an important way to resist biotic stress. Deep exploration of the ubiquitination pathway will provide us with new strategies in breeding programs.

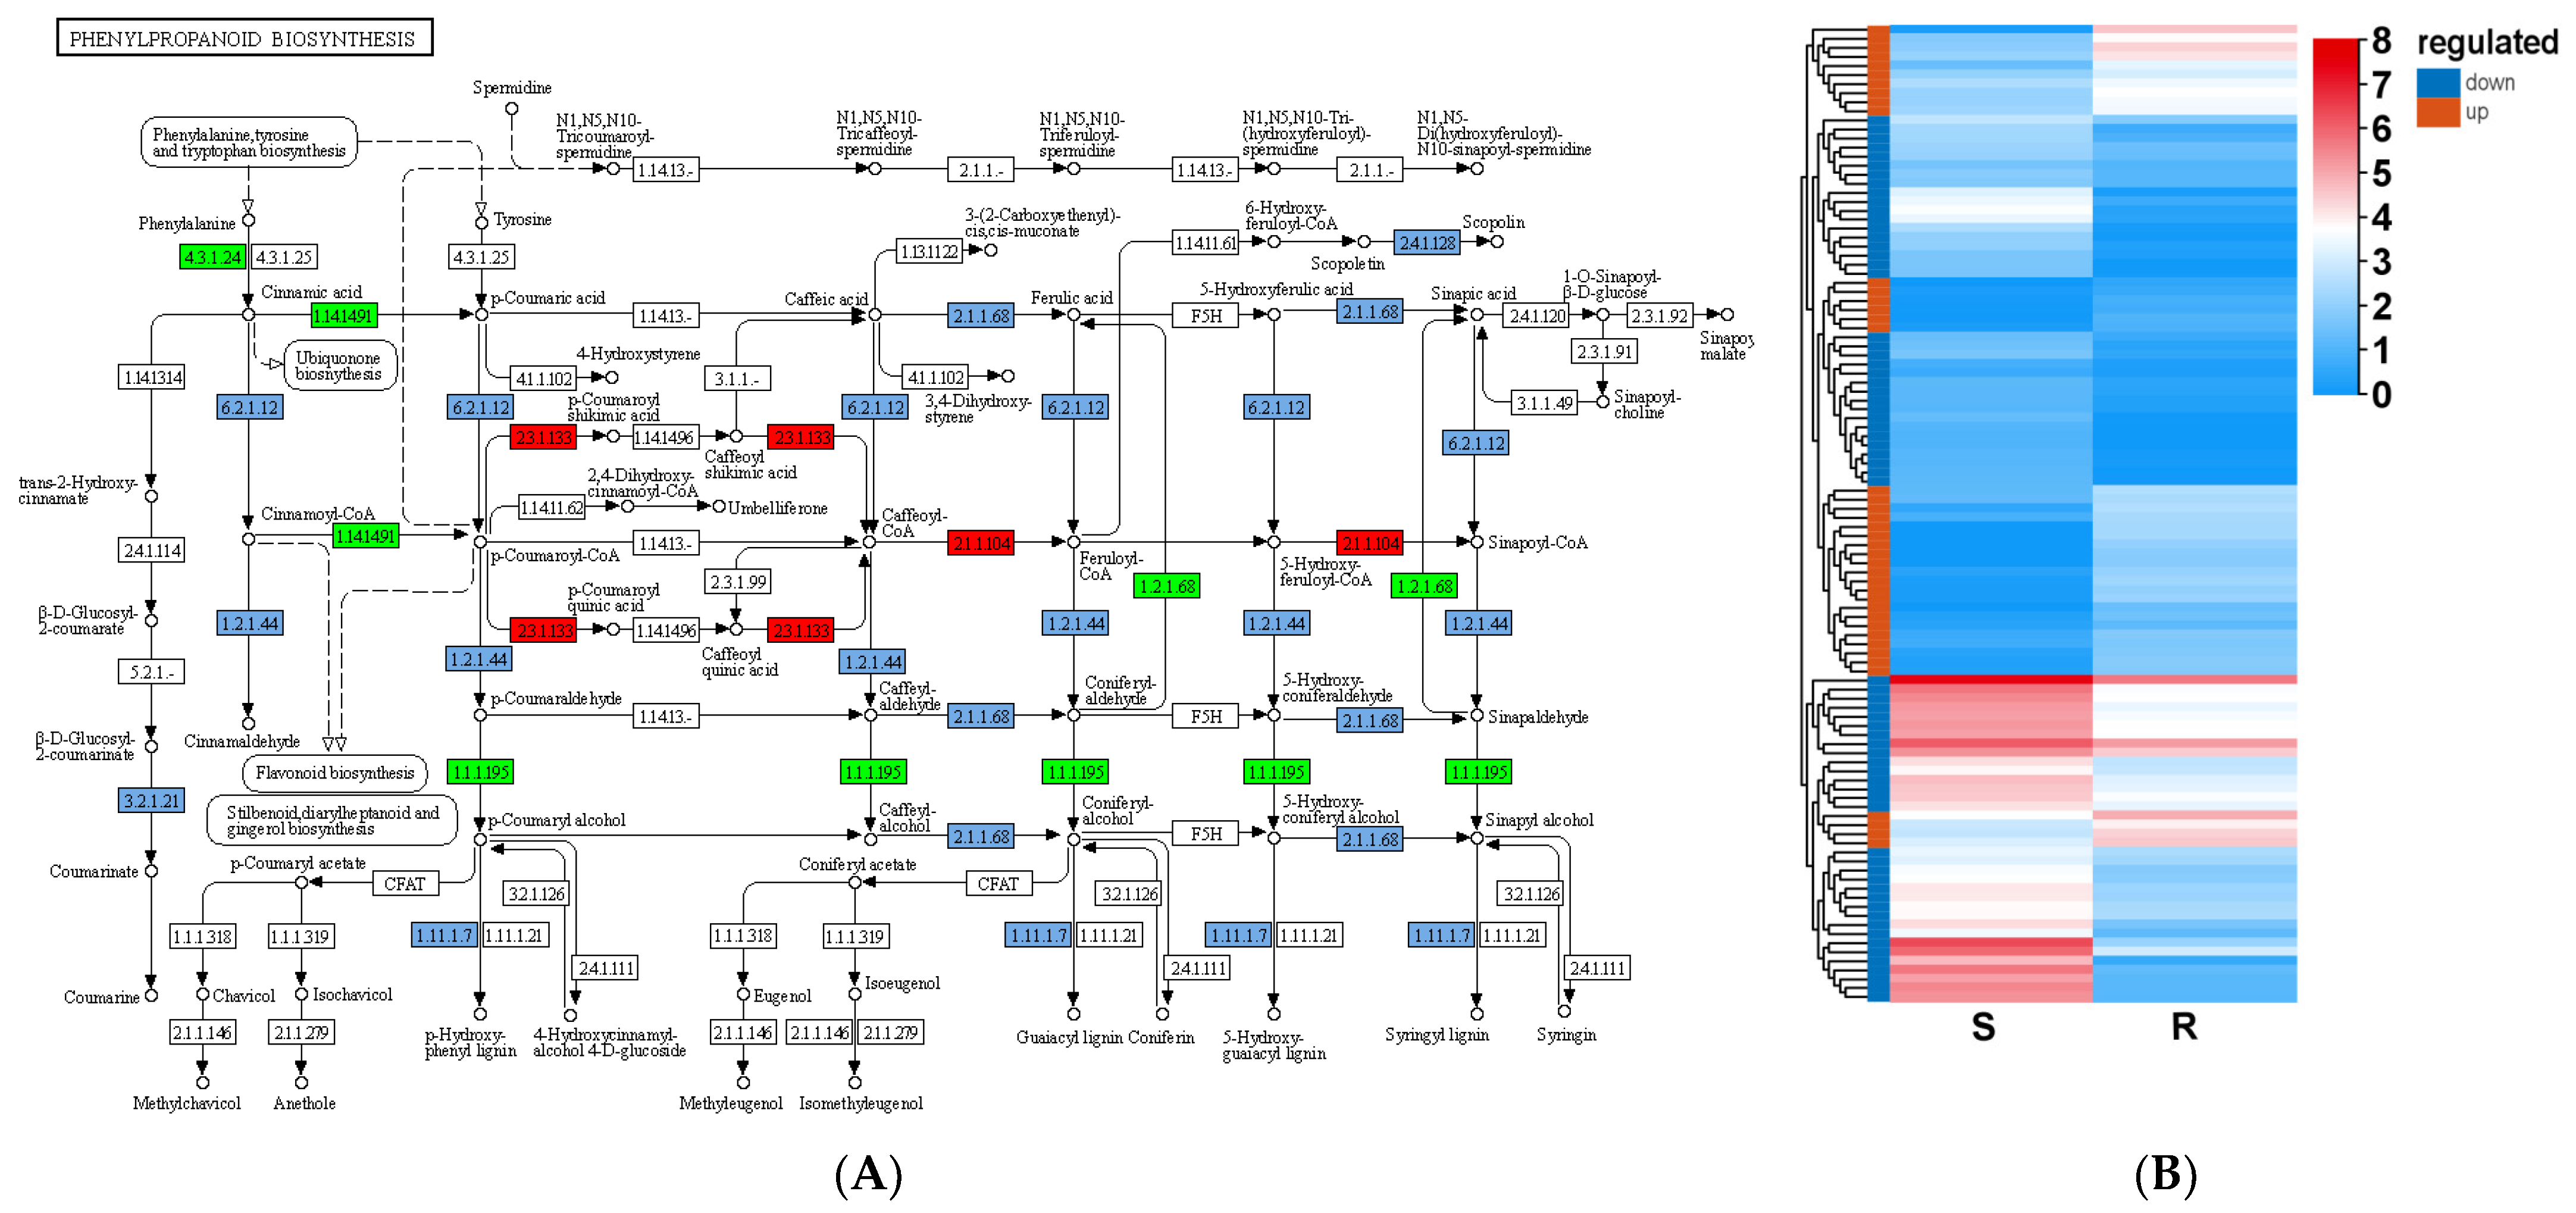
3.7. Elevating the Lignin Content Is an Effective Way to Defend Stress Conditions in Woody Plants

Lignin is one of the important components in the plant cell wall; its structure and content affect a plant’s mechanical strength and have downstream effects on plants against stress conditions [27,28,29]. A total of 108 genes related to phenylpropanoid biosynthesis were identified in the S_vs_R DEGs; 41 genes were upregulated and 67 genes were downregulated (Figure 11). Accordingly, they affected the secondary metabolite amounts, such as guaiacyl lignin (G-lignin), in pine trees. Several enzymatic reactions occur during the synthesis of G-lignin, including caffeoyl CoA-O-methyltransferase (CCOAOMT), cinnamoyl CoA reductase (CCR), cinnamyl alcohol dehydrogenase (CAD), and peroxidase (PER). The related genes—PtCCOAOMT, PtCCR1, PtPER25, PtPER4, and PtPER42—were identified in the S_vs_R DEGs dataset and were expressed at 3.82, 2.19, 521.02, 155.87, and 20.26 fold higher, respectively, in the R-pool than in the S-pool after PWN infection. The enriched lignin content in the resistant lines could enhance plant resistance via cell wall thickening. A report showed that the expression of CCR2, encoding the cinnamoyl coenzyme A reductase related to lignin synthesis, was upregulated in the resistant line of P. thunbergii after inoculation with B. xylophilus, and the lignin content was consistently higher than that of the susceptible plants [30]. Moreover, the damage in the cambium and resin canal of the resistant lines by B. xylophilus expanded more slowly than that in the susceptible lines, indicating that the high lignin content in R plants effectively limited B. xylophilus migration and reproduction [31,32]. Thus, lignin synthesis is noteworthy in pine breeding against PWN.

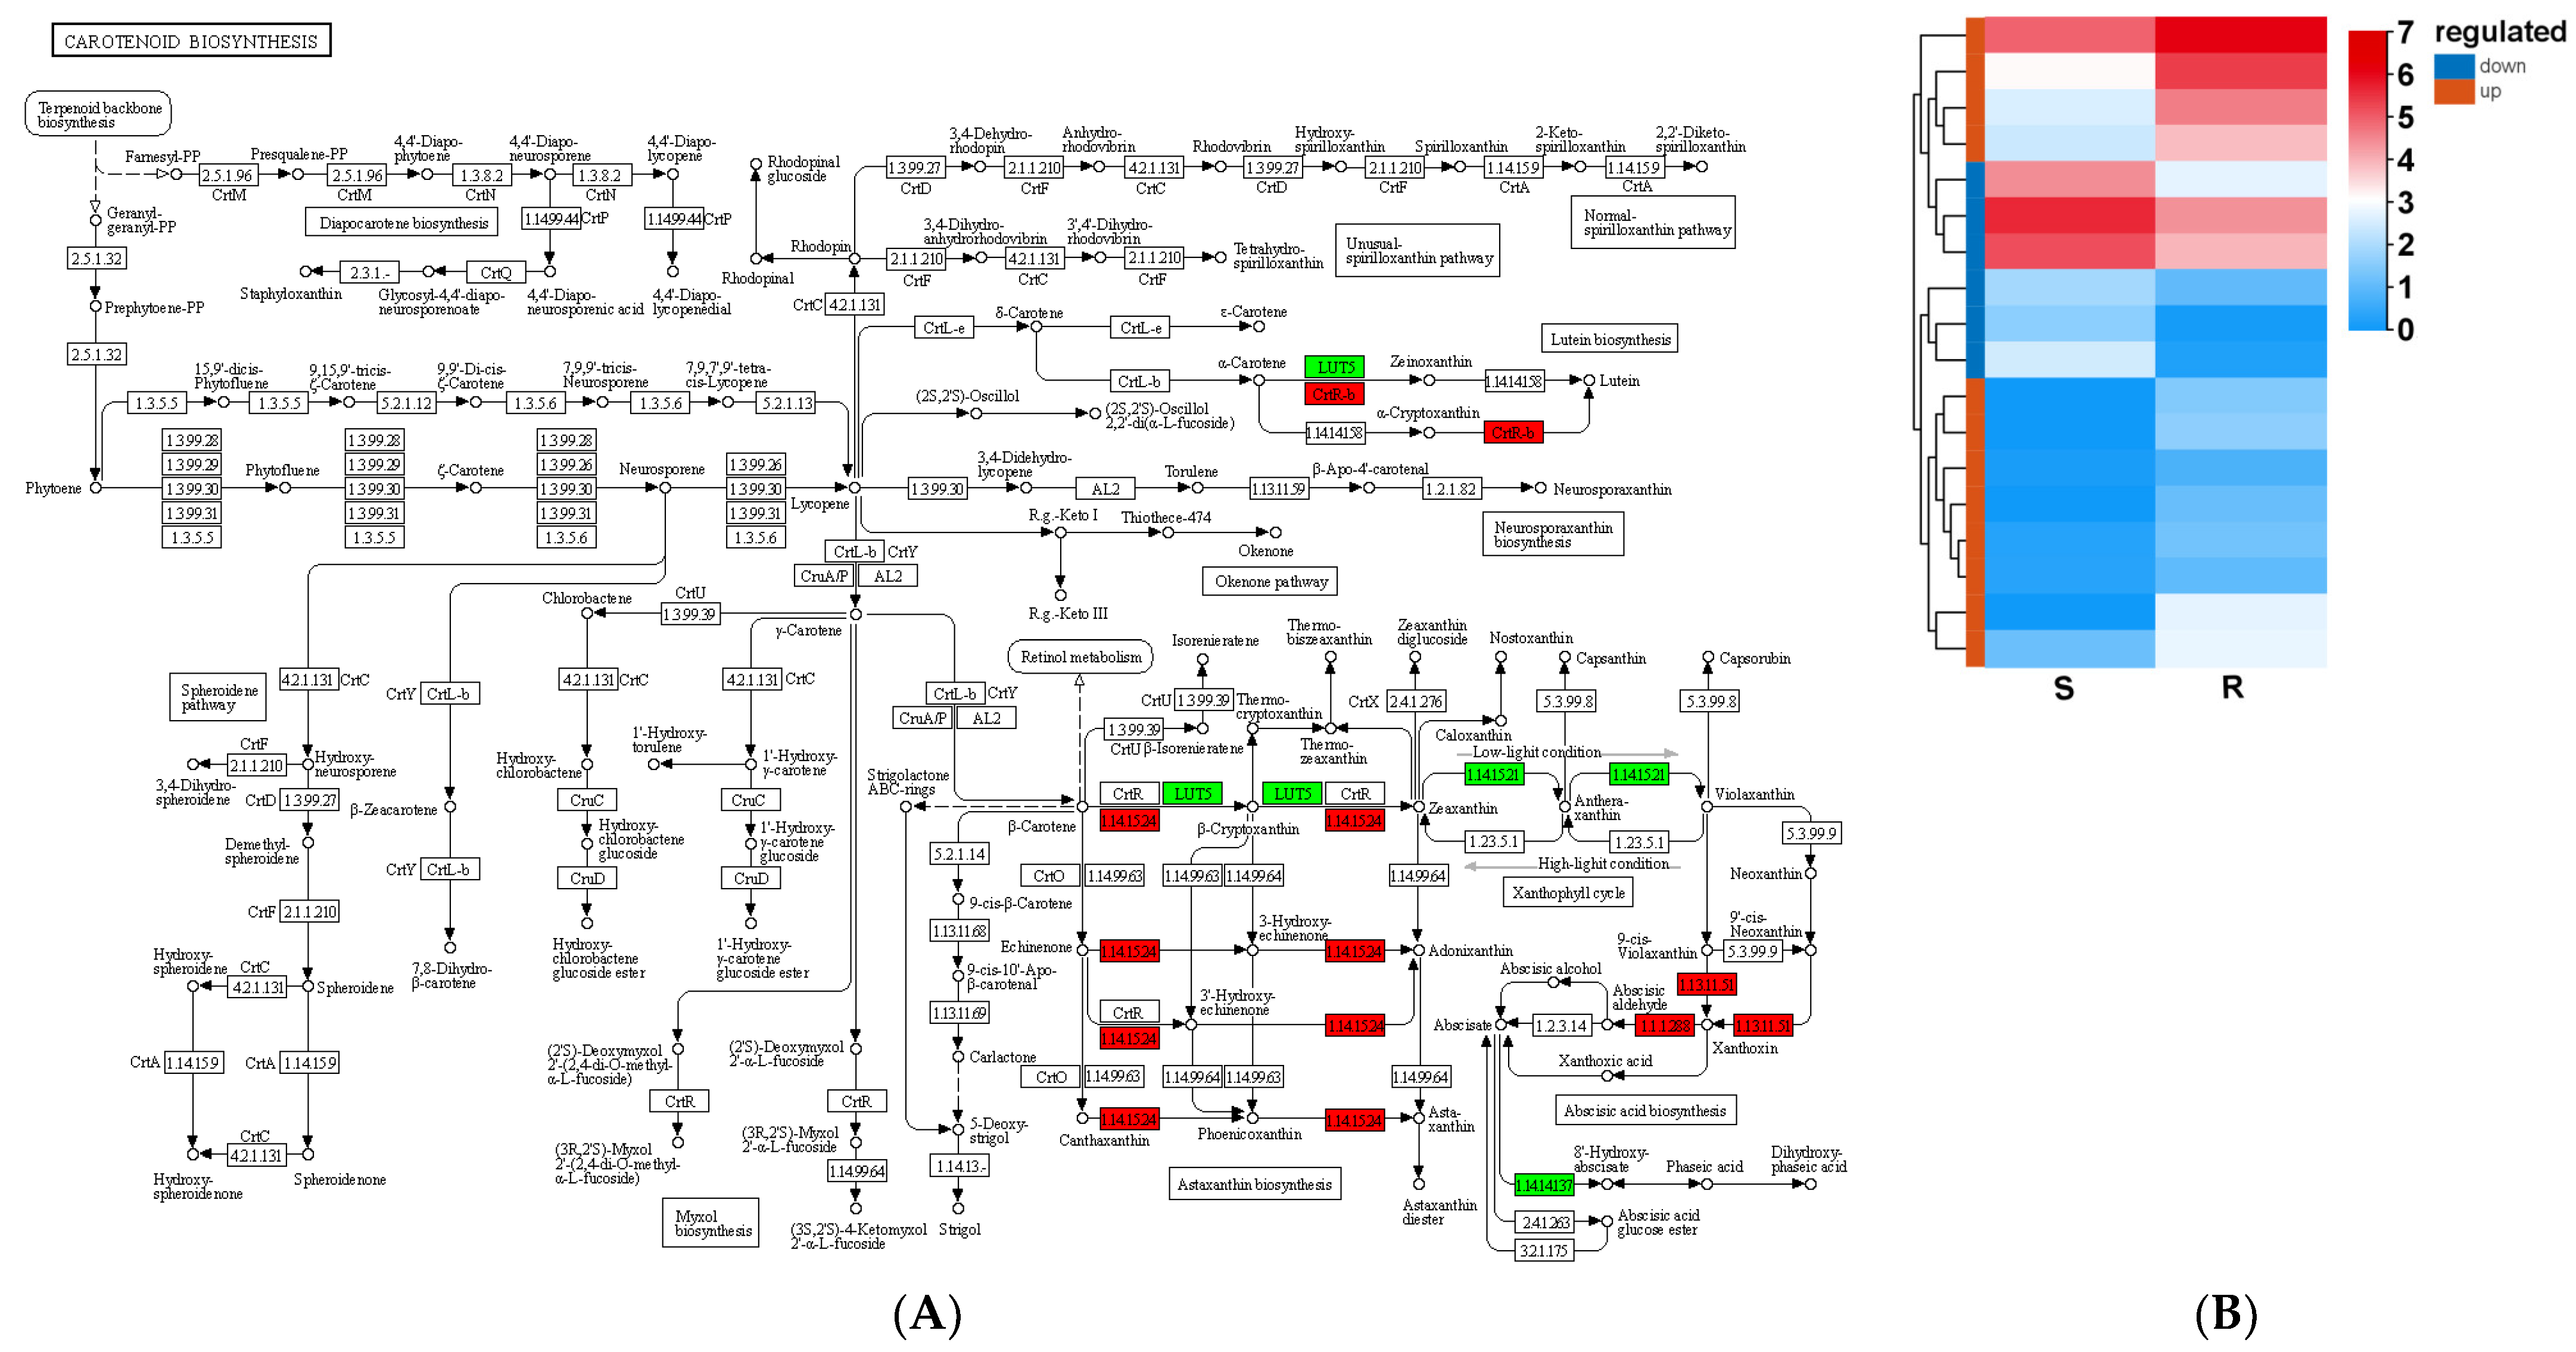
3.8. Carotenoid Biosynthesis in Relation to Resistance of Pine Plants to B. xylophilus

A total of 18 carotenoid biosynthesis-related genes were identified in the S_vs_R DEGs; 12 genes were upregulated and 6 were downregulated in the R-pool (Figure 12). They were involved in the xanthophyll cycle (two downregulated in the R-pool), ABA biosynthesis (ten upregulated and two downregulated in the R-pool), and lutein and astaxanthin biosynthesis (two upregulated and two downregulated in the R-pool). Of them, PtCA2, encoding β-carotene hydroxylase (BCH), which converts β-carotene to lutein (including zeaxanthin, purple xanthin, and neoxanthin), was expressed 2.13 fold higher in the R-pool than in the S-pool. PtNCED3, encoding 9-cis-epoxycarotenoid dioxygenase (NCED), which converts lutein to the ABA precursor, was expressed 2593.68 fold higher in the R-pool than in the S-pool. Moreover, PtF3H, PtDFRA and PtANS, encoding flavanone 3-hydroxylase, dihydroflavonol 4-reductase (DFR) and anthocyanin synthetase (ANS), were expressed 4.36, 4.68 and 3.40 fold higher in the R-pool than in the S-pool, respectively.
As a set of peroxides associated with oxygen metabolism, the excessive ROS due to stress could damage cellular proteins, lipids, and DNA [33]. Several studies revealed that carotenoids and flavonoids were important protective agents against oxidative stress [34,35]. A study on the lifespan of Caenorhabditis elegans showed it was extended by 1.3 fold when C. elegans were fed with carotenoids [36]. Three carotenoids could upregulate the expression of superoxide dismutase and catalase, induce an antioxidation effect, and prolong the lifespan of C. elegansLkF3H2 from Larix kaempferi was introduced into tobacco plants, which significantly increased the flavonoid content (1.66-fold higher than that in WT) [37]. And, the homologous gene CkF3H from Caragana korshinskii displayed high resistance to the stresses of temperature, salt and drought [38]. The PWN-response gene PmACRE from Pinus massoniana was introduced into Arabidopsis thaliana plants, which had a higher ascorbate peroxidase activity and total flavonoids content after invasion with PWN (142.19% and 87.41% more than that in the control, respectively) [39]. And the pathogenicity rate of the transgenic A. thaliana with the PmACRE gene was 28%–46%, while that of the control group was 37%–59%. Therefore, enhancing carotenoid biosynthesis was significant in resistance to B. xylophilus or other biotic stresses.

4. Conclusions

The germplasms of P. tabuliformis displayed a wide resistance spectrum to B. xylophilus and exhibited multiple ways of nematode control. They provided a basis for molecular design breeding against B. xylophilus. In particular, the genes involving plant–pathogen interaction, phenylpropanoid biosynthesis, ubiquitin-mediated proteolysis, and carotenoid biosynthesis are noteworthy. They could be useful for molecular marker-assisted breeding and could be effective gene resources in molecular breeding programs that aim for nematode control.

Supplementary Materials

The following supporting information can be downloaded at: https://www.mdpi.com/article/10.3390/f16040677/s1. The primers are given in Supplementary Table S1.

Author Contributions

M.L. and M.Y.: investigation and writing—original draft. L.W., Y.C. and L.G.: methodology and conceptualization. J.X.: writing—review and editing. J.X.: supervision. All authors have read and agreed to the published version of the manuscript.

Funding

This research was funded by STI 2030—Major Projects [grant number 2022ZD04016].

Data Availability Statement

The transcriptome data were deposited in the NCBI database (accession #PRJNA1212755).

Acknowledgments

We thank Xu Xiao from Ludong University for language revision of this manuscript.

Conflicts of Interest

The authors declare no conflicts of interest.

References

  1. Vicente, C.; Espada, M.; Vieira, P.; Mota, M. Pine Wilt Disease: A threat to European forestry. Eur. J. Plant Pathol. 2012, 133, 89–99. [Google Scholar] [CrossRef]
  2. Inacio, M.; Nobrega, F.; Vieira, P.; Bonifacio, L.; Naves, P.; Sousa, E.; Mota, M. First detection of Bursaphelenchus xylophilus associated with Pinus nigra in Portugal and in Europe. For. Pathol. 2015, 45, 235–238. [Google Scholar] [CrossRef]
  3. Wang, Y.; Chen, H.; Wang, J.; Li, D.; Wang, H.; Jiang, Y.; Fei, X.; Sun, L.; Li, F. Research progress on the resistance mechanism of host pine to pine wilt disease. Plant Pathol. 2024, 73, 469–477. [Google Scholar] [CrossRef]
  4. Sun, T.; Rahman, M.; Wu, X.; Ye, J. Resistant and susceptible Pinus thunbergii ParL. show highly divergent patterns of differentially expressed genes during the process of infection by Bursaphelenchus xylophilus. Int. J. Mol. Sci. 2023, 24, 14376. [Google Scholar] [CrossRef]
  5. Xie, W.; Liang, G.; Huang, A.; Zhang, F.; Guo, W. Comparative study on the mRNA expression of Pinus massoniana infected by Bursaphelenchus xylophilus. J. For. Res. 2020, 31, 75–86. [Google Scholar] [CrossRef]
  6. Lee, H.; Choi, Y.; Kim, S.; Han, H.; Kim, H.; Shim, D. Temporal transcriptome profiling of Pinus densiflora infected with pine wood nematode reveals genetically programmed changes upon pine wilt disease. Phytopathology 2024, 114, 982–989. [Google Scholar] [CrossRef]
  7. Wang, J.G.; Wang, J.J.; Ma, J.Y.; Jiang, X.; Zhou, Z.Q.; Shi, F. Effects of Bursaphelenchus xylophilus infestation on physiological and biochemical responses of Pinus tabuliformis. For. Pest Dis. 2024, 43, 21–26. [Google Scholar] [CrossRef]
  8. Ye, J. Analysis of the current epidemiological status, control technology and countermeasures of pine wood nematode disease in China. Sci. Silvae Sin. 2019, 55, 1–10. [Google Scholar]
  9. Zhang, J.; Yang, R.; Wang, Y.; Wang, X.; Wang, L.; Xu, J. The expansin gene SmEXPA13 in Salix matsudana in association with plant salt tolerance. Plant Cell Tissue Organ Cult. 2023, 154, 219–225. [Google Scholar] [CrossRef]
  10. Zhang, J.; Wang, L.; Wu, D.; Zhao, H.; Gong, L.; Xu, J. Regulation of SmEXPA13 expression by SmMYB1R1-L enhances salt tolerance in Salix matsudana Koidz. Int. J. Biol. Macromol. 2024, 270, 132292. [Google Scholar] [CrossRef]
  11. Yin, D.; Deng, Y.; Qi, J.; Chen, F.; Hao, D.; Tan, J.; Sun, S. Effects of inoculation with pine wood nematode on physiological indexes of Pinus sylvestris var. mongholica. J. Shenyang Agric. Univ. 2020, 51, 649–655. [Google Scholar]
  12. Jones, J.D.G.; Dang, J.L. The plant immune system. Nature 2006, 444, 323–329. [Google Scholar] [CrossRef] [PubMed]
  13. Nie, Z.; Li, W.; Deng, L.; Gao, K.; Liu, Q.; Zhou, Z. Comprehensive analysis of LRR-RLKs and key gene identification in Pinus massoniana resistant to pine wood nematode. Front. Plant Sci. 2022, 13, 1043261. [Google Scholar] [CrossRef]
  14. Xie, Y.; Liu, B.; Gao, K.; Zhao, Y.; Li, W.; Deng, L.; Zhou, Z.; Liu, Q. Comprehensive analysis and functional verification of the Pinus massoniana NBS-LRR gene family involved in the resistance to Bursaphelenchus xylophilus. Int. J. Mol. Sci. 2023, 24, 1812. [Google Scholar] [CrossRef]
  15. Mazo-Molina, C.; Mainiero, S.; Hind, S.; Kraus, C.; Vachev, M.V.; Maviane-Macia, F.; Lindeberg, M.; Saha, S.; Strickler, S.; Feder, A. The Ptr1 locus of Solanum lycopersicoides confers resistance to race 1 strains of Pseudomonas syringae pv. tomato and to Ralstonia pseudosolanacearum by recognizing the type III effectors AvrRpt2 and RipBN. Mol. Plant Microbe Interact. 2019, 32, 949–960. [Google Scholar] [CrossRef]
  16. Alam, M.; Tahir, J.; Siddiqui, A.; Magzoub, M.; Shahzad-Ul-Hussan, S.; Mackey, D. RIN4 homologs from important crop species differentially regulate the Arabidopsis NB-LRR immune receptor, RPS2. Plant Cell Rep. 2021, 40, 2341–2356. [Google Scholar] [CrossRef]
  17. Pruitt, R.N.; Locci, F.; Wanke, F.; Zhang, L.; Saile, S.C.; Joe, A.; Karelina, D.; Hua, C.; Frhlich, K.; Wan, W.L. The EDS1–PAD4–ADR1 node mediates Arabidopsis pattern-triggered immunity. Nature 2021, 598, 495–499. [Google Scholar] [CrossRef]
  18. Day, B.; Dahlbeck, D.; Huang, J.; Chisholm, S.T.; Staskawicz, B.J. Molecular basis for the rin4 negative regulation of rps2 disease resistance. Plant Cell 2005, 17, 1292–1305. [Google Scholar] [CrossRef]
  19. Liu, B. Functional Characterization of Key Genes for Terpene Biosynthesis Involved in Defense to Pine Wood Nematode in Pinus massoiana. Ph.D. Thesis, Chinese Academy of Forestry, Beijing, China.
  20. Liu, B.; Liu, Q.; Zhou, Z.; Luo, N.; Xie, Y.; Chen, X. Cloning of β-pinene synthase gene from Pinus massoniana and its response to pine wood nematode infestation. For. Res. 2020, 33, 1–12. [Google Scholar]
  21. Guo, H.; Dong, X.; An, M.; Xia, Z.; Wu, Y. Progress in the functional study of ubiquitination-modified key enzymes in plant stress response. aBIOTECH 2024, 40, 1–11. [Google Scholar]
  22. Takizawa, M.; Goto, A.; Watanabe, Y. The tobacco ubiquitin-activating enzymes NtE1A and NtE1B are induced by tobacco mosaic virus, wounding and stress hormones. Mol. Cells 2005, 19, 228–231. [Google Scholar] [CrossRef] [PubMed]
  23. Jeon, E.H.; Pak, J.H.; Kim, M.J.; Kim, H.J.; Shin, S.H.; Lee, J.H.; Kim, D.H.; Oh, J.S.; Oh, B.J.; Jung, H.W.; et al. Ectopic expression of ubiquitin-conjugating enzyme gene from wild rice, OgUBC1, confers resistance against UV-B radiation and Botrytis infection in Arabidopsis thaliana. Biochem. Biophys. Res. Commun. 2012, 427, 309–314. [Google Scholar] [CrossRef] [PubMed]
  24. Zhang, C.; Song, L.; Choudhary, K.; Zhou, B.; Sun, G.; Broderick, K.; Giesler, L.; Zeng, L. Genome-wide analysis of genes encoding core components of the ubiquitin system in soybean (Glycine max) reveals a potential role for ubiquitination in host immunity against soybean cyst nematode. BMC Plant Biol. 2018, 18, 1–20. [Google Scholar] [CrossRef] [PubMed]
  25. Zhang, M.; Li, W.; Zhang, T.; Liu, Y.; Liu, L. Botrytis cinerea-induced F-box protein 1 enhances disease resistance by inhibiting JAO/JOX-mediated jasmonic acid catabolism in Arabidopsis. Mol. Plant 2023, 17, 297–311. [Google Scholar] [CrossRef]
  26. Rehman, M.; Saeed, S.; Fan, X.; Salam, A.; Munir, R.; Yasin, U.; Khan, R.; Muhammad, S.; Ali, B.; Ali, I.; et al. The multifaceted role of jasmonic acid in plant stress mitigation: An overview. Plants 2023, 12, 3982. [Google Scholar] [CrossRef]
  27. Murtaza, K.; Sajid, A.; Ibrahim, A.; Saddam, S.; Fazal, U.; Asma, A.; Wajid, Z. The key roles of ROS and RNS as a signaling molecule in plant–microbe interactions. Antioxidants 2023, 12, 268. [Google Scholar] [CrossRef]
  28. Cesarino, I. Structural features and regulation of lignin deposited upon biotic and abiotic stresses. Curr. Opin. Biotechnol. 2019, 56, 209–214. [Google Scholar] [CrossRef]
  29. Xiong, X.; Sun, S.; Zhu, Q.; Zhang, X.; Li, Y.; Liu, F.; Xue, F.; Sun, J. The cotton lignin biosynthetic gene Gh4CL30 regulates lignification and phenolic content and contributes to verticillium wilt resistance. Mol. Plant Microbe Interact. 2021, 34, 240–254. [Google Scholar] [CrossRef]
  30. Tu, J.; Qin, L.; Karunakaran, C.; Wei, Y.; Peng, G. Lignin accumulation in cell wall plays a role in clubroot resistance. Front. Plant Sci. 2024, 15, 1401265. [Google Scholar] [CrossRef]
  31. Wang, X.; Wu, X.; Wen, T.; Feng, Y.; Zhang, Y. Transcriptomic analysis reveals differentially expressed genes associated with pine wood nematode resistance in resistant Pinus thunbergii. Tree Physiol. 2023, 43, 995–1008. [Google Scholar] [CrossRef]
  32. Ines, M.; Lieven, S.; Vicent, A.; Aurelio, G.; Isabel, C.; Yves, V.; Celia, M. Insights into the mechanisms implicated in Pinus pinaster resistance to pine wood nematode. Front. Plant Sci. 2021, 12, 690857. [Google Scholar] [CrossRef]
  33. Li, J.; Hu, L.; Zhang, L.; Pan, X.; Hu, X. Exogenous spermidine is enhancing tomato tolerance to salinity–alkalinity stress by regulating chloroplast antioxidant system and chlorophyll metabolism. BMC Plant Biol. 2015, 15, 1–17. [Google Scholar] [CrossRef] [PubMed]
  34. Tomas, Z.; Hajnalka, L.D.; Tunde, N.T.; Zoltan, G. Carotenoids assist in cyanobacterial photosystem ii assembly and function. Front. Plant Sci. 2016, 7, 295. [Google Scholar] [CrossRef]
  35. Demmig-Adams, B. Carotenoids and photoprotection in plants: A role for the xanthophyll zeaxanthin. Biochim. Biophys. Acta 1990, 1020, 1–24. [Google Scholar] [CrossRef]
  36. Lee, S.A.; Lim, W.H.; Le, V.V.; Ko, S.R.; Kim, B.; Oh, H.M. Lifespan extension and anti-oxidant effects of carotenoid pigments in Caenorhabditis elegans. Bioresour. Technol. Rep. 2022, 17, 100962. [Google Scholar] [CrossRef]
  37. Li, C.; Jiang, X.; Gai, Y. Cloning of the LkF3H2 gene in Larix kaempferi and its function in regulating flavonoid metabolism. Biotechnol. Bull. 2024, 40, 245–252. [Google Scholar] [CrossRef]
  38. Zheng, S.; Mao, Y.; Zhang, T.; Nie, T. Cloning and expression analysis of F3H gene in Caragana korshinskii. Guihaia 2017, 37, 723–733. [Google Scholar] [CrossRef]
  39. Xu, X. Studies on the Mechanism of PmACRE Gene in Regulation of Plant Resistance to Pine Wood Nematode in Pinus massoniana. Master’s Thesis, Fujian Agriculture and Forestry University, Fuzhou, China, 2022. [Google Scholar]
Figure 1. Inoculation of P. tabuliformis with the B. xylophilus strain BxFC.
Forests 16 00677 g001
Figure 2. Performance of the P. tabuliformis germplasms after inoculation with B. xylophilus for 30 d.
Forests 16 00677 g002
Figure 3. Physiological results of the P. tabuliformis germplasms after inoculation with B. xylophilus for 30 d. Note: (A), relative conductivity; (B), total chlorophyll content; (C), malondialdehyde content; (D), soluble sugar content. The left five lines are the sensitive to PWN type and the right five lines are the resistant to PWN type. * and *** represent the significant difference between the resistant lines and the susceptible lines at p < 0.05 and p < 0.001, respectively.
Forests 16 00677 g003aForests 16 00677 g003b
Figure 4. The expression patterns of eight genes in the S and R groups of P. tabuliformis inoculated by PWN for 30 d. S, pool of the sensitive lines; R, pool of the resistant lines. The left ordinate means the RT–PCR results marked in the bar chart. The right ordinate means the RNA-sequencing data marked with red lines.
Forests 16 00677 g004
Figure 5. Cluster diagram of S_vs_R DEGs. The ordinate represents the DEGs and the clustering results of the genes. The color lines indicate the expression level [log10 (FPKM + 0.000001)] of the genes from low (red) to high (blue).
Forests 16 00677 g005
Figure 6. GO annotation of the S_vs_R DEGS.
Forests 16 00677 g006
Figure 7. The enriched KEGG pathways of S_vs_R DEGs. The abscissa indicates the name of the pathway, and the ordinate is the rich factor. The color of the circle represents the q value. The size of the circle indicates the number of genes enriched in the pathway.
Forests 16 00677 g007
Figure 8. S_vs_R DEG-mediated plant–pathogen interaction pathway (A) and expression (B). The red boxes in panel (A) represent up-regulated DEGs, while the green boxes represent down-regulated DEGs, and the light blue boxes represent up- and down-regulated DEGs. The red boxes in panel (B) represent up-regulated DEGs, and the blue boxes represent down-regulated DEGs.
Forests 16 00677 g008
Figure 9. S_vs_R DEG-mediated monoterpenoid biosynthesis pathway (A) and expression (B). The red boxes in panel (A) represent up-regulated DEGs, and the light blue boxes represent up- and down-regulated DEGs. The red boxes in panel (B) represent up-regulated DEGs, and the blue boxes represent down-regulated DEGs.
Forests 16 00677 g009
Figure 10. Ubiquitin mediated proteolysis pathway of the S_vs_R DEGs (A) and expression (B). The red boxes in panel (A) represent up-regulated DEGs, while the green boxes represent down-regulated DEGs, and the light blue boxes represent up- and down-regulated DEGs. The red boxes in panel (B) represent up-regulated DEGs, and the blue boxes represent down-regulated DEGs.
Forests 16 00677 g010
Figure 11. S_vs_R DEG-mediated phenylpropanoid biosynthesis pathway (A) and expression (B). The abscissa indicates the name of the pathway, and the ordinate is the rich factor. The red boxes in panel (A) represent up-regulated DEGs, while the green boxes represent down-regulated DEGs, and the light blue boxes represent up- and down-regulated DEGs. The red boxes in panel (B) represent up-regulated DEGs, and the blue boxes represent down-regulated DEGs. The color of the circle represents the q value. The size of the circle indicates the number of genes enriched in the pathway.
Forests 16 00677 g011
Figure 12. S_vs_R DEG-mediated carotenoid biosynthesis pathway (A) and expression (B). The red boxes in panel (A) represent up-regulated DEGs, while the green boxes represent down-regulated DEGs. The red boxes in panel (B) represent up-regulated DEGs and the blue boxes represent down-regulated DEGs.
Forests 16 00677 g012
Table 1. RNA sequencing results.
Sample *SR
Total reads39,165,63638,983,354
Mapped reads33,334,699 (85.11%)35,505,333 (91.08%)
Uniq rapped reads29,390,667 (75.04%)32,114,829 (82.38%)
Multiple map reads3,944,032 (10.07%)3,390,504 (8.70%)
Reads map to ‘+’19,721,921 (50.36%)20,203,642 (51.83%)
Reads map to ‘−’19,750,035 (50.43%)20,172,513 (51.75%)
Clean reads19,582,81819,491,677
Clean bases5,865,086,8625,838,137,580
GC content45.55%44.69%
% ≥ Q3094.33%94.04%
* Mapped reads refer to the number of reads aligned to the reference genome and percentage of clean reads; Uniq mapped reads denote the number of reads aligned to the unique positions of the reference genome and percentage of clean reads; Multiple map reads represent the number of reads aligned to multiple positions of the reference genome and percentage of clean reads; Reads map to ‘+’ indicates the number of reads aligned to the positive strand of the reference genome and percentage of clean reads; Reads map to ‘−’ means the number of reads aligned to the negative strand of the reference genome and percentage of clean reads.
Table 2. The number of annotated DEGs between the R and S pools.
DatabaseS_vs_R
Total5869
COG2213
GO4780
KEGG4095
KOG2834
NR5810
Pfam4733
Swiss-Prot4268
eggNOG4815
Disclaimer/Publisher’s Note: The statements, opinions and data contained in all publications are solely those of the individual author(s) and contributor(s) and not of MDPI and/or the editor(s). MDPI and/or the editor(s) disclaim responsibility for any injury to people or property resulting from any ideas, methods, instructions or products referred to in the content.

