Abstract
Under the dual pressures of climate change and rapid urbanization, a comprehensive analysis of vegetation’s spatiotemporal patterns and their driving forces plays a pivotal role for addressing global ecological challenges. However, systematic bibliometric analyses in this field remain limited. This study involved a comprehensive bibliometric analysis of 18,270 related publications from 1989 to 2024 retrieved from the Web of Science SCI-Expanded database, elucidating research trends, methodologies, and key thematic areas. Utilizing the bibliometrix and biblioshiny tools, the results reveal an annual average growth rate of 17.62% in the number of published research articles, indicating rapid research expansion. Climate change emerged as the core driving force, with high-frequency keywords such as “vegetation”, “dynamics”, and “variability”. China (18,687 papers), the United States (14,502 papers), and Germany (3394 papers) are the leading contributors in this domain, with China showing the fastest growth in research output, albeit with relatively lower average citation rates. Core journals, including Remote Sensing of Environment and Global Change Biology, have played pivotal roles in advancing vegetation dynamics research, with remote sensing techniques dominating the field. The study highlights a shift in vegetation dynamics research from single-variable analyses (e.g., temperature, precipitation) to multi-scale and multidimensional approaches around 2010. Regional studies, such as those focusing on the Loess Plateau, are gaining importance, while advancements in remote sensing and machine learning technologies have enhanced the precision and scalability of research. This study provides a comprehensive summary of the current state and development trends in vegetation spatiotemporal dynamics and their driving forces, offering valuable insights for future research in the field.
1. Introduction
Against the backdrop of global climate change and rapid urbanization, the influence of human activities on vegetation patterns has become increasingly prominent [1,2,3]. Population growth, economic development, and shifts in land-use practices have led to significant changes in the spatial distribution and ecological functions of terrestrial vegetation through activities such as deforestation, urban expansion, and agricultural intensification [4,5,6]. Simultaneously, fluctuations in natural climate systems, particularly global temperature rise, shifting distribution of rainfall, and the rising incidence of climatic extremes, have significantly impacted vegetation dynamics [7]. These changes not only weaken the carbon cycling functions of ecosystems but also exacerbate the imbalance of regional ecosystem services and increase ecosystem vulnerability [8,9]. The spatiotemporal dynamics of vegetation directly reflect the combined effects of human activities and climate change. For instance, large-scale deforestation and grassland degradation have heightened greenhouse gas emissions, thereby reducing the capacity of terrestrial ecosystems to act as carbon sinks [10,11]. Globally, this intricate interplay has posed severe challenges to socio-economic development and environmental conservation. Understanding vegetation spatiotemporal dynamics and their natural and human-driven factors is crucial for clarifying ecological feedback to climatic and anthropogenic drivers, thereby supporting sustainable land management and ecological conservation. This is essential for addressing climate change, promoting the sustainable use of ecosystem services, and achieving global ecological security.
Recently, substantial progress has been made in studying the spatiotemporal dynamics of vegetation both domestically and internationally. Commonly used methods for analyzing spatiotemporal patterns of vegetation evolution include stability analysis [12], trend analysis (e.g., Theil–Sen method and Mann–Kendall test) [13,14], and abrupt change detection. These methods comprehensively characterize vegetation cover changes across temporal and spatial dimensions. In driving force analysis, influencing factors are typically categorized into three major groups: (1) climatic factors [15], such as precipitation, temperature, and radiation; (2) anthropogenic drivers [16], including land-use changes, gross domestic product (GDP), night-time light data, and road distance; and (3) natural conditions factors [17], encompassing topographic elements like elevation, slope, and aspect, as well as soil properties. To quantify and identify the relative contributions and interactions among these drivers, quantitative approaches such as correlation analysis, partial correlation analysis [18], Geodetector [19], structural equation modeling (SEM) [20], residual analysis [21], and multivariate regression analysis [22] are widely applied. Despite the wealth of existing research, gaps remain in conducting multi-scale and multidimensional analyses of vegetation dynamics and their driving forces. Specifically, accurately quantifying and identifying key driving forces and their nonlinear interactions across different temporal and spatial scales remains a critical challenge and a priority for future research. Addressing these issues effectively not only deepens our understanding of vegetation dynamic processes and mechanisms but also provides a robust theoretical and technical foundation for developing scientific and effective ecological conservation and management strategies. This, in turn, will advance research and practical applications within this research domain.
The term “bibliometrics” was first proposed by Pritchard in 1969 [23], conceptualized as “the application of mathematical and statistical methods to books and other media of communication”. As a powerful tool for analyzing scientific research progress, bibliometrics quantifies information related to specific research topics within online scientific citation databases, including the distribution of authors, publication output, and research institutions in a given field [24]. It also enables the identification of core issues and emerging directions in a field through keyword co-occurrence analysis and thematic clustering, presenting the current state and future trends of research in the form of knowledge maps [25]. In the context of vegetation spatiotemporal dynamics, where research spans multiple disciplines (e.g., ecology, climatology, remote sensing, and land use studies), bibliometric analysis is particularly useful for revealing interdisciplinary connections, tracking methodological advancements, and mapping the evolution of key research themes. Consequently, bibliometrics provides a systematic, visualized, and structured analytical approach for studying the spatiotemporal changes in vegetation and their driving forces.
This study aims to systematically review the key findings on vegetation spatiotemporal changes and their driving forces from 1987 to 2024 using bibliometric methods, focusing on the following critical questions: How have the number of publications and key thematic areas related to vegetation spatiotemporal changes and their driving forces evolved between 1987 and 2024? What are the primary research hotspots in this field? What core methods and techniques have been employed? What potential development trends and innovative directions can be expected in future research on vegetation dynamics and their driving forces under the context of climate change? The specific objectives of this study include extracting scientific publications related to the research theme from the Web of Science (WOS) Science Citation Index (SCI) Expanded database to obtain bibliometric information supporting in-depth analysis [26]; using the bibliometrix R package and the biblioshiny web application to organize, visualize, and analyze quantitative data from the selected publications, thereby uncovering research trends and structures [27]; identifying the leading authors, countries, and institutions in the field of vegetation spatiotemporal changes and their driving forces based on total citations or H-index, and analyzing their academic contributions and collaboration networks [28]; conducting keyword co-occurrence analysis and thematic clustering to summarize historical research priorities and current frontiers in the field, while exploring future research directions and potential hotspots.
2. Materials and Methods
2.1. Literature Search Strategy
To maintain consistency with bibliometric analyses conducted for other related studies, we selected the Science Citation Index Expanded (SCI-Expanded) database within WOS Core Collection as the data source. Based on the relevance to vegetation spatiotemporal changes and their driving forces, the advanced search query shown in Table 1 was employed.

Table 1.
Search strategy for identifying research on spatiotemporal dynamics and driving factors of vegetation.
To refine the dataset and eliminate irrelevant studies, we implemented a two-step filtering process. First, an automated filtering step was applied, restricting the search to peer-reviewed journal articles in English and using predefined exclusion criteria to remove irrelevant categories (Table 1). The initial search returned a total of 18,295 records. Second, the titles and abstracts of the articles were reviewed to ensure alignment with the research topic. For example, after examining the titles and abstracts, it was found that publications before 1989 were unrelated to the study topic. As a result, the time range was adjusted to include studies from 1989 to 2024, reducing the number of records to 18,270 (as of the latest update on 24 November 2024). The export of all records was completed as plain text files containing “Full Record and Cited References”.
2.2. Bibliometric Analysis
The bibliometric analysis methodology was adapted from the study by Aria and Cuccurullo [29], comprising three main steps: research design, data collection and analysis, and result interpretation and visualization. During the research design phase, vegetation spatiotemporal changes and their driving forces were determined to be the research topic, the questions were proposed, and a high-quality data source (e.g., the WOS SCI-Expanded database) was selected. In the data collection and analysis phase, relevant publications meeting the inclusion criteria were screened, and the bibliometrix package [30] was employed to systematically analyze features such as publication volume, source journals, and author distributions. Finally, visualization of the data was performed using tools such as biblioshiny [31], ggplot2 [32], and Origin [33], enabling an in-depth interpretation of the results to reveal the current state and development trends in the field. Figure 1 illustrates the research framework and its main steps.
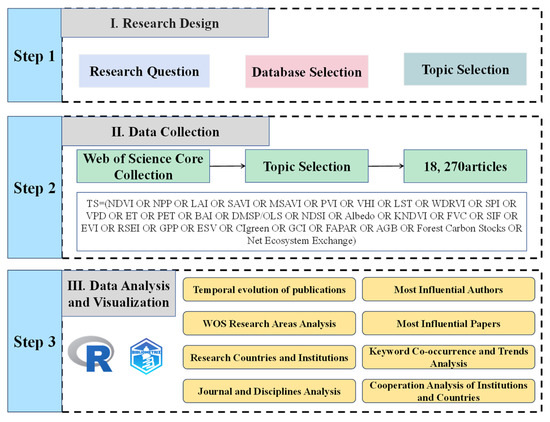
Figure 1.
The flow chart of the literature search and bibliometric analysis, including two steps: (1) literature search and preprocess and (2) bibliometric analysis.
This study was conducted in three stages. The first stage, the research design phase, identified vegetation spatiotemporal changes and their driving forces as the research theme and proposed three core research questions. To ensure data quality and relevance, the WOS SCI-Expanded database (https://www.webofknowledge.com (accessed on 24 November 2024) was selected as the data source. The study scope was defined to include the document types ARTICLE, ARTICLE: DATA PAPER, ARTICLE: EARLY ACCESS, ARTICLE: PROCEEDINGS PAPER, and REVIEW, ensuring the scientific rigor and reliability of the data. The temporal range of the study was set from 1989 to 2024. The second stage, the data collection phase, retrieved related publications through advanced search queries. A document type filter was applied to retain only peer-reviewed publications. These records were exported in the “Full Record and Cited References” format [34] and imported into the bibliometrix (version 4.0) software in R as RData files via biblioshiny, enabling subsequent analysis and visualization. The third stage, the data analysis and visualization phase, utilized the bibliometrix package in R to perform quantitative analyses on the document sample. A comprehensive matrix of all documents was constructed, with analyses covering publication volume, source journal distribution, country and institutional contributions, author analysis, high-impact publications, and keyword frequency trends. Visualization outputs were generated using biblioshiny, R, and Origin (version 2022) software, including publication trend charts, research field evolution maps, country and institutional collaboration networks, and high-frequency keyword evolution diagrams. Additionally, Bradford’s Law was utilized to analyze the distribution of journals and identify core sources in the field [35]. Influential papers were determined based on citation frequency [36]. Section 3 presents the results and visualizations derived from these analyses, providing an in-depth interpretation of the current state and development trends in vegetation spatiotemporal changes and their driving forces. Through this systematic workflow, this study establishes a comprehensive bibliometric analysis framework for this field (Figure 1).
3. Results and Discussion
The preliminary results of the bibliometric analysis provide an overview of bibliometric statistics. Afterwards, the authors were examined together with indicators, information, keywords, and country distributions associated with the relevant literature.
3.1. Descriptive Bibliometric Analysis
Through bibliometric analysis, the developmental trajectory of research on vegetation spatiotemporal changes and their driving forces was comprehensively reviewed. Figure 2 illustrates the scientific output trends in this field from 1989 to 2024. As early as 1989, several pivotal studies in this domain were published, such as “Weather Sensitivity of Western Canada Wheat Yield, 1900–1988” [37] and “Reconstruction of Tree-Line Vegetation Response to Long-Term Climate Change” [38]. Since the publication of seven related papers in 1989, academic output on vegetation spatiotemporal changes and driving forces has steadily increased. Notably, around 2010, the research in this field experienced explosive growth, with the number of related papers reaching 2052 by 2024, reflecting an impressive average annual growth rate of 17.62%. This surge in research activity aligns with a broader global emphasis on climate change and technological advancements, which have further shaped the direction of vegetation dynamics studies. The increasing prominence of “climate change” as a core topic can be attributed to global policy shifts such as the Paris Agreement (2015) [39] and the United Nations Sustainable Development Goals (SDGs, 2015–2030) [40], which have heightened research interest in understanding vegetation responses to changing climate conditions. Similarly, “remote sensing” and “machine learning” have gained traction in recent years due to advancements in satellite technology [41] (e.g., MODIS, Landsat-8, Sentinel-2) and the growing accessibility of big data processing platforms like Google Earth Engine.
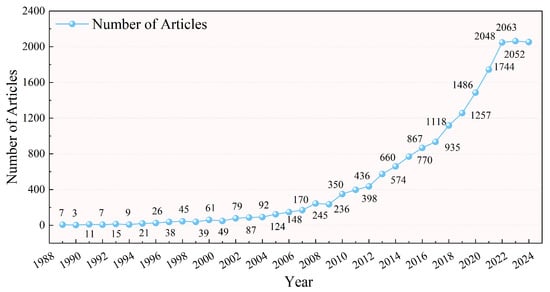
Figure 2.
Trends in scientific output on spatiotemporal vegetation changes and driving forces from 1987 to 2024.
Table 2 summarizes the key information of the 18,270 papers published in the WOS SCI-Expanded database between 1989 and 2024. Over the past 35 years, the average annual growth rate of publications was 17.62%, with an average of 32.94 citations per paper and 4.177 citations per year. These papers were authored by 54,424 researchers, including 503 single-author papers and a total of 549 single-author articles. On average, each paper involved 5.73 collaborating authors, with an international collaboration rate of 39.1%. Additionally, the papers collectively generated 33,389 author keywords and 21,426 extended keywords, with a total of 567,397 references cited, reflecting the extensive collaboration and significant influence of this research field.
Table 2.
Key information of literature on vegetation spatiotemporal changes and driving forces identified by bibliometric analysis.
3.2. WOS Research Categories
Research categories assigned by Clarivate Analytics [42] in the WOS database are used to classify research papers, with each paper categorized into at least one field. This study found that the number of research categories covered by publications related to vegetation spatiotemporal dynamics and driving forces increased significantly from 7 in 1989 to 66 in 2024 (Figure 3a). This growth trend reflects the expansion of relevant research into multidisciplinary domains as scientific investigations have deepened. The top ten research categories with the highest output include Environmental Sciences and Ecology, Remote Sensing, Imaging Science and Photographic Technology, Geology, Agriculture, Meteorology and Atmospheric Sciences, Physical Geography, Water Resources, Biodiversity and Conservation, and Engineering (Figure 3b). Among these, Environmental Sciences and Ecology experienced rapid growth after 2010, becoming the most prolific category in terms of publications. This trend is closely related to the increasing global focus on environmental and ecological changes under the frameworks of the Millennium Development Goals (MDGs, 2000–2015) [40] and the Sustainable Development Goals (SDGs, 2015–2030) [43]. In this context, the volume of vegetation-related literature has risen significantly. The accessibility of remote sensing data, e.g., MODIS (Moderate Resolution Imaging Spectroradiometer) [44,45] and Landsat [46], has provided essential support for studies on vegetation dynamics and their driving forces. Additionally, the launch of Google Earth Engine [47,48] in 2017 has greatly enhanced the efficiency of remote sensing data processing and analysis, enabling more convenient long-term global vegetation studies. These factors collectively contributed to the multidisciplinary development and rapid growth of research output in this field.
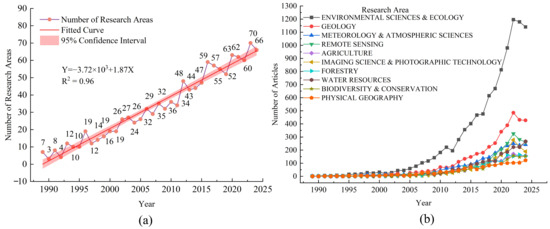
Figure 3.
(a) Temporal trends in the number of WOS research areas covered in literature on vegetation spatiotemporal dynamics and driving forces, with a fitted linear model and 95% confidence interval. (b) Temporal evolution of the top ten most product.
3.3. Research Countries and Institutions
Based on the analysis, a total of 157 countries have participated in NDVI research. The leading five countries in terms of scientific output are China (18,687 publications), the United States (14,502 publications), Germany (3394 publications), the United Kingdom (2902 publications), and Canada (2498 publications) (Figure 4). Since 2013, China’s scientific output has grown rapidly, surpassing that of the United States in total volume. The growth in China’s research output is closely related to several factors: (1) strong national policy support, such as the “973 Program”, the “863 Program” [49], and the recent “Double First-Class” initiative [50]; (2) significant enhancement in international collaboration, with China’s international collaboration rate increasing substantially since 2013, leading to its expanding influence in the global research network; (3) advances in data and technology, such as the widespread application of Google Earth Engine, which has provided critical data support for large-scale, long-term vegetation dynamics studies. In contrast, although the United States ranks second in total output, it maintains a leading position in the impact of high-quality publications, as reflected by higher average citations per paper. This indicates its continued core competitiveness in theoretical innovation and methodological application within the field of vegetation dynamics research. European nations, such as the UK and Germany, have shown relatively stable research output, characterized by strong regional collaboration. Looking forward, the acceleration of data openness and technological advancements is expected to further enhance the depth and breadth of global research network collaborations, thereby driving the overall development of vegetation dynamics and their driving force studies.
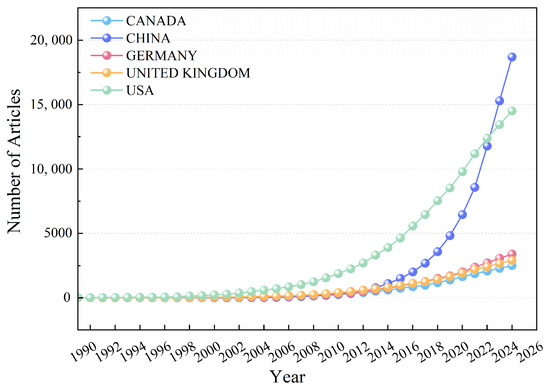
Figure 4.
Top five nations according to yearly scientific output.
Table 3 presents the top five countries ranked by international and domestic collaboration intensity in the field of vegetation spatiotemporal changes and driving forces from 1987 to 2024. Analytical findings indicate that the United States ranks first in international collaboration intensity, with a score of 11,914, demonstrating its central role in transnational research networks. China follows closely with a score of 8348, reflecting its rapid growth in international academic influence. Germany (7294), the United Kingdom (7114), and France (5222) also exhibit strong performance in international collaborations. Meanwhile, China leads in domestic collaboration intensity with a score of 6234, showcasing the high level of cooperation within its national research network. The United States ranks second (5346), also displaying significant domestic research collaboration capacity, while Germany (1657), the United Kingdom (1545), and Canada (1236) make notable contributions to domestic collaboration. These findings highlight the important positions and research contributions of various countries in both international and domestic collaboration networks within the field of vegetation spatiotemporal changes and driving forces.
Table 3.
Top 5 countries with highest international and domestic collaboration strength.
We assessed the total citation counts, total publication outputs, and average citation counts per article for NDVI-related research across different countries, highlighting the top ten contributing nations (Figure 5). The United States leads in total citations (175,595), followed by China (130,590), the United Kingdom (34,249), Germany (33,419), and Canada (23,126). In terms of the number of publications, China has the highest number of published articles (5677), surpassing the United States (3445). However, despite China’s high publication output, its average citations per article are the lowest among the top ten countries (23 citations per article). This indicates that while China makes a significant contribution in terms of publication quantity, the global impact of individual publications remains relatively limited. Switzerland, despite having a smaller total number of publications (3999), has the highest average citations per article (56.04), suggesting that its research articles have strong academic influence. Although China has a large volume of research output, its relatively low average citation rate suggests that many of these studies are still in the development stage in terms of global impact and recognition. Nevertheless, the rapid growth of Chinese research highlights its increasingly prominent position in the field. The United States continues to maintain its leading role, especially in terms of total citations and the overall quality and influence of its publications, making it a central player in NDVI-related research.
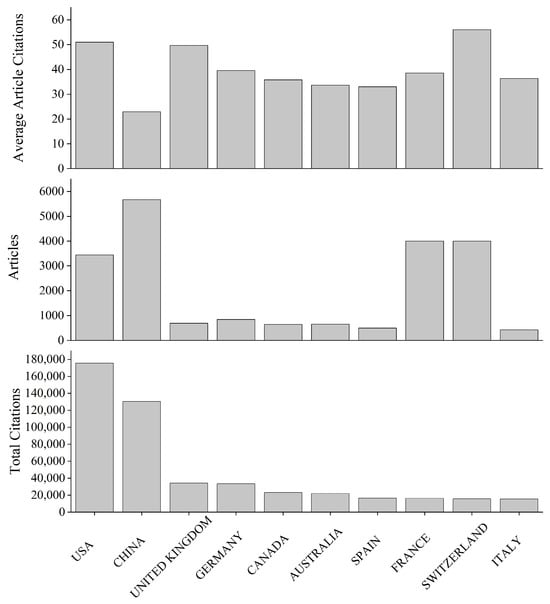
Figure 5.
Scientific impact of top ten most cited countries: total articles, total citations, and average article citations.
Figure 6 illustrates the annual publication trends of five major research institutions in the field of vegetation spatiotemporal changes and driving forces from 1989 to 2024, reflecting their research capabilities and academic influence in this domain. The United States Department of Agriculture (USDA) dominated the early stages of research, with annual publications increasing from 1 in 1989 to 841 in 2024, though its growth rate has been relatively moderate. The French National Centre for Scientific Research (CNRS) experienced significant growth in publications after 2000, reaching 891 by 2024, indicating its sustained investment and growing influence in this field. The Chinese Academy of Sciences (CAS), since its first related publication in 1996, has shown rapid growth in annual output, particularly after 2014, with publications skyrocketing to 4904 by 2024, underscoring its leading role in global research. Similarly, the University of Chinese Academy of Sciences (UCAS) and the Institute of Geographic Sciences and Natural Resources Research (IGSNRR) demonstrated rapid growth after 2010 and 2006, respectively, with publication counts reaching 1196 and 827 by 2024, highlighting the coordinated development within China’s research system. This trend clearly indicates that Chinese research institutions are progressively establishing a global leadership position in the study of vegetation dynamics and driving forces. In contrast, traditional powerhouses like the United States and France, while maintaining steady growth, face increasing competition from emerging research forces. As the global research landscape continues to evolve, further deepening of international collaborations is expected, which will drive sustained advancements in this field.
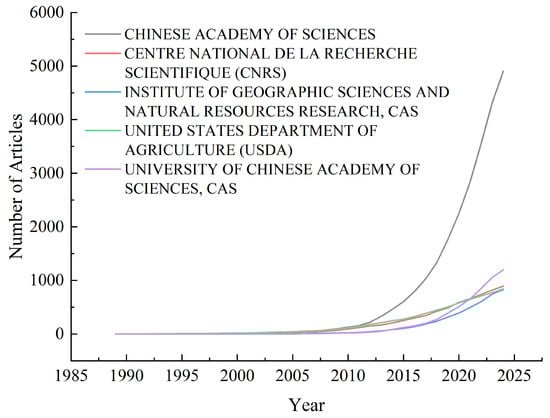
Figure 6.
Annual publication trends of leading research institutions in vegetation spatiotemporal dynamics and driving forces (1989–2024).
3.4. Most Influential Source Journals
Research papers on vegetation spatiotemporal changes and their driving forces have been published across 1606 journals, with the annual number of source journals increasing from 8 in 1989 to 465 in 2024. This reflects the rapid expansion and interdisciplinary nature of the research field. Analysis of major source journals shows that the top ten journals collectively published 2771 papers, accounting for 23.13% of the total publications. These journals are, in order: Remote Sensing (1006 papers), Science of the Total Environment (538 papers), Global Change Biology (494 papers), Ecological Indicators (385 papers), Agricultural and Forest Meteorology (348 papers), Remote Sensing of Environment (324 papers), Sustainability (307 papers), Journal of Hydrology (290 papers), Forest Ecology and Management (267 papers), and Water (266 papers). Among them, Remote Sensing has the highest year-on-year expansion rate in publications, while Remote Sensing of Environment ranks first in total local citations (see Table 4). Following Bradford’s Law, the distribution of core periodicals for vegetation spatiotemporal changes and driving forces research is relatively dispersed. However, the core source journals include Remote Sensing of Environment (39,213 local citations), Global Change Biology (34,200 citations), Nature (22,422 citations), Science (21,824 citations), and Remote Sensing (19,661 citations). The role of these journals is crucial to advancing the research during the study period. From a temporal perspective, Figure 7 illustrates the annual publication trends of the leading five journals in vegetation dynamics research. Since 2000, the number of papers published in these journals has increased significantly, with Remote Sensing showing rapid growth from 2010 onward, becoming a major contributor in the field. Additionally, Science of the Total Environment and Global Change Biology have also exhibited notable growth trends, underscoring the increasing importance of environmental science and global change biology in supporting vegetation dynamics research.
Table 4.
Top ten journals in vegetation spatiotemporal dynamics and driving force studies ranked by local citations, along with ND, IF, and H-Index.
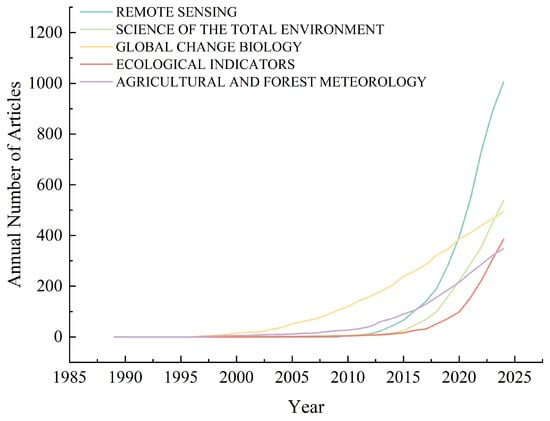
Figure 7.
Top five journals with the highest annual number of articles on vegetation dynamics.
3.5. Most Influential Authors
The H-index, calculated on the basis of the citation count of a scientist’s publications, is a widely accepted metric for assessing academic performance [34]. According to the H-index rankings, the ten highest-impact authors within the discipline are: Piao S.L. (40), Ciais P. (38), Zhang L. (35), Wang J. (32), Liu Y. (31), Richardson A.D. (31), Menzel A. (29), Peñuelas J. (28), Sun G. (28), and Yang J. (27) (see Table 5). Among them, Piao S.L. ranks first with an H-index of 40 and a total citation count of 9078, establishing himself as one of the leading scholars in the field. Ciais P. and Richardson A.D. are also prominent, contributing 75 and 44 high-impact publications, respectively. Of these ten influential researchers, five are based in the United States, while the others represent China, France, Germany, Spain, and Denmark. Although Liu Y. and Wang J. demonstrate notable productivity with 122 and 110 publications, respectively, their relatively lower H-indices highlight differences in the quality versus quantity of their contributions. Between 1989 and 2024, the field has seen significant growth, with papers having an average age of 5.94 years, an average citation count of 32.94 per paper, and an average annual citation rate of 4.177 times per paper, referencing a total of 567,397 citations. Journal articles dominate, accounting for 17,607 publications (96.37%). Among these, single-author articles make up only 549 (approximately 3%), indicating a high degree of collaboration in the field. The research involved 54,424 authors, who collectively contributed 104,750 author appearances. Single-author articles involved 503 unique authors, further emphasizing the importance of collaboration. On average, each author contributed 0.336 papers, with an average of 5.73 co-authors per paper and an international collaboration rate of 39.1%. Overall, these data underscore that research on vegetation spatiotemporal changes and their driving forces is a rapidly growing field, marked by strong multidisciplinary and international collaboration trends.
Table 5.
The authors ranked in the first ten with the highest H-Index rankings.
3.6. Most Influential Papers
To determine the most influential papers in the field of vegetation spatiotemporal dynamics and driving factors, we analyzed the most globally cited documents and the most locally cited documents within our dataset. These papers represent key contributions to the development and dissemination of this research area.
Table 6 highlights the top 10 locally cited papers in our dataset. These papers demonstrate significant influence within the context of this specific research domain, often addressing key regional challenges or advancing specific methodologies. Table 7 lists the top 10 globally cited papers within the analyzed dataset. These papers reflect high impact on the international research community, providing foundational theories, methodologies, and findings relevant to the study of vegetation spatiotemporal dynamics.
Table 6.
Top ten papers based on the local citation score.
Table 7.
Top ten papers with the highest citations globally.
The most cited article in the NDVI research field is Parmesan and Yohe [51], with 7675 global citations, which laid the foundation for NDVI’s application in ecological research by highlighting the profound impact of climate change on ecosystems. Another highly cited study, Menzel et al. [52], with 2313 global citations, advanced NDVI-based vegetation phenology studies, emphasizing its role in long-term ecological monitoring. Zhou et al. [53] further contributed by examining spatiotemporal patterns of NDVI and its application in atmospheric-ecological interactions, receiving 1192 global citations. These foundational studies set the stage for subsequent methodological advancements, such as the integration of NDVI with remote sensing, climate modeling, and phenology-based predictions. For example, White et al. [54] and Jeong [55] explored NDVI’s responsiveness to climatic variations, further validating its role in global change research. Recent studies have expanded upon these works by incorporating artificial intelligence and multi-sensor data fusion, enhancing the scalability and predictive accuracy of NDVI applications. Collectively, these high-impact publications have significantly shaped the evolution of NDVI research from single-variable analyses to comprehensive, multidimensional approaches that integrate climate, vegetation, and human influences.
3.7. Historical and Current Research Hotspot Analysis
Keyword frequency analysis (Figure 8) reveals the core themes and research hotspots in the field of vegetation spatiotemporal changes and driving forces. “Climate-change”, with a frequency of 5932 occurrences, ranks as the top keyword, indicating that the influence exerted by global climate change on vegetation evolution and ecosystem services is a primary focus in this field. Additionally, “climate”, appearing 1320 times, further emphasizes the overarching concern with climatic factors. These studies encompass both the global effects of climate pattern changes on vegetation cover and ecosystem functions and regional studies on how extreme weather events influence local vegetation structure and biological productivity. The keyword “vegetation”, with 2608 occurrences, ranks second and, combined with “dynamics” (1942 occurrences) and “variability” (1803 occurrences), highlights the attention given to the chronological and geospatial dynamics of vegetation variations and their impact factors. This reflects the scientific community’s broad interest in ecosystem stability, resilience, and adaptability. Furthermore, temperature (1800 occurrences) and precipitation (1340 occurrences), as critical climatic variables affecting vegetation dynamics, along with “responses” (1473 occurrences), illustrate the feedback mechanisms of ecosystems to climate change, such as shifts in carbon sink capacities and adaptations in vegetation functionality. “Time-series”, with 1364 occurrences, underscores that time series analysis has developed into a mainstream approach for capturing long-lasting trends in vegetation evolution and their temporal drivers. The keyword “impacts” (1515 occurrences) further emphasizes the multidimensional effects of climate change and driving mechanisms on vegetation and ecosystems, including the complex interactions between human activities and natural factors in driving vegetation dynamics. These high-frequency keywords illustrate the evolution of vegetation dynamics research from traditional single-climate-variable impact analysis to multidimensional modeling approaches. This shift particularly highlights the importance of climate-vegetation interactions and region-specific studies, as reflected in the emergence of regional keywords such as “loess plateau” and “china”, which underscore the value of geographic-specific research. Despite existing data limitations, such as inconsistent spatial and temporal resolutions, sensor biases, and challenges in model validation [69], the integration of remote sensing technologies [41,70], machine learning1054 [71,72,73], and time series analysis is emerging as an effective approach for monitoring vegetation dynamics. These advancements will facilitate the investigation of interactions among climate change, vegetation responses, and human activities, providing scientific support for policymakers and robust strategies to address global ecological and environmental changes.
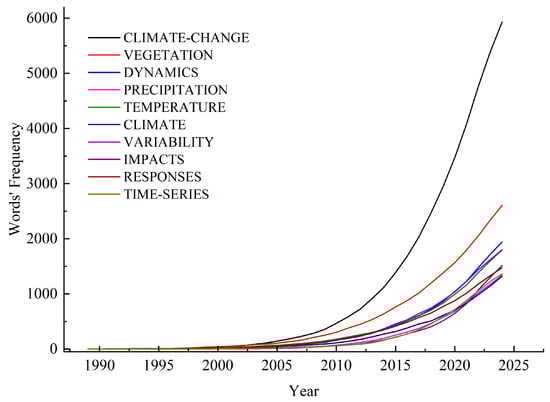
Figure 8.
Trends in the frequency of key terms in vegetation dynamics and drivers research (1989–2024).
This study analyzes author keywords from research papers on vegetation spatiotemporal changes and driving forces between 1989 and 2024, revealing research hotspots and their evolution trends (Figure 9). On the X-axis, years are represented, while the Y-axis shows keywords; the size of the dots indicates the number of papers associated with each keyword. Green dots represent the first quartile year (Q1) when a keyword appeared, red dots indicate the third quartile year (Q3), and blue dots signify the median year. High-frequency keywords such as “climate change [2,74,75]”, “vegetation [12,17,48]”, “dynamics [76]”, “variability [77]”, and “impacts [5]” highlight the significance of climate change and its related effects in vegetation research. From a temporal perspective, research hotspots have transitioned from focusing on the singular impacts of climate change to exploring complex climate-vegetation interactions and human activity-driven mechanisms. “Climate change” has been a central theme since 1994 [78], while “vegetation” frequently appeared from 2015 to 2022 [79,80,81], underscoring the sustained focus on vegetation dynamics. Keywords like “carbon-dioxide [82]” and “net primary production [83,84]” further indicate that research on carbon cycling and vegetation feedback mechanisms to climate has become a critical direction, reflecting a deepening of ecological process studies under the global climate change framework. Regional keywords such as “loess plateau [42,85]”, “northern Alaska [86]”, and “China [75,81]” have shown significant growth in recent years, highlighting the increasing importance of regional studies. This trend emphasizes the critical role of geographic contexts in understanding vegetation changes and their driving forces and underscores the unique value of regional-scale research in global change studies. The frequent mention of “loess plateau”, referring to China’s Loess Plateau, indicates significant growth in studies related to soil erosion, vegetation restoration, and ecosystem services in this region. Additionally, data-driven and technology-enabled research has accelerated in recent years. For example, “dataset [87,88]” emerged as a research hotspot starting in 2020, reflecting the crucial role of data resources in supporting large-scale analyses and dynamic monitoring. Advances in remote sensing technology have made keywords such as “use/land cover changes [89]” recent research focal points, underscoring the central role of land use changes in understanding vegetation dynamics. Furthermore, the appearance of keywords like “ecosystem water [90]” and “associations [91]” suggests growing interest in the hydrological functions of ecosystems and interactions among biological entities, offering new entry points for ecological research from interdisciplinary perspectives. The prominence of “long-term [22,88]” indicates a focus on long-term ecological monitoring, while “interannual variability” reflects the mainstreaming of studies on the interannual-scale influence of climate variations on vegetation evolution. The keyword “simulated environmental-change” highlights the extensive use of simulation studies for understanding future scenarios and predicting ecosystem responses. The analysis of keywords reveals continuous advancements in theoretical frameworks, regional applications, and technical methodologies in vegetation spatiotemporal changes and driving forces research, offering important directions for future studies. This progress not only deepens ecological understanding of global change but also provides insights for scientists exploring complex interactions within ecosystems.
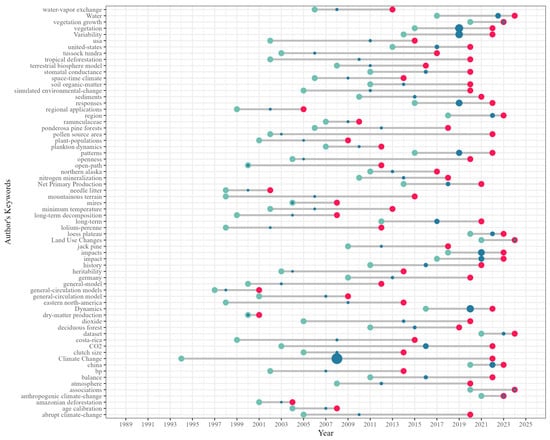
Figure 9.
Trends in author keywords from 1989 to 2024. (The grey line represents the range between the start year (Year_Q1) and end year (Year_Q3) for each term, indicating the span of years in which the term was most frequently used. The red dot marks the latest year (Year_Q3) when the term’s frequency peaked, while the green dot represents the earliest year (Year_Q1) the term appeared. The blue dot denotes the median year (Year_Median), reflecting the central tendency of the term’s usage over time).
3.8. Limitations and Future Directions
However, this study has several limitations that should be noted. First, the exclusive reliance on WOS database may introduce selection bias, as it excludes relevant publications indexed in other databases such as Scopus or Google Scholar [92]. Future research could mitigate this limitation by conducting multi-database bibliometric analyses, thereby ensuring a more comprehensive and representative assessment of the literature. Second, bibliometric methodologies predominantly emphasize citation-based metrics, which may not always serve as definitive indicators of scientific impact. As a result, emerging research areas with relatively low citation counts may be underrepresented, despite their potential significance. Additionally, this study ranks national research productivity (Figure 4) based on absolute publication counts, without normalization for population size or research investment. This approach may systematically favor large-population or high-budget countries while underrepresenting the proportional contributions of smaller nations. To address these issues, future studies should consider incorporating qualitative expert evaluations to complement quantitative bibliometric findings, as well as adopting standardized indicators such as publications per capita, publications per unit of GDP, or publications per unit of research funding. These measures would provide a more balanced and nuanced perspective on global research trends. Third, WOS primarily indexes English-language publications, which may lead to an underrepresentation of significant contributions published in other languages. Subsequent investigations need pay attention to the integration of multilingual datasets so as to enhance the inclusivity and comprehensiveness of bibliometric analyses.
Future research should focus on the following directions: (1) establishing an integrated global-to-regional research framework to deepen cross-scale analyses of vegetation dynamics. This can be enhanced by incorporating multi-database bibliometric analysis (e.g., Web of Science, Scopus, Google Scholar) to ensure a more comprehensive literature review and broader research coverage; (2) strengthening interdisciplinary collaboration to explore the complex interactions among climate change, vegetation responses, and human activities. Incorporating expert opinions through Delphi surveys or structured interviews can complement bibliometric findings and provide deeper qualitative insights; (3) promoting the integration of remote sensing technologies with artificial intelligence to develop efficient analytical methods and enhance dynamic monitoring capabilities; and (4) emphasizing long-term ecological monitoring and forecasting to provide theoretical support for addressing global ecological changes. In summary, the field of vegetation spatiotemporal changes and their driving forces is undergoing rapid development. Through a systematic bibliometric analysis, this study has summarized key issues and research frontiers, providing a foundation for the planning of future research directions. This work not only contributes to a deeper understanding of vegetation dynamics and their driving forces but also offers valuable scientific references for the sustainable management of global ecosystems and policy making.
4. Conclusions
This study systematically analyzed the research landscape and trends related to vegetation spatiotemporal changes and their driving forces from 1989 to 2024, revealing the core hotspots and developmental pathways in this field. The findings demonstrate that vegetation dynamics and their driving mechanisms are pivotal topics in ecology and global change research. Since 2010, the number of publications has shown explosive growth, with an average annual growth rate of 17.62%, reflecting the scientific community’s heightened attention and investment in this area. Previous studies have explored vegetation-climate interactions based on bibliometric analyses, providing valuable insights into the impact of climate change on vegetation dynamics. For example, Afuye et al. [93] and Li et al. [94] conducted comprehensive reviews on this topic using bibliometric techniques. These studies have extensively examined the driving effects of climate factors, such as temperature and precipitation, on vegetation changes. However, despite their significant contributions to understanding climate-driven vegetation dynamics, they primarily focused on climatic factors, particularly the direct effect on vegetation dynamics by temperature and precipitation. In contrast, our study adopts a broader perspective by incorporating not only climate change but also other potential driving forces, such as human activities. This multidimensional analytical approach enables a more comprehensive understanding of vegetation dynamics in the context of both natural and anthropogenic influences. Furthermore, our research examines a longer time span (1987–2024), which provides a more complete picture of long-term vegetation trends compared to previous studies. Therefore, our study provides a fresh perspective for the interactions between climate change and vegetation dynamics, and furthermore supplements and expands previous bibliometric analyses by encompassing multiple driving forces and an extended temporal scale.
In terms of research themes, “climate-change” stands out as the core keyword, underscoring the profound impacts of climate change on vegetation dynamics and ecosystem services. Related keywords such as “vegetation”, “dynamics”, and “variability” further highlight the focus on the spatial and temporal dynamics of vegetation. Key climatic variables (e.g., temperature and precipitation) and human drivers (e.g., land use change) have been identified as major factors influencing vegetation dynamics, while time-series analysis and remote sensing technologies have emerged as primary research tools. From the perspective of academic contributions, China, the United States, and Germany are the main research forces in this field. China’s research output has grown significantly since 2013, surpassing that of the United States in total volume. However, its average citation count remains lower than that of Western countries, indicating that the international impact of Chinese research still requires enhancement. The United States continues to dominate in terms of international collaboration and high-quality publications. Among institutions, the Chinese Academy of Sciences (CAS) exhibits exceptional research productivity, while the United States Department of Agriculture (USDA) and the French National Centre for Scientific Research (CNRS) played significant roles in the early stages of research. Regarding research hotspots, the evolution of high-frequency keywords reveals a transition from single-variable studies to multi-scale, multidimensional analyses of driving forces. The rise of regional studies, demonstrated through the common occurrence of geographic keywords including “Loess Plateau” and “China”, highlights the importance of specific ecological regions in understanding vegetation dynamics under the context of global change. Furthermore, emerging technologies such as remote sensing and machine learning, along with the application of datasets, have further advanced the scalability and precision of vegetation studies.
Overall, this study systematically reviews the research trends, key methodologies, and emerging topics in vegetation spatiotemporal dynamics and their driving forces, providing valuable insights for future research in this field.
Author Contributions
Conceptualization, D.D., J.S. and D.G.; methodology, D.D., J.S. and T.S.; software, D.D. and J.C.; formal analysis, D.D. and Y.F.; data curation, D.D., D.G. and J.C.; writing—original draft preparation, D.D.; writing—review and editing, Y.F. and J.S.; visualization, T.S. and D.D.; supervision, J.S. and Y.F.; project administration, J.S. and Y.F.; funding acquisition, J.S. and Y.F. All authors have read and agreed to the published version of the manuscript.
Funding
This research was funded by the JST SPRING (grant number JPMJSP2136), JSPS KAKENHI (grant number JP21H05179), Wenzhou Major Science and Technology Innovation Project (grant number ZN2024003), National Key Research and Development Project (grant number 2024001305), and Cangnan County Modern Agricultural Industry Enhancement Project (grant number 2024CNYJY08).
Data Availability Statement
Data will be made available on request.
Acknowledgments
We appreciate the constructive suggestions and comments from the editor and anonymous reviewers.
Conflicts of Interest
The authors declare that they have no known competing financial interests or personal relationships that could have appeared to influence the work reported in this paper.
References
- Feng, H.; Kang, P.; Deng, Z.; Zhao, W.; Hua, M.; Zhu, X.; Wang, Z. The Impact of Climate Change and Human Activities to Vegetation Carbon Sequestration Variation in Sichuan and Chongqing. Environ. Res. 2023, 238, 117138. [Google Scholar] [CrossRef] [PubMed]
- Zhang, H.; Li, L.; Zhao, X.; Chen, F.; Wei, J.; Feng, Z.; Hou, T.; Chen, Y.; Yue, W.; Shang, H.; et al. Changes in Vegetation NDVI and Its Response to Climate Change and Human Activities in the Ferghana Basin from 1982 to 2015. Remote Sens. 2024, 16, 1296. [Google Scholar] [CrossRef]
- Dong, D.; Zhang, R.; Guo, W.; Gong, D.; Zhao, Z.; Zhou, Y.; Xu, Y.; Fujioka, Y. Assessing Spatiotemporal Dynamics of Net Primary Productivity in Shandong Province, China (2001–2020) Using the CASA Model and Google Earth Engine: Trends, Patterns, and Driving Factors. Remote Sens. 2025, 17, 488. [Google Scholar] [CrossRef]
- Kyaw, K.T.W.; Ota, T.; Mizoue, N. Geographical Factors Trump Community Factors in Deforestation Risk in Two Watershed Conservation Forests in Myanmar. Forests 2021, 12, 541. [Google Scholar] [CrossRef]
- Yan, Y.; Wu, C.; Wen, Y. Determining the Impacts of Climate Change and Urban Expansion on Net Primary Productivity Using the Spatio-Temporal Fusion of Remote Sensing Data. Ecol. Indic. 2021, 127, 107737. [Google Scholar] [CrossRef]
- Ma, X.; Zhang, P.; Yang, L.; Qi, Y.; Liu, J.; Liu, L.; Fan, X.; Hou, K. Assessing the Relative Contributions, Combined Effects and Multiscale Uncertainty of Future Land Use and Climate Change on Water-Related Ecosystem Services in Southwest China Using a Novel Integrated Modelling Framework. Sustain. Cities Soc. 2024, 106, 105400. [Google Scholar] [CrossRef]
- Adeyeri, O.E.; Zhou, W.; Ndehedehe, C.E.; Wang, X. Global Vegetation, Moisture, Thermal and Climate Interactions Intensify Compound Extreme Events. Sci. Total Environ. 2024, 912, 169261. [Google Scholar] [CrossRef]
- Xiao, Y.; Huang, M.; Xie, G.; Zhen, L. Evaluating the Impacts of Land Use Change on Ecosystem Service Values under Multiple Scenarios in the Hunshandake Region of China. Sci. Total Environ. 2022, 850, 158067. [Google Scholar] [CrossRef]
- Gong, D.; Huang, M.; Ge, Y.; Zhu, D.; Chen, J.; Chen, Y.; Zhang, L.; Hu, B.; Lai, S.; Lin, H. Revolutionizing Ecological Security Pattern with Multi-Source Data and Deep Learning: An Adaptive Generation Approach. Ecol. Indic. 2025, 173, 113315. [Google Scholar] [CrossRef]
- Teo, H.C.; Tan, N.H.L.; Zheng, Q.; Lim, A.J.Y.; Sreekar, R.; Chen, X.; Zhou, Y.; Sarira, T.V.; De Alban, J.D.T.; Tang, H.; et al. Uncertainties in Deforestation Emission Baseline Methodologies and Implications for Carbon Markets. Nat. Commun. 2023, 14, 8277. [Google Scholar] [CrossRef]
- Zhai, M.; Tian, X.; Liu, Z.; Zhao, Y.; Deng, Y.; Yang, W. Advancing Just Transition: The Role of Biomass Co-Firing in Emission Reductions and Employment for Coal Regions. Sustain. Energy Technol. Assess. 2025, 75, 104246. [Google Scholar] [CrossRef]
- Yang, S.; Zhao, Y.; Yang, D.; Lan, A. Analysis of Vegetation NDVI Changes and Driving Factors in the Karst Concentration Distribution Area of Asia. Forests 2024, 15, 398. [Google Scholar] [CrossRef]
- Zhang, Y.; Zhang, L.; Wang, J.; Dong, G.; Wei, Y. Quantitative Analysis of NDVI Driving Factors Based on the Geographical Detector Model in the Chengdu-Chongqing Region, China. Ecol. Indic. 2023, 155, 110978. [Google Scholar] [CrossRef]
- Ren, Z.; Tian, Z.; Wei, H.; Liu, Y.; Yu, Y. Spatiotemporal Evolution and Driving Mechanisms of Vegetation in the Yellow River Basin, China during 2000–2020. Ecol. Indic. 2022, 138, 108832. [Google Scholar] [CrossRef]
- Jia, L.; Yu, K.; Li, Z.; Li, P.; Xu, G.; Cong, P.; Li, B. Spatiotemporal Pattern of NPP and Its Response to Climatic Factors in the Yangtze River Economic Belt. Ecol. Indic. 2024, 162, 112017. [Google Scholar] [CrossRef]
- Shi, S.; Zhu, L.; Luo, Z.; Qiu, H. Quantitative Analysis of the Contributions of Climatic and Anthropogenic Factors to the Variation in Net Primary Productivity, China. Remote Sens. 2023, 15, 789. [Google Scholar] [CrossRef]
- Xu, B.; Li, J.; Liu, Y.; Zhang, T.; Luo, Z.; Pei, X. Disentangling the Response of Vegetation Dynamics to Natural and Anthropogenic Drivers over the Qinghai-Tibet Plateau Using Dimensionality Reduction and Structural Equation Model. For. Ecol. Manag. 2024, 554, 121677. [Google Scholar] [CrossRef]
- Xu, Y.; Li, X.; Du, H.; Mao, F.; Zhou, G.; Huang, Z.; Zhu, D.; Chen, Q.; Ni, C.; Guo, K. Spatiotemporal Variation in Bamboo Solar-Induced Chlorophyll Fluorescence (SIF) in China Based on the Global Orbiting Carbon Observatory-2 (OCO-2) Carbon Satellite and Study on the Response to Climate and Terrain. GISci. Remote Sens. 2023, 60, 2253952. [Google Scholar] [CrossRef]
- Huo, H.; Sun, C. Spatiotemporal Variation and Influencing Factors of Vegetation Dynamics Based on Geodetector: A Case Study of the Northwestern Yunnan Plateau, China. Ecol. Indic. 2021, 130, 108005. [Google Scholar] [CrossRef]
- Shi, J.; Zhang, P.; Liu, Y.; Tian, L.; Cao, Y.; Guo, Y.; Li, J.; Wang, Y.; Huang, J.; Jin, R.; et al. Study on Spatiotemporal Changes of Wetlands Based on PLS-SEM and PLUS Model: The Case of the Sanjiang Plain. Ecol. Indic. 2024, 169, 112812. [Google Scholar] [CrossRef]
- Chen, X.; Wang, Y.; Chen, Y.; Fu, S.; Zhou, N. NDVI-Based Assessment of Land Degradation Trends in Balochistan, Pakistan, and Analysis of the Drivers. Remote Sens. 2023, 15, 2388. [Google Scholar] [CrossRef]
- Yu, H.; Yang, Q.; Jiang, S.; Zhan, B.; Zhan, C. Detection and Attribution of Vegetation Dynamics in the Yellow River Basin Based on Long-Term Kernel NDVI Data. Remote Sens. 2024, 16, 1280. [Google Scholar] [CrossRef]
- Pritchard, A. Statistical Bibliography or Bibliometrics? J. Doc. 1969, 25, 348–349. [Google Scholar]
- Tan, F.; Yang, J.; Zhou, C. Historical Review and Synthesis of Global Carbon Neutrality Research: A Bibliometric Analysis Based on R-Tool. J. Clean. Prod. 2024, 449, 141574. [Google Scholar] [CrossRef]
- Marzi, G.; Balzano, M.; Caputo, A.; Pellegrini, M.M. Guidelines for Bibliometric-Systematic Literature Reviews: 10 Steps to Combine Analysis, Synthesis and Theory Development. Int. J. Manag. Rev. 2025, 27, 81–103. [Google Scholar] [CrossRef]
- Zhang, K.; Liu, F.; Zhang, H.; Duan, Y.; Luo, J.; Sun, X.; Wang, M.; Ye, D.; Wang, M.; Zhu, Z.; et al. Trends in Phytoremediation of Heavy Metals-Contaminated Soils: A Web of Science and CiteSpace Bibliometric Analysis. Chemosphere 2024, 352, 141293. [Google Scholar] [CrossRef]
- Ab Rashid, M.F. How to Conduct a Bibliometric Analysis Using R Packages: A Comprehensive Guidelines / Muhammad Fakruhayat Ab Rashid. J. Tour. Hosp. Culin. Arts 2023, 15, 24–39. [Google Scholar]
- Estrada, A. Exploring Gender Disparities in Collaboration Networks: An Analysis of h-Indices and Collaborator Proximity. Master’s Thesis, California Polytechnic State University, San Luis Obispo, CA, USA, 2024. [Google Scholar]
- Aria, M.; Cuccurullo, C. Bibliometrix: An R-Tool for Comprehensive Science Mapping Analysis. J. Informetr. 2017, 11, 959–975. [Google Scholar] [CrossRef]
- Derviş, H. Bibliometric Analysis Using Bibliometrix an R Package. J. Scientometr. Res. 2020, 8, 156–160. [Google Scholar] [CrossRef]
- Abafe, E.A.; Bahta, Y.T.; Jordaan, H. Exploring Biblioshiny for Historical Assessment of Global Research on Sustainable Use of Water in Agriculture. Sustainability 2022, 14, 10651. [Google Scholar] [CrossRef]
- Ggplot2—Wickham—2011—WIREs Computational Statistics—Wiley Online Library. Available online: https://wires.onlinelibrary.wiley.com/doi/abs/10.1002/wics.147 (accessed on 15 March 2025).
- Seifert, E. OriginPro 9.1: Scientific Data Analysis and Graphing Software—Software Review. J. Chem. Inf. Model. 2014, 54, 1552. Available online: https://pubs.acs.org/doi/abs/10.1021/ci500161d (accessed on 15 March 2025). [CrossRef] [PubMed]
- Xu, Y.; Yang, Y.; Chen, X.; Liu, Y. Bibliometric Analysis of Global NDVI Research Trends from 1985 to 2021. Remote Sens. 2022, 14, 3967. [Google Scholar] [CrossRef]
- Xu, T.; Wang, F.; Yi, Q.; Xie, L.; Yao, X. A Bibliometric and Visualized Analysis of Research Progress and Trends in Rice Remote Sensing over the Past 42 Years (1980–2021). Remote Sens. 2022, 14, 3607. [Google Scholar] [CrossRef]
- Garfield, E. Introducing Citation Classics. The Human Side of Scientific Reports. Essays Inf. Sci. 1977, 3, 5–7. [Google Scholar]
- WALKER, G.K. Weather Sensitivity of Western Canada Wheat Yield, 1900–1988. Can. J. Soil. Sci. 1989, 69, 857–865. [Google Scholar] [CrossRef]
- Payette, S.; Filion, L.; Delwaide, A.; Bégin, C. Reconstruction of Tree-Line Vegetation Response to Long-Term Climate Change. Nature 1989, 341, 429–432. [Google Scholar] [CrossRef]
- Rogelj, J.; Den Elzen, M.; Höhne, N.; Fransen, T.; Fekete, H.; Winkler, H.; Schaeffer, R.; Sha, F.; Riahi, K.; Meinshausen, M. Paris Agreement Climate Proposals Need a Boost to Keep Warming Well below 2 °C. Nature 2016, 534, 631–639. [Google Scholar] [CrossRef]
- World Health Organization. Health in 2015: From MDGs, Millennium Development Goals to SDGs, Sustainable Development Goals; World Health Organization: Geneva, Switzerland, 2015; ISBN 978-92-4-156511-0.
- Gu, C.; Clevers, J.G.P.W.; Liu, X.; Tian, X.; Li, Z.; Li, Z. Predicting Forest Height Using the GOST, Landsat 7 ETM+, and Airborne LiDAR for Sloping Terrains in the Greater Khingan Mountains of China. ISPRS J. Photogramm. Remote Sens. 2018, 137, 97–111. [Google Scholar] [CrossRef]
- Zhang, Y.; Chen, Y. Research Trends and Areas of Focus on the Chinese Loess Plateau: A Bibliometric Analysis during 1991–2018. CATENA 2020, 194, 104798. [Google Scholar] [CrossRef]
- Halisçelik, E.; Soytas, M.A. Sustainable Development from Millennium 2015 to Sustainable Development Goals 2030. Sustain. Dev. 2019, 27, 545–572. [Google Scholar] [CrossRef]
- Endsley, K.A.; Zhao, M.; Kimball, J.S.; Devadiga, S. Continuity of Global MODIS Terrestrial Primary Productivity Estimates in the VIIRS Era Using Model-Data Fusion. J. Geophys. Res. Biogeosci. 2023, 128, e2023JG007457. [Google Scholar] [CrossRef]
- Mao, D.; Wang, Z.; Luo, L.; Ren, C. Integrating AVHRR and MODIS Data to Monitor NDVI Changes and Their Relationships with Climatic Parameters in Northeast China. Int. J. Appl. Earth Obs. Geoinf. 2012, 18, 528–536. [Google Scholar] [CrossRef]
- Zhao, Z.; Xu, L.; Ma, C.; Wang, H.; Guo, W.; Wang, C. Quantitative Estimation of Net Primary Productivity Using an Improved Casa Model with Landsat Time Series Data: A Case Study of Central Plains; Elsevier: Amsterdam, The Netherlands, 2024. [Google Scholar]
- Gorelick, N.; Hancher, M.; Dixon, M.; Ilyushchenko, S.; Thau, D.; Moore, R. Google Earth Engine: Planetary-Scale Geospatial Analysis for Everyone. Remote Sens. Environ. 2017, 202, 18–27. [Google Scholar] [CrossRef]
- Dong, H.; Liu, Y.; Cui, J.; Zhu, M.; Ji, W. Spatial and Temporal Variations of Vegetation Cover and Its Influencing Factors in Shandong Province Based on GEE. Environ. Monit. Assess. 2023, 195, 1023. [Google Scholar] [CrossRef]
- Cao, C.; Suttmeier, R.P.; Simon, D.F. China’s 15-Year Science and Technology Plan. Phys. Today 2006, 59, 38–43. [Google Scholar] [CrossRef]
- Wei, F.; Zhang, G. Measuring the Scientific Publications of Double First-Class Universities from Mainland China. Learn. Publ. 2020, 33, 230–244. [Google Scholar] [CrossRef]
- Parmesan, C.; Yohe, G. A Globally Coherent Fingerprint of Climate Change Impacts across Natural Systems. Nature 2003, 421, 37–42. [Google Scholar] [CrossRef]
- Menzel, A.; Sparks, T.H.; Estrella, N.; Koch, E.; Aasa, A.; Ahas, R.; Alm-Kübler, K.; Bissolli, P.; Braslavská, O.; Briede, A.; et al. European Phenological Response to Climate Change Matches the Warming Pattern. Glob. Change Biol. 2006, 12, 1969–1976. [Google Scholar] [CrossRef]
- Zhou, L.; Tucker, C.J.; Kaufmann, R.K.; Slayback, D.; Shabanov, N.V.; Myneni, R.B. Variations in Northern Vegetation Activity Inferred from Satellite Data of Vegetation Index during 1981 to 1999. J. Geophys. Res. 2001, 106, 20069–20083. [Google Scholar] [CrossRef]
- White, M.A.; De Beurs, K.M.; Didan, K.; Inouye, D.W.; Richardson, A.D.; Jensen, O.P.; O’Keefe, J.; Zhang, G.; Nemani, R.R.; Van Leeuwen, W.J.D.; et al. Intercomparison, Interpretation, and Assessment of Spring Phenology in North America Estimated from Remote Sensing for 1982–2006. Glob. Change Biol. 2009, 15, 2335–2359. [Google Scholar] [CrossRef]
- Jeong, S.-J.; Ho, C.-H.; Gim, H.-J.; Brown, M.E. Phenology Shifts at Start vs. End of Growing Season in Temperate Vegetation over the Northern Hemisphere for the Period 1982–2008. Glob. Change Biol. 2011, 17, 2385–2399. [Google Scholar] [CrossRef]
- Piao, S.; Fang, J.; Zhou, L.; Ciais, P.; Zhu, B. Variations in Satellite-Derived Phenology in China’s Temperate Vegetation. Glob. Change Biol. 2006, 12, 672–685. [Google Scholar] [CrossRef]
- Richardson, A.D.; Black, T.A.; Ciais, P.; Delbart, N.; Friedl, M.A.; Gobron, N.; Hollinger, D.Y.; Kutsch, W.L.; Longdoz, B.; Luyssaert, S.; et al. Influence of Spring and Autumn Phenological Transitions on Forest Ecosystem Productivity. Philos. Trans. R. Soc. B 2010, 365, 3227–3246. [Google Scholar] [CrossRef]
- Wu, D.; Zhao, X.; Liang, S.; Zhou, T.; Huang, K.; Tang, B.; Zhao, W. Time-Lag Effects of Global Vegetation Responses to Climate Change. Glob. Change Biol. 2015, 21, 3520–3531. [Google Scholar] [CrossRef]
- Fensholt, R.; Langanke, T.; Rasmussen, K.; Reenberg, A.; Prince, S.D.; Tucker, C.; Scholes, R.J.; Le, Q.B.; Bondeau, A.; Eastman, R.; et al. Greenness in Semi-Arid Areas across the Globe 1981–2007—An Earth Observing Satellite Based Analysis of Trends and Drivers. Remote Sens. Environ. 2012, 121, 144–158. [Google Scholar] [CrossRef]
- Beck, P.S.A.; Atzberger, C.; Høgda, K.A.; Johansen, B.; Skidmore, A.K. Improved Monitoring of Vegetation Dynamics at Very High Latitudes: A New Method Using MODIS NDVI. Remote Sens. Environ. 2006, 100, 321–334. [Google Scholar] [CrossRef]
- Reichstein, M.; Falge, E.; Baldocchi, D.; Papale, D.; Aubinet, M.; Berbigier, P.; Bernhofer, C.; Buchmann, N.; Gilmanov, T.; Granier, A.; et al. On the Separation of Net Ecosystem Exchange into Assimilation and Ecosystem Respiration: Review and Improved Algorithm. Glob. Change Biol. 2005, 11, 1424–1439. [Google Scholar] [CrossRef]
- Choat, B.; Jansen, S.; Brodribb, T.J.; Cochard, H.; Delzon, S.; Bhaskar, R.; Bucci, S.J.; Feild, T.S.; Gleason, S.M.; Hacke, U.G.; et al. Global Convergence in the Vulnerability of Forests to Drought. Nature 2012, 491, 752–755. [Google Scholar] [CrossRef]
- Kay, J.E.; Deser, C.; Phillips, A.; Mai, A.; Hannay, C.; Strand, G.; Arblaster, J.M.; Bates, S.C.; Danabasoglu, G.; Edwards, J.; et al. The Community Earth System Model (CESM) Large Ensemble Project: A Community Resource for Studying Climate Change in the Presence of Internal Climate Variability. Bull. Am. Meteorol. Soc. 2015, 96, 1333–1349. [Google Scholar] [CrossRef]
- Zhu, Z.; Piao, S.; Myneni, R.B.; Huang, M.; Zeng, Z.; Canadell, J.G.; Ciais, P.; Sitch, S.; Friedlingstein, P.; Arneth, A.; et al. Greening of the Earth and Its Drivers. Nat. Clim. Change 2016, 6, 791–795. [Google Scholar] [CrossRef]
- Gasparrini, A.; Guo, Y.; Hashizume, M.; Lavigne, E.; Zanobetti, A.; Schwartz, J.; Tobias, A.; Tong, S.; Rocklöv, J.; Forsberg, B.; et al. Mortality Risk Attributable to High and Low Ambient Temperature: A Multicountry Observational Study. Lancet 2015, 386, 369–375. [Google Scholar] [CrossRef] [PubMed]
- Liang, C.; Schimel, J.P.; Jastrow, J.D. The Importance of Anabolism in Microbial Control over Soil Carbon Storage. Nat. Microbiol. 2017, 2, 17105. [Google Scholar] [CrossRef]
- Phillips, O.L.; Aragão, L.E.O.C.; Lewis, S.L.; Fisher, J.B.; Lloyd, J.; López-González, G.; Malhi, Y.; Monteagudo, A.; Peacock, J.; Quesada, C.A.; et al. Drought Sensitivity of the Amazon Rainforest. Science 2009, 323, 1344–1347. [Google Scholar] [CrossRef] [PubMed]
- Leakey, A.D.B.; Ainsworth, E.A.; Bernacchi, C.J.; Rogers, A.; Long, S.P.; Ort, D.R. Elevated CO2 Effects on Plant Carbon, Nitrogen, and Water Relations: Six Important Lessons from FACE. J. Exp. Bot. 2009, 60, 2859–2876. [Google Scholar] [CrossRef]
- Zhu, Z.; Li, X.; Zhai, J.; Hu, H. PODB: A Learning-Based Polarimetric Object Detection Benchmark for Road Scenes in Adverse Weather Conditions. Inf. Fusion. 2024, 108, 102385. [Google Scholar] [CrossRef]
- Zhuang, J.; Bao, W.; Su, W. Current Situation and Prospect of Agricultural Remote Sensing Technology Application. Agric. Outlook 2024, 20, 68–74. [Google Scholar]
- Zhu, H.; Zhang, P.; Wang, N.; Zhang, F.; Ma, W.; Wen, F.; Li, M.; Wang, Y.; Fan, X.; Hou, K.; et al. Investigating the Multiscale Associations between Urban Landscape Patterns and PM1 Pollution in China Using a New Combined Framework. J. Clean. Prod. 2024, 456, 142306. [Google Scholar] [CrossRef]
- Wu, W.; Qiu, X.; Song, S.; Huang, X.; Ma, F.; Xiao, J. Prompt Categories Cluster for Weakly Supervised Semantic Segmentation. arXiv 2024, arXiv:2412.13823. [Google Scholar]
- Zhao, R.; Mao, K.; Guo, Z.; Hu, Z.; Xu, L.; Ge, F. Application Review of Deep Belief Networks in the Field of Agriculture Information. Agric. Outlook 2024, 20, 82–86. [Google Scholar]
- Wu, Y.; Yang, J.; Li, S.; Guo, C.; Yang, X.; Xu, Y.; Yue, F.; Peng, H.; Chen, Y.; Gu, L.; et al. NDVI-Based Vegetation Dynamics and Their Responses to Climate Change and Human Activities from 2000 to 2020 in Miaoling Karst Mountain Area, SW China. Land 2023, 12, 1267. [Google Scholar] [CrossRef]
- Chen, M.; Xue, Y.; Xue, Y.; Peng, J.; Guo, J.; Liang, H. Assessing the Effects of Climate and Human Activity on Vegetation Change in Northern China. Environ. Res. 2024, 247, 118233. [Google Scholar] [CrossRef] [PubMed]
- Huang, M.; Gong, D.; Zhang, L.; Lin, H.; Chen, Y.; Zhu, D.; Xiao, C.; Altan, O. Spatiotemporal Dynamics and Forecasting of Ecological Security Pattern under the Consideration of Protecting Habitat: A Case Study of the Poyang Lake Ecoregion. Int. J. Digit. Earth 2024, 17, 2376277. [Google Scholar] [CrossRef]
- Liu, S.; Liu, L.; Li, J.; Zhou, Q.; Ji, Y.; Lai, W.; Long, C. Spatiotemporal Variability of Human Disturbance Impacts on Ecosystem Services in Mining Areas. Sustainability 2022, 14, 7547. [Google Scholar] [CrossRef]
- Fennessey, N.M.; Kirshen, P.H. Evaporation and Evapotranspiration under Climate Change in New England. J. Water Resour. Plan. Manag. 1994, 120, 48–69. [Google Scholar] [CrossRef]
- Li, X.; Zhang, K.; Li, X. Responses of Vegetation Growth to Climate Change over the Tibetan Plateau from 1982 to 2018. Environ. Res. Commun. 2022, 4, 045007. [Google Scholar] [CrossRef]
- Zhao, Y.; Xiao, L.; Tang, Y.; Yao, X.; Cheng, T.; Zhu, Y.; Cao, W.; Tian, Y. Spatio-Temporal Change of Winter Wheat Yield and Its Quantitative Responses to Compound Frost-Dry Events—An Example of the Huang-Huai-Hai Plain of China from 2001 to 2020. Sci. Total Environ. 2024, 940, 173531. [Google Scholar] [CrossRef]
- Zhang, Y.; Zhang, Y.; Liu, Z.; Bi, S.; Zheng, Y. Analysis of Vertical Distribution Changes and Influencing Factors of Tropospheric Ozone in China from 2005 to 2020 Based on Multi-Source Data. Int. J. Environ. Res. Public Health 2022, 19, 12653. [Google Scholar] [CrossRef]
- Chen, X.; Zhang, X.; Zhang, Y.; Booth, T.; He, X. Changes of Carbon Stocks in Bamboo Stands in China during 100 Years. For. Ecol. Manag. 2009, 258, 1489–1496. [Google Scholar] [CrossRef]
- Chen, S.; Jiang, H.; Chen, Y.; Cai, Z. Spatial-Temporal Patterns of Net Primary Production in Anji (China) between 1984 and 2014. Ecol. Indic. 2020, 110, 105954. [Google Scholar] [CrossRef]
- Mayer, A.; Kaufmann, L.; Kalt, G.; Matej, S.; Theurl, M.C.; Morais, T.G.; Leip, A.; Erb, K.-H. Applying the Human Appropriation of Net Primary Production Framework to Map Provisioning Ecosystem Services and Their Relation to Ecosystem Functioning across the European Union. Ecosyst. Serv. 2021, 51, 101344. [Google Scholar] [CrossRef]
- Wang, Z.; Fu, B.; Wu, X.; Li, Y.; Feng, Y.; Wang, S.; Wei, F.; Zhang, L. Vegetation Resilience Does Not Increase Consistently with Greening in China’s Loess Plateau. Commun. Earth Environ. 2023, 4, 336. [Google Scholar] [CrossRef]
- Arndt, K.A.; Santos, M.J.; Ustin, S.; Davidson, S.J.; Stow, D.; Oechel, W.C.; Tran, T.T.P.; Graybill, B.; Zona, D. Arctic Greening Associated with Lengthening Growing Seasons in Northern Alaska. Environ. Res. Lett. 2019, 14, 125018. [Google Scholar] [CrossRef]
- Bai, J.; Wu, G.; Mao, Y. Significant Disparity in Spatiotemporal Changes of Terrestrial Evapotranspiration across Reanalysis Datasets in China from 1982 to 2020. Remote Sens. 2023, 15, 4522. [Google Scholar] [CrossRef]
- Bei, X.; Yao, Y.; Zhang, L.; Xu, T.; Jia, K.; Zhang, X.; Shang, K.; Xu, J.; Chen, X. Long-Term Spatiotemporal Dynamics of Terrestrial Biophysical Variables in the Three-River Headwaters Region of China from Satellite and Meteorological Datasets. Remote Sens. 2019, 11, 1633. [Google Scholar] [CrossRef]
- Lwin, K.K.; Ota, T.; Shimizu, K.; Mizoue, N. A Country-Scale Analysis Revealed Effective Land-Use Zoning Affecting Forest Cover Changes in Myanmar. J. For. Res. 2020, 25, 389–396. [Google Scholar] [CrossRef]
- Ji, Y.; Zeng, S.; Tang, Q.; Yan, L.; Wu, S.; Fan, Y.; Chen, J. Spatiotemporal Variations and Driving Factors of China’s Ecosystem Water Use Efficiency. Ecol. Indic. 2023, 148, 110077. [Google Scholar] [CrossRef]
- Sánchez, N.; Plaza, J.; Criado, M.; Pérez-Sánchez, R.; Gómez-Sánchez, M.Á.; Morales-Corts, M.R.; Palacios, C. The Second Derivative of the NDVI Time Series as an Estimator of Fresh Biomass: A Case Study of Eight Forage Associations Monitored via UAS. Drones 2023, 7, 347. [Google Scholar] [CrossRef]
- Zhang, H.; Huang, M.; Qing, X.; Li, G.; Tian, C. Bibliometric Analysis of Global Remote Sensing Research during 2010–2015. ISPRS Int. J. Geo-Inf. 2017, 6, 332. [Google Scholar] [CrossRef]
- Afuye, G.A.; Kalumba, A.M.; Busayo, E.T.; Orimoloye, I.R. A Bibliometric Review of Vegetation Response to Climate Change. Environ. Sci. Pollut. Res. 2022, 29, 18578–18590. [Google Scholar] [CrossRef]
- Li, X.; Wen, Z.; Cui, L.; Chen, Y.; Li, T.; Liu, H.; Xu, Z.; Cui, X.; Song, X. Quantitatively Mapping the Research Status and Trends of Vegetation Responses to Climate Change with Bibliometric Analysis. J. Soils Sediments 2023, 23, 2963–2979. [Google Scholar] [CrossRef]
Disclaimer/Publisher’s Note: The statements, opinions and data contained in all publications are solely those of the individual author(s) and contributor(s) and not of MDPI and/or the editor(s). MDPI and/or the editor(s) disclaim responsibility for any injury to people or property resulting from any ideas, methods, instructions or products referred to in the content. |
© 2025 by the authors. Licensee MDPI, Basel, Switzerland. This article is an open access article distributed under the terms and conditions of the Creative Commons Attribution (CC BY) license (https://creativecommons.org/licenses/by/4.0/).