Article

Integrated Multi-Omics Analysis Reveals Photosynthetic Acclimation and Metabolic Reprogramming in Populus ussuriensis kom. Under Cold Stress

1
State Key Laboratory of Tree Genetics and Breeding, Northeast Forestry University, Harbin 150040, China
2
School of Pharmacy, Harbin University of Commerce, Harbin 150076, China
3
Institute of Forestry Science of Heilongjiang Province, Harbin 150081, China
*
Authors to whom correspondence should be addressed.
Forests 2025, 16(4), 660; https://doi.org/10.3390/f16040660
Submission received: 3 March 2025 / Revised: 28 March 2025 / Accepted: 8 April 2025 / Published: 10 April 2025
(This article belongs to the Special Issue Genomic Analysis of Growth and Stress Adaptation in Forest Trees)

Abstract

:
Low temperature is a major stress that severely affects tree growth and development. Despite the fact that the molecular mechanisms behind cold tolerance and associated regulatory networks in these trees remain largely unexplored, we conducted a study to examine the overall changes in metabolites and regulatory pathways of Populus ussuriensis kom. when exposed to cold stress, utilizing a comprehensive multi-omics approach. Transcriptomes exposed to cold stress reveal that most of the candidate genes related to the Calvin–Benson–Bassham cycle and flavonoid synthesis were upregulated. Joint analysis revealed that within 6–48 h of low-temperature treatment, differential genes (such as PAL and CHS) in the flavonoid biosynthesis pathway and metabolites (such as quercetin) were significantly upregulated, indicating a positive correlation under short-term stress. However, prolonged treatment (72 h) may trigger metabolic feedback, leading to a decrease in flavonoid content. In addition, the measurements of gas exchange and metabolite assays of P. ussuriensis showed that photosynthetic acclimation led to a change in the sugar accumulation and starch degradation in response to low temperature, indicating that extensive changes occurred due to the cold and improved tolerance in P. ussuriensis. This study provides a new basis for future studies on the molecular mechanism of cold tolerance at the transcriptional and metabolic levels.

1. Introduction

Plants are frequently exposed to environmental stresses in both natural and horticultural settings, which can consequently restrict their growth [1]. Understanding the tolerance mechanisms in the physiological processes in response to environmental stresses is particularly pivotal for plants. In these cases, plants consistently modify their metabolism in various ways to cope with environmental stresses at the biochemical level, with photosynthesis being one of the most prevalent methods [1]. Photosynthesis serves as the energy foundation for nearly all life on Earth, transforming solar energy into chemical energy. At low temperatures, plants can adjust their photosynthetic characteristics to adapt to the growth temperatures for temperature acclimation [2]. Although low temperatures consistently hinder photosynthesis, plants can make flexible adjustments that enhance their photosynthetic activity in response to colder growth temperatures [3]. Therefore, enhancing photosynthesis efficiency is likely an effective approach to increase low-temperature tolerance for plants.
Photosynthesis is highly sensitive to environmental changes. In response to these changes, the composition of photosynthetic machinery can be adjusted, a process referred to as photosynthetic acclimation. To adapt to a low-temperature environment, plants enhance their growth by increasing the levels of key photosynthetic enzymes, such as Rubisco, sedoheptulose-1,7-bisphosphatase (SBPase), fructose-1,6-bisphosphatase (FBPase), etc., and promote sucrose synthesis [4]. In the Calvin cycle, Rubisco catalyzes the carboxylation of ribulose-1,5-bisphosphate (RuBP) by CO2 to form two molecules of 3-phosphoglyceric acid (PGA). The entire cycle is premised on the utilization of ATP as an energy source and the consumption of NADPH, which is produced by photosynthetic electron transportation in the thylakoid membranes to produce sugars and starch, so as to stimulate the regeneration of RuBP from PGA. However, identifying the key limiting steps in photosynthetic carbon assimilation under low-temperature stress (such as Rubisco activity and RuBP regeneration capacity) and their impact on the accumulation of metabolites (such as sucrose and starch dynamics) is crucial for elucidating the adaptation mechanisms of cold-tolerant species.
Chlorophyll, the most important and widely distributed pigment in the thylakoid membrane, plays a central role in plant photosynthesis. It primarily captures light energy for the antenna system and drives the photosynthetic reaction center, facilitating electron transfer through the electron transport chain [5]. Higher chlorophyll content is conducive to improvements in photosynthetic efficiency in plants. Flavonoids, acting as antioxidants and UV-shielding agents, can alleviate photoinhibition by scavenging reactive oxygen species (ROS), thereby indirectly maintaining chloroplast function [6]. Flavonoids, key metabolites in plant biochemistry, are crucial for various aspects of plant physiology, such as electron transfer, growth regulation, photosynthesis, and protection against infections. Furthermore, it has been reported that a specific relationship exists between flavonoid production and the rate of photosynthesis in plants [7]. Research indicates that the biosynthesis of flavonoids may influence the primary metabolism by competing for carbon sources (such as phenylalanine), thereby indirectly regulating the flow of photosynthetic carbon into secondary metabolism [8]. Chlorophylls and flavonoids were prioritized as key targets due to their critical roles in maintaining photosynthetic efficiency and mitigating oxidative damage under cold stress.
The popularization of sequencing technology has promoted the unprecedented development of omics [9]. Transcriptomics generally reveals changes in gene expression levels after transcription, but it does not effectively show the final changes that occur within organisms. On the other hand, metabolomics offers direct insight into the changes in metabolites within organisms. As a result, integrating transcriptomics and metabolomics strengthens the credibility of research outcomes [10]. It has been found that the upregulation or downregulation of differential genes (DEGs) in the plant hormone metabolism pathway promotes an increase in heterosis. For instance, in Arabidopsis thaliana L., the increased expression of the transcription factor PHYTOCHROME-INTERACTING FACTOR (PIF4) affects the auxin biosynthesis gene YUCCA8 and the auxin signaling gene IAA29, which could play a role in biomass heterosis [11]. In Betula platyphylla Sukaczev, the DEGs in the stems of BplMYB46-overexpressing (OE) and BplMYB46-silencing (SE) plants are enriched in metabolic pathways, secondary metabolite biosynthesis, plant hormone signal transduction, and phenylpropanoid and flavonoid biosynthesis [12]. Plants respond to abiotic stress at the molecular, cellular, physiological, and biochemical levels by altering gene expression, protein abundance, and the accumulation of metabolites. Multi-omics analysis is increasingly being used to reveal these biological processes.
Populus ussuriensis kom. is a cold-resistant, light-loving, mesophytic, wet, fast-growing tree species widely distributed in the eastern mountains of the three northeastern provinces of China, the Soviet Far East, and North Korea [13]. To understand the genetic characteristics and promote genomic and breeding studies of P. ussuriensis, we performed RNA-Seq and metabolite analysis to dissect the accumulation processes in P. ussuriensis in response to cold stress. This study focuses on the photosynthetic accumulation characteristics, providing novel insights into the cold-tolerance mechanisms of P. ussuriensis. Specifically, we investigated how reducing the chlorophyll and flavonoid content can enhance photosynthetic efficiency under conditions of cold stress.

2. Materials and Methods

2.1. Plant Materials and Cold Treatment

The 3-month-old wild-type Populus ussuriensis kom. plants were cultivated under the same conditions (16 h light of 70 µE m−2 s−1 and 8 h dark) at 25 ± 2 °C in the greenhouse of Northeast Forestry University, Harbin City, Heilongjiang Province, China. We divided these wild-type plants into two groups and cultured them for 6 h in 25 °C (room temperature) and 4 °C conditions, respectively. Fresh leaves from both the control samples (maintained at 25 °C) and the samples treated at 4 °C were collected simultaneously, subsequently frozen in liquid nitrogen, and stored in a laboratory freezer at −80 °C. These materials were utilized for transcriptomic and metabolomic analyses. Three-month-old P. ussuriensis cultured in an illumination incubator were used for nutrient metabolite determinations. Wild P. ussuriensis seedlings were treated under 4 °C and 25 °C temperature conditions for 0, 6, 12, 24, 48, and 72 h, respectively, and then the contents of various metabolites in the leaves, including starch, sugar, flavonoids, and photosynthetic parameters, were determined. Total flavonoid content was measured according to the method described by Pérez-Vicente et al. [14] with modifications. Three biological replicates were performed for each experiment, and all low-temperature-stressed plants were measured at 10 a.m. (e.g., plants in the 6 h treatment group were moved to the temperature control room at 4 a.m. on the same day; plants in the 12 h treatment group were moved to the temperature control room at 11 p.m. the previous day). Control plants (25 °C) were measured in parallel, allowing the comparison of control and experimental groups at the same time point and avoiding diurnal fluctuations in carbohydrates.

2.2. Full-Length cDNA Preparation and Sequencing

The RNA from leaves of P. ussuriensis treated at 4 °C and 25 °C was prepared, and the total RNA was extracted from fresh leaves, stems, and roots using the cetyl trimethylammonium bromide (CTAB) method [15]. The quality of the RNA was examined using an Agilent 2100 574 Bioanalyzer (Agilent Technologies, Santa Clara, CA, USA).
The purified RNA was reverse-transcribed into cDNA using the SMARTer PCR cDNA Synthesis Kit (Clontech, Mountain View, CA, USA). cDNA was amplified using the Kapa HiFi PCR kit (Kapa Biosystems, Wilmington, MA, USA).
Sequencing libraries were generated using the VAHTS Universal V6 RNA-seq Library Prep Kit for Illumina® (#NR604-02, New England Biolabs (NEB), Ipswich, MA, USA) and sequenced using the NovaSeq 6000 S4 Reagent Kit on the Illumina HiSeq X Ten platform (Illumina, San Diego, CA, USA) to generate 150 bp paired-end reads. StringTie (v2.2.3) was applied to assemble the mapped reads.
The assembled transcripts were then used to conduct transcript-based predictions with the PASA (v2.1.0) pipeline [16]. GlimmerHMM (v3.0.495) [17] and Augustus (v3.2.296) [18] were trained with genes from the PASA results and used for gene prediction, referred to as the Populus trichocarpa Torr. & Gray genome. The predicted genes were annotated by BLAST (v2.2.31) against the functional databases, including NCBI non-redundant Nr and Nt databases (http://www.ncbi.nlm.nih.gov, accessed on 12 March 2025), KOG (https://ftp.ncbi.nlm.nih.gov/pub/COG/KOG/, accessed on 18 February 2025), GO (https://www.uniprot.org/help/gene_ontology, accessed on 6 February 2025), KEGG (http://www.genome.jp/kegg, accessed on 1 April 2025), and TrEMBL (http://www.uniprot.org/, accessed on 6 February 2025).

2.3. Metabolites Analysis

Metabolite profiling followed established protocols [19,20]. Wild seedlings under the same growth conditions were divided into two groups and cultured at 4 °C and 25 °C for 6 h, respectively. Fresh leaves were then collected for metabolome analysis. The prepared samples were injected into ultra-high-performance liquid chromatography coupled with quadrupole time-of-flight mass spectrometry (UHPLC-QTOF-MS, Agilent Technologies lnc., Santa Clara, CA, USA) for analysis. Chromatographic separation was performed using an ACQUITY UPLC BEH C18 column (2.1 × 100 mm, 1.7 μm, Waters, Milford, MA, USA)), with the mobile phase consisting of 0.1% formic acid in water (A) and acetonitrile (B). The gradient elution program was as follows: 0–2 min 5% B, 2–10 min linear increase to 95% B, maintain for 2 min, and then equilibrate to the initial conditions. The mass spectrometry parameters were as follows: an electrospray ionization source (ESI), positive/negative ion mode switching, and a scan range of m/z 100–1500. Using MassLynx (v 4.2, Waters, Milford, MA, USA), we collected raw data through the Progenesis QI (v 2.0, Waters Corporation, Milford, MA, USA) software and performed peak data processing operations, such as extraction and peak alignment. Using the Progenesis QI software along with the METLIN database and a custom-built database, theoretical identification was conducted, with a mass number deviation of 100 ppm.

2.4. Integrated Metabolic Profiling and Transcriptional Analysis

Our integrated analysis of transcriptomic and metabolomic data revealed that DEGs and differentially accumulated metabolites from matched experimental groups were co-mapped onto KEGG pathway diagrams. Genes and related metabolic pathways were identified and further screened at the p < 0.05 level.

2.5. Nutrient Metabolite Determinations

The method for measuring soluble sugars was adapted from Durand et al. [21]. In summary, the ground leaves were mixed with 1.5 mL of extraction buffer (methanol: chloroform: water, 12:5:3) and shaken at 200 rpm for 10 min, followed by centrifugation at 11,000 rpm for 10 min. The resulting supernatant was washed twice with the extraction buffer and centrifuged again for 5 min at 6000 rpm. The supernatant containing soluble sugars was then collected and evaporated at 50 °C using a concentrator (MiVacQuattro; Genevac, Suffolk, UK). The soluble sugars were re-dissolved in 500 μL of water and quantified using the Suc/Fru/D-Glc Assay Kit (Megazyme, Wicklow, Ireland) following the manufacturer’s guidelines. Total starch was quantified enzymatically using the Megazyme Total Starch Assay Kit, AOAC method 996.11 (Megazyme). We accurately weighed 500 mg of each test sample, ground it, put it into a test tube in duplicate (one of which was the control), and recorded the exact weight. Then, 10 mL of the sodium acetate buffer containing 5 M calcium chloride was added to each tube, and the culture tube was heated for 5 s. Then, 0.1 mL of heat-stable alpha-amylase was added to the experimental group samples and 0.1 mL buffer was added to the control samples. After vortexing for 3 s, we removed the tube cover and placed it in a boiling-water bath for 5 min. We then closed the lid and vortexed the tube again. This process was repeated twice. The tube was removed from the boiling water and vortexed violently for 5 s. The tube was then placed in a 50 °C water bath and equilibrated for 5 min. Following that, 0.1 mL of amylglucosidase was added to the samples of the experimental group, and 0.1 mL of the buffer was added to the tubes of the control group. After 3 s, the tubes were placed in a 50 °C water bath and incubated for 30 min. We then removed the tube from the water bath and cooled it for 10 min at room temperature. The samples were centrifuged at 13,000 rpm for 5 min. The supernatant in a 1 mL centrifuge tube was then transferred to a tube containing 4 mL of buffer and mixed. The 0.1 mL mixed sample was then transferred to the bottom of the 16 × 120 nm glass tube and 3 mL of the GOPOD reagent was added to the glass tube. After 20 min of incubation at 50 °C, the absorbance of the solution was measured at a wavelength of 510 nm, using the control sample as a reference.
Total flavonoid content was measured according to the method described by Pérez-Vicente et al. [14] with modifications. The sample was mixed with 5% w/v NaNO2 in a sterile microplate. The plate was allowed to stand for 5 min and 2% w/v AlCl3 was added. Then, 1 M NaOH was added. After standing at room temperature for 10 min, the absorbance was measured at 415 nm. The quantification of quercetin was measured as an external standard curve. The bioaccessibility (%) was calculated as the total flavonoids in a dialyzed fraction divided by the initial methanolic extract.

2.6. Leaf Gas Exchange and Photosynthetic Pigments Measurements

An LI-6400XT portable photosynthesis system (Li-Cor Biosciences, Lincoln, NB, USA) was used for leaf gas exchange measurement. The net photosynthetic rate (PN), stomatal conductance (gs), and transpiration rate (E) were measured at a photosynthetic photon flux density (PPFD) of 1000 μmol m−2 s−1, and the CO2 concentration in the chamber was kept at 380 µmol mol−1 to match the ambient conditions between 09:00 and 11:00 in the morning. The temperature (4 °C) was set as a time series: 0, 6, 12, 24, 48, and 72 h. The control plants (25 °C) were also measured in parallel. During the measurement period, the plants in the low-temperature treatment group were kept in a low-temperature state to maintain their physiological status.
For the estimation of photosynthetic pigments, the chlorophyll content was measured as described by Chazaux et al. [22]. Fresh leaves of P. ussuriensis were collected with or without cold treatment (4 °C). In total, 0.5 g of fresh leaf samples were ground into powder. Then, 99% acetone was mixed with ethanol (2:1 v/v) and the samples via stirring for 1 min. After standing for 30 min in the freezer in the dark, they were centrifuged for 10 min at 2000 rpm. The absorbance of the solution was measured at wavelengths of 663 nm and 645 nm. The acetone/ethanol mixture (2:1 v/v) was used as the control.
The obtained values were substituted in the following formulas:
Chlorophyll a (mg/g) = (12.7 × A663) − (2.59 × A645)
Chlorophyll b (mg/g) = (22.9 × A645) − (4.7 × A663)
Note that A663 and A645 are the absorbance values measured from 663 nm and 645 nm, respectively.

2.7. RNA Extraction and RT-qPCR Analysis

Three-month-old wild Populus plants were subjected to low-temperature stress (4 °C) and room temperature (25 °C) treatments at different time points (0, 6, 12, 24, 48, and 72 h), followed by total RNA extraction using the cetyl trimethylammonium bromide (CTAB) method described by [23]. The extracted total RNA was reverse-transcribed using a reverse transcription system (Vazyme, Nanjing, China). We designed specific primers for PAL, 4CL, CHS, and F3H genes in P. ussuriensis via the NCBI website (https://www.ncbi.nlm.nih.gov/, accessed on 12 March 2025) and calculated their relative expression using RT-qPCR. The genes were selected based on their central roles in flavonoid biosynthesis and their significant upregulation in transcriptomic data (Supplementary Data S1). Their expression profiles are critical for linking transcriptional regulation to metabolite changes. RT-qPCR reactions were conducted on a Bio-Rad CFX96 real-time PCR system (Bio-Rad, Hercules, CA, USA) in a reaction mixture consisting of 10 μL of the Green One-Step qRT-PCR SuperMix (TransGene, Beijing, China), 8 μL of double-distilled water, 1 μL of a complementary DNA (cDNA) template, and 0.5 μL of each upstream and downstream primer. The Fold gene expression = 2−ΔΔCt method was used to quantify relative gene expression, and PuActin was selected as the internal control gene. Three biological replicates were performed.

2.8. Statistical Analysis

All data are presented as the mean ± standard deviation (SD) of three independent biological replicates. One-way ANOVA was performed on these replicates using SPSS (v22.0), followed by Duncan’s multiple-range test to assess significant differences (p < 0.05).

2.9. Data Availability

All relevant data can be found within the manuscript and its supporting materials. The RNA-seq data of transcriptomes have also been deposited in the SRA database under accession number PRJNA1002071.

3. Results

3.1. Transcriptome Sequencing and Differential Gene Annotation of Populus ussuriensis kom. Under Cold Stress

A total of 3846 differentially expressed genes (DEGs) were identified at 4 °C compared with room temperature, including 2485 upregulated genes and 1361 downregulated genes. There were more DEGs that were upregulated (Figure 1A, Supplementary Data S1). The enrichment barplot of the differential genes KEGG analysis indicated that these DEGs were involved in flavonoid biosynthesis, carbon fixation in photosynthetic organisms, and flavone and flavonol biosynthesis processes (Figure 1B). We then calculated the DEGs of these three pathways including photosynthesis, and most of the related DEGs were upregulated (Supplementary Table S1). We proposed that the global transcriptional regulation of stress-related genes might contribute to fine-tuning cold responses in P. ussuriensis.

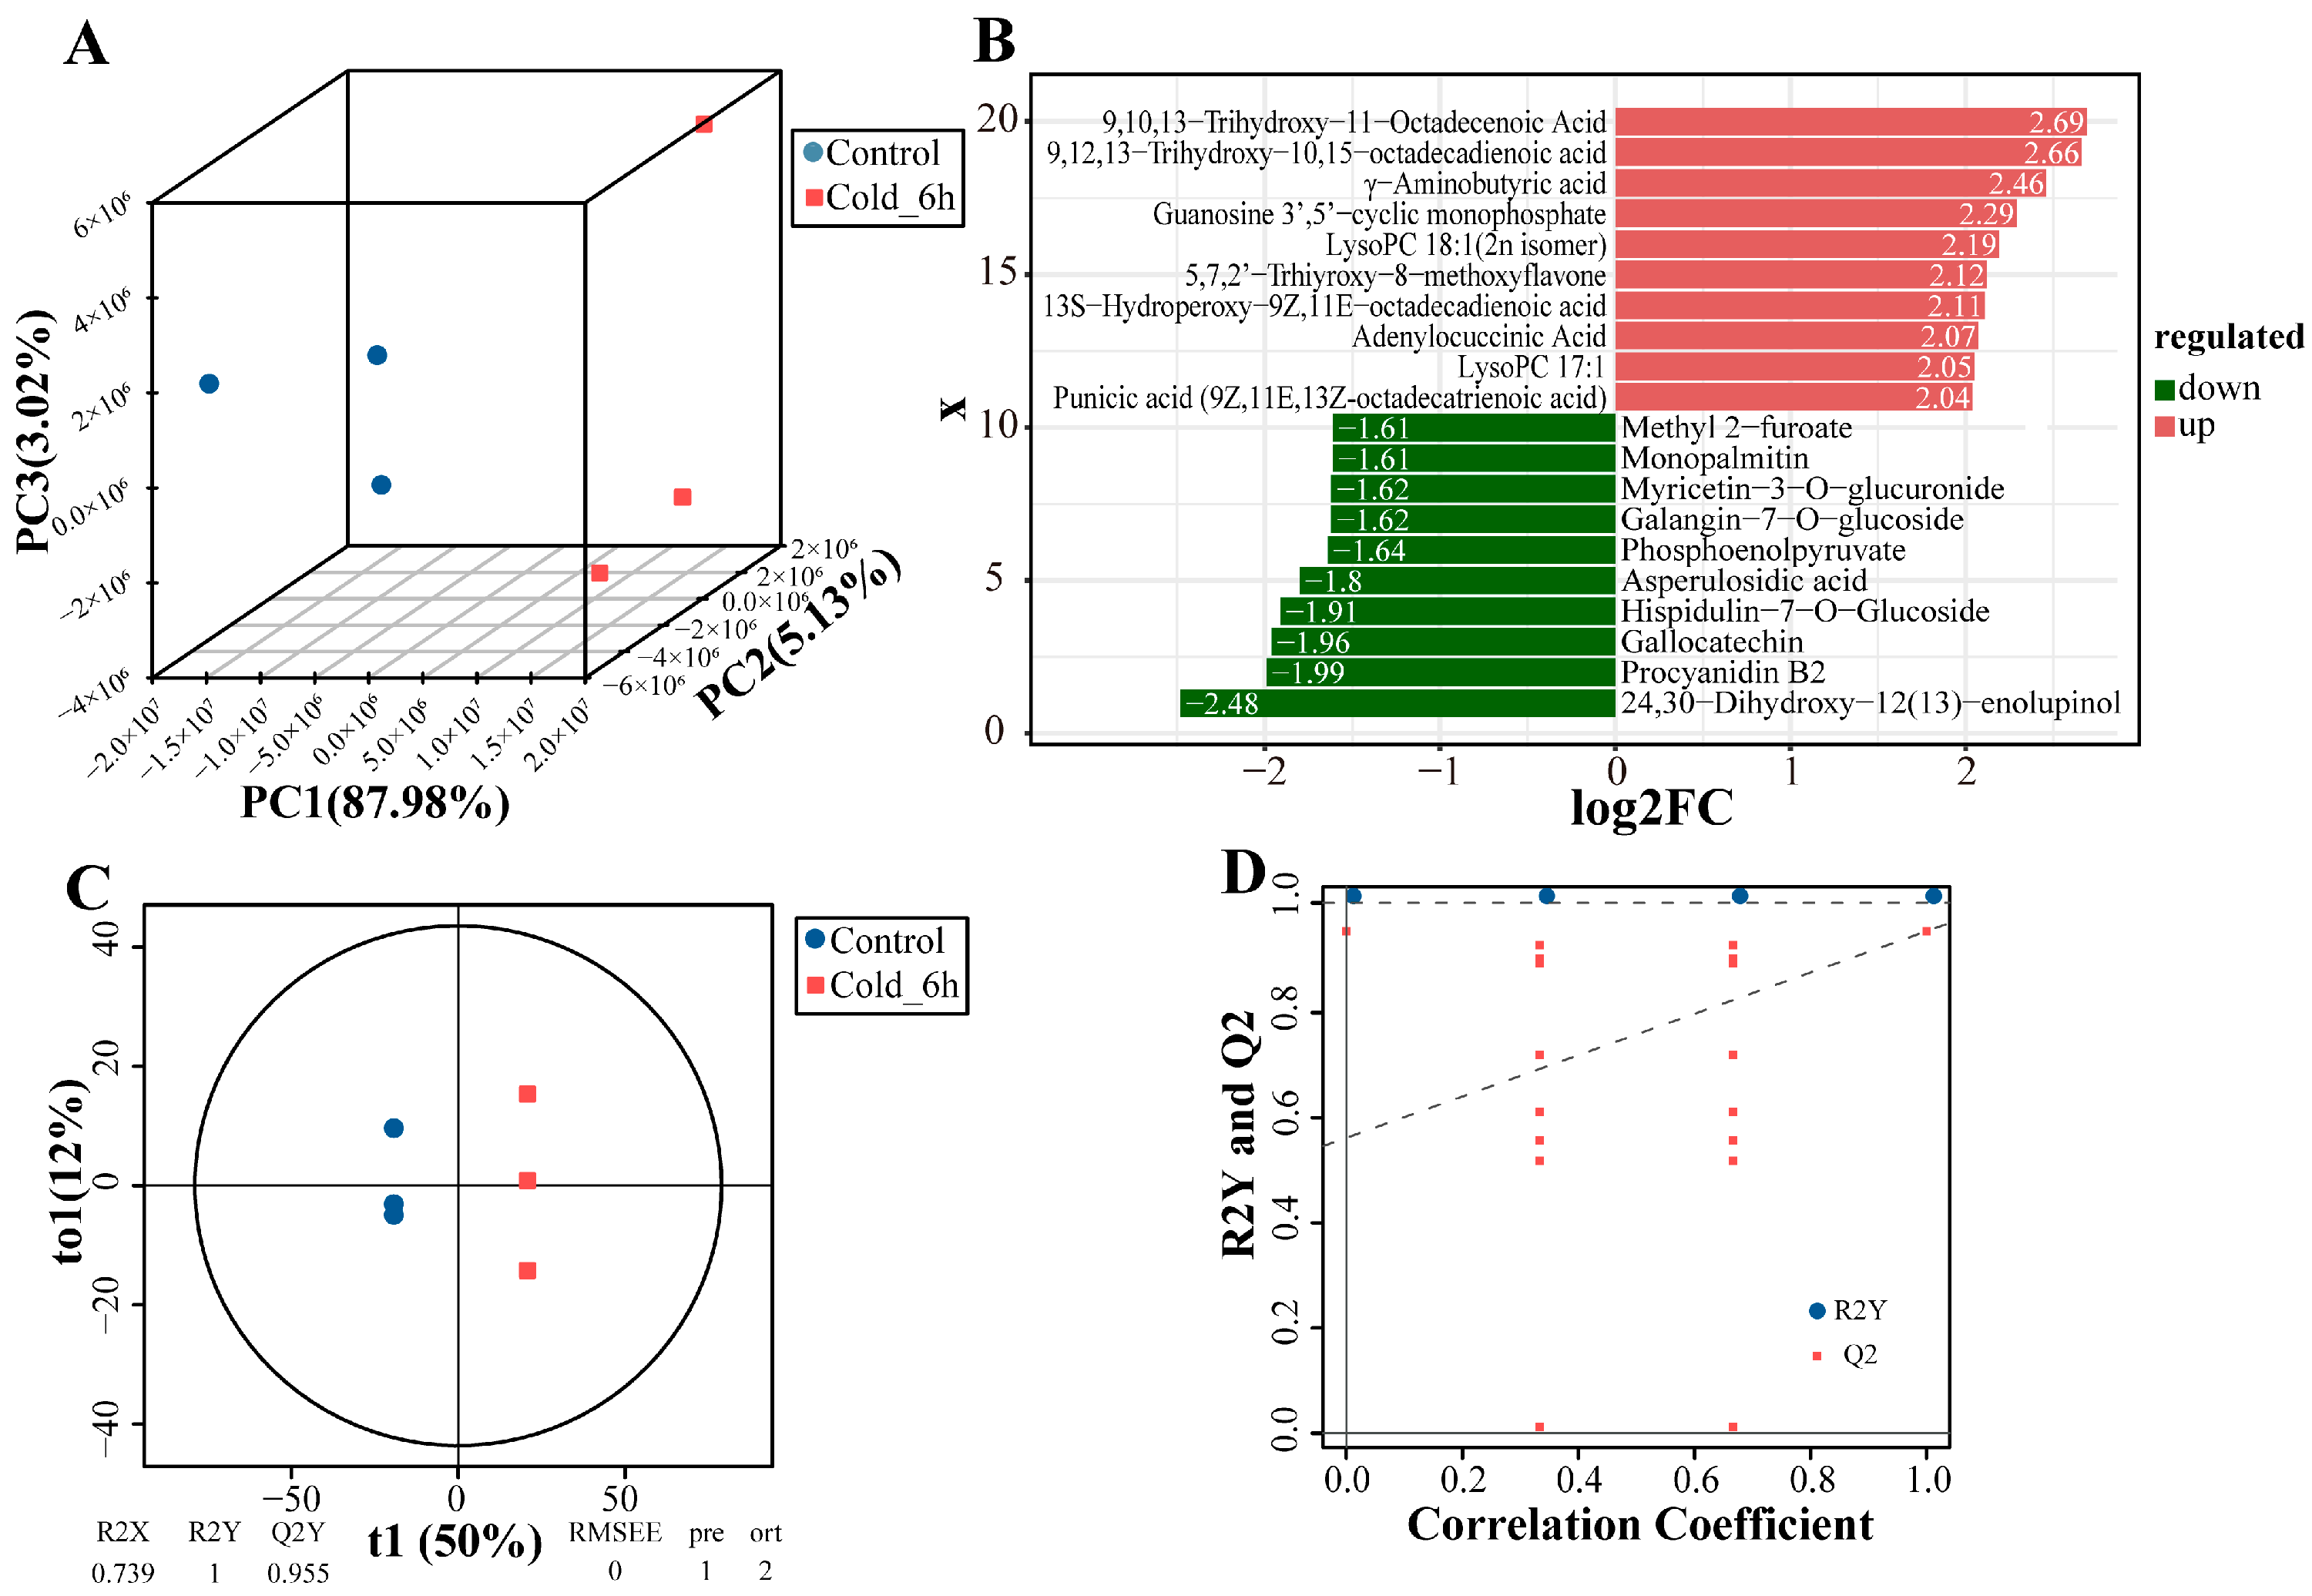
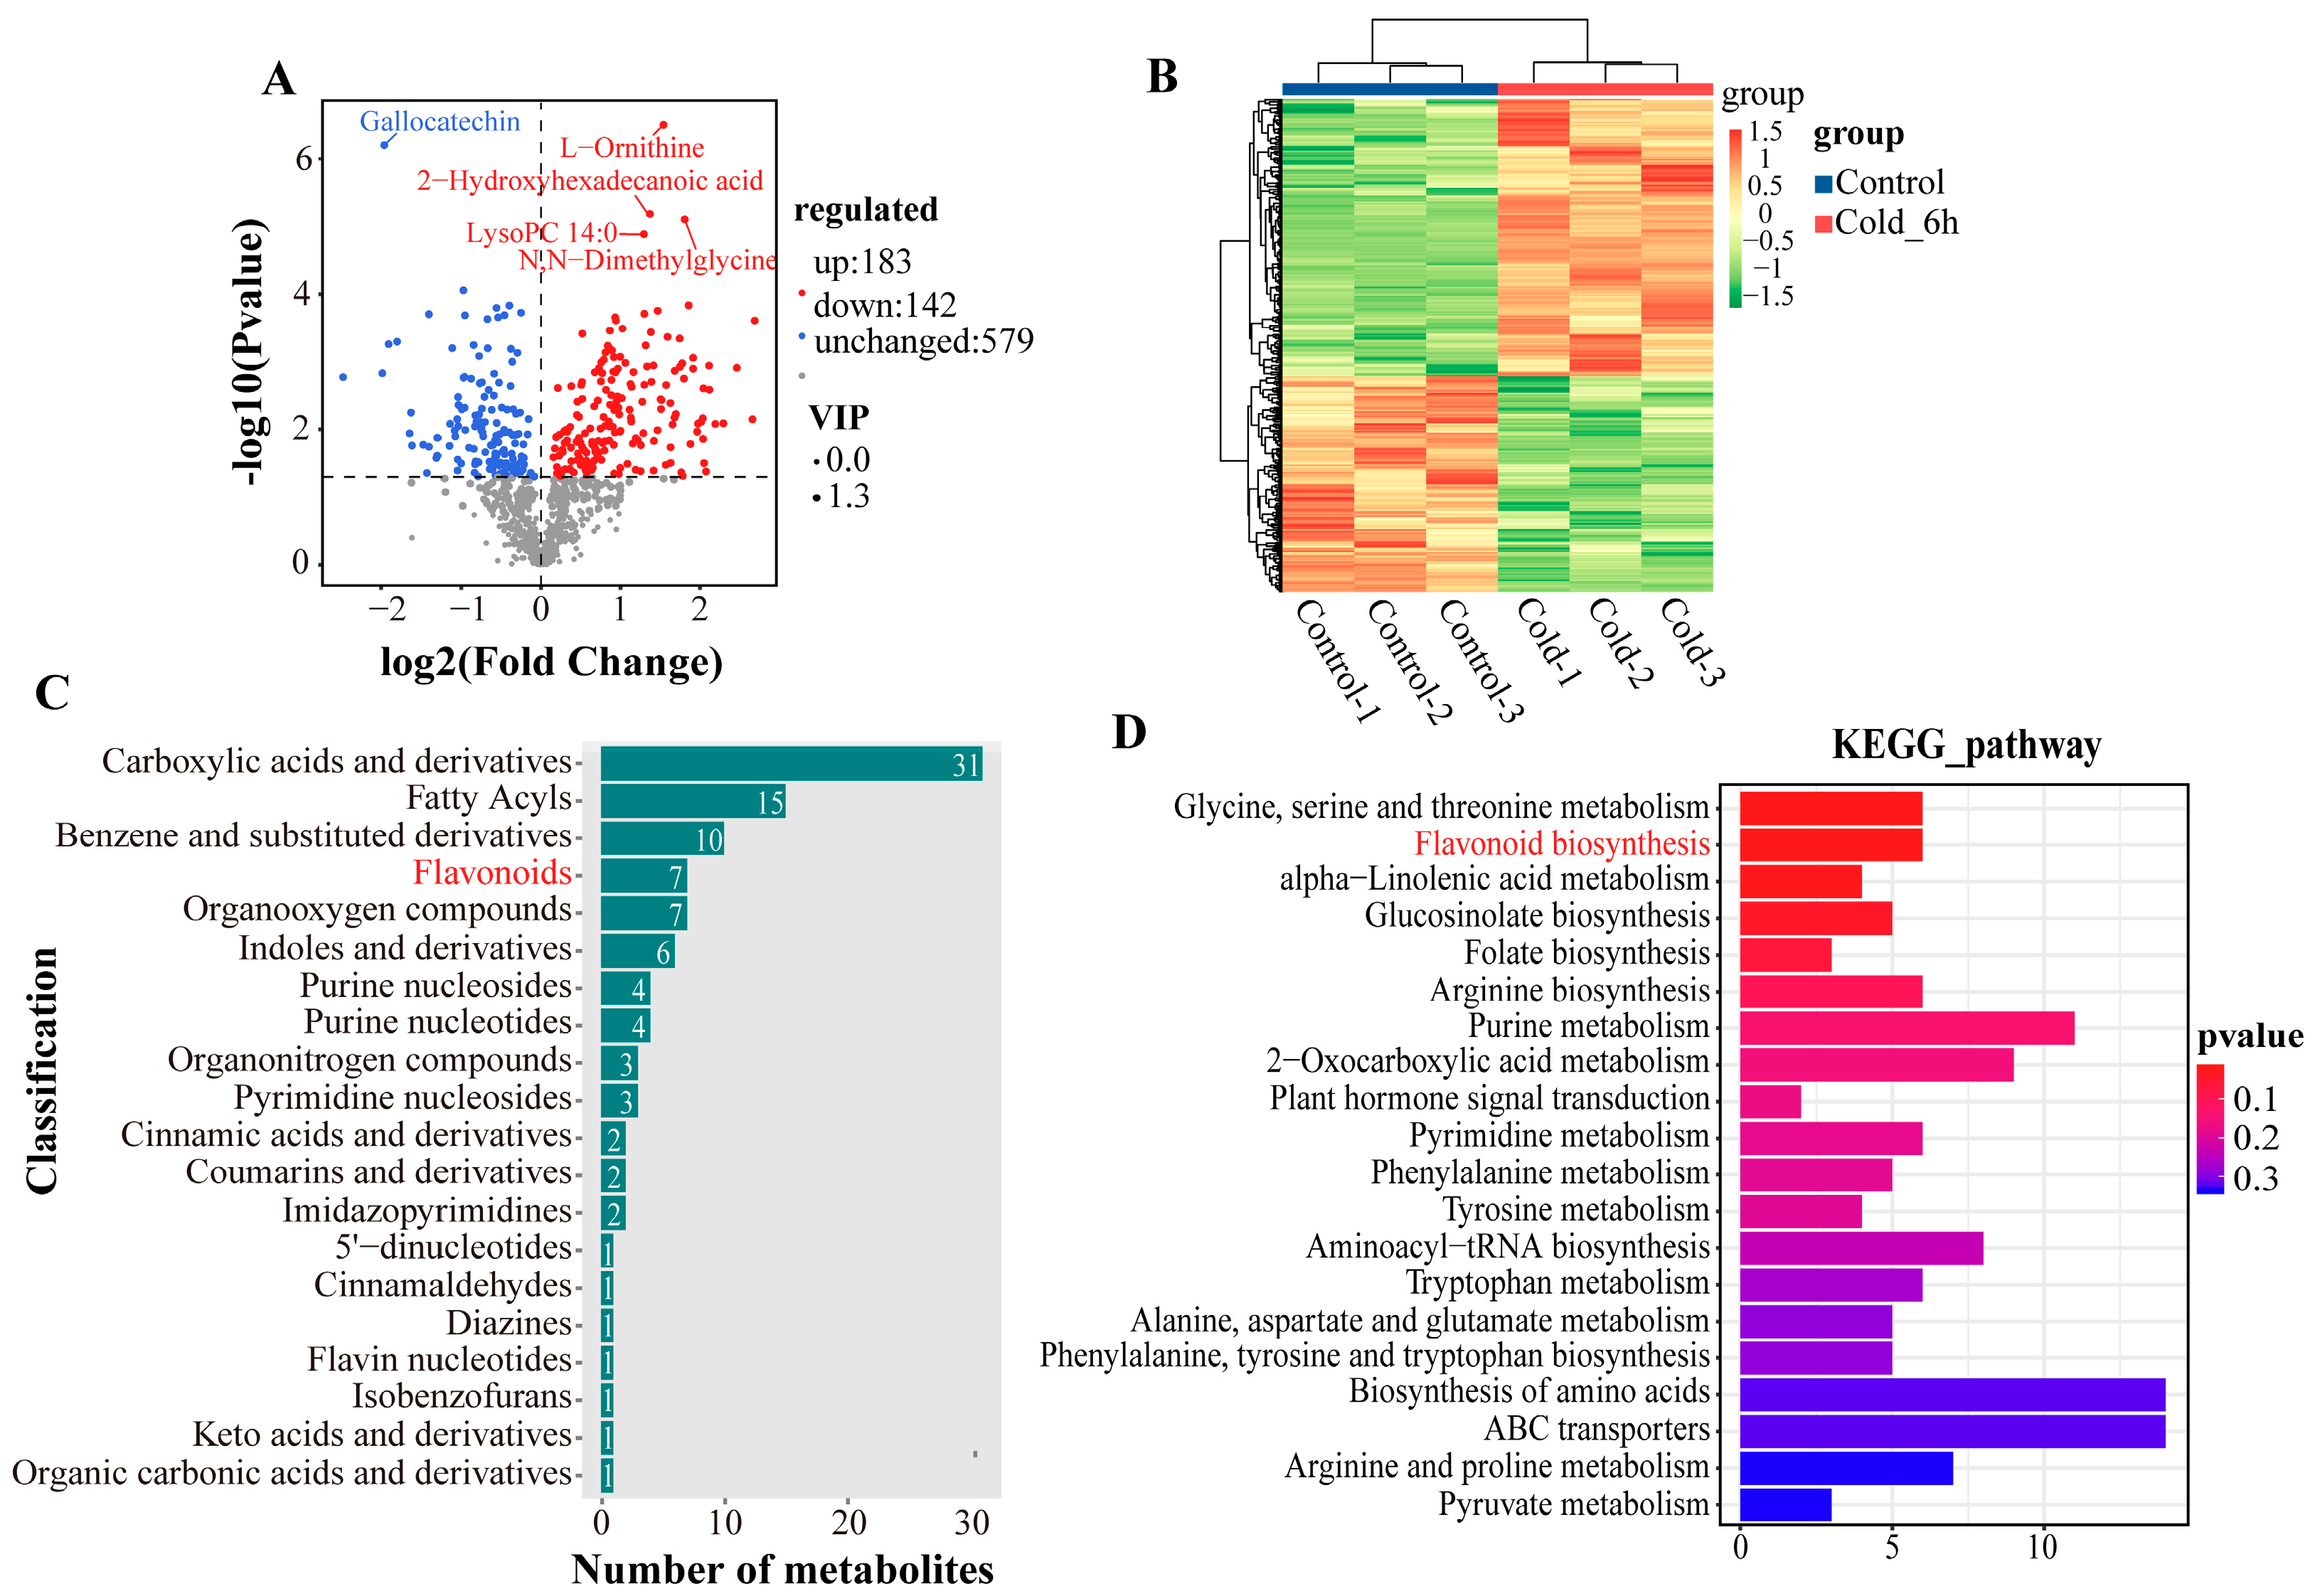
3.2. Metabolite Profiling and Differentially Changed Metabolites Identification of P. ussuriensis Under Cold Stress

To investigate how P. ussuriensis adapts to cold stress, metabolites were analyzed using the UPLC-MS/MS technique. The principal components of the PCA score plot were determined to be 87.98% for PC1, 5.13% for PC2, and 3.02% for PC3. The two groups, Cold_6 h and Control, were distinctly separated, with three biological replicates from each group clustering together (Figure 2A). This indicates that the PCA score plot demonstrates the reproducibility and reliability of the experiments. After conducting both qualitative and quantitative analyses of the detected metabolites, we compared the fold change in the quantitative information of the metabolites in each subgroup. After generalized log transformation processing for the fold differences in each component, the logFC results for the top 10 metabolites showed both upregulation and downregulation in the experimental group relative to the control group, as illustrated in Figure 2B. Furthermore, the supervised OPLS-DA model was used to compare metabolite levels and pinpoint the variables that contributed to the differences between the groups. Subsequently, the OPLS-DA model was employed to assess the differences between Cold_6 h and Control (R2X = 0.739, R2Y = 1, Q2Y = 0.955) (Figure 2C). In order to assess the reliability of the OPLS-DA model, we conducted a permutation test (Figure 2D). The grouping of samples was randomly scrambled, and the OPLS-DA model was modeled according to permuted grouping and its R2Y and Q2Y were calculated, with the results of multiple modeling plotted as scatter plots. The scattered points in the graph represent R2Y and Q2Y of the permuted model, respectively, and the dotted line was fitted to the regression lines. The replacement R2Y and Q2Y are smaller than those of the original model (the point where the x-axis is 1), indicating that the model is statistically significant. The findings indicated that cold stress significantly altered the metabolite profiles of P. ussuriensis.
A total of 325 differentially abundant metabolites were identified, consisting of 183 increased and 142 decreased (Figure 3A, Supplementary Data S2). In addition, samples were obviously separated into two groups on the heatmap (Figure 3B), suggesting that there were significant differences in the classes and quantities of metabolites between the two groups. We used the metabolite classification information from the HMDB database to statistically plot the annotated differential metabolism. According to the statistical results, the flavonoid metabolites showed relatively obvious enrichment among the top 20 differential metabolites (Figure 3C). Coincidentally, the same result was shown in the differential metabolite KEGG functional annotation and enrichment analysis. This intersects with the differential gene enrichment pathway of the transcriptome. Therefore, we subsequently conducted a joint analysis of the transcriptome and metabolome to identify differential genes that are highly associated with differential metabolites. Our goal was to pinpoint the key genes that play a significant role in cold stress in P. ussuriensis.

3.3. Joint Analysis of Transcriptome and Metabolome

Transcriptomics and metabolomics were used to study changes during cold stress. Correlations between samples in transcriptomics and metabolomics were calculated, and the coefficient (CC) and p-value of correlation (CCP) were used to filter (|CC| > 0.80 and CCP < 0.05).
Among the groups, carbon fixation in photosynthetic organisms, flavone and flavonol biosynthesis, and the flavonoid biosynthesis pathway greatly changed the transcriptome and metabolism (Figure 4A). The corresponding gene networks associated with significantly abundant GO items are shown in Figure 4B. Notably, the KEGG pathway co-enrichment analysis revealed that both the transcriptome and metabolome results exhibited significant enrichment in the flavonoid biosynthetic pathway. Therefore, based on the results of differential metabolite analysis and transcriptome differential gene analysis, we mapped the same group of differential genes and metabolites to the KEGG pathway map of flavonoid biosynthesis. This mapping enhances our understanding of the relationship between genes and metabolites (Figure 4C). Most of the regions shown are red, indicating that most of the metabolites and genes involved in flavonoid biosynthesis are upregulated, and the results showed that there was a positive correlation between flavonoid content and the gene expression level involved in flavonoid synthesis. Through canonical correlation analysis (CCA), we found that there is a correlation between the differential metabolites and the differential genes in the flavonoid biosynthetic pathway. Most of the enzymes in the process of carbon fixation metabolism, which only introduce the Calvin–Benson–Bassham cycle and the photosynthetic electron transport chain, were identified as being upregulated, including fructose-1,6-bisphosphatase I (FBP), fructose-bisphosphate aldolase (ALDOA), phosphoglycerate kinase (PGK), phosphoribulokinase (PRK), sedoheptulose-bisphosphatase (SBP), and NADH dehydrogenase (ubiquinone) 1 alpha subcomplex subunit 1 (NDUFA1) (Figure 4E).

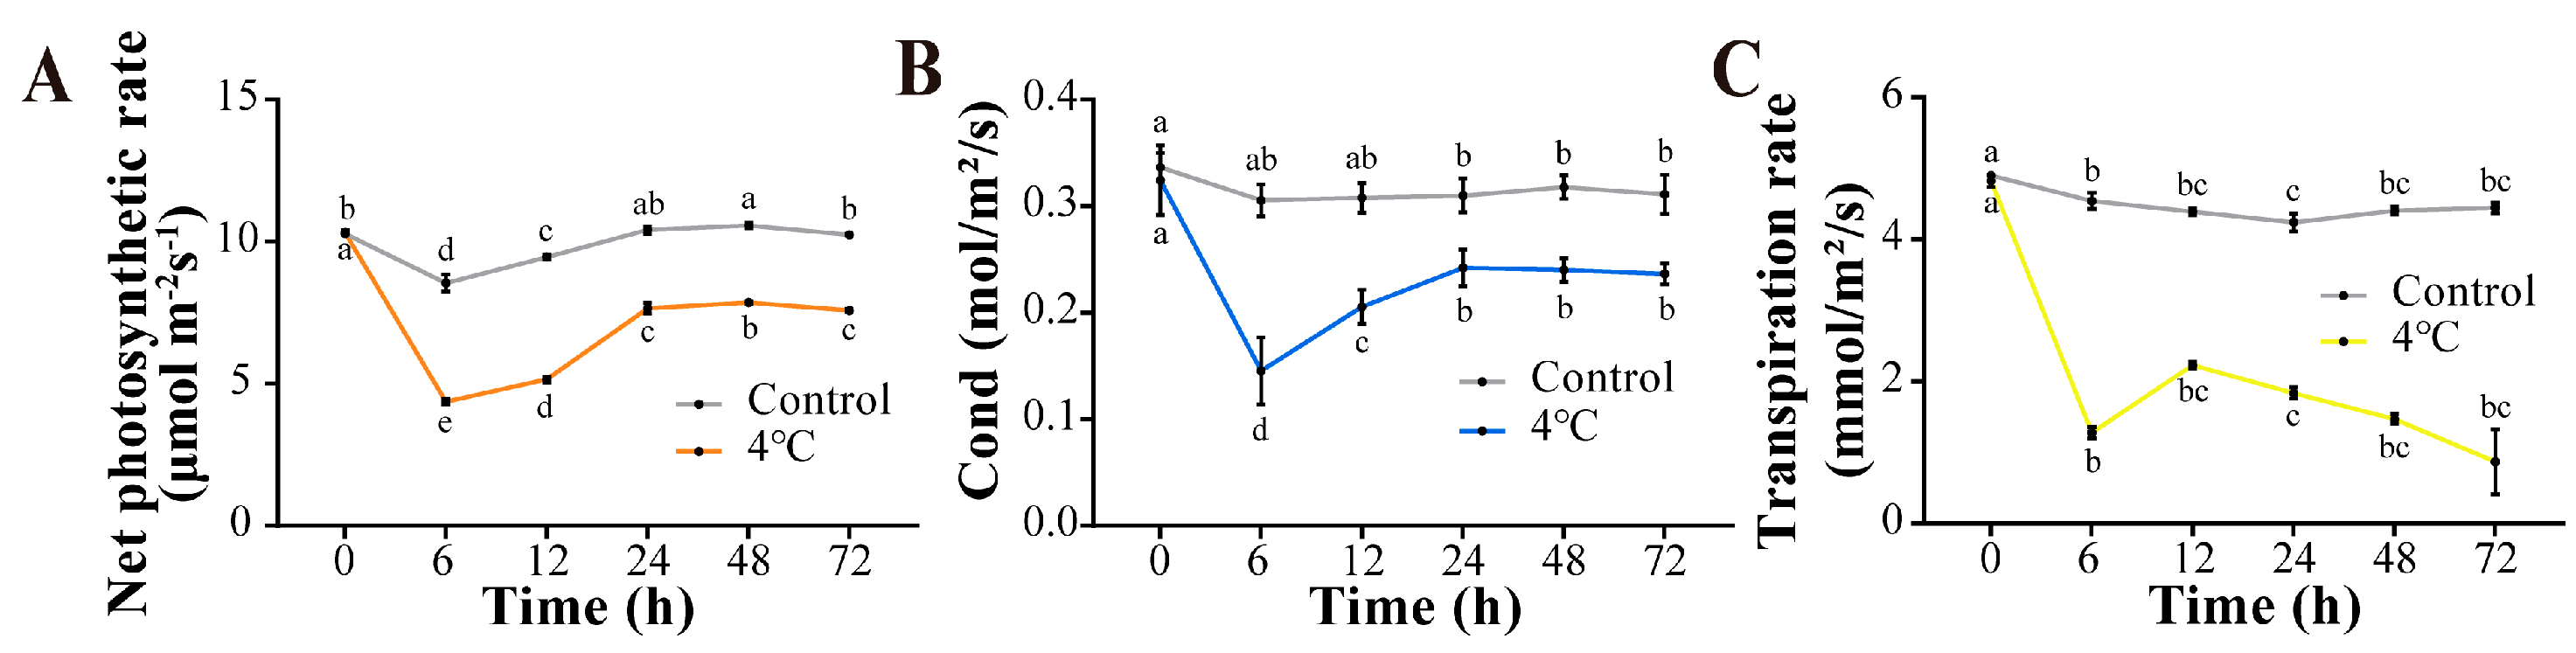
3.4. Chlorophyll Content and Gas Exchange

Photosynthetic parameters are crucial indicators for assessing plant growth and productivity, with chloroplast development and chlorophyll content parameters being widely utilized in the evaluation of photosynthesis. Consequently, we conducted measurements of the following physiological and photosynthetic indicators. Herein, the poplars had remarkable variations in photosynthetic rate (Pn), stomatal conductance (Gs), and transpiration rate (E) during cold-temperature stress. The Pn, Gs, and E all showed a clear downward trend after 6 h of cold treatment. The control plants (25 °C) were also measured in parallel for PN, GS, and E. The trend of photosynthetic parameters in control plants did not show significant changes at each time point (Figure 5A–C).
We determined the chlorophyll content in P. ussuriensis leaves under different times of 4 °C and 25 °C. The result indicated that the Chl a/ Chl b ratio significantly increased after 48 h of low-temperature treatment (from 2.5 to 3.2) (Figure 6A). The values of the control group (25 °C) showed no significant differences at various time points.

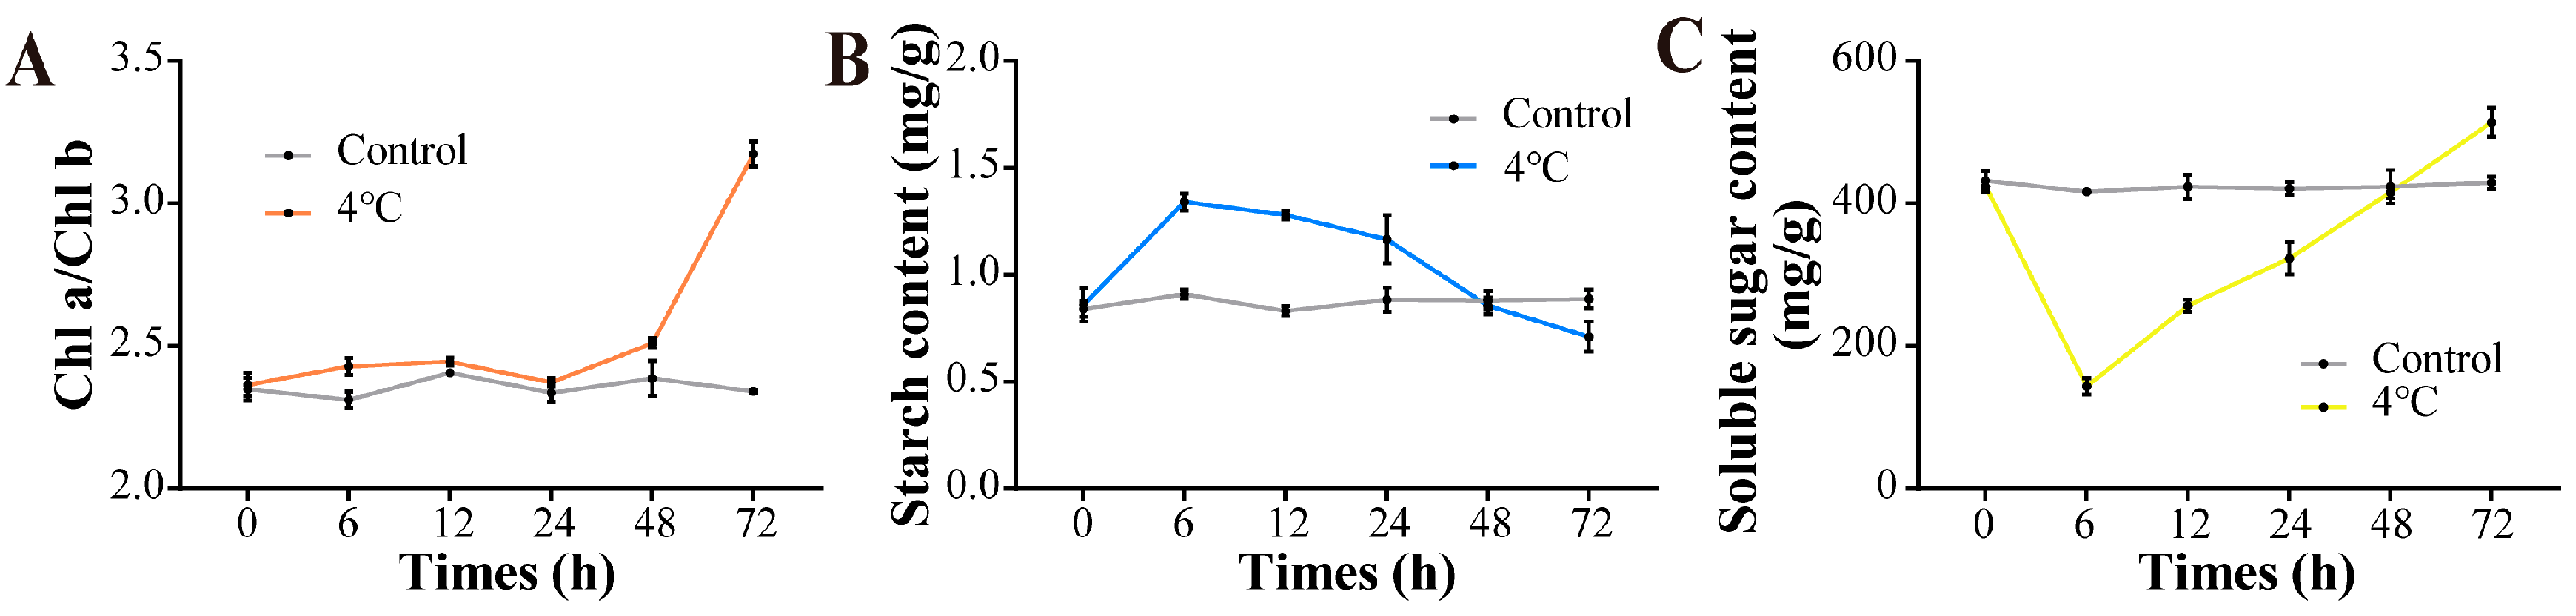
3.5. Starch Content and Soluble Sugars

Previous studies have demonstrated that low temperatures primarily affect pathways related to plant growth and carbon metabolism. Therefore, we determined the starch and sugar in P. ussuriensis under chilled-temperature stress and room temperature. The results showed that the soluble sugar content decreased by 20% (p < 0.05) after 6 h of low-temperature treatment, followed by a continuous increase, reaching 1.8 times that of the control group at 72 h (Figure 6B). In contrast, the starch content showed an opposite trend, decreasing to 40% of the initial value after 72 h of treatment (Figure 6C). The values in the control group (25 °C) showed no significant differences at each time point.

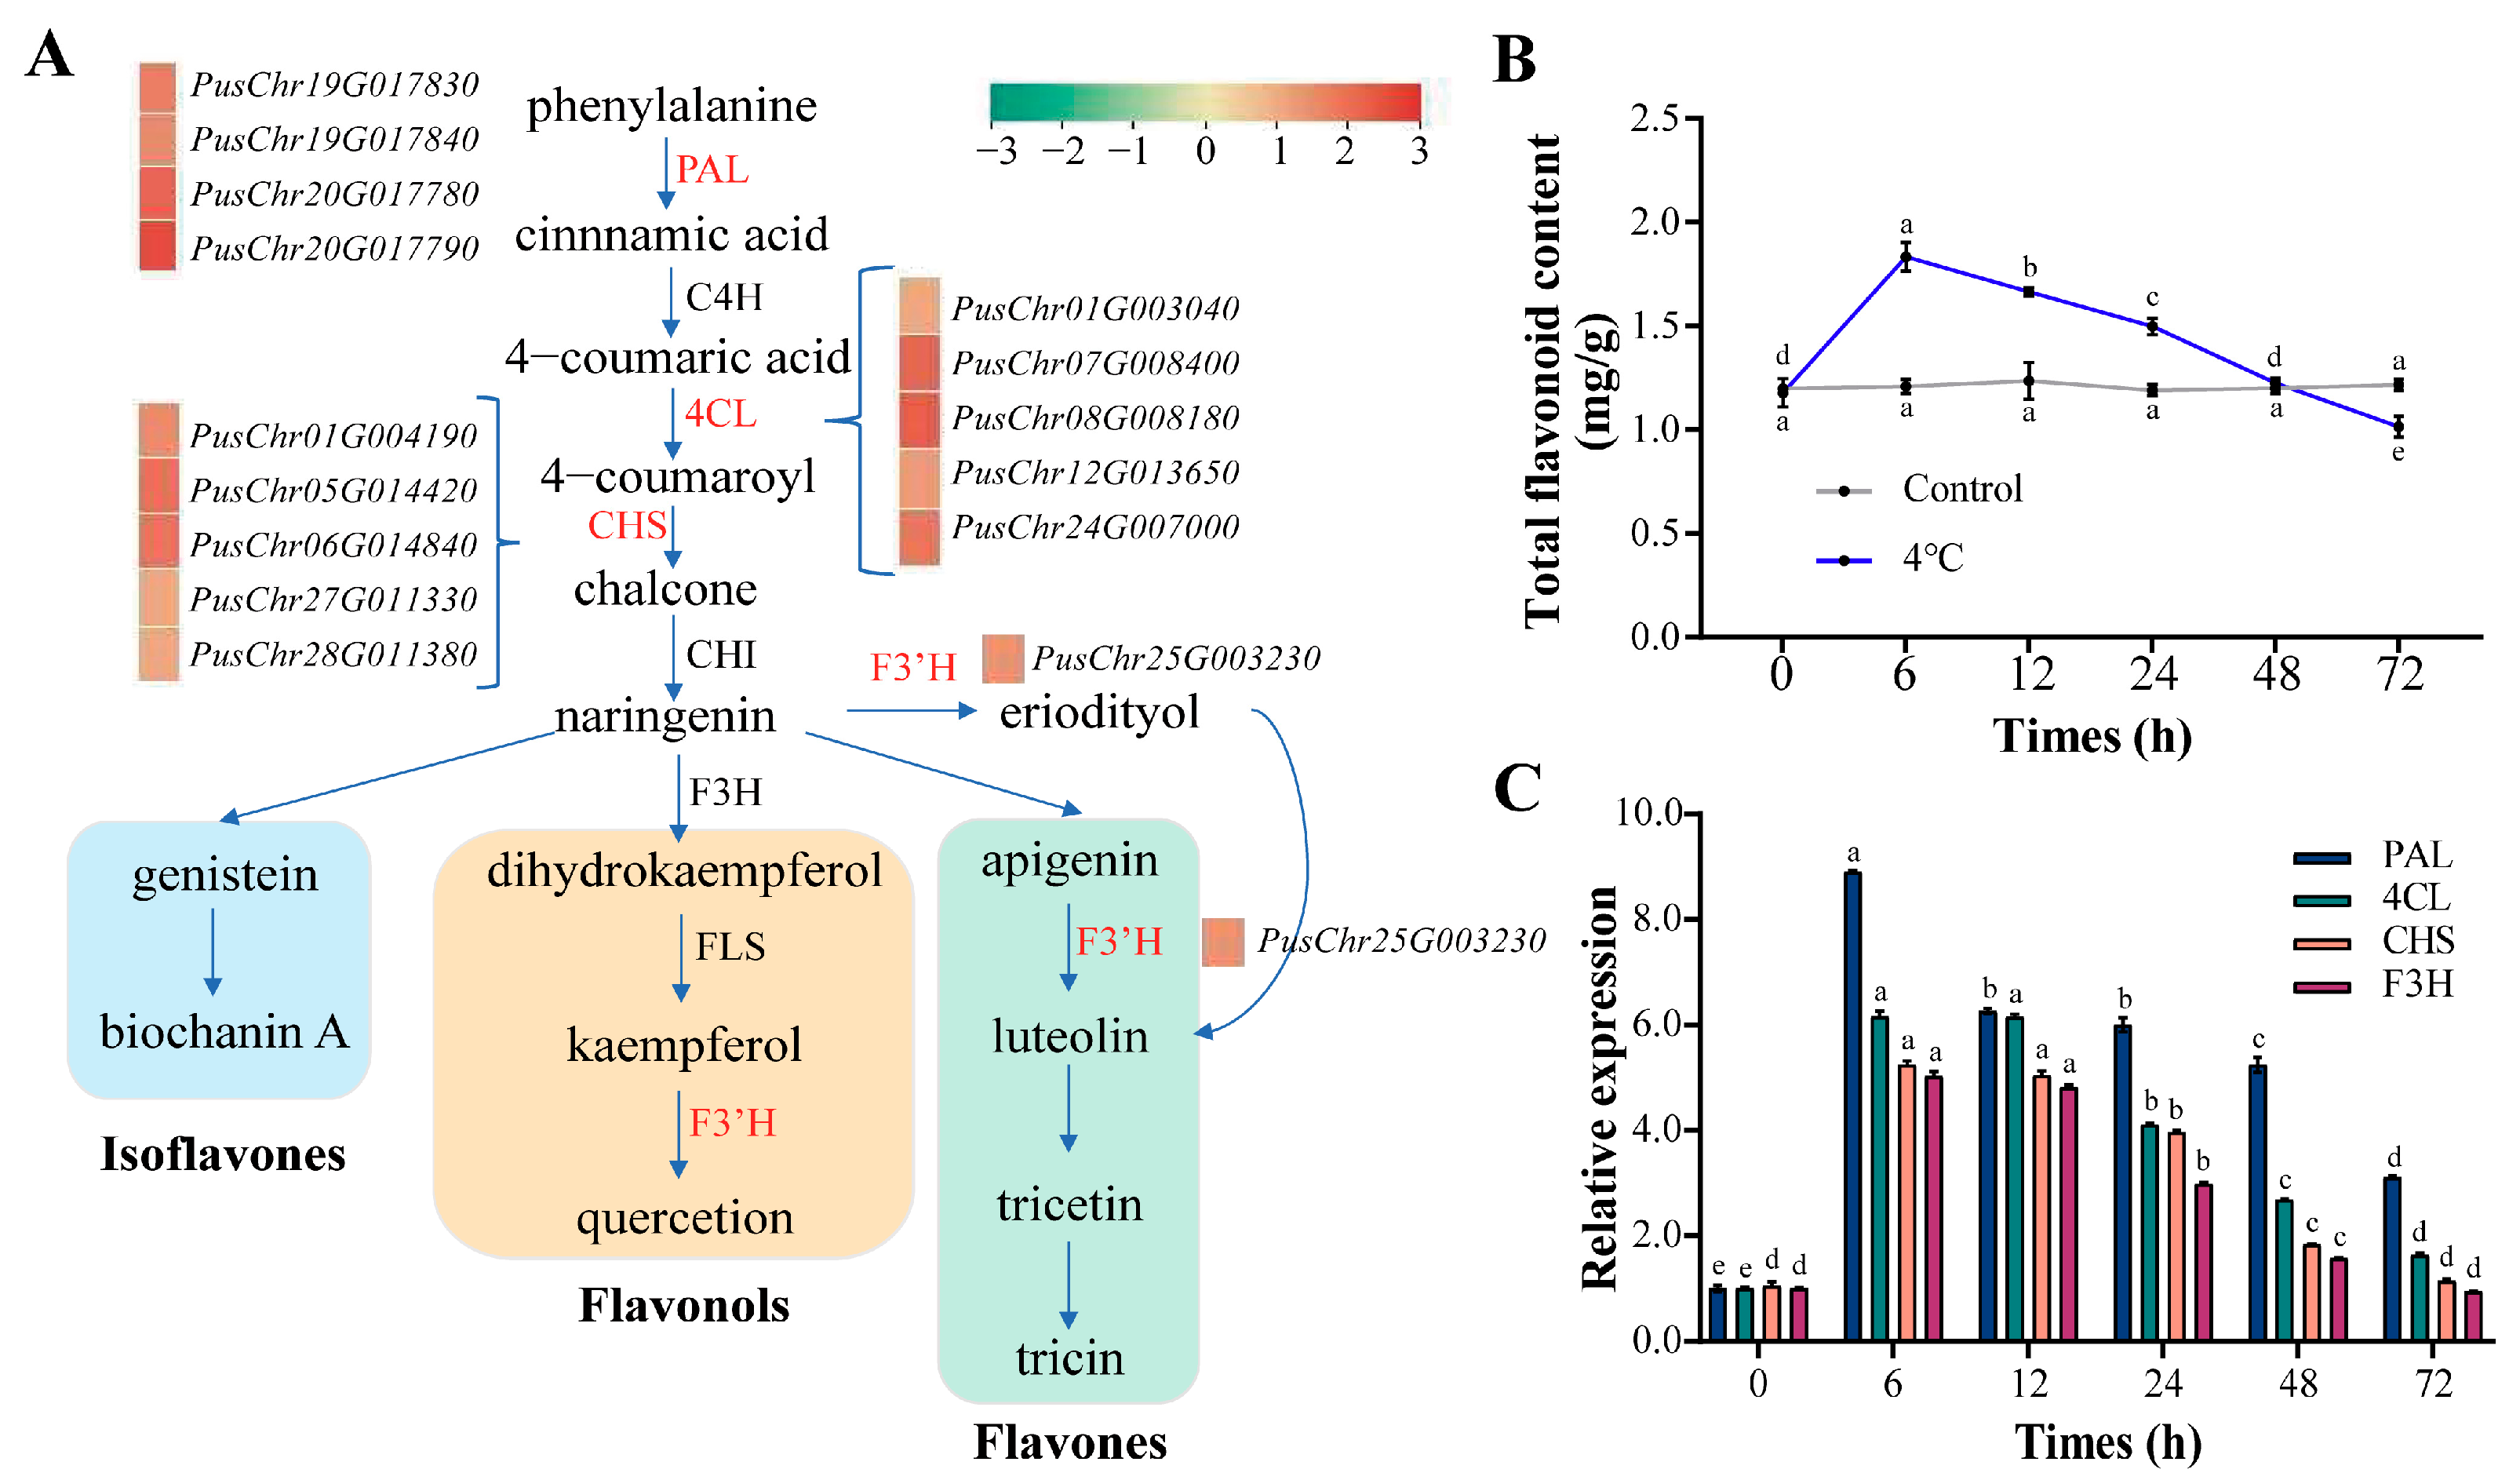
3.6. Flavonoid Biosynthetic Genes and Content

Flavonoid biosynthesis shares the phenylpropanoid pathway with lignin biosynthesis in its first steps. Early biosynthetic genes in the pathway such as PAL, 4CL, CHS, and F3H were all upregulated (Figure 7A). An increase in flavonoid content in comparison with the control was observed at 6–48 h, which was reduced at 72 h (Figure 7B), indicating the content of flavonoids in poplar was also strongly influenced by temperature. We selected several early biosynthetic genes in this pathway and obtained the expression profiles of PAL(PuChr20G017790), 4CL(PuChr08G008180), CHS(PuChr06G014840), and F3H(PuChr25G003230) under low-temperature treatment (4 °C) at different time intervals through RT-qPCR. Consistent with the results shown in Figure 7A, B, these genes exhibited significant upregulation at 6 h of low-temperature stress, with expression levels peaking and then gradually decreasing as the stress duration was extended.

4. Discussion and Conclusions

Low temperature severely limits the growth, survival, and geographical distribution of plants [24]. To overcome these harmful effects, plants have evolved biophysical, biochemical, and physiological changes, particularly as responses to photosynthetic reactions, and associated metabolic pathways to adapt to low-temperature stress. However, how the photosynthetic pathway responds during low-temperature exposure remains unclear. We utilized genomic data to identify key pathways and genes associated with photosynthetic acclimation and metabolic reprogramming in P. ussuriensis and elucidated their regulatory roles in enhancing cold tolerance. In the Results section (Section 3.1), we noted that genes associated with the Calvin–Benson–Bassham cycle (such as FBP, SBP, PGK, and PRK) were significantly upregulated under low-temperature stress (Figure 4E). The upregulation of FBP (fructose-1,6-bisphosphatase) and SBP (sedoheptulose-1,7-bisphosphatase) in the Calvin–Benson–Bassham cycle may enhance RuBP’s regeneration capacity, thereby promoting CO2 fixation efficiency [2]. Simultaneously, the co-expression of PGK (Phosphoglycerate kinase) and PRK (phosphoribulo kinase) may accelerate the conversion of 3-phosphoglycerate (PGA) into RuBP, thereby maintaining the rate of carbon assimilation. The activation of these genes collectively enhances the homeostasis of photosynthetic carbon metabolism under low temperatures, supporting the accumulation of sugar substances (Figure 6B).
Cold stress always affects the normal regulating functions of the photosynthesis system and causes the transcriptional repression of genes associated with chlorophyll biosynthesis and chloroplast development [25,26]. According to the raw data (Figure 6A), after 24 h of low-temperature treatment, the ratio of Chl a/Chl b increased from an initial value of 2.5 (0 h: 1.0/0.4) to 3.2 (72 h: 0.96/0.3). The increase in the Chl a/Chl b ratio may reflect the degradation of the peripheral light-harvesting complexes of green plants under low-temperature stress, a mechanism that helps reduce the absorption of excess light energy, thereby alleviating photoinhibition [27]. Although total carotenoids were not quantified here, the observed increase in the Chl a/Chl b ratio (Figure 6A) may reflect adjustments to light-harvesting complexes, potentially involving carotenoid-mediated photoprotection. Future studies should integrate carotenoid profiling, particularly the xanthophyll cycle, to elucidate their role in balancing light absorption and energy dissipation under cold stress. Maintaining a normal developmental state and content level of chlorophyll is a key step in photosynthetic efficiency and carbon fixation [28], thus directly influencing plant growth and development [29,30]. In other words, light absorption largely depends on the leaf chlorophyll content [31]. Herein, the photosynthesis parameters Pr and Tn showed a precipitous decline, whereas CO2 assimilation showed a linear increase with time. Speculatively, the decreased leaf chlorophyll content inhibited photosynthesis, but the increased CO2 assimilation enabled poplar to survive cold stress. Although chlorophyll fluorescence was not assessed, the observed decrease in stomatal conductance (Gs) and net photosynthesis (Pn) (Figure 5) indicates potential PSII photoinhibition, a common cold-stress response [32]. Future studies should integrate chlorophyll fluorescence assays to quantify PSII efficiency under similar conditions. Cold stress reduces membrane fluidity, particularly in thylakoid membranes, which can impair the electron transport and enzyme activities critical for photosynthesis [33]. While our study did not directly measure membrane rigidity, the observed downregulation of photosynthetic genes (e.g., RBCS) and decline in gas exchange parameters (Figure 5) may reflect cold-induced membrane dysfunction.
In addition to chlorophylls, flavonoids are among the most abundant secondary metabolites in the leaves of higher plants, functioning primarily as UV filters and antioxidants [34]. Metabolomics is now being employed to assess all metabolites both qualitatively and quantitatively, providing a sophisticated method for evaluating the state of cells. HPLC-MS/MS-based metabolomics is commonly used to analyze metabolites that play a role in physiological responses [19,20,35]. In this study, we employed a comprehensive metabolomics method with the UPLC-MS/MS analytical platform to examine the buildup of metabolites in P. ussuriensis when subjected to cold stress as a response to the environmental challenges faced by plants (Figure 3C,D). We found that flavonoids were significantly enriched. Flavonoids are known to play a key role in the protection of plants against abiotic and biotic stresses [36]. Cold stress treatments inhibited plant growth and reduced the leaf chlorophyll fluorescence in Capsicum cultivars but caused an accumulation of the content of flavonoids to enhance cold tolerance [37]. Although the flavonoid biosynthesis pathway in higher plants is relatively well understood, the regulatory network of this pathway in poplar (especially P. ussuriensis) under low-temperature stress and its interaction with photosynthetic carbon metabolism still require in-depth analysis (Figure 4C). Although flavonoids are not directly involved in the light reaction, the upregulation of their biosynthetic genes (such as PAL and CHS) (Figure 7A) may alleviate photoinhibition through the following mechanisms: (1) scavenging reactive oxygen species (ROS) and protecting photosystem II (PSII) from oxidative damage [7]; and (2) ss ultraviolet-absorbing substances, they reduce the direct damage of high-energy light to photosynthetic apparatus [38]. This synergistic regulation of the secondary metabolism and photosynthetic carbon assimilation may be a key strategy for P. ussuriensis to adapt to low temperatures.
Soluble sugar and starch are the key osmoregulation substances under stress conditions, which can resist cold stress and reduce the damage of cold stress on cells [39]. As reported, starch is an important form of sugar storage, and the starch–sugar dynamic interconversion in plant tissues plays a profound physiological role [40]. In this study, under low-temperature stress, the upregulation of starch degradation-related genes (such as β-amylase) (Supplementary Data S1) aligns with the decrease in starch content (Figure 6C), while the increased expression of sucrose synthase (SUS) genes may drive the accumulation of soluble sugars (Figure 6B). This carbon allocation strategy may alleviate the cellular dehydration stress induced by low temperatures through the increase in osmotic protectants such as sucrose [41]. Sugar synthesis from photosynthesis and its utilization through sugar metabolism jointly determine leaf sugar content, and excess sugar inhibits leaf photosynthesis [42]. In sugarcane, cold temperature (5 °C) increased sucrose levels that resulted in a decline of photosynthetic rates over 5 d and these changes were independent of stomatal conductance changes [43]. Together, reduced photosynthesis may be essential to ensuring that P. ussuriensis can survive in extremely cold climates, which will provide a theoretical basis for improving poplar cold tolerance.
In conclusion, the genetic study of cold resistance will be of great help in understanding the evolution of P. ussuriensis and will provide an important resource for research, especially in the molecular investigation of forestry traits and the breeding of P. ussuriensis. Furthermore, the estimated starch degradation and sugar accumulation suggest that cold-acclimated P. ussuriensis develops the ability to reduce photoinhibition as the main adaptive mechanism in response to cold stress.

Supplementary Materials

The following supporting information can be downloaded at: https://www.mdpi.com/article/10.3390/f16040660/s1, Data S1: The annotation of differentially expressed genes in response to cold stress; Data S2: The annotation of differential metabolites in response to cold stress; Table S1: Statistics of genes in four pathways before and after cold stress; Table S2: Annotation of four poplar species genome; Table S3: Statistics analysis of gene family clustering.

Author Contributions

J.Y., S.Z. and F.W. conceived and designed the study; J.L. and W.L. contributed to the sample preparation and genome sequencing; Z.L., L.Y., W.Z., J.Z., Z.Z. and Z.F. performed the physiological index assays; J.Y. and J.L. wrote and revised the manuscript. All authors have read and agreed to the published version of the manuscript.

Funding

This research was funded by The Innovation Project of the State Key Laboratory of Tree Genetics and Breeding (Northeast Forestry University) (2021A02) and the National Natural Science Foundation of China (No. 31870649).

Data Availability Statement

All relevant data can be found within the manuscript and its supporting materials. The Populus ussuriensis genome project has been deposited into the NCBI under the BioProject number SUB13708257. The whole-genome sequencing data were deposited into the sequence read archive (SRA) database under accession number PRJNA998551. The P. ussuriensis genome assembly has been deposited into Figshare (https://doi.org/10.6084/m9.figshare.24013941.v3, accessed on 3 June 2024). The RNA-seq data of transcriptomes have also been deposited into the SRA database under accession number PRJNA1002071.

Acknowledgments

We thank Biomarker Technologies Co., Ltd. for assisting in sequencing and bioinformatics analysis. This work was supported by The Innovation Project of State Key Laboratory of Tree Genetics and Breeding (Northeast Forestry University), the National Natural Science Foundation of China, and the Heilongjiang Touyan Innovation Team Program (Tree Genetics and Breeding Innovation Team).

Conflicts of Interest

The authors declare no conflicts of interest.

References

  1. Paredes, M.; Quiles, M.J. The effects of cold stress on photosynthesis in Hibiscus plants. PLoS ONE 2015, 10, e0137472. [Google Scholar] [CrossRef] [PubMed]
  2. Yamori, W.; Noguchi, K.; Terashima, I. Temperature acclimation of photosynthesis in spinach leaves: Analyses of photosynthetic components and temperature dependencies of photosynthetic partial reactions. Plant Cell Environ. 2005, 28, 536–547. [Google Scholar] [CrossRef]
  3. Sharma, A.; Kumar, V.; Shahzad, B.; Ramakrishnan, M.; Preet Singh Sidhu, G.; Shreeya Bali, A.; Handa, N.; Kapoor, D.; Yadav, P.; Khanna, K.; et al. Photosynthetic Response of Plants Under Different Abiotic Stresses: A Review. J. Plant Growth Regul. 2020, 39, 509–531. [Google Scholar] [CrossRef]
  4. Yamori, W.; Sakata, N.; Suzuki, Y.; Shikanai, T.; Makino, A. Cyclic electron flow around photosystem I via chloroplast NAD(P)H dehydrogenase (NDH) complex performs a significant physiological role during photosynthesis and plant growth at low temperature in rice. Plant J. 2011, 68, 966–976. [Google Scholar] [CrossRef]
  5. Simkin, A.J.; Kapoor, L.; Doss, C.G.P.; Hofmann, T.A.; Lawson, T.; Ramamoorthy, S. The role of photosynthesis related pigments in light harvesting, photoprotection and enhancement of photosynthetic yield in planta. Photosynth. Res. 2022, 152, 23–42. [Google Scholar] [CrossRef]
  6. Agati, G.; Brunetti, C.; Fini, A.; Gori, A.; Guidi, L.; Landi, M.; Sebastiani, F.; Tattini, M. Are Flavonoids Effective Antioxidants in Plants? Twenty Years of Our Investigation. Antioxidants 2020, 9, 1098. [Google Scholar] [CrossRef]
  7. Di Ferdinando, M.; Brunetti, C.; Fini, A.; Tattini, M. Flavonoids as Antioxidants in Plants Under Abiotic Stresses. In Abiotic Stress Responses in Plants; Ahmad, P., Prasad, M., Eds.; Springer: New York, NY, USA, 2012. [Google Scholar]
  8. Nabavi, S.M.; Šamec, D.; Tomczyk, M.; Milella, L.; Russo, D.; Habtemariam, S.; Suntar, I.; Rastrelli, L.; Daglia, M.; Xiao, J.; et al. Flavonoid biosynthetic pathways in plants: Versatile targets for metabolic engineering. Biotechnol Adv. 2020, 38, 107316. [Google Scholar] [CrossRef]
  9. Yadav, P.; Vaidya, E.; Rani, R.; Yadav, N.K.; Singh, B.K.; Rai, P.K.; Singh, D. Recent Perspective of Next Generation Sequencing: Applications in Molecular Plant Biology and Crop Improvement. Proc. Natl. Acad. Sci. India 2018, 88, 435–449. [Google Scholar] [CrossRef]
  10. Liao, J.; Tan, J.; Li, X.; Wang, L.; Zhu, L.; Chen, Z.; Gan, L.; Liu, W.; Jin, X. Combined transcriptome and metabolome analysis revealed the antimicrobial mechanism of Griseorhodin C against Methicillin-resistant Staphylococcus aureus. Sci. Rep. 2024, 14, 30242. [Google Scholar] [CrossRef]
  11. Wang, L.; Wu, L.M.; Greaves, I.K.; Zhu, A.; Dennis, E.S.; Peacock, W.J. PIF4-controlled auxin pathway contributes to hybrid vigor in Arabidopsis thaliana. Proc. Natl. Acad. Sci. USA 2017, 114, E3555–E3562. [Google Scholar] [CrossRef]
  12. Guo, H.; Zhang, C.; Wang, Y.; Zhang, Y.; Zhang, Y.; Wang, Y.; Wang, C. Expression profiles of genes regulated by BplMYB46 in Betula platyphylla. J. For. Res. 2019, 30, 2267–2276. [Google Scholar] [CrossRef]
  13. Wang, H.; Pak, S.; Yang, J.; Wu, Y.; Li, W.; Feng, H.; Yang, J.; Wei, H.; Li, C. Two high hierarchical regulators, PuMYB40 and PuWRKY75, control the low phosphorus driven adventitious root formation in Populus ussuriensis. Plant Biotechnol. J. 2022, 20, 1561–1577. [Google Scholar] [CrossRef]
  14. Pérez-Vicente, A.; Gil-Izquierdo, A.; García-Viguera, C. In vitro gastrointestinal digestion study of pomegranate juice phenolic compounds, anthocyanins, and vitamin C. J. Agric. Food Chem. 2002, 50, 2308–2312. [Google Scholar] [CrossRef]
  15. Jaakola, L.; Pirttilä, A.M.; Halonen, M.; Hohtola, A. Isolation of high quality RNA from bilberry (Vaccinium myrtillus L.) fruit. Mol Biotechnol. 2001, 19, 201–203. [Google Scholar] [CrossRef] [PubMed]
  16. Haas, B.J.; Delcher, A.L.; Mount, S.M.; Wortman, J.R.; Smith, R.K., Jr.; Hannick, L.I.; Maiti, R.; Ronning, C.M.; Rusch, D.B.; Town, C.D.; et al. Improving the Arabidopsis genome annotation using maximal transcript alignment assemblies. Nucleic Acids Res. 2003, 31, 5654–5666. [Google Scholar] [CrossRef]
  17. Majoros, W.H.; Pertea, M.; Salzberg, S.L. TigrScan and GlimmerHMM: Two open source ab initio eukaryotic gene-finders. Bioinformatics 2004, 20, 2878–2879. [Google Scholar] [CrossRef]
  18. Stanke, M.; Steinkamp, R.; Waack, S.; Morgenstern, B. AUGUSTUS: A web server for gene finding in eukaryotes. Nucleic Acids Res. 2004, 32, W309–W312. [Google Scholar] [CrossRef] [PubMed]
  19. Liu, S.; Fang, S.; Liu, C.; Zhao, L.; Cong, B.; Zhang, Z. Transcriptomics integrated with metabolomics reveal the effects of ultraviolet-b radiation on flavonoid biosynthesis in Antarctic moss. Front. Plant Sci. 2021, 12, 788377. [Google Scholar] [CrossRef]
  20. Xiong, Q.; Sun, C.; Li, A.; Zhang, J.; Shi, Q.; Zhang, Y.; Hu, J.; Zhou, N.; Wei, H.; Liu, B.; et al. Metabolomics and biochemical analyses revealed metabolites important for the antioxidant properties of purple glutinous rice. Food Chem. 2022, 389, 133080. [Google Scholar] [CrossRef]
  21. Durand, M.; Porcheron, B.; Hennion, N.; Maurousset, L.; Lemoine, R.; Pourtau, N. Water deficit enhances C export to the roots in Arabidopsis thaliana plants with contribution of sucrose transporters in both shoot and roots. Plant Physiol. 2016, 170, 1460–1479. [Google Scholar] [CrossRef]
  22. Chazaux, M.; Schiphorst, C.; Lazzari, G.; Caffarri, S. Precise estimation of chlorophyll a, b and carotenoid content by deconvolution of the absorption spectrum and new simultaneous equations for Chl determination. Plant J. 2022, 109, 1630–1648. [Google Scholar] [CrossRef]
  23. Zhang, H.; Yang, J.; Li, W.; Chen, Y.; Lu, H.; Zhao, S.; Li, D.; Wei, M.; Li, C. PuHSFA4a Enhances Tolerance To Excess Zinc by Regulating Reactive Oxygen Species Production and Root Development in Populus. Plant Physiol. 2019, 180, 2254–2271. [Google Scholar] [CrossRef]
  24. Hasdai, M.; Weiss, B.; Levi, A.; Samach, R. Differential responses of Arabidopsis ecotypes to cold, chilling and freezing temperatures. Ann. Appl. Biol. 2006, 148, 113–120. [Google Scholar] [CrossRef]
  25. Gao, Y.; Thiele, W.; Saleh, O.; Scossa, F.; Arabi, F.; Zhang, H.; Sampathkumar, A.; Kühn, K.; Fernie, A.; Bock, R.; et al. Chloroplast translational regulation uncovers nonessential photosynthesis genes as key players in plant cold acclimation. Plant Cell 2022, 34, 2056–2079. [Google Scholar] [CrossRef] [PubMed]
  26. Garcia-Molina, A.; Kleine, T.; Schneider, K.; Mühlhaus, T.; Lehmann, M.; Leister, D. Translational components contribute to acclimation responses to high light, heat, and cold in Arabidopsis. iScience 2020, 23, 101331. [Google Scholar] [CrossRef]
  27. Borisova-Mubarakshina, M.; Naydov, I.; Vetoshkina, D.; Kozuleva, M.; Vilyanen, D.; Rudenko, N.N.; Ivanov, B. Photosynthetic Antenna Size Regulation as an Essential Mechanism of Higher Plants Acclimation to Biotic and Abiotic Factors: The Role of the Chloroplast Plastoquinone Pool and Hydrogen Peroxide. In Vegetation Index and Dynamics; IntechOpen Ltd.: London, UK, 2021. [Google Scholar]
  28. Xie, S.; Nie, L.; Zheng, Y.; Wang, J.; Zhao, M.; Zhu, S.; Hou, J.; Chen, G.; Wang, C.; Yuan, L. Comparative proteomic analysis reveals that chlorophyll metabolism contributes to leaf color changes in Wucai (Brassica campestris L.) responding to cold acclimation. J. Proteome Res. 2019, 8, 2478–2492. [Google Scholar] [CrossRef] [PubMed]
  29. Reinbothe, C.; El Bakkouri, M.; Buhr, F.; Muraki, N.; Nomata, J.; Kurisu, G.; Fujita, Y.; Reinbothe, S. Chlorophyll biosynthesis: Spotlight on protochlorophyllide reduction. Trends Plant Sci. 2010, 15, 614–624. [Google Scholar] [CrossRef]
  30. Wang, P.; Grimm, B. Organization of chlorophyll biosynthesis and insertion of chlorophyll into the chlorophyll-binding proteins in chloroplasts. Photosynth Res. 2015, 126, 189–202. [Google Scholar] [CrossRef]
  31. Brodersen, C.R.; Vogelmann, T.C. Do changes in light direction affect absorption profiles in leaves? Funct. Plant Biol. 2010, 37, 403–412. [Google Scholar] [CrossRef]
  32. Garcia-Molina, A.; Leister, D. Accelerated relaxation of photoprotection impairs biomass accumulation in Arabidopsis. Nat. Plants 2020, 6, 9–12. [Google Scholar] [CrossRef]
  33. Zhang, J.; Lee, K.P.; Liu, Y.; Kim, C. Temperature-driven changes in membrane fluidity differentially impact FILAMENTATION TEMPERATURE-SENSITIVE H2-mediated photosystem II repair. Plant Cell 2024, 37, koae323. [Google Scholar] [CrossRef] [PubMed]
  34. Zhang, Y.; Yang, L.; Hu, H.; Yang, J.; Cui, J.; Wei, G.; Xu, J. Transcriptome and metabolome changes in Chinese cedar during cold acclimation reveal the roles of flavonoids in needle discoloration and cold resistance. Tree Physiol. 2022, 42, 1858–1875. [Google Scholar] [CrossRef]
  35. Sun, S.; Fang, J.; Lin, M.; Hu, C.; Qi, X.; Chen, J.; Zhong, Y.; Muhammad, A.; Li, Z.; Li, Y. Comparative metabolomic and transcriptomic studies reveal key metabolism pathways contributing to freezing tolerance under cold stress in kiwifruit. Front. Plant Sci. 2021, 12, 628969. [Google Scholar] [CrossRef] [PubMed]
  36. Sharma, A.; Shahzad, B.; Rehman, A.; Bhardwaj, R.; Landi, M.; Zheng, B. Response of phenylpropanoid pathway and the role of polyphenols in plants under abiotic stress. Molecules 2019, 24, 2452. [Google Scholar] [CrossRef]
  37. Genzel, F.; Dicke, M.D.; Junker-Frohn, L.V.; Neuwohner, A.; Thiele, B.; Putz, A.; Usadel, B.; Wormit, A.; Wiese-Klinkenberg, A. Impact of moderate cold and salt stress on the accumulation of antioxidant flavonoids in the leaves of two Capsicum Cultivars. J. Agric. Food Chem. 2021, 69, 6431–6443. [Google Scholar] [CrossRef]
  38. Bilger, W.; Johnsen, T.; Schreiber, U. UV-excited chlorophyll fluorescence as a tool for the assessment of UV-protection by the epidermis of plants. J. Exp. Bot. 2001, 52, 2007–2014. [Google Scholar] [CrossRef] [PubMed]
  39. Döll, S.; Lippmann, R.; Mock, H.P. Proteomic approaches to identify cold-regulated soluble proteins. Methods Mol. Biol. 2014, 1166, 139–158. [Google Scholar]
  40. Dong, S.; Beckles, D.M. Dynamic changes in the starch-sugar interconversion within plant source and sink tissues promote a better abiotic stress response. J. Plant Physiol. 2019, 234–235, 80–93. [Google Scholar] [CrossRef]
  41. Kitashova, A.; Adler, S.O.; Richter, A.S.; Eberlein, S.; Dziubek, D.; Klipp, E.; Nägele, T. Limitation of sucrose biosynthesis shapes carbon partitioning during plant cold acclimation. Plant Cell Environ. 2023, 46, 464–478. [Google Scholar] [CrossRef]
  42. Ren, R.; Wan, Z.; Chen, H.; Zhang, Z. The effect of inter-varietal variation in sugar hydrolysis and transport on sugar content and photosynthesis in Vitis vinifera L. leaves. Plant Physiol. Biochem. 2022, 189, 1–13. [Google Scholar] [CrossRef]
  43. McCormick, A.J.; Cramer, M.D.; Watt, D.A. Regulation of photosynthesis by sugars in sugarcane leaves. J. Plant Physiol. 2008, 165, 1817–1829. [Google Scholar] [CrossRef] [PubMed]
Figure 1. Statistical analysis of DEGs and KEGG enrichment analysis. (A) Volcano plot of DEGs under 4 °C stress compared with control group. This analysis was processed by DESeq2, and criteria for differentially expressed genes were set as Fold Change (FC) ≥ 2 and FDR < 0.01. (B) KEGG Pathway enrichment analysis on DEGs. Top 20 enriched pathways (with smallest Q-value) are shown in the figure. Each dot represents a KEGG pathway. A larger enrichment factor indicates a more significant enrichment of the pathway.
Forests 16 00660 g001
Figure 2. Metabolome samples were analyzed by grouping data. (A) Principal component analysis (PCA) of metabolome samples. The percentage of the coordinate axis represents the contribution of the respective principal component to the variation among the samples. Each dot in the diagram represents a sample and samples from the same group are represented by the same color. (B) Analysis of multiple differences. The label of each column represents the metabolite name, which is distinguished by up–downregulation, where upregulation is red, downregulation is green, and column length represents logFC. (C) Orthogonal partial least-squares discriminant analysis (OPLS-DA) is used for differential grouping. The x-axis (t1) indicates the predicted component that reflects the differences between groups, while the y-axis (t2) shows the orthogonal component that captures the differences within groups. The percentage on the horizontal y-axis indicates the contribution of this component to the overall variance. (D) The OPLS-DA model substitution test is illustrated, where the x-axis displays the correlation between permutation groups and the original model group, and the y-axis shows the R2Y or Q2Y values (with R2Y and Q2Y of 1 on the x-axis representing the original model values). The blue and red dots correspond to the R2Y and Q2Y values of the permuted model, respectively, and the dotted line represents the fitted regression line.
Forests 16 00660 g002
Figure 3. Screening for differential metabolites. (A) Volcano Plot. Each dot in the volcano plot represents a metabolite, and the size of the scatter represents the VIP value of the OPLS-DA model. The metabolite with fold change ≥ 1, VIP (Variable Importance in Projection) ≥ 1, and p-value < 0.05 of t test were selected. (B) Heatmap. The x-axis is for each sample, and the y-axis is the quantified value after the metabolite z-score is normalized after hierarchical clustering. (C) Differential metabolite HMDB database annotation. Each column in the classification chart represents the number of substances annotated by an HMDB classification in the comparison pair. (D) KEGG functional annotation and enrichment analysis.
Forests 16 00660 g003
Figure 4. KEGG enrichment and network analysis. (A) KEGG enrichment analysis of differences in metabolites and genes. (B) Enrichment of different metabolites KEGG network diagram. Note: Pale yellow nodes in figure indicate the pathway, with comments on specific metabolites of the pathway linked to the small nodes, and multiple color shades show differences in log2 values. (C) Analysis of flavonoid biosynthetic pathway in metabolome and transcriptome. (D) Canonical correlation analysis of flavonoid biosynthetic pathways in metabolome and transcriptome. (E) Expression patterns of Calvin–Benson–Bassham cycle genes and associated enzyme activity in P. ussuriensis under control and 4 °C treatments. SBP (sedoheptulose-bisphosphatase), ALDOA (fructose-bisphosphate aldolase), TKT (Transketolase), FBP (fructose-1,6-bisphosphate), GAPA (fructose-bisphosphate aldolase), PGK (phosphoglycerate kinase), RBCS (ribulose-bisphosphate carboxylase small chain), PRK (Phosphoribulo kinase), RPIA (ribose 5-phosphate isomerase A), and NDUFA1 (NADH dehydrogenase ubiquinone 1α subcomplex subunit 1): Involved in the assembly of Complex I in the photosynthetic electron transport chain, and its upregulation may enhance the supply of NADPH in the light reactions. Heatmaps show log2 cold-treated plants’ expression values of related genes in leaves.
Forests 16 00660 g004
Figure 5. Variation in photosynthetic parameters during cold treatment. (A) Net photosynthesis rate. (B) Stomatal conductance. (C) Transpiration rate. Values are means ± SD (n = 3). Different letters indicate significant differences between time points (Duncan’s test, p < 0.05).
Forests 16 00660 g005
Figure 6. Determination of chlorophyll, starch, and soluble sugar. (A) Chlorophyll content. (B) Starch content. (C) Soluble sugar content. Values are means ± SD (n = 3). Different letters indicate significant differences between time points (Duncan’s test, p < 0.05).
Forests 16 00660 g006
Figure 7. The total flavonoid content and genes involved in the biosynthesis of flavonoids and their expression patterns in P. ussuriensis in control conditions and in 6 h of 4 °C treatments. (A) Simplified scheme of flavonoid biosynthetic and regulatory pathway in plants. Heatmaps show log2 cold-treated plants’ expression values of related genes in leaves. PAL (phenylalanine ammonia lyase), C4H (cinnamate-4-hydroxylase), 4CL (4-coumarate CoA ligase), CHS chalcone synthase, CHI (chalcone isomerase), F3H (flavanone 3-hydroxylase), F3′H (flavonoid 3′-hydroxylase), and FLS (flavonol synthases). (B) The flavonoid content in P. ussuriensis leaves. Different letters indicate significant differences between time points (Duncan’s test, p < 0.05) (C) The expression levels of PAL(PuChr20G017790), 4CL(PuChr08G008180), CHS(PuChr06G014840), and F3H(PuChr25G003230) under low-temperature stress at 0, 6, 12, 24, 48, and 72 h. Different letters indicate significant differences between time points (Duncan’s test, p < 0.05).
Forests 16 00660 g007
Disclaimer/Publisher’s Note: The statements, opinions and data contained in all publications are solely those of the individual author(s) and contributor(s) and not of MDPI and/or the editor(s). MDPI and/or the editor(s) disclaim responsibility for any injury to people or property resulting from any ideas, methods, instructions or products referred to in the content.

