Abstract
The restorative effects of various environmental factors within urban forests on physical and mental health exhibit significant differences. Specifically, vegetation types and topographical slope positions are key elements contributing to the environmental heterogeneity of urban forests. However, there is a lack of studies that have concurrently examined the health restoration effects of both factors. This study conducted an empirical experiment on university students in urban forests during the autumn season, investigating the effects of different vegetation types and slope positions on physiological and psychological restoration, and identifying the key environmental factors contributing to these effects. The results show the following: (1) Urban forests with different vegetation types exhibit varying restorative effects, with coniferous forests offering greater physiological restoration benefits than coniferous–broadleaf mixed forests. (2) Slope position affects both physiological and psychological restoration. In coniferous forests, the restorative effects on physical and mental health are greater at the top and midslope positions compared to the bottom slope position; in coniferous–broadleaf mixed forests, the best physiological restoration effects occur at the midslope position. (3) The key environmental factors influencing physiological restoration in urban coniferous forests are panoramic green coverage and elevation. (4) In urban coniferous–broadleaf mixed forests, temperature, humidity, and wind speed are the key factors affecting physiological restoration. This study reveals the restorative differences in urban forests under different vegetation types and slope positions, identifies the key environmental factors influencing health restoration, and provides a theoretical basis for further research on the impact of urban forests on human health. Future urban forest layout and design should fully consider the characteristics of different slope positions, optimize microclimate regulation, and maximize their role in promoting public health.
1. Introduction
Rapid development of the global economy has accelerated the urbanization process, posing challenges to human health and well-being [1]. High-density urban environments and suboptimal lifestyles have negatively impacted the physical and mental health of residents [2], causing issues such as emotional anxiety, stress overload, and cardiovascular diseases. Urban forests, as highly valuable urban green spaces [3], offer significant ecological benefits and are often more important than most other types of urban green spaces [4]. As important areas for urban residents to connect with nature, urban forests constitute a key solution for addressing the poor health conditions of urban populations. Owing to their rich microenvironments and biodiversity, urban forests serve as ecological patches and corridors that help maintain the healthy functioning of urban ecosystems [5]. They also contribute to improving the psychological and physiological health of individuals [6]. Even small stimuli within urban forests can yield positive effects [7]. Research has shown that forests facilitate attention restoration [8] and recovery from physiological and psychological stress [9]. Compared with forests outside urban areas, urban forests, as multifunctional spaces linking people with nature within cities, offer more convenient accessibility. As natural environments that are easily accessible for urban residents, they play a crucial role in providing public spaces that foster social interaction [10,11].
The notion of restorative environments was initially proposed by Kaplan and Kaplan in the 1980s, describing these settings as spaces that facilitate individuals’ recuperation and revitalization from both physical and psychological fatigue, as well as from negative emotions associated with stress [12]. In a relatively short period, participants exposed to natural environments can experience a certain degree of physiological and psychological restoration [13,14,15]. On the basis of restorative theory, a significant body of research has focused on urban forests, confirming that they provide numerous social functions, with the improvement in human health and well-being being the most important function [16]. Scholars have investigated the recovery benefits associated with various urban forest types and have revealed that both coniferous forests and coniferous–broadleaf mixed forests can significantly improve emotional states and alleviate psychological stress [17]. Coniferous–broadleaf mixed forests, characterized by greater biodiversity, demonstrate the greatest overall health benefits, particularly in terms of improving emotional states and human comfort. Coniferous forests, characterized by their lower biodiversity and continuous canopy structure and higher vegetation density, may exhibit more pronounced effects in reducing heart rate and blood pressure (indicators of physiological restoration) through the modulation of microenvironmental variables such as light availability and humidity levels [18]. Therefore, selecting these two vegetation types allows for an effective comparison between single-species and mixed-species vegetation in terms of restorative effects. This approach enables a deeper understanding of the underlying restoration mechanisms and provides broad applicability. As the carrier of all landscape elements within urban forests, the terrain fulfils a structural role in planning and design, influencing space delineation, controlling sightlines and improving microclimates [19,20,21]. However, research in which terrain factors are combined with health restoration benefits is still lacking. The slope position, as a key terrain feature, also affects the microclimate within forests. The impact of the slope position on the microclimate is typically reflected in the uneven distribution of solar radiation and changes in airflow, which in turn yields local microclimate improvements [17]. Previous studies have shown that slope position has a significant impact on microclimate regulation and vegetation structure. There are significant differences in vapour pressure deficit (VPD), air temperature, and solar radiation at different slope positions. The vapour pressure deficit and temperature at the valley bottom are generally higher than those at the midslope and ridge positions. In terms of the water use patterns of vegetation, trees at different slope positions show obvious differences. The upper slope position has a high elevation, so water is likely to drain away and the soil is relatively dry; the lower slope position is prone to water accumulation, and the soil is relatively moist. This difference in water availability leads to different vegetation types at different slope positions [22]. However, there remains a lack of research on the restorative effects of urban forests at varying slope positions. Urban forests with different vegetation types and slope positions exhibit varying environmental conditions. The restorative effects of urban forests result primarily from the synergistic effects of forest environmental factors on physical and mental health [23]. Research has confirmed that forest environments positively impact physiological health via temperature, humidity, light, and air quality regulation. The concentration of negative ions in forests is relatively high, which can improve physiological functions such as facilitating a reduction in blood pressure and heart rate [18]. The microclimatic conditions in forests (e.g., temperature, humidity, and light) influence emotions not only in terms of physiological comfort but also in relation to psychological well-being. For example, thermal comfort in forest environments is significantly associated with positive emotional states, indicating that forest microclimates fulfil a multifaceted role in emotional regulation [24]. Different spatial structures and spatial characteristics can produce varying restorative effects on individuals’ physical and mental health. Lin et al. [25], who examined the variations in the impact of three distinct bamboo forest environments on alleviating both physiological and psychological stress, reported that open, tall and orderly, moderately dense spatial structures could offer both greater visual preference and health benefits. In nurturing forests, the sensation of pleasure experienced by individuals is greater [26]; open, unobstructed forests can more effectively influence emotions positively [27]. Therefore, urban forests may exhibit varying restorative potentials due to differences in their environmental factors. It is essential to comprehensively study the relationships between environmental factors and restorative effects of urban forests with different vegetation types and slope positions. This information could help researchers better understand the limitations of environmental factors in different urban forests during use and enable targeted improvements in the design process to enhance their restorative benefits.
As a mega-city in China, Chengdu’s permanent population surpassed 21 million in 2023, with an urbanization rate of 80.2% [28]. Rapid development has brought severe environmental challenges, with urban built-up areas expanding by over 70% in the past decade, wetlands and farmland declining, and ecological spaces shrinking, leading to an exacerbation of the urban heat island effect. These issues have intensified the public health threats [29]. The fast-paced lifestyle and social pressures brought about by urbanization have also led to an increase in mental health disorders [30]. The current quality of urban green spaces is no longer sufficient to meet the public’s health restoration needs. Against this backdrop, Chengdu has adopted the vision of becoming a “Park City” as part of its urban development strategy, with a clear commitment to strengthening the development of urban forests, enhancing urban ecological functions, and building urban forest ecological barriers [31]. Urban forests, as an essential component of the urban environment, play a critical role in promoting public health and the sustainable development of urban ecosystems. Research has shown that there is an interrelationship between people, urban forests, and restorative effects [32]. On the one hand, the rich environmental factors in urban forests (such as vegetation type, topography, microclimatic factors, and spatial structure) create multiple sources of stimuli. When people engage in experiential perceptions of these environments, the forest environment serves as a multi-scale health-promoting medium, significantly improving residents’ physiological stress and psychological resilience [16,18], and often these recovery benefits can be reflected and measured by measuring changes in physiological and psychological indicators known as the Psychophysiological indicator (PPI) [33]. On the other hand, as environmental experiencers, people’s group characteristics and environmental use patterns can also influence restorative effects [34,35]. Furthermore, to maximize the health restoration benefits for residents, optimizing and adjusting the environmental factors in urban forests can fully enhance their ecological service functions for people [36] (Figure 1). The question of how to achieve the optimal integration of ecological, aesthetic, and social health functions through scientific planning and design of urban forests is a key issue that warrants attention. We have found that targeted research on commonly encountered restorative environments in urban forests—specifically, forests with different vegetation types and slope positions—lacks sufficient exploration. Therefore, this study aims to establish plots in urban forests with different vegetation types and slope positions in Chengdu, following the proximity principle to ensure comparability. Under strict control of weather and time (two consecutive autumn days, same periods), it measures environmental indicators, and recruits participants against the same criteria for random grouping to conduct an empirical experiment on health Recovery to address the following questions: (1) Do the effects of urban forests with various vegetation types and slope positions on restoring physical and mental health differ? (2) Which environmental factors of various urban forests significantly affect health restoration benefits? Therefore, the study of these questions could contribute to optimizing the environmental service quality of the two vegetation types and three slope positions within urban forests, improving the urban ecological environment, and providing high-quality green spaces for physical activities. This can effectively reduce the physical and mental health risks of high-stress and emotionally distressed populations, prevent chronic diseases, and foster a sustainable living environment, thereby ensuring the co-development of urban ecosystems and human health.
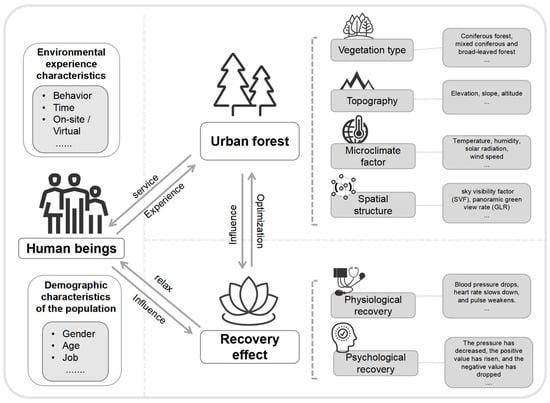
Figure 1.
Conceptual framework diagram of the restoration mechanism based on human, urban forest and restoration effect.
2. Materials and Methods
2.1. Participants
In this study, 36 university student volunteers (18 male and 18 female) were recruited to control for potential biases arising from gender imbalance. According to the central limit theorem, when the sample size exceeds 30, the sampling distribution of the mean approximates a normal distribution, satisfying the requirements for subsequent statistical analyses. Recruitment was conducted through the posting of volunteer recruitment posters within the university campus and surrounding areas, as well as through online group chat applications (WeChat). Participants were selected based on the following criteria: (1) a body mass index (BMI) within the normal range for adults (18.5–23.9), to enhance internal consistency of the sample and reduce individual differences that could interfere with the results; (2) normal vision (including corrected vision), hearing, and olfactory functions, to ensure effective perception of environmental stimuli; and (3) no history of ongoing acute or chronic cardiovascular diseases or mental illnesses, to avoid interference with physiological and psychological measurements. Participants were instructed to abstain from smoking and alcohol consumption and to maintain adequate sleep prior to participating in the study. All potential participants were informed about the experimental procedures and associated risks before the study and provided written informed consent. This study was approved by the Local Ethics Committee of the College of Landscape Architecture at Sichuan Agricultural University, China (Approval No. 20240069).
2.2. Study Sites
Chengdu, as a major metropolitan city in Southwest China, currently encompasses an urban forest area of 570,000 hectares, with a forest coverage rate exceeding 40%; coniferous forests and coniferous–broadleaf mixed forests are widely distributed and structurally stable in Chengdu, making them representative of the common characteristics of urban forests in southwestern China. The two forest stand plots are located in close proximity, with typical microclimatic and vegetation characteristics. The experimental plots were selected according to following criteria: (1) the forest plot area should be no smaller than 1hectares [37]; (2) the plot should contain a relatively natural plant community [38]; (3) and the plot should possess a clear forest edge [39]. Ultimately, two types of urban forests (evergreen coniferous and evergreen coniferous–broadleaf mixed forests) were selected in Yong’an Lake Urban Forest Park in Chengdu as research sites. The park covers an area of 206 hectares, with 21 hectares of water and 67 hectares of natural secondary forest. The original topography has been retained, and it encompasses an excellent ecological environment (Figure 2). To address the above research questions, we established sample plots involving two vegetation types (green coniferous and evergreen coniferous–broadleaf mixed forests) and three slope positions (top, middle, and bottom) as variables to measure environmental factor indicators and conduct restorative experiments. The selected forest stands are in close proximity to each other, minimizing heterogeneity caused by long distances. They exhibit typical microclimatic and vegetation characteristics. The original terrain has been preserved, and the slope conditions are similar, ensuring consistency and comparability, which meets the requirements of a comparative experiment.
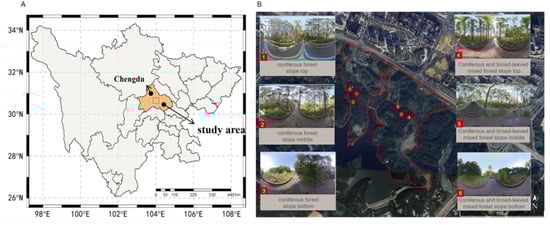
Figure 2.
(A) Location map of the study area; (B) map of the study plot locations and conditions.
Forest trails are the primary locations for recreational experiences in urban forests. Therefore, all the sample plots were established along forest trails with a relatively uniform design and were accessible to residents for walking and sightseeing. The establishment of the sample plots should not only avoid significant differences in the surrounding environment but also avoid small spacings, as this could affect their microclimate. A distance of 50–100 m was generally maintained between the sample plots. The number of sample plots was determined via the area-based ratio method. To increase the representativeness of the sample plots, 2% of the forest area was selected for sample plot establishment. Each sample plot measured 30 m in length and 5 m in width, with an area of 150 m2, and occurred along a trail. The sample plots were analyzed via a typical sampling method. By comprehensively considering the vegetation types and slope positions encountered in urban forest communities, one sample plot was established at each slope position (top, middle, and bottom) for each of the two vegetation types (coniferous and coniferous–broadleaf mixed forests), resulting in a total of six sample plots (Figure 3).
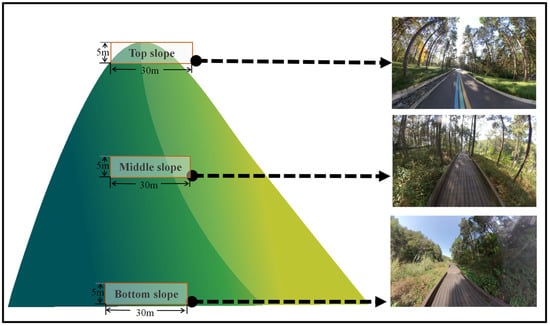
Figure 3.
Experimental sampling plot setup chart.
2.3. Procedure
The 36 participants were randomly assigned to two groups, with each group carrying out the experiment during the brightest period of the day. To eliminate the influence of circadian rhythm variations and autumn in Chengdu, which not only features stable weather, but also marks the peak period for outdoor activities among local residents; the experiment was conducted over two consecutive days in autumn, with data collection occurring at the same time each day (9:00–12:00 and 14:00–17:00). Each day, a total of 18 participants participated in the experiment, and they were assigned to 6 groups in a random manner, with 3 individuals in each group. To eliminate order effects, each group started the experiment at a different location, with varying tour sequences. The six sample plots were analyzed simultaneously, with each experiment lasting 30 min. To minimize fatigue, each group experienced one type of vegetation across three sample plots in the morning, with a 30-minute interval between each plot visit. After the afternoon break, participants continued to experience three sample plots with a different vegetation type in the afternoon. To help volunteers relax and fully experience the environment, no more than three volunteers were allowed in each sample plot at the same time, thereby maintaining a 5 m distance between participants to minimize interference and ensure data reliability. The experimental procedure is as follows (Figure 4): (1) Preparation phase: upon arriving at the experimental site, the volunteers first closed their eyes and sat quietly for 3 min to reach a calm state. (2) Stress induction phase: the researcher played a noise recording and simultaneously began administering stress-inducing tasks (20 math problems or English word translations) to place the participants in a stress state, thus enhancing feelings of tension and pressure. In previous studies, similar scenarios have been employed effectively to induce physical and psychological stress [14,40,41,42]. After 3 min of stress induction, the pre-test phase commenced. (3) Pre-test phase: physiological data were measured and recorded, and the volunteers completed an emotion scale. During the measurement, the participants remained silent and calm. (4) Environmental perception phase: volunteers entered the environmental perception sample plot area and engaged in limited movement within the area for 6–8 min, during which they remained standing. They were instructed not to talk or use electronic devices such as smartphones, focusing solely on perceiving the environment. According to Ulrich’s stress relief theory, the restorative effects of a given restorative environment can be experienced within 5 min [14,41,43]. (5) Post-test phase: After completing the environmental perception experiment, the volunteers first completed a questionnaire, which included personal information and the positive and negative affect schedule (PANAS) emotion scale. During this period, the volunteers rested and entered a calm, relaxed state. The researchers subsequently measured and recorded physiological data again. The experimental procedures were identical for each experimental site.
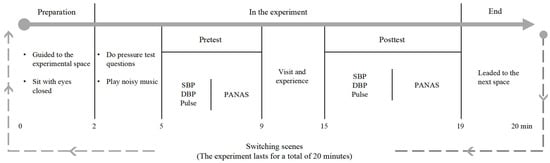
Figure 4.
Experimental flow chart.
2.4. Measurements
2.4.1. Physiological Measures
In this study, a portable wrist-mounted electronic blood pressure monitor (Omron, HEM-6231T, Kyoto, Japan) was used to assess systolic blood pressure (SBP) [mmHg], diastolic blood pressure (DBP) [mmHg], and heart rate (pulse) [bpm], with the device positioned on the participants’ left arm. Each participant’s physiological data were recorded on two separate occasions: once following the stress induction phase, and once after the environmental perception phase within the forest area. Blood pressure and pulse rate serve as indicators of the body’s physiological state, reflecting either arousal or relaxation [44,45].
2.4.2. Psychological Measures
The PANAS scale was utilized to evaluate emotional recovery. Created by Watson et al. in 1988, the PANAS scale is a well-established and validated instrument commonly used to measure emotional states; it has good applicability in measuring immediate emotional responses [13]. The scale consists of 20 items, with 10 assessing positive affect and 10 evaluating negative affect, all presented in a randomized sequence. These items are designed to capture both positive and negative emotional states [13,46]. Each participant filled out the PANAS scale on two occasions: once following the stress induction phase and once after experiencing the greenway landscape. The full scale can be found in the Supplementary Materials (Table S1).
2.4.3. Measurement of Environmental Factors and Indicators
Environmental factors were measured via a three-point sampling method. Within a 30 m × 5 m plot, sample areas (10 m × 10 m) were designated every 10 m, and various indicators were measured at the centre of each sample area. The measurement method involved averaging the readings obtained at the centre of the sample area. The environmental factor measurements were conducted across four periods (9:00–10:30, 10:30–12:00, 14:00–15:30, and 15:30–17:00) and were repeated on three consecutive days. On the basis of previous studies and field surveys of urban forest environmental factors, the main environmental factors measured were the air temperature (TA, °C), relative humidity (RH, %), wind speed (WS, m/s), solar radiation (SR, W/m2), surface temperature (TS, °C), average decibels (dB, dB), sky visibility factor (SVF), panoramic green view rate (GLR), and altitude (ASL). Microclimate indicators were measured using a portable handheld automatic weather station (Kestrel NK5500, Boothwyn, PA, USA), and sound indicators were measured using the digital sound level meter (AWA5636-1, Hangzhou, Zhejiang, China), and solar power was measured using a portable digital light meter (TES, TES1333R, Taipei, Taiwan, China). The measurement height was set to 1.5 m, with each measurement lasting 5 min and repeated three times. The SVF was measured using a fisheye lens to capture sky photos, which were then analyzed in RayMan 12 (Meteorological Institute, University of Freiburg, Freiburg, Germany) for SVF calculation. The GLR was determined using an dual-lens panoramic camera (Insta360 ONEX, Arashi Vision Inc., Shenzhen, Guangdong, China) to capture panoramic photos, followed by pixel-based calculations. The altitude (ASL) was determined using GPS coordinates obtained via a mobile phone (Apple iPhone 14, Apple Inc., Cupertino, CA, USA) to locate the centre of each sample area.
2.5. Statistical Analysis
SPSS 27.0 (IBM Corp. Armonk, NY, USA) was applied to first conduct data reliability and validity tests. After these tests were passed, one-way analysis of variance (ANOVA) with Bonferroni post hoc correction, the Wilcoxon rank sum test, and the Kruskal–Wallis rank sum test was employed to validate the effects of urban forests with different vegetation types and slope positions on physiological and psychological recovery benefits. Next, a regression analysis was performed to examine the associations between various environmental factors of urban forests and the recovery of physiological health.
3. Results
3.1. Urban Forests and Physiological Health Recovery
The Wilcoxon signed-rank test was used to analyze the SBP, DBP, and pulse data before and after the perception experiment, and the results are shown in Figure 5. After experiencing the urban coniferous forest (volunteers stood in the environmental perception plot area to perceive the forest environment), the participants showed a significant decrease in SBP (p < 0.05) and pulse rate (p < 0.05), whereas DBP did not significantly change. After experiencing the urban coniferous–broadleaf mixed forest, the participants exhibited a notable reduction in SBP was observed (p < 0.05), whereas no significant changes were detected in DBP or heart rate.
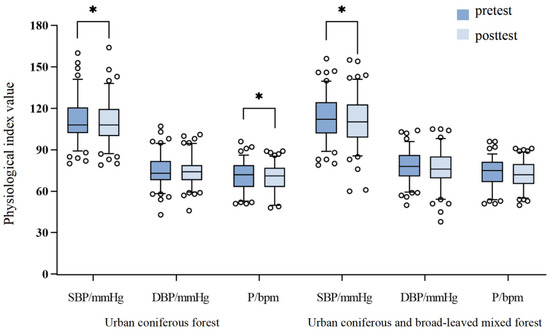
Figure 5.
Systolic blood pressure, diastolic blood pressure, and pulse for the two vegetation types before and after experiencing the urban forests. n = 36; median ± standard deviation; * p < 0.05; verification via the Wilcoxon rank sum test.
In a comparison of the changes in SBP, DBP, and pulse rate between the two urban forest vegetation types (Figure 6), the results of the Mann–Whitney U test indicated a significant difference in the variation in pulse rate (p < 0.05) after the perception experiment between the urban coniferous and coniferous–broadleaf mixed forests.
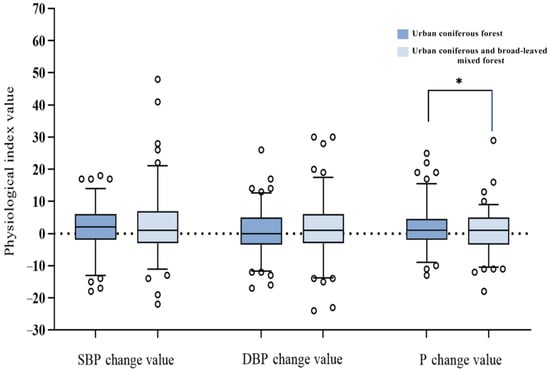
Figure 6.
Comparison of the systolic blood pressure, diastolic blood pressure and pulse rate changes between the two vegetation types. n = 36; median ± standard deviation; * p < 0.05; validated via the Mann–Whitney U test.
As shown in Figure 7, participants experienced perception in urban forests at different slope positions. The Wilcoxon rank-sum test revealed that, in the coniferous forest, participants at the top slope showed a marked decrease in systolic blood (p < 0.05), while diastolic blood pressure and pulse rate showed no significant alterations. At the midslope position, both systolic blood pressure (p < 0.05) and pulse pressure (p < 0.05) were significantly reduced, whereas diastolic blood pressure showed no significant change. At the bottom slope position, none of the three physiological indicators showed any significant changes. In the mixed coniferous–broadleaf forest, participants at the midslope position showed a significant reduction in systolic blood pressure (p < 0.05), diastolic blood pressure (p < 0.05), and pulse rate (p < 0.01), while no significant changes were observed in the three physiological indicators for participants at the top or bottom slopes.
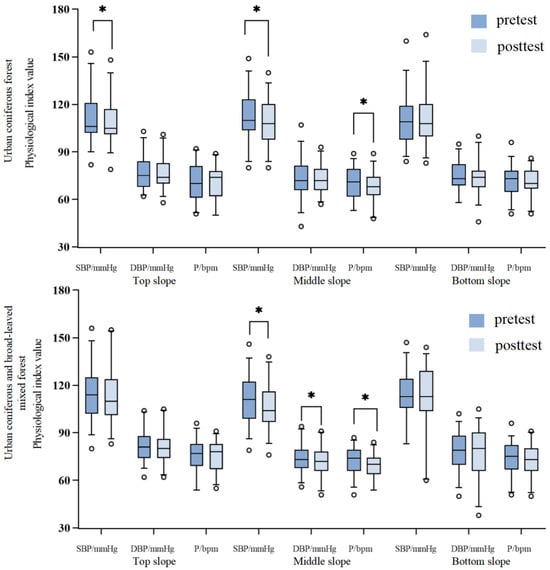
Figure 7.
Comparison of the systolic blood pressure, diastolic blood pressure, and pulse rate changes before and after experiencing urban coniferous and coniferous–broadleaf mixed forests at the three slope positions. n = 36; median ± standard deviation; * p < 0.05; verification via the Wilcoxon rank sum test.
The SBP, DBP, and pulse rate changes were compared among the different slope positions in the coniferous forest (Figure 8) via the Kruskal–Wallis rank sum test. The results revealed a significant intergroup difference in SBP changes after the perceptual experience among the different slope positions (H = 7.724, degrees of freedom (d.f.) = 2, and p < 0.05), whereas no significant differences were found for the other physiological indicators. Bonferroni post hoc correction was conducted for pairwise comparisons of significant SBP changes, revealing that the SBP change at the bottom slope position was significantly lower than that at the midslope position (median: 0.00 and 3.00; p < 0.05) and the top slope position (median: 0.00 and 3.00; p < 0.05) in the coniferous forest.
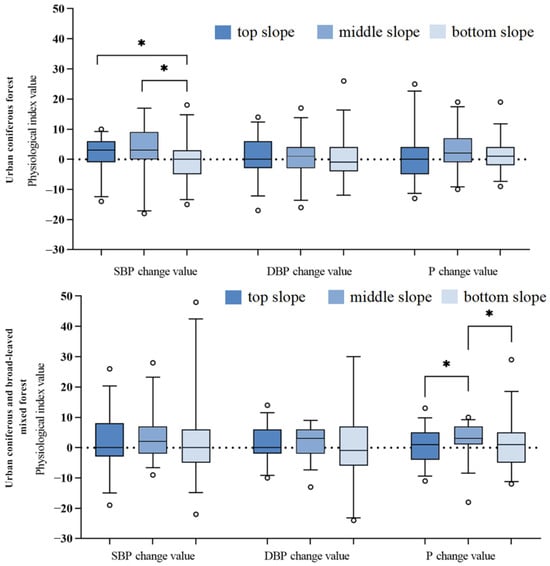
Figure 8.
Comparison of the systolic blood pressure, diastolic blood pressure and pulse rate changes at the three slope positions in the urban coniferous and coniferous–broadleaf mixed forests. n = 36; median ± standard deviation; * p < 0.05; verified via the Kruskal–Wallis rank sum test.
In the coniferous–broadleaf mixed forest, the SBP, DBP, and pulse rate changes at the three slope positions were analyzed (Figure 8). The Kruskal–Wallis rank sum test results indicated a significant intergroup difference in the pulse rate changes after the perceptual experience at the different slope positions (H = 6.928, d.f. = 2, and p < 0.05), in contrast, no significant differences were found in the other physiological indicators. To further examine the significant changes in pulse rate, a Bonferroni post hoc correction was applied to the pairwise comparisons, revealing that the pulse rate change at the midslope position was significantly greater than that at the top slope (median: 3 and 1; p < 0.05) and the bottom slope positions (median: 3 and 1; p < 0.05).
3.2. Urban Forests and Psychological Health Recovery
As shown in Figure 9, after experiencing the two urban forest vegetation types, the participants’ positive emotion scores significantly increased, and their negative emotion scores significantly decreased. However, no significant difference was found between the urban coniferous and coniferous–broadleaf mixed forests. The Wilcoxon rank sum test results indicated that after experiencing the urban coniferous forest, participants’ positive emotions significantly increased (p < 0.01), and their negative emotions significantly decreased (p < 0.01). Similarly, after experiencing the urban coniferous–broadleaf mixed forest, participants’ positive emotions significantly increased (p < 0.01), and their negative emotions significantly decreased (p < 0.01).
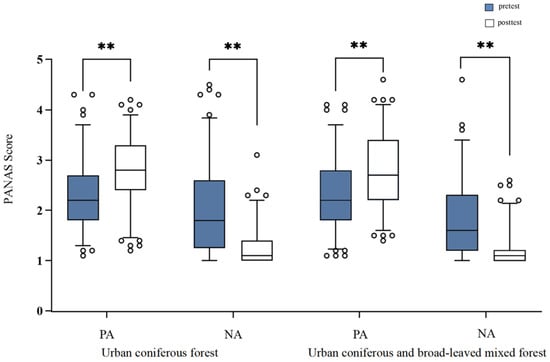
Figure 9.
Comparison of the changes in positive and negative emotions before and after experiencing urban coniferous and urban coniferous–broadleaf mixed forests. n = 36; median ± standard deviation ** p < 0.01; verified via the Wilcoxon rank sum test.
At the different slope positions in the coniferous forest, the results, as shown in Figure 10, indicated that at the top slope position, participants’ positive emotions significantly increased (2.46 and 2.82, Z = −2.59, and p < 0.05), and their negative emotions significantly decreased (1.92 and 1.20, Z = −4.57, and p < 0.05). At the midslope position, participants’ positive emotions significantly increased (2.23 and 2.88, Z = −4.62, and p < 0.05), and their negative emotions significantly decreased (1.91 and 1.25, Z = −4.01, and p < 0.05). At the bottom slope position, participants’ positive emotions significantly increased (2.19 and 2.67, Z = −4.039, and p < 0.05), and their negative emotions significantly decreased (2.13 and 1.39, Z = −4.36, and p < 0.05). The results also revealed that after experiencing the coniferous forest at the three slope positions, the highest positive emotion scores were observed in the top slope position, while the mid-slope position demonstrated the lowest negative emotion scores.
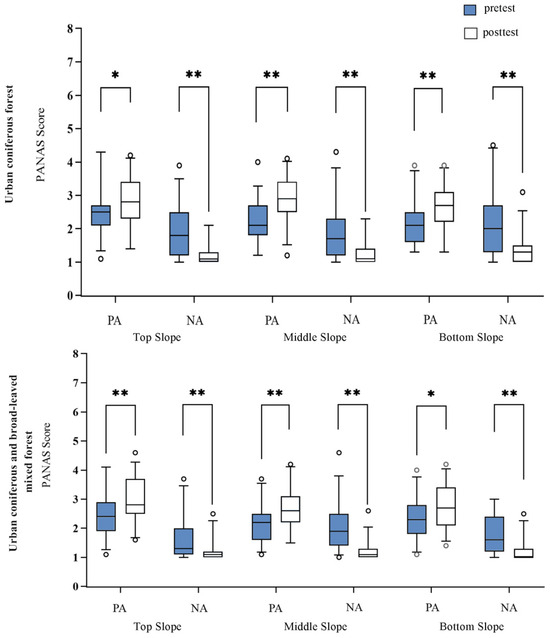
Figure 10.
Comparison of the changes in positive and negative emotions before and after experiencing urban coniferous and coniferous–broadleaf mixed forests at the three slope positions. n = 36; median ± standard deviation * p < 0.05; ** p < 0.01; verified via the Kruskal–Wallis rank sum test.
At the different slope positions in the conifer–broadleaf mixed forest, the results, as shown in Figure 10, indicated that at the top slope position, participants’ positive emotions significantly increased (p < 0.01), and their negative emotions significantly decreased (p < 0.01). At the midslope position, participants’ positive emotions significantly increased (p < 0.01), and their negative emotions significantly decreased (p < 0.01). At the bottom slope position, participants’ positive emotions significantly increased (p < 0.01), and their negative emotions significantly decreased (p < 0.01). The results also revealed that after experiencing the coniferous–broadleaf mixed forest at the three slope positions, the top slope position showed the highest scores for positive emotions and the lowest scores for negative emotions.
Further comparison of the changes in positive and negative emotions and total emotion changes (sum of positive and negative emotion changes) across the three slope positions in the urban coniferous and mixed coniferous–broadleaf forests, as shown in Figure 11, revealed no significant differences according to the Kruskal–Wallis rank sum test results.
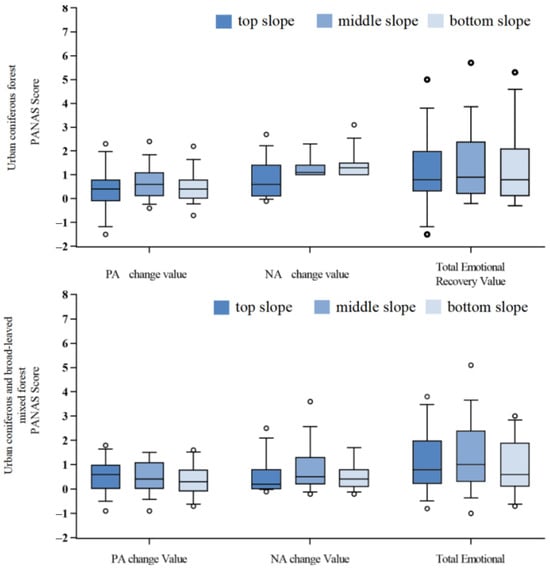
Figure 11.
Comparison of the changes in positive and negative emotions and total emotion changes (sum of positive and negative emotion changes) in the urban coniferous and coniferous–broadleaf mixed forests. n = 36; verified via the Kruskal–Wallis rank sum test.
3.3. Environmental Factors of Urban Forests and Health Restoration
As shown in Figure 12, the Mann–Whitney U test was used to compare the differences in environmental factors between urban coniferous forests and urban coniferous–broadleaf mixed forests. The results indicated significant differences in humidity (median: 58.10 and 68.50, Z = −2.093, p = 0.036), wind speed (median: 0.17 and 0.00, Z = −4.944, p < 0.001), solar radiation (median: 85.20 and 47.27, Z = −3.342, p < 0.001), sound decibels (median: 41.80 and 40.40, Z = −3.292, p < 0.001), and panoramic green view ratio (median: 0.32 and 0.39, Z = −4.233, p < 0.001) between the two forest types.
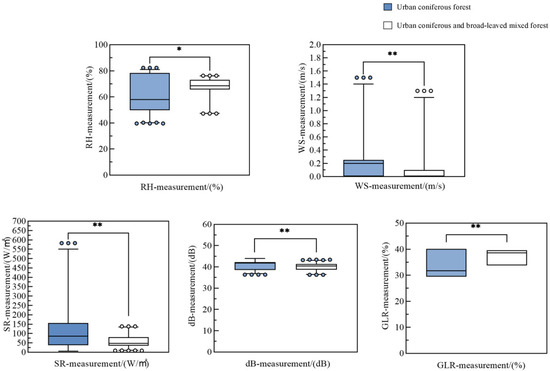
Figure 12.
Differences in the relative humidity, wind speed, solar radiation, sound decibels, and panoramic green view rate between the two vegetation types. n = 36; median ± standard deviation * p < 0.05; ** p < 0.01; verification via the Mann–Whitney U test.
A further comparison of the environmental factors across the three slope positions in the urban coniferous forest revealed the following results (Figure 13): the Kruskal–Wallis test data revealed significant between-group differences in temperature (H = 8.296, d.f. = 2, and p = 0.016), humidity (H = 9.371, d.f. = 2, and p = 0.009), wind speed (H = 28.781, d.f. = 2, and p < 0.001), solar radiation (H = 34.477, d.f. = 2, and p < 0.001), ground temperature (H = 26.420, d.f. = 2, and p < 0.001), sound decibels (H = 11.465, d.f. = 2, and p = 0.003), SVF (H = 104.00, d.f. = 2, and p < 0.001), panoramic green view rate (H = 104.00, d.f. = 2, and p < 0.001), and altitude (H = 91.406, d.f. = 2, and p < 0.001) in the coniferous forest. Post hoc pairwise comparisons via Bonferroni correction revealed the following significant differences in environmental factors across the different slope positions in the urban coniferous forest: the temperature at the bottom slope position was significantly greater than that at the top (19.84 vs. 17.83, p = 0.006) and midslope positions (19.84 vs. 18.31, p = 0.034). The relative humidity at the bottom slope position was significantly lower than that at the top (57.43 vs. 63.86, p = 0.004) and midslope positions (57.43 vs. 62.85, p = 0.021). The wind speed at the bottom slope position was significantly greater than that at the top (0.63 vs. 0.08, p < 0.001) and midslope positions (0.63 vs. 0.14, p = 0.001). Solar radiation at the bottom slope position was significantly greater than that at the midslope (275.20 vs. 64.23, p < 0.001) and top slope positions (275.20 vs. 84.09, p < 0.001). The sound level in decibels at the bottom slope position was significantly greater than that at the midslope (71.86 vs. 41.31, p < 0.001) and top slope positions (71.86 vs. 41.31, p < 0.001). The SVF at the midslope position was significantly lower than that at the top (0.67 vs. 0.79, p < 0.001) and bottom slope positions (0.67 vs. 0.84, p = 0.000). The panoramic green view rate at the top slope position was significantly lower than that at the midslope (0.29 vs. 0.32, p < 0.001) and bottom slope positions (0.29 vs. 0.40, p = 0.000). The altitude at the bottom slope position was significantly lower than that at the top (437.74 vs. 472.57, p = 0.000) and midslope positions (437.74 vs. 451.06, p < 0.001).
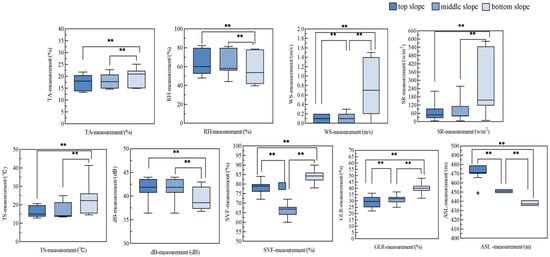
Figure 13.
Comparison of the differences in the environmental characteristics of temperature, humidity, wind speed, solar radiation, ground temperature, sound decibels, sky visibility factor, panoramic green view rate, and altitude among the three slope positions in the urban coniferous forest. n = 36; median ± standard deviation; ** p < 0.01; verified via the Kruskal–Wallis rank sum test.
The differences in environmental factors across the three slope positions in the urban coniferous–deciduous mixed forest were analyzed, and the results are shown in Figure 14. The Kruskal–Wallis rank sum test results revealed significant between-group differences in the wind speed (H = 42.077, d.f. = 2, and p < 0.001), solar radiation (H = 51.029, d.f. = 2, and p < 0.001), sound decibels (H = 23.257, d.f. = 2, and p < 0.001), SVF (H = 104.00, d.f. = 2, and p < 0.001), panoramic green view rate (H = 104.00, d.f. = 2, and p < 0.001), and altitude (H = 94.36, d.f. = 2, and p < 0.001). Post hoc pairwise comparisons via Bonferroni correction revealed the following significant differences: the wind speed at the bottom slope position was significantly greater than that at the top (0.31 vs. 0.09, p = 0.09) and midslope positions (0.31 vs. 0.00, p < 0.001). The solar radiation at the midslope position was significantly lower than that at the top (28.87 vs. 87.07, p < 0.001) and bottom slope positions (28.87 vs. 65.24, p < 0.001). The level of sound decibels at the bottom slope position were significantly greater than that at the top (40.97 vs. 39.79, p = 0.009) and midslope positions (40.97 vs. 39.08, p < 0.001). The SVF at the midslope position was significantly lower than that at the top (0.64 vs. 0.71, p < 0.001) and bottom slope positions (0.64 vs. 0.90, p = 0.000). The panoramic green view rate at the midslope position was significantly lower than that at the top (0.34 vs. 0.40, p = 0.000) and bottom slope positions (0.34 vs. 0.39, p < 0.001). The altitude at the bottom slope position was significantly lower than that at the top (435.00 vs. 476.97, p = 0.000) and midslope positions (435.00 vs. 464.54, p = 0.000).
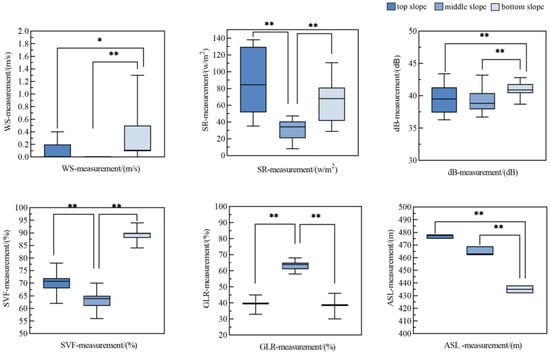
Figure 14.
Comparison of the differences in the environmental characteristics of the wind speed, solar radiation, sound decibels, sky visibility factor, panoramic green view rate, and altitude among three slope positions in the urban coniferous–broadleaf mixed forest. n = 36; median ± standard deviation * p < 0.05; ** p < 0.01; verified via the Kruskal–Wallis rank sum test.
Multivariate linear regression analysis was conducted to examine the physiological recovery effects of urban coniferous forests and urban coniferous–broadleaf mixed forests in relation to the various environmental factors (Table 1). The results revealed that the environmental factors explained 16.1% and 17.8%, respectively, of the total variance in the physiological recovery benefits. In the urban coniferous forest, the key environmental factors influencing physiological recovery were the panoramic green view rate (β = −6.639, t = −2.663, and p = 0.009) and elevation (β = 0.014, t = 2.239, and p = 0.028). The panoramic green view rate was negatively correlated with physiological recovery benefits, whereas the elevation exhibited a positive correlation. In the urban mixed coniferous and broad-leaved forest, the key environmental factors were the temperature (β = −0.144, t = −2.309, and p = 0.023), humidity (β = −0.028, t = −1.999, and p = 0.048), and wind speed (β = 0.413, t = 2.384, and p = 0.019). Except for the wind speed, which was positively correlated with physiological recovery benefits, the other two factors (temperature and humidity) exhibited negative correlations.

Table 1.
Key environmental characteristics associated with physiological restoration.
4. Discussion
4.1. Urban Forest Vegetation Types and Physiological–Psychological Recovery
In the context of rapid urbanization, there is a growing need for natural spaces to alleviate stress and promote physical and mental recovery. This study focuses on the effects of two urban forest vegetation types on physiological and psychological health restoration. After experiencing the urban coniferous and coniferous–broadleaf mixed forests, the participants showed significant recovery in terms of both physiological and psychological aspects. These findings are consistent with those of previous research on the restorative effects of forest environments [47,48,49]. However, the study further reveals that the restorative effects of urban forests vary depending on vegetation type. Pure forests, with a neat and grand visual appearance, exhibit greater aesthetic appeal than coniferous–broadleaf mixed forests do, which contributes to the calming effect on emotions. However, compared with other vegetation types, coniferous–broadleaf mixed forests exert the smallest effect on human body relaxation. When viewing the landscape of mixed forests, the sympathetic nervous system remains activated for a longer time, leading to a shorter period of relaxation for the body and mind [50].
In the urban coniferous forest, the panoramic green view rate was a key environmental factor influencing physiological recovery; namely, it was negatively correlated with physiological recovery benefits. Previous studies have shown that greater vegetation density is often associated with positive physiological and psychological health outcomes. High-density vegetation is most effective at restoring participants’ attention and evoking the most positive emotions [51], and stress recovery effects increase correspondingly [52]. However, these results contradict our findings. Therefore, we analyzed the reasons underlying this discrepancy. In our study, the coniferous forest with a higher panoramic green view rate also exhibited greater plant diversity and a larger number of plants. Previous research has confirmed that people’s preferences are negatively correlated with biodiversity. Notably, participants typically evaluate wild forests (with the highest biodiversity) negatively while assigning positive evaluations to ornamental parks with the lowest biodiversity. They perceive ecologically diverse plantings as disorderly and chaotic [53]. These factors may collectively explain the negative correlation between the panoramic green view rate and physiological recovery in the coniferous forest. Therefore, in future urban coniferous forest development, it is essential to consider residents’ visual aesthetic preferences, maintain appropriate planting density, and enhance forest management and maintenance to improve physiological recovery outcomes for urban residents in these environments.
In the urban coniferous–broadleaf mixed forest, the ground temperature, humidity, and wind speed were key environmental factors influencing physiological recovery. The ground temperature and humidity were negatively correlated with physiological recovery benefits, whereas the wind speed indicated a positive correlation. Among all meteorological factors, human comfort with the surrounding environment is closely related to temperature and humidity [24]. Lower temperatures and appropriate relative humidity levels promote human health [54,55]. In this study, the areas with lower temperatures and humidities in the mixed coniferous–broadleaf forest exhibited the greatest physiological recovery effect. Research has confirmed that as the temperature decreases and the air humidity becomes suitable, human comfort increases [56], the heart rate decreases [57], and negative emotions are alleviated [56]. The results of our study support this view. Although the wind speed was positively correlated with physiological recovery, we also observed that in the coniferous–broadleaf mixed forest, the wind speed was relatively low, yet physiological recovery was relatively high. This seemingly contradictory result suggests that the factors influencing the restorative benefits of urban forests are not singular but rather that the restorative benefits are influenced by various environmental elements interacting with each other. Therefore, in the future, when creating mixed coniferous–broadleaf forests, it is important to focus on optimizing and adjusting microclimatic factors. The thoughtful design of terrain and vegetation planting methods, microclimates can be improved, thereby enhancing human comfort and health recovery benefits. This approach aims to create superior forest recreational spaces for urban residents, aligning with the goals of urban ecological environment construction and the physical and mental health needs of the populace.
4.2. Urban Forest Slope Position and Physiological and Psychological Recovery
To provide scientific support for urban forest planning and utilization, this study thoroughly explored the effects of urban forests at different slope positions and the corresponding environmental factors on physical and psychological recovery.
In this study, three slope positions were selected for research. The hilltop site was located at the highest point in the forest, along the ridge line, offering an open view. The bottom site was located at the lowest point along the forest edge, with the highest degree of vegetation enclosure. The midslope site occurred in between, with a moderate degree of vegetation enclosure. After experiencing the coniferous forest environment at the three slope positions, restorative effects on both the physical and psychological well-being of participants were observed at the top and midslope positions, whereas only emotional recovery occurred at the bottom slope position. Hence, the findings indicated that the restorative benefits at the top and midslope positions were greater than those of the bottom slope position, further confirming that the differences in environmental factors at the various slope positions significantly affect the restorative outcomes. As such, with changes in the slope position (i.e., elevation along the same slope), the degree of visual enclosure also varied. Previous research has shown that spatial openness and complexity are significantly correlated with restorative effects [48]. Compared with fully enclosed or completely open spaces, semiopen spaces that provide a sense of visual enclosure and offer distant views yield better restorative effects [49]. The spatial characteristics at the hilltop site precisely meet these conditions, thus supporting our study findings. From the perspective of microclimate factors, compared with those at the top and midslope positions, the bottom slope position exhibited significantly higher temperatures, wind speeds, and solar radiation levels, whereas the humidity was significantly lower. Since the bottom site is closer to the forest edge, the sky visibility is the highest, resulting in less favourable microclimatic conditions than those at the other two slope positions. Previous studies have confirmed that the topography is an effective predictor of local microclimates, with varying degrees of wind and solar radiation exposure under different terrain features shaping fine-scale changes in forest microclimates, such as daily average temperature and saturated vapour pressure differences [50]. Our results support this view. Additionally, in the coniferous forest, the canopy structure, or the SVF, was significantly lesser at the top and midslope positions than at the bottom slope position. Hardwick et al. [51] suggested that vegetative structural attributes, such as the canopy height and density, strongly influence the near-ground microclimate conditions by providing shade, altering airflow, and limiting leaf transpiration. These factors, when combined with the topography, create shaded spaces that contribute to the creation of favourable microclimates. Vegetation lowers the air temperature and increases the air humidity, thus increasing human comfort levels [52]. The results of our study support this finding by demonstrating that the different slope positions, through their microclimatic effects, exhibited varying impacts on human physical and psychological recovery. Slope positions with better microclimatic conditions could provide greater recovery benefits, whereas those with less favourable conditions could yield lower recovery outcomes.
In the coniferous–broadleaf mixed forest, all three slope positions indicated restorative effects on participants’ emotions, but only the midslope position exhibited physiological recovery benefits. Notably, the three physiological recovery indicators for participants at the midslope position significantly decreased, suggesting that the midslope position exhibited greater physiological recovery benefits than those at the top and bottom slope positions. We measured and analyzed the environmental factors in the forest, and the results indicated that the midslope position exhibited the highest plant coverage, which led to lower solar radiation and sky visibility levels than those at the other slope positions. Previous studies have shown that forests with greater canopy closure, a reasonable density, large leaf areas, and complex structures more notably affect microclimate regulation [58]. Additionally, the human heart rate is positively correlated with the environmental light intensity [59], and our results support these findings.
Overall, in urban forest construction and renovation, it is essential to fully consider the differences in physical and mental restoration benefits as well as the variations in environmental factors across different slope positions. For example, recreational and recuperative facilities can be strategically established in ridge and midslope areas to fully capitalize on their superior restorative functions. In contrast, for bottom slope areas, adjusting vegetation structure may help improve the microclimate and enhance recovery efficacy. Additionally, when developing mixed coniferous–broadleaf forests, special emphasis should be placed on the midslope areas to better harness the forest’s capacity for promoting residents’ physiological recovery. Through these measures, urban forest spatial layouts can be optimized to maximize their restorative functions and meet the demand for a healthy living environment among urban residents.
4.3. Limitations and Future Studies
Firstly, the study had a relatively small sample size, consisting predominantly of younger participants, with an average age of 24 years. Future studies should aim to increase the sample size and obtain broader demographic data, especially for older adults, children, and individuals in need of health recovery, to enhance the research and obtain more generalizable results. Second, different seasons exhibit distinct climatic characteristics, and climate variations can lead to varying physiological and psychological recovery effects [60]. In this study, urban forests were analyzed in autumn only, which may introduce potential seasonal bias. Future research should consider longitudinal studies conducted throughout various seasons to investigate the prolonged effects of urban forests on both physical and mental health, thus evaluating the lasting restorative benefits of these environments. In addition, this study mainly compares the differences in physiological and psychological indicators between different vegetation types and slope positions. Future research could involve a comparative study between a control group that has not undergone any intervention and the recovery indicators after experiencing the forest environment. Finally, different forest types and different countries will have different characteristics and will adapt differently to the humidity and temperature in the forest environment, and these issues are worthy of in-depth empirical research in the future.
5. Conclusions
Urban forests serve as vital components of restorative environments in cities, significantly contributing to the physical and mental health recovery of urban residents, as well as supporting the sustainable development of ecosystems. This study represents the first attempt to investigate the variations in health recovery outcomes across urban forests with different vegetation types and slope positions. Our results suggest that factors such as vegetation type, slope position, and other key environmental variables are critical considerations for the planning and design of urban forests aimed at promoting health and well-being. First, urban forests with different vegetation types can yield varying restorative effects, with urban coniferous forests providing better health recovery benefits than urban coniferous–broadleaf mixed forests. Second, forests at different slope positions exhibit distinct recovery effects. In urban coniferous forests, the recovery benefits at the upper and middle slope positions are greater than those at the lower slope position. In urban coniferous–broadleaf mixed forests, the midslope position exhibits greater physiological recovery benefits than those at the upper and lower slope positions. Additionally, the panoramic green view rate and elevation are key environmental factors influencing the physiological recovery effect of urban coniferous forests, whereas the ground temperature, humidity, and wind speed are key environmental factors impacting the physiological recovery effect of coniferous–broadleaf mixed forests. The results indicate that incorporating targeted environmental interventions based on essential factors such as vegetation type and slope position can enhance the quality of urban green spaces, ultimately benefiting public health in urban forest design.
Supplementary Materials
The following supporting information can be downloaded at https://www.mdpi.com/article/10.3390/f16040653/s1: Table S1: The Positive and Negative Affect Schedule (PANAS).
Author Contributions
Conceptualization, L.P.; methodology, L.P.; investigation, L.P. and S.C.; formal analysis, L.P.; visualization, L.P.; writing—original draft preparation, L.P.; writing—review and editing, L.P., S.C., Y.C., B.Z., D.L., C.X., X.L. and J.M.; supervision, J.M.; funding acquisition, J.M. All authors have read and agreed to the published version of the manuscript.
Funding
This research was funded by the Sichuan Science and Technology Program (grant number 2021YFN0006).
Data Availability Statement
We do not provide public access to the dataset due for the protection of the privacy of the participants. Regarding the details of the data, please contact the corresponding author.
Acknowledgments
The authors thank the 36 individuals who participated in this study.
Conflicts of Interest
The authors declare no conflicts of interest.
References
- Giles-Corti, B.; Vernez-Moudon, A.; Reis, R.; Turrell, G.; Owen, N. Series Urban design, transport, and health 1 City planning and population health: A global challenge. Lancet 2016, 6736, 30066. [Google Scholar]
- Velarde, M.D.; Fry, G.; Tveit, M. Health Effects of Viewing Landscapes—Landscape Types in Environmental Psychology. Urban For. Urban Green. 2007, 6, 199–212. [Google Scholar] [CrossRef]
- Norimasa, T.; Akio, F.; Haruo, S.; Masahiro, H. Management Effectiveness of a Secondary Coniferous Forest for Landscape Appreciation and Psychological Restoration. Int. J. Environ. Res. Public Health 2017, 14, 800. [Google Scholar] [CrossRef] [PubMed]
- O’Brien, L.E.; Urbanek, R.E.; Gregory, J.D. Ecological functions and human benefits of urban forests. Urban For. Urban Green. 2022, 75, 127707. [Google Scholar] [CrossRef]
- Nilsson, K.; Sangster, M.; Gallis, C.; Hartig, T.; De Vries, S.; Seeland, K.; Schipperijn, J. Forests, Trees and Human Health: Introduction; Springer: Berlin/Heidelberg, Germany, 2011. [Google Scholar]
- Karjalainen, E.; Sarjala, T.; Raitio, H. Promoting human health through forests: Overview and major challenges. Environ. Health Prev. Med. 2010, 15, 1–8. [Google Scholar] [CrossRef]
- Lee, J.; Tsunetsugu, Y.; Takayama, N.; Park, B.J.; Li, Q.; Song, C.; Komatsu, M.; Ikei, H.; Tyrväinen, L.; Kagawa, T. Influence of Forest Therapy on Cardiovascular Relaxation in Young Adults. Evid.-Based Complement. Altern. Med. 2014, 2014, 834360. [Google Scholar] [CrossRef]
- Kaplan, R.; Kaplan, S. The Experience of Nature: A Psychological Perspective; Cambridge University Press: New York, NY, USA, 1989. [Google Scholar]
- Ulrich, R.S. Health Benefits of Gardens in Hospitals. In Proceedings of the Plants for People International Exhibition Floriade 2002, Haarlemmermeer, The Netherlands, 6 April–20 October 2002. [Google Scholar]
- Wang, R.; Zhao, J.; Meitner, M.J.; Hu, Y.; Xu, X. Characteristics of urban green spaces in relation to aesthetic preference and stress recovery. Urban For. Urban Green. 2019, 41, 6–13. [Google Scholar] [CrossRef]
- Xue-Jun, Y.; Zhi-Lin, J. Applied State Space Modeling in Eco-economic Research of Forest Landscape. Syst. Eng.-Theory Pract. 2001, 21, 111–116. [Google Scholar]
- Hartig, T.; Evans, G.W.; Jamner, L.D.; Davis, D.S.; Gärling, T. Tracking restoration in natural and urban field settings. J. Environ. Psychol. 2003, 23, 109–123. [Google Scholar] [CrossRef]
- Watson, D.; Clark, L.A.; Tellegen, A. Development and validation of brief measures of positive and negative affect: The PANAS scales. J. Personal. Soc. Psychol. 1988, 54, 1063. [Google Scholar] [CrossRef]
- Ulrich, R.S.; Simons, R.F.; Losito, B.D.; Fiorito, E.; Miles, M.A.; Zelson, M. Stress recovery during exposure to natural and urban environments. J. Environ. Psychol. 1991, 11, 201–230. [Google Scholar] [CrossRef]
- Berto, R. Exposure to restorative environments helps restore attentional capacity. J. Environ. Psychol. 2005, 25, 249–259. [Google Scholar] [CrossRef]
- Miyazaki, Y. Physiological and Psychological Effects of Viewing Forests on Young Women. Forests 2019, 10, 635. [Google Scholar] [CrossRef]
- Frenne, P.D.; Lenoir, J.; Luoto, M.; Scheffers, B.R.; Hylander, K. Forest microclimates and climate change: Importance, drivers and future research agenda. Glob. Change Biol. 2021, 27, 2279–2297. [Google Scholar] [CrossRef]
- Zhu, S.; Wang, R.; Wang, Q.; Lei, T.; Cui, G. Coniferous and broad-leaved mixed forest has the optimal forest therapy environment among stand types in Xinjiang. Ecol. Indic. 2024, 169, 112950. [Google Scholar] [CrossRef]
- Li, M.; Wu, T.; Li, W.; Wang, C.; Dai, W.; Su, X.; Zhao, Y. Terrain Skeleton Construction and Analysis in Loess Plateau of Northern Shaanxi. ISPRS Int. J. Geo-Inf. 2022, 11, 136. [Google Scholar] [CrossRef]
- Swatantran, A.; Tang, H.; Barrett, T.; Decola, P.; Dubayah, R. Rapid, High-Resolution Forest Structure and Terrain Mapping over Large Areas using Single Photon Lidar. Sci. Rep. 2016, 6, 28277. [Google Scholar] [CrossRef]
- Wang, S.; Li, W. GeoAI in terrain analysis: Enabling multi-source deep learning and data fusion for natural feature detection. Comput. Environ. Urban Syst. 2021, 90, 101715. [Google Scholar] [CrossRef]
- Berry, Z.C.; Gotsch, S.G.; Holwerda, F.; Muñoz-Villers, L.E.; Asbjornsen, H. Slope position influences vegetation-atmosphere interactions in a tropical montane cloud forest—ScienceDirect. Agric. For. Meteorol. 2016, 221, 207–218. [Google Scholar] [CrossRef]
- Jo, H.-J.; Fujii, E.; Cho, T.-D. An Experimental Study on Physiological and Psychological Effects of Pine Scent. J. Korean Inst. Landsc. Archit. 2010, 38, 1–10. [Google Scholar]
- Gillerot, L.; Rozario, K.; De, F.P.; Oh, R.; Ponette, Q.; Bonn, A.; Chow, W.; Godbold, D.; Steinparzer, M.; Haluza, D. Forests are chill: The interplay between thermal comfort and mental wellbeing. Landsc. Urban Plan. 2024, 242, 104933. [Google Scholar] [CrossRef]
- Lin, W.; Chen, Q.; Zhang, X.; Tao, J.; Zeng, C. Effects of Different Bamboo Forest Spaces on Psychophysiological Stress and Spatial Scale Evaluation. Forests 2020, 11, 616. [Google Scholar] [CrossRef]
- Schirpke, U.; Zoderer, B.M.; Tappeiner, U.; Tasser, E. Effects of past landscape changes on aesthetic landscape values in the European Alps. Landsc. Urban Plan. 2021, 212, 104109. [Google Scholar] [CrossRef]
- Hartig, G.T. Change in mood as a function of environmental design: Arousal and pleasure on a simulated forest hike. J. Environ. Psychol. 1997, 17, 283–300. [Google Scholar]
- 2023 Chengdu National Economic and Social Development Statistical Bulletin. Available online: https://www.chengdu.gov.cn/cdsrmzf/c169603/2024-03/30/content_79e89b9a8f904d168fa821a8642f6831.shtml (accessed on 30 March 2024).
- Xiangyang, X. Evolution Characteristics of Urban Built-up Areas in Chengdu and Its Driving Forces in Recent 30 years. J. China West Norm. Univ. (Nat. Sci.) 2021, 42, 290–298. [Google Scholar]
- Hannon, E.; Anselimus, S.M.; Bardikoff, N.; Bulc, B.; Germann, S.; Gonsalves, P.P.; Melendez-Torres, G.; Ospina-Pinillos, L.; Sinha, M.; Wanjiru, M. Why cities matter for adolescent mental health and wellbeing. Lancet 2024, 403, 708–710. [Google Scholar] [CrossRef]
- Tang, L.; Wang, J.; Xu, L.; Lu, H. Exploring New Avenues in Sustainable Urban Development: Ecological Carbon Dynamics of Park City in Chengdu. Sustainability 2024, 16, 6471. [Google Scholar] [CrossRef]
- Mehrabian, A.; Russell, J.A. An Approach to Environmental Psychology; The MIT Press: Cambridge, MA, USA, 1974. [Google Scholar]
- Kreibig, S.D. Autonomic nervous system activity in emotion: A review. Biol. Psychol. 2010, 84, 394–421. [Google Scholar] [CrossRef]
- Keevers, L.; Gough, D.; Cameron, J.; McKnight, A.; Ebejer, S.; Duchesne, S.; Gowen, A.; Fildes, K.; Mackay, M. Practices supporting community recovery and healing from climate-related disasters: A systematic review. Int. J. Environ. Res. Public Health 2024, 21, 795. [Google Scholar] [CrossRef]
- Yao, W.; Luo, Q.; Zhang, X.; Zhuo, C.; Mi, L. Exploring the effect of different typical plant community on human stress reduction: A field experiment. Sci. Rep. 2024, 14, 5600. [Google Scholar] [CrossRef]
- Chen, H.; Sloggy, M.R.; Dhiaulhaq, A.; Escobedo, F.J.; Rasheed, A.R.; Sánchez, J.J.; Yang, W.; Yu, F.; Meng, Z. Boundary of ecosystem services: Guiding future development and application of the ecosystem service concepts. J. Environ. Manag. 2023, 344, 118752. [Google Scholar] [CrossRef] [PubMed]
- Carrer, M.; Castagneri, D.; Popa, I.; Pividori, M.; Lingua, E. Tree spatial patterns and stand attributes in temperate forests: The importance of plot size, sampling design, and null model. For. Ecol. Manag. 2018, 407, 125–134. [Google Scholar] [CrossRef]
- Hua, F.; Bruijnzeel, L.A.; Meli, P.; Martin, P.A.; Zhang, J.; Nakagawa, S.; Miao, X.; Wang, W.; McEvoy, C.; Peña-Arancibia, J.L. The biodiversity and ecosystem service contributions and trade-offs of forest restoration approaches. Science 2022, 376, 839–844. [Google Scholar] [CrossRef]
- Murcia, C. Edge effects in fragmented forests: Implications for conservation. Trends Ecol. Evol. 1995, 10, 58–62. [Google Scholar] [CrossRef]
- van den Berg, A.E.; Koole, S.L.; van der Wulp, N.Y. Environmental preference and restoration: (How) are they related? J. Environ. Psychol. 2003, 23, 135–146. [Google Scholar] [CrossRef]
- Cao, S.; Song, C.; Jiang, S.; Luo, H.; Zhang, P.; Huang, Y.; Yu, J.; Li, K.; Li, N.; Guo, B. Effects of urban greenway environmental types and landscape characteristics on physical and mental health restoration. Forests 2024, 15, 679. [Google Scholar] [CrossRef]
- Cao, S.; Shang, Z.; Li, X.; Luo, H.; Sun, L.; Jiang, M.; Du, J.; Fu, E.; Ma, J.; Li, N. Cloudy or sunny? Effects of different environmental types of urban green spaces on public physiological and psychological health under two weather conditions. Front. Public Health 2023, 11, 1258848. [Google Scholar] [CrossRef]
- Brown, D.K.; Barton, J.L.; Gladwell, V.F. Viewing nature scenes positively affects recovery of autonomic function following acute-mental stress. Environ. Sci. Technol. 2013, 47, 5562–5569. [Google Scholar] [CrossRef]
- Chang, C.Y.; Hammitt, W.E.; Chen, P.K.; Machnik, L.; Su, W.C. Psychophysiological responses and restorative values of natural environments in Taiwan. Landsc. Urban Plan. 2008, 85, 79–84. [Google Scholar] [CrossRef]
- Gordon, A.M.; Mendes, W.B. A large-scale study of stress, emotions, and blood pressure in daily life using a digital platform. Proc. Natl. Acad. Sci. USA 2021, 118, e2105573118. [Google Scholar] [CrossRef]
- Watson, D.; Clark, L.A.; Carey, G. Positive and negative affectivity and their relation to anxiety and depressive disorders. J. Abnorm. Psychol. 1988, 97, 346. [Google Scholar] [CrossRef] [PubMed]
- Park, B.J.; Tsunetsugu, Y.; Kasetani, T.; Kagawa, T.; Miyazaki, Y. The physiological effects of Shinrin-yoku (taking in the forest atmosphere or forest bathing): Evidence from field experiments in 24 forests across Japan. Environ. Health Prev. Med. 2010, 15, 18. [Google Scholar] [CrossRef] [PubMed]
- Park, B.J.; Tsunetsugu, Y.; Kasetani, T.; Morikawa, T.; Kagawa, T.; Miyazaki, Y. Physiological effects of forest recreation in a young conifer forest in Hinokage Town, Japan. Silva Fenn. 2015, 43, 291–301. [Google Scholar] [CrossRef]
- Tsunetsugu, Y.; Lee, J.; Park, B.J.; Tyrväinen, L.; Kagawa, T.; Miyazaki, Y. Physiological and psychological effects of viewing urban forest landscapes assessed by multiple measurements. Landsc. Urban Plan 2013, 113, 90–93. [Google Scholar] [CrossRef]
- Kang, N.; Xiu, M.L. Effects of visual characteristics for different types of plant community on human psychology. J. Northwest For. Univ. 2017, 32, 315–320. [Google Scholar]
- Chiang, Y.C.; Li, D.; Jane, H.A. Wild or tended nature? The effects of landscape location and vegetation density on physiological and psychological responses. Landsc. Urban Plan. 2017, 167, 72–83. [Google Scholar] [CrossRef]
- Jiang, B.; Chang, C.Y.; Sullivan, W.C. A dose of nature: Tree cover, stress reduction, and gender differences. Landsc. Urban Plan. 2014, 132, 26–36. [Google Scholar] [CrossRef]
- Qiu, L.; Lindberg, S.; Nielsen, A.B. Is biodiversity attractive?-On-site perception of recreational and biodiversity values in urban green space. Landsc. Urban Plan 2013, 119, 136–146. [Google Scholar] [CrossRef]
- Tran, H.M.; Tsai, F.-J.; Wang, Y.-H.; Lee, K.-Y.; Chang, J.-H.; Chung, C.-L.; Tseng, C.-H.; Su, C.-L.; Lin, Y.-C.; Chen, T.-T.; et al. Joint effects of temperature and humidity with PM2.5 on COPD. BMC Public Health 2025, 25, 424. [Google Scholar] [CrossRef]
- Wu, Y.; Li, Z.; Hu, B.; Ye, W. Temperature effects on peoples’ health and their adaptation: Empirical evidence from China. Clim. Change 2025, 178, 18. [Google Scholar] [CrossRef]
- Junfeng, Z.; Nuo, W. Study on the relationship between summer microclimate and human thermal comfort in urban waterfront parks–Longzi Lake Park in Zhengzhou city as an example. Landsc. Ecol. Eng. 2025, 21, 341–356. [Google Scholar] [CrossRef]
- Liang, W.; Hongxia, H.; Yangli, L. Effects of human physiological thermoregulation on thermal comfort in a naturally ventilated environment in summer. Int. J. Environ. Sci. Technol. 2024, 21, 1–14. [Google Scholar] [CrossRef]
- Braziunas, K.H.; Rammer, W.; De Frenne, P.; Díaz-Calafat, J.; Hedwall, P.-O.; Senf, C.; Thom, D.; Zellweger, F.; Seidl, R. Microclimate temperature effects propagate across scales in forest ecosystems. Landsc. Ecol. 2025, 40, 37. [Google Scholar] [CrossRef] [PubMed]
- Tang, L.; Chen, S.; Liu, M.; Su, C. Influence of full-spectrum lighting on blood pressure, heart rate and visual comfort on young adults. Indoor Built Environ. 2022, 30, 476–486. [Google Scholar] [CrossRef]
- Li, K.; Zhang, Y.; Zhao, L. Outdoor thermal comfort and activities in the urban residential community in a humid subtropical area of China. Energy Build. 2016, 133, 498–511. [Google Scholar] [CrossRef]
Disclaimer/Publisher’s Note: The statements, opinions and data contained in all publications are solely those of the individual author(s) and contributor(s) and not of MDPI and/or the editor(s). MDPI and/or the editor(s) disclaim responsibility for any injury to people or property resulting from any ideas, methods, instructions or products referred to in the content. |
© 2025 by the authors. Licensee MDPI, Basel, Switzerland. This article is an open access article distributed under the terms and conditions of the Creative Commons Attribution (CC BY) license (https://creativecommons.org/licenses/by/4.0/).