Abstract
Soil nutrient and fertility assessments provide a direct measure for evaluating forest management effects. In this study, we examined soil nutrient content in Chinese fir (Cunninghamia lanceolata) plantations under four reconstruction patterns: pure plantation, introduced broadleaf, introduced needleleaf, and introduced mixed broadleaf-needleleaf. The soil fertility index (SFI) evaluation model was constructed based on partial least squares path modeling (PLS-PM), revealing the influence of stand characteristics on SFI in early stand reconstruction. The results showed that, compared to pure plantations, total nutrient content increased in the introduced needleleaf pattern by 13.94% to 21.15% and available nutrient content by 18.21% to 26.91%. In contrast, both introduced broadleaf and mixed broadleaf-needleleaf exhibited a declining trend. Significant differences were observed among the reconstruction patterns (p < 0.05). In the SFI evaluation model, soil chemistry total nutrient (SCT) and soil chemistry available nutrient (SCA) made significant contributions. The weights of SCT and SCA in SFI were 0.52 and 0.48, respectively. The SFI of four patterns ranged from 0.43 to 0.58, indicating relatively low soil fertility. Compared to pure plantations, introduced trees did not enhance soil fertility in early stand reconstruction. The SFI of the introduced needleleaf was significantly higher than that of the other two reconstruction patterns (p < 0.05). Stand construction (including diameter at breast height, tree density, and tree biomass) explained 14.69% of SFI variation, with a contribution of 31.72% in the surface soil layer (0~20 cm). Tree biomass significantly influenced SFI variation, accounting for over 40% of the total stand factors. Retained tree biomass had a substantially greater effect than introduced tree biomass, contributing twice as much to SFI variation. PLS-PM could effectively reflect the soil nutrient status and accurately estimate the weight of soil fertility. In early stand reconstruction, retained tree biomass might be the major influence on soil fertility variation. We suggest determining reasonable thinning intensity to retain enough Chinese fir and promote the growth of introduced trees. This study introduces a novel approach to soil fertility assessment and provides theoretical support for formulating effective forest management strategies in the early reconstruction of Chinese fir plantations.
1. Introduction
Chinese fir (Cunninghamia lanceolata) is one of the large-diameter species extensively cultivated in southern China, which offers substantial economic and ecological benefits [1,2]. Accounting for 25% of China’s artificial forest area, Chinese fir plantations are widely distributed and valued for their rapid growth and high productivity, contributing significantly to timber production and ecological conservation [3]. With the growth of demand for wood, the prevalent monoculture management of Chinese fir has led to frequent ecological problems (e.g., reduction in plant diversity, soil quality degradation, and decline in land productivity) [3]. To address these issues, scientists have proposed introducing mixed tree reconstruction patterns in pure Chinese fir plantations to optimize forest structure [4]. This approach provides a new perspective for restoring soil fertility effectively and advancing sustainable management in Chinese fir plantations.
Soil fertility plays a crucial role, characterized by the availability of essential nutrients and environmental conditions for tree growth [5,6]. It can be influenced by forest composition and structure, and different reconstruction patterns can directly influence the soil microbiota and nutrient conversion [7]. By assessing soil nutrient content and conducting comprehensive soil fertility evaluations, the effectiveness of forest management and reconstruction can be directly evaluated [8]. It was found that introduced mixed-tree patterns in Chinese fir plantations positively influence soil nutrient cycling, microbial community composition, and stand productivity [9,10,11] while enriching forest structure and enhancing biodiversity to sustain the ecological benefits of Chinese fir plantations [12,13]. In recent years, scientists have conducted research extensively in Chinese fir and broadleaf mixed plantations on soil physicochemical characteristics [14,15], soil fertility, productivity evaluation [16,17], and characteristics of microbial communities [10,18]. Furthermore, research has examined the evolution trends in soil fertility quality in Chinese fir plantations [19] and assessments of soil nutrient dynamics and fertility across varying stand ages [20]. The soil quality index (SQI) and soil fertility index (SFI) were found to be the lowest levels in middle-aged forests (14 years) and the highest in over-mature forests (30 years) among Chinese fir plantations of different ages [21,22]. Continuous cultivation caused soil quality to decrease with increasing management cycle, while researchers recommended that reconstruction patterns should be revised to fell trees between 25 and 30 years of age only [23]. Extensive studies have demonstrated the critical role of selecting appropriate introduced trees and evaluating soil fertility to enhance the efficacy of Chinese fir plantation management. Previous studies on reconstruction patterns in Chinese fir plantations have mainly focused on evergreen broadleaf trees for investigating soil properties. Extensive soil quality analyses have been conducted across Chinese fir mixed plantations of varying ages and long-stand reconstructions. However, there are still knowledge gaps in comparative studies evaluating different introduced tree patterns. This is the key technical issue that identifies appropriate introduction patterns in early stand reconstruction that can accurately guide management to enhance soil fertility in Chinese fir plantations.
The focus of soil fertility evaluation involves determining the weighting of various evaluation indicators. Traditional weighting approaches mainly include subjective methods [24] and objective methods [25,26]. The integration of various statistical methods has advanced new conceptual frameworks and scientifically rigorous quantification techniques for the comprehensive evaluation of soil fertility. Cao et al. introduced a soil fertility index evaluation method based on the principle of multiplication and division [27]. Zhao et al. performed a weighted assessment of the soil fertility index using the structural equation model (SEM) [22]. Subjective methods were influenced by human perception and rarely considered interaction among soil nutrients [28]. Conversely, objective methods were based on the objective reality of the original data, which ignored the innate theoretical knowledge [29]. Consequently, a scientifically rigorous approach is crucial for determining the weights of SFI. Partial least squares path modeling (PLS-PM) was the correlation-based structural equation modeling algorithm, which revealed the inherent logical relationships among indicators and assigned weights by calculating the path coefficients [30]. At the same time, it overcame the influence of multicollinearity and avoided the subjective errors of the index weighting by the scoring function [23]. PLS-PM was suitable for complex model structures involving multiple indicators, low sample requirements, and the use of latent variable scores for advanced analyses [31]. The construction of the path model based on PLS-PM provided more adaptive and beneficial exploration for scientifically evaluating the efficacy of forest management. In this study, PLS-PM was used to construct the SEM for soil fertility evaluation. The endogenous latent variables including soil chemistry total nutrient (SCT) and soil chemistry available nutrient (SCA) were used to construct the exogenous latent variable SFI for comprehensive evaluation.
This study aimed to establish an innovative method to supplement the research gap of soil fertility variation under different introduced patterns in early stand reconstruction, providing scientific evidence for enhancing the quality of Chinese fir plantations and highlighting the ecological and economic benefits of forest management. We focused on analyzing soil nutrients and stand characteristics of different reconstruction patterns (pure Chinese fir plantation, introduced broadleaf, introduced needleleaf, and introduced mixed broadleaf-needleleaf) in Chinese fir plantations. The objectives of this study were: (1) to determine the variation of soil nutrient indications under different reconstruction patterns; (2) to construct SFI based on PLS-PM and evaluate the soil nutrient status of different reconstruction patterns; and (3) to elucidate the main stand factors affecting SFI variation in early stand reconstruction.
2. Materials and Methods
2.1. Study Area and Experimental Forest
The study was conducted at the Xinanjiang forest farm (29°27′44″ N, 119°16′22″ E), Jiande County, Zhejiang Province, China (Figure 1A,B). This region featured low mountains and hilly landforms, with altitudes ranging from 110 to 120 m. The regional climate was the subtropical monsoon climate, characterized by warm and humid conditions with abundant rainfall. The average annual temperature was 16.7 °C, and the average annual precipitation was 1604 mm. The soil type was red soil, and the soil pH ranged from 4.5 to 6.5, indicating an acidic nature. The study area was covered by the typical evergreen coniferous pure Chinese fir plantation. To enhance the soil fertility and promote the sustainable management of the stand, pure Chinese fir plantation began to undergo different reconstructions and nurturing techniques.
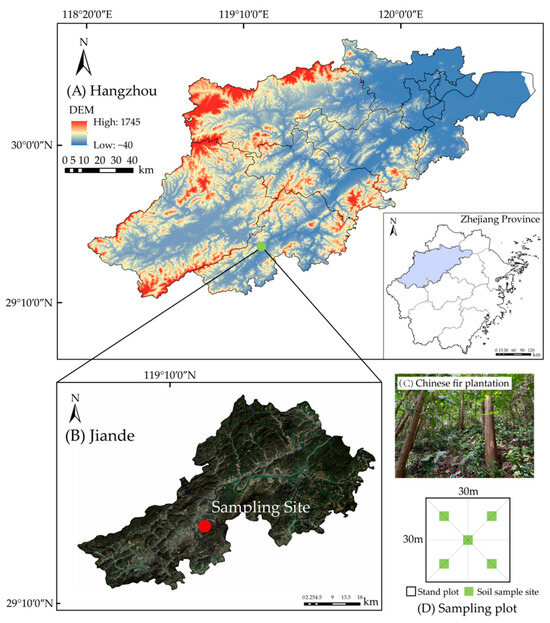
Figure 1.
Geographical location of the study area and soil sample points. (A) Geography of Zhejiang Province. (B) Geography of Jiande County. (C) Photograph of Chinese fir plantations. (D) Sampling plot.
The pure Chinese fir plantation planted in 1990~1992 was selected as the experimental forest (Figure 1C). The initial planting density was 2400~3000 trees·ha−1. To accelerate the close canopy of the new plantation, tending measures such as weeding under the forest were taken continuously for 3~5 years. After afforestation, the pure plantation management of Chinese fir was thinned twice, and the cumulative intensity was 65%–70%. The reconstruction occurred in pure Chinese fir plantation (CF) 5~8 years after the last thinning around 2016. We had three reconstruction patterns, i.e.,: CF-BL, broadleaf (2-year-old Phoebe chekiangensis) was introduced; CF-NL, needleleaf (2-year-old Taxus wallichiana var. Chinensis) was introduced; and CF-BN, mixed broadleaf (2-year-old Phoebe chekiangensis and Cinnamomum chekiangense)-needleleaf (2-year-old Taxus wallichiana var. Chinensis) was introduced. The mixed introduced patterns involved inter-row planting with a spacing of 2 m × 2 m. The diameter at breast height (DBH) and height (H) of different introduced trees were consistent. There was no artificial interference after the reconstruction.
2.2. Method
2.2.1. Sampling Plot Establishment and Soil Collection
Three sample plots measuring 30 m × 30 m were established in 2022 within each pattern with similar elevation and slope conditions, totaling 12 plots. The basic characteristics of the plots are shown in Table 1. Soil samples were collected in plots according to the “S” sampling method. There were five sampling points in each plot (Figure 1D). Soil samples were collected at three layers: 0~20 cm, 20~40 cm, and 40~60 cm. All collected soil samples were air-dried and milled in the laboratory for further analysis.

Table 1.
Basic characteristics of sample plots.
2.2.2. Estimation of Tree Biomass
According to the national standard GB/T 43648–2024, the regression model of tree biomass (BIO) was selected to calculate the aboveground biomass (BIO-Above) and belowground biomass (BIO-Below) of the plots. The calculation formula for tree biomass was as follows [32]:
where “M” represents the estimated aboveground biomass (kg), “N” represents the estimated belowground biomass (kg), and “D” represents diameter at breast height of the trees (cm).
2.2.3. Determination of Nutrient Content in Soil
Soil organic carbon (SOC) was determined using the potassium dichromate volumetric method; soil total nitrogen (TN) was determined using sulfuric acid-accelerated digestion and the Kjeldahl method; soil total phosphorus (TP) was determined using the perchloric acid-strong sulfuric acid titration method; soil available nitrogen (AN) was determined using the alkaline hydrolysis diffusion method; soil available phosphorus (AP) was determined using the sodium bicarbonate extraction-molybdenum antimony colorimetric method; and soil available potassium (AK) was determined using the ammonium acetate extraction-flame photometry method [33].
2.2.4. Model Construction and Soil Fertility Index Calculation
The structural equation model was constructed to calculate SFI based on soil nutrient indicators using the PLS-PM method. In this model, the observed variables SOC, TN, and TP were combined to construct the endogenous latent variable SCT, while the observed variables AN, AP, and AK were combined to construct the endogenous latent variable SCA. These two endogenous latent variables were combined to construct the exogenous latent variable SFI, representing the fertility status of the whole soil.
Before constructing the model to eliminate dimensional problems of the observed variables, the data were preliminarily standardized. To evaluate the validity of the soil nutrient indicators, the Kaiser-Meyer-Olkin (KMO) and Bartlett’s test of sphericity were conducted [21]. If KMO > 0.5, p < 0.05 indicated good validity of the selected indicators and independence among variables, thus allowing for factor analysis. Furthermore, the reliability of PLS-PM was evaluated by Cronbach’s Alpha reliability test (C.Alpha), which showed a value greater than 0.8, indicating high data reliability [34]. Values between 0.5 and 0.8 indicated acceptable data reliability. The composite reliability (CR) should be ≥ 0.6, and both the absolute standardized loadings and Dillon-Goldstein’s rho (DG.rho) should be above 0.7 [35]. Goodness of fit (GoF) tests were conducted to assess whether the indicators conform to the assumed measurement model [36]. In this study, the average variance extracted (AVE) (> 0.5) and cross-loading functions were used to evaluate the model’s validity. By adding variables, removing variables, and modifying paths, the model fit was evaluated to obtain a model that conformed to the theoretical assumptions and had high GoF indicators. The high GoF value was aimed to be achieved [21].
The soil nutrient weights of observed variables and endogenous potential variables were calculated using PLS-PM construction results. The formula is as follows [31]:
where “W” represents the weights of soil nutrients, “m(a,k)” represents the score of indicator “k” in the major category “a”, “” represents the weight of indicator “k”, and “” represents the weight of major category “a”.
The study employed non-linear scoring equations to calculate the scores of soil indicators. Based on the impact of soil nutrient parameters on soil nutrient status, the scoring curve of “the more the better” was adopted when the increase of soil nutrient parameters improved soil quality. Conversely, when the increase of soil nutrient parameters was harmful to soil quality, the scoring curve of “the less the better” was adopted. In this study, the “more is better” type function was predominantly applied to the soil indicators. The formula for calculating the scoring curve is as follows [37]:
where “” represents the score of the soil indicator, “x” represents the actual measured value of the soil indicator, “” represents the mean value of the soil indicator, and “a” represents the slope of the equation. For the “more is better” type function, the slope value is −2.5.
Finally, the calculation of SFI is determined by the following formula [22]:
where “” represents the soil fertility index, “” represents the weight of indicator “i”, “” represents the score of indicators “i”, and “m” represents the number of soil parameters.
2.2.5. Statistical Analysis
A one-way ANOVA method combining the Least Significant Difference (LSD) post hoc test was employed for multiple comparisons to evaluate the significant differences in nutrient content and SFI across different soil layers in different reconstruction patterns at the p < 0.05 level. Normal distribution and homogeneity of variance tests were conducted before data analysis. The influence of stand characteristics on SFI was studied by canonical analysis (RDA) combined with hierarchical clustering (HP) analysis [38]. The following model construction, statistical analysis, and mapping processes were carried out by SPSS 21.0, R 4.2.1, Origin 2021, and AI 2019.
3. Results
3.1. Stand Characteristics
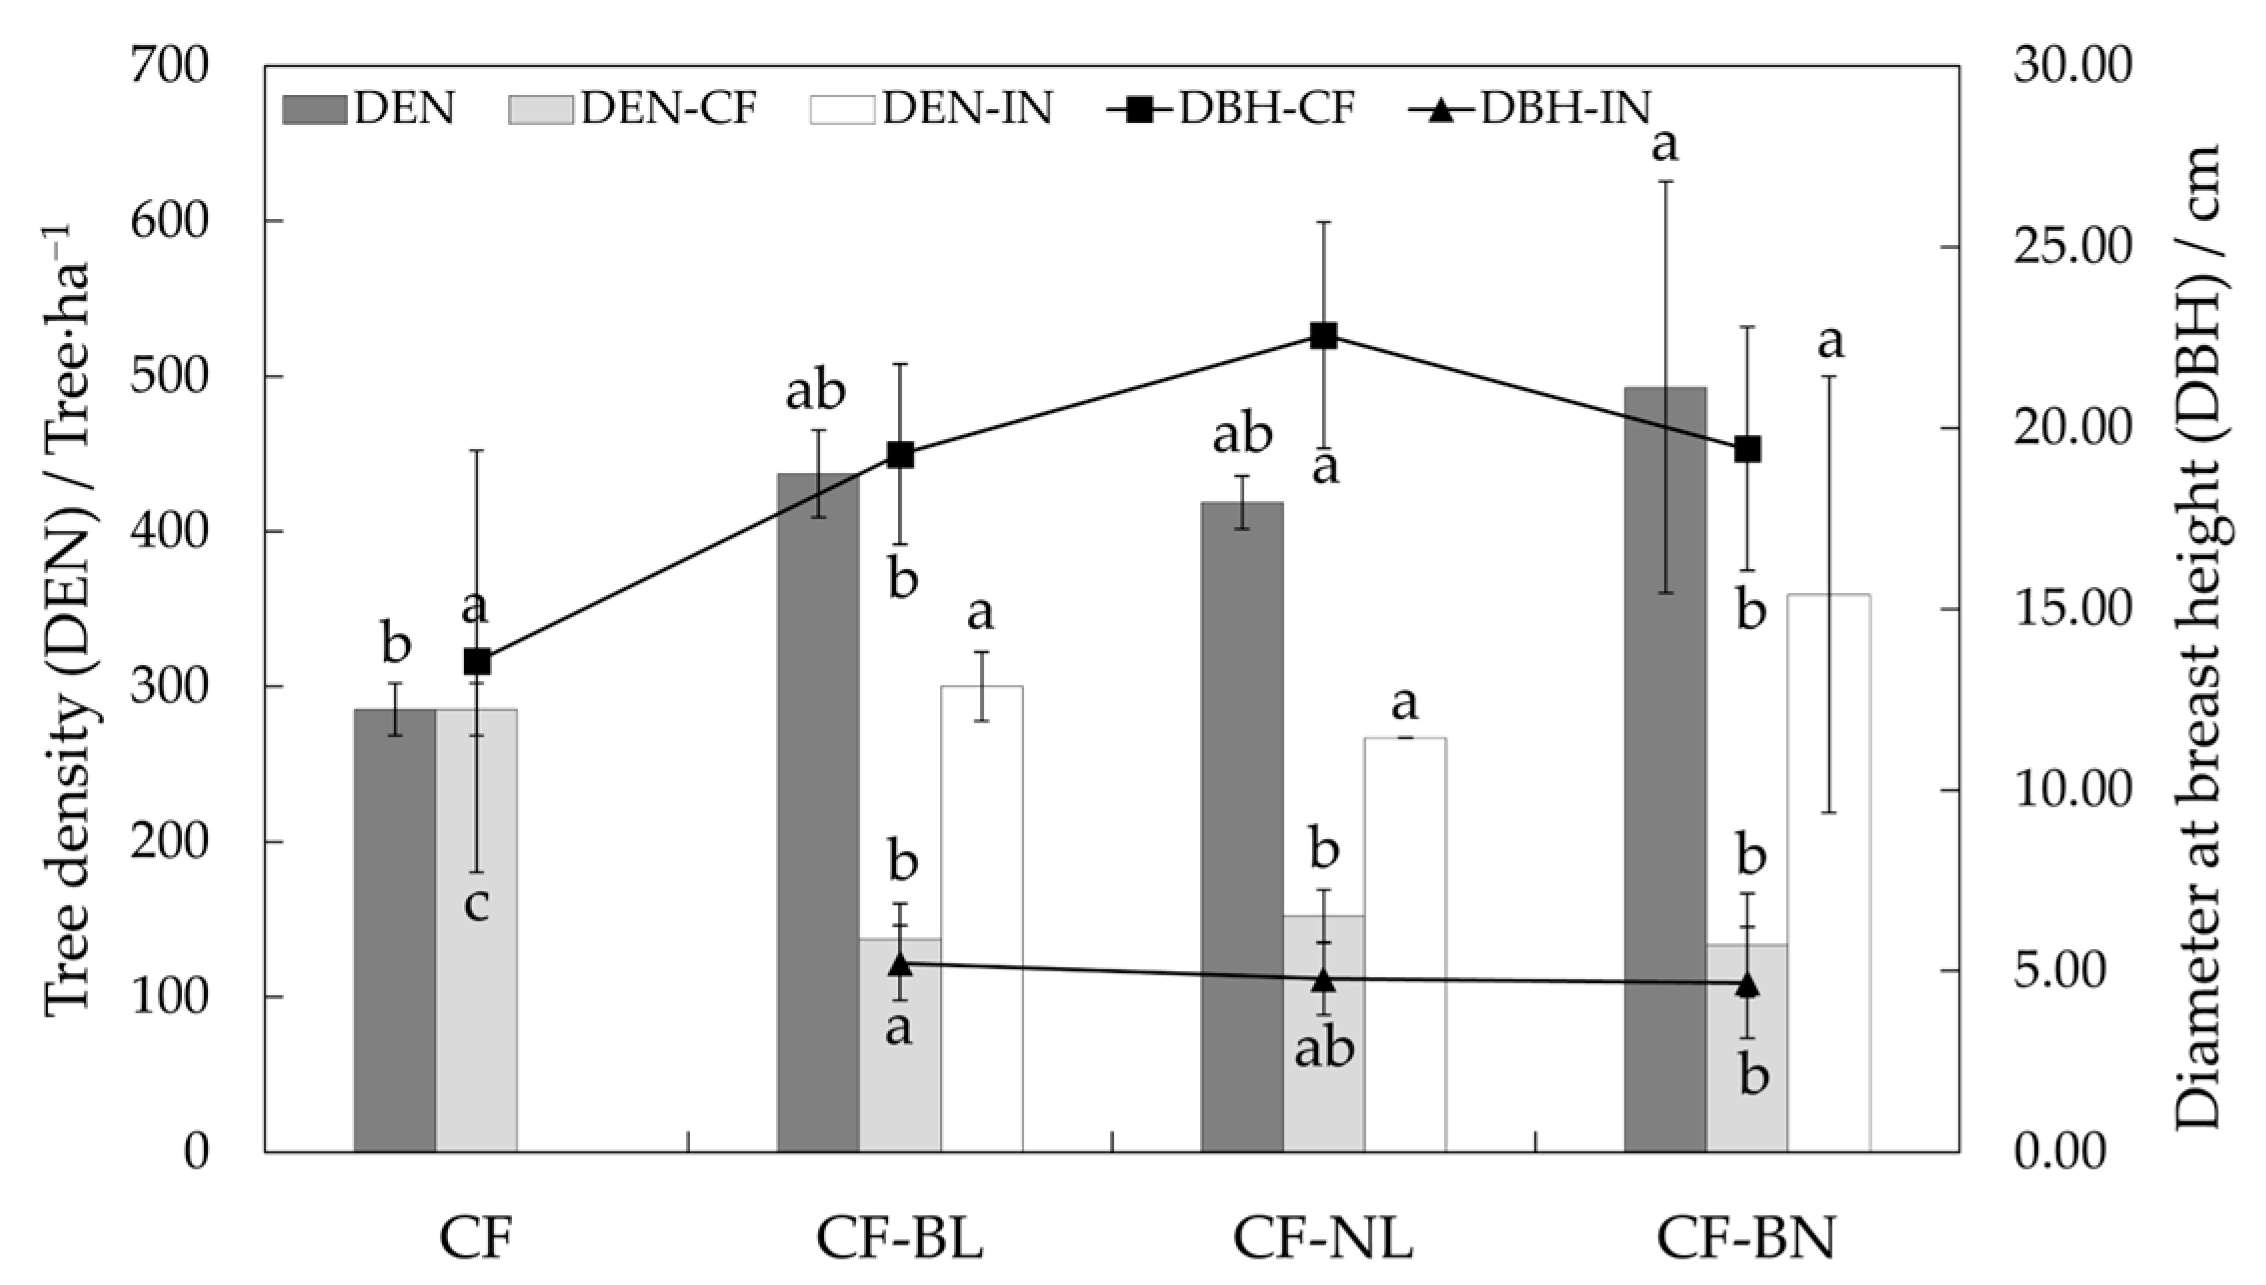
DBH of retained Chinese fir in three reconstruction patterns was significantly higher than that in CF (p < 0.05), with DBH in CF-NL being extremely significantly higher compared to the other reconstruction patterns (p < 0.01) (Figure 2). DBH of introduced trees was similar, and that of CF-BL was significantly higher than in CF-BN (p < 0.05). The tree density (DEN) of Chinese fir decreased in reconstruction patterns, while the DEN of all in CF-BN was significantly higher than in CF (p < 0.05).
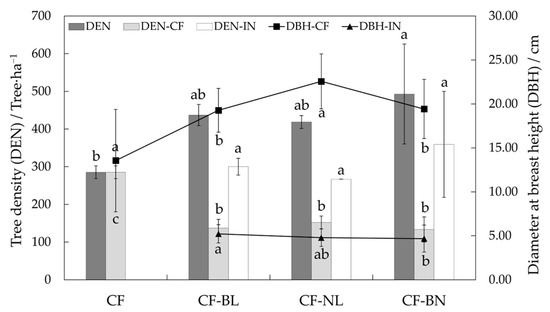
Figure 2.
DBH and DEN in different reconstruction patterns. Note: Lowercase letters represent the significance (p < 0.05) in different patterns. The difference in DEN was marked at the top, and the difference in DBH was marked at the bottom. DEN represents tree density, DEN-CF represents the density of the Chinese fir, DEN-IN represents the density of the introduced trees, DBH-CF represents the diameter at breast height of the Chinese fir, and DBH-IN represents the diameter at breast height of the introduced trees.
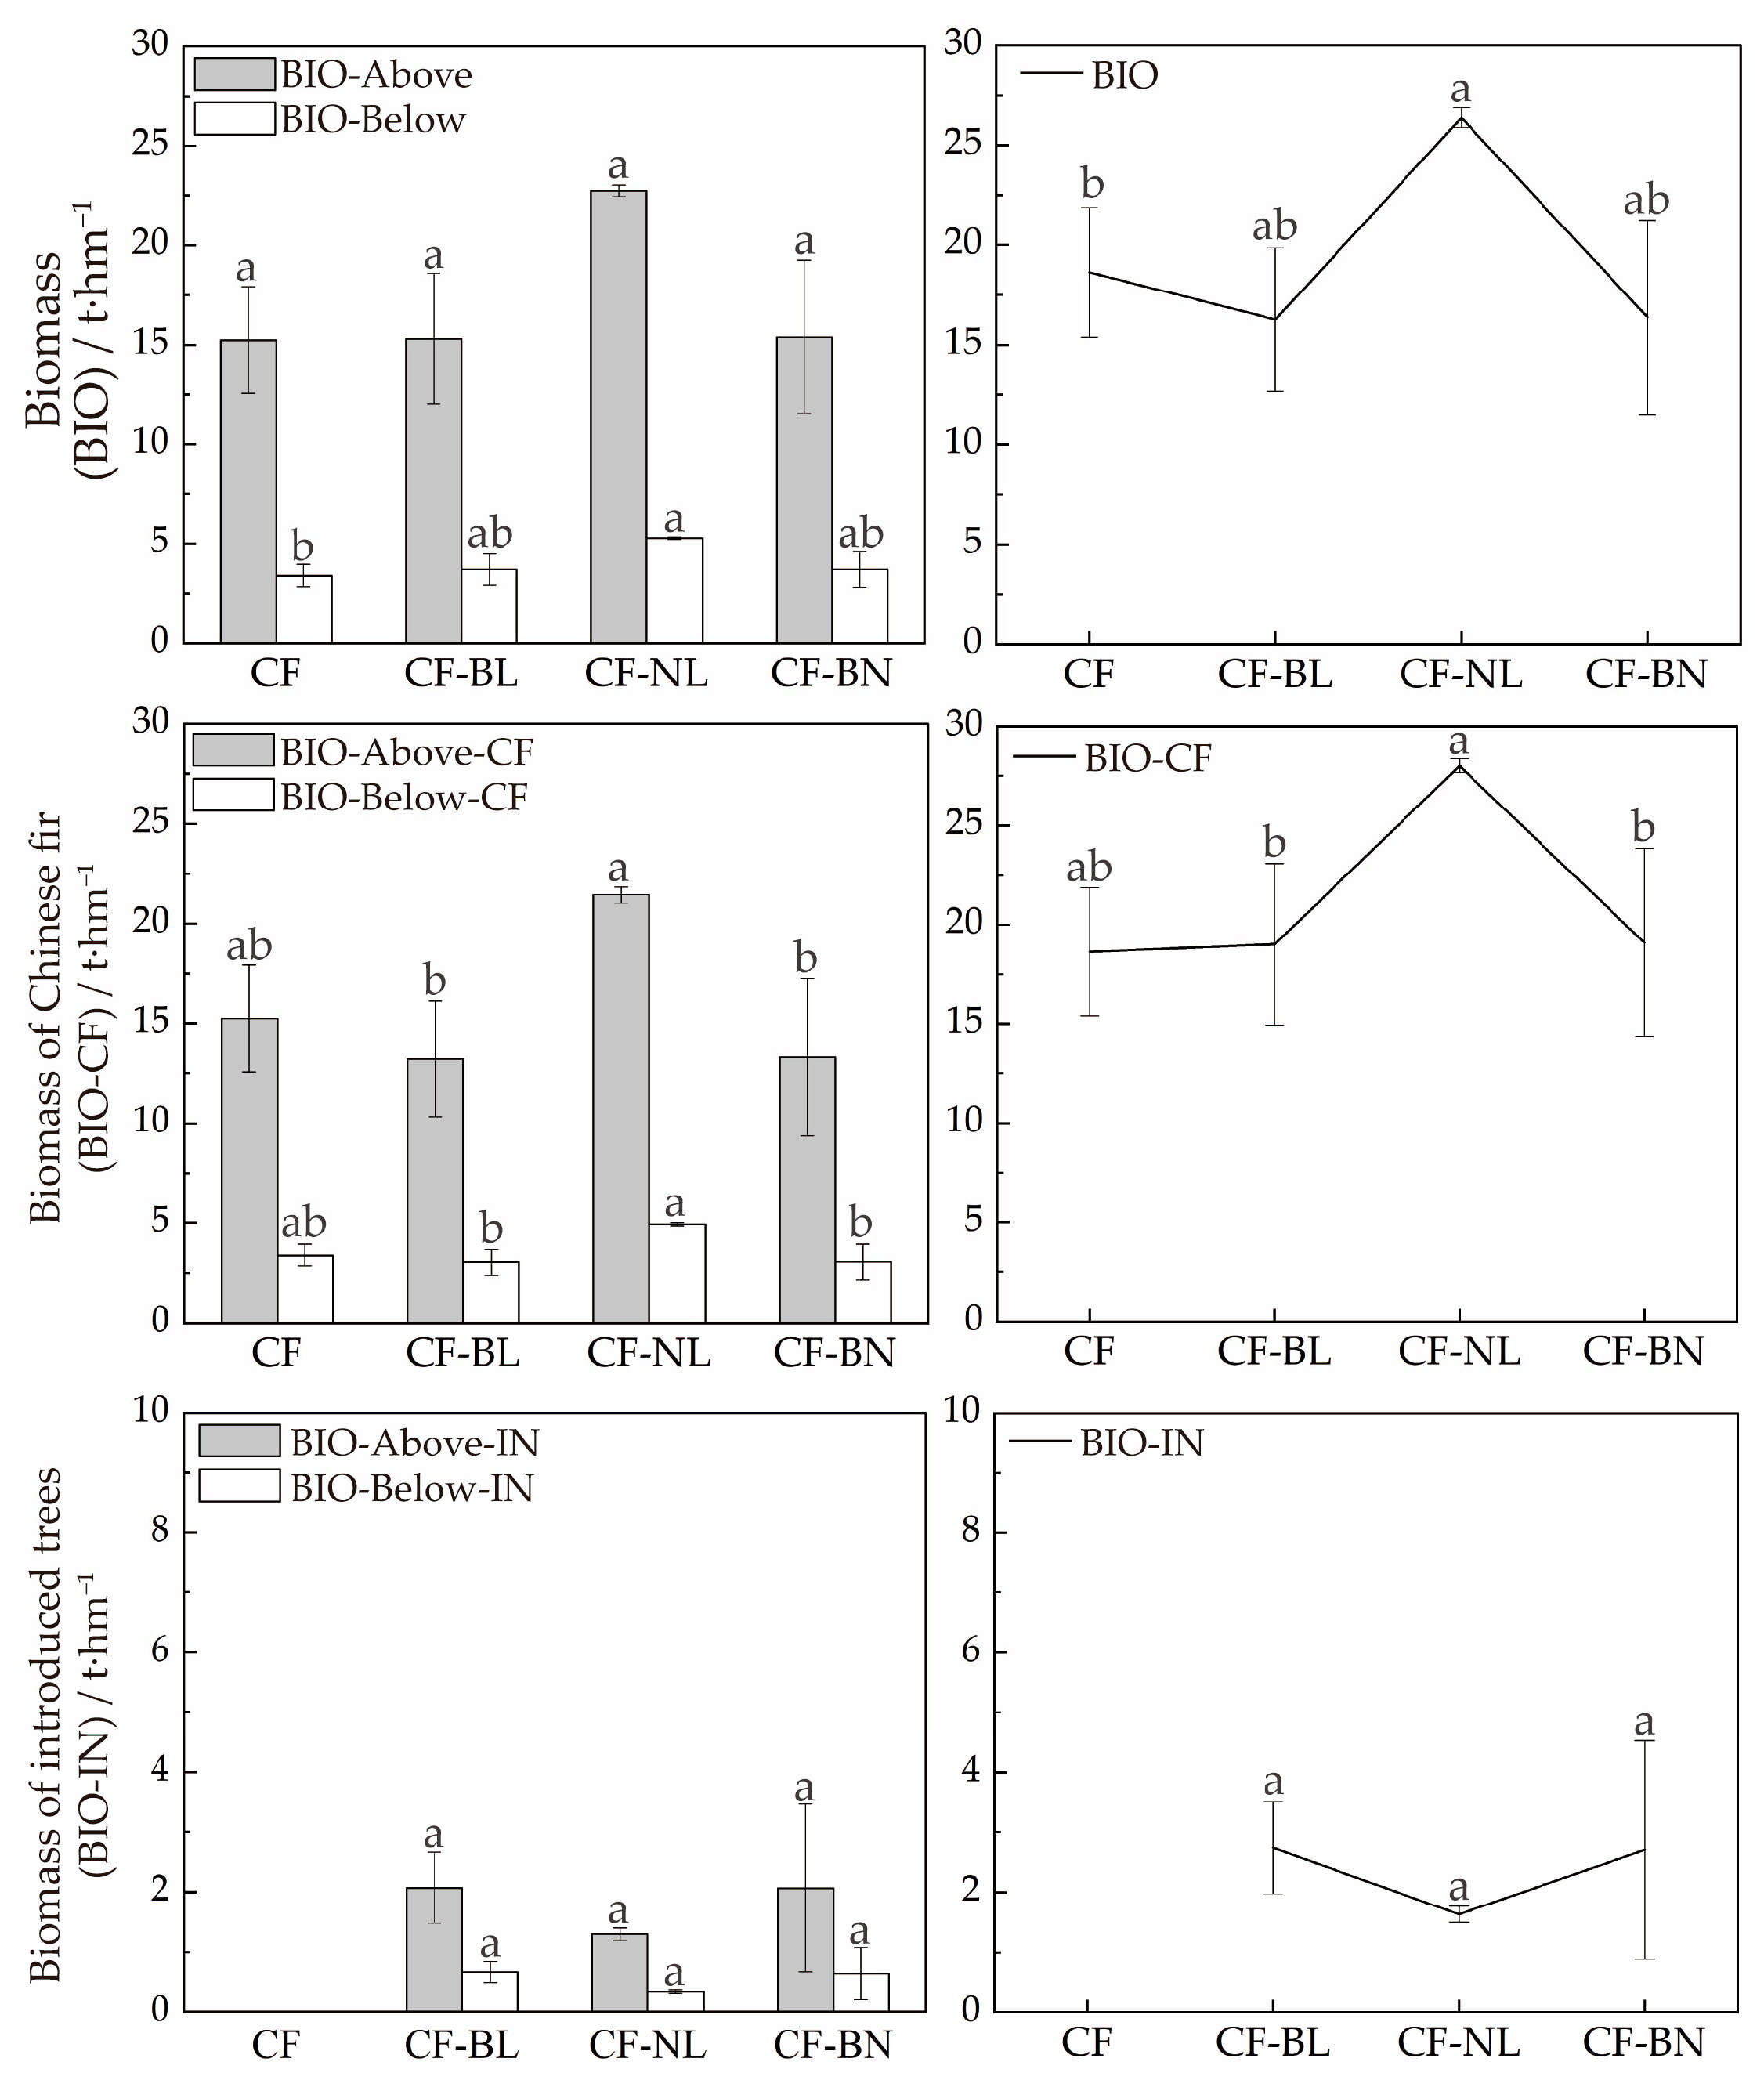
BIO of the forest was assessed by estimating BIO-Above and BIO-Below of the Chinese fir and introduced trees across the four reconstruction patterns (Figure 3). BIO-Above and BIO-Below of CF-NL were the highest, 22.73 t·hm−2 and 5.29 t·hm−2, respectively. There were significant differences in BIO-Above and BIO between CF-NL and CF (p < 0.05). BIO-Above and BIO-Below of Chinese fir in CF-NL (21.44 t·hm−2 and 4.94 t·hm−2, respectively) were the highest, followed by CF, and those in CF-BL and CF-BN were lower. There were extremely significant differences between CF-NL and the other reconstruction patterns (p < 0.01).
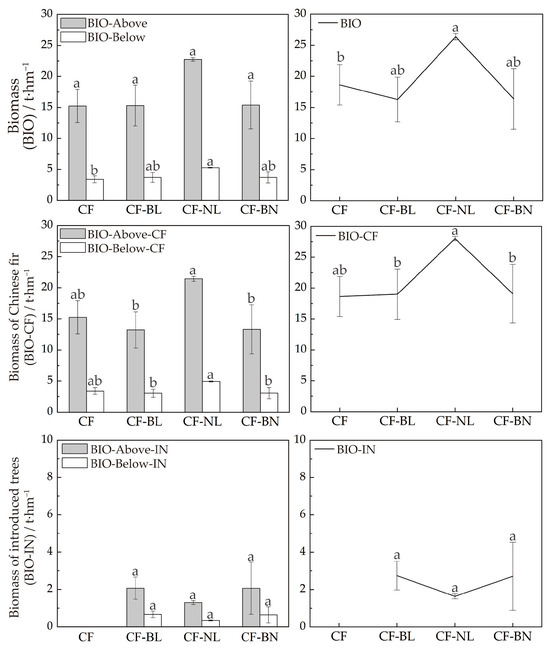
Figure 3.
BIO in different reconstruction patterns. Note: Lowercase letters represent the significance (p < 0.05) in different patterns. BIO represents tree biomass, BIO-Above represents aboveground biomass, BIO-Below represents belowground biomass, BIO-CF represents biomass of Chinese fir, BIO-Above-CF represents aboveground biomass of Chinese fir, BIO-Below-CF represents belowground biomass of Chinese fir, BIO-IN represents biomass of introduced trees, BIO-Above-IN represents aboveground biomass of introduced trees, and BIO-Below-IN represents belowground biomass of introduced trees.
3.2. Soil Nutrient Content
The nutrient content of SOC, TN, and TP in four reconstruction patterns ranged from 8.19~14.96 g·kg−1, 0.76~1.26 g·kg−1, and 0.14~0.19 g·kg−1, respectively (Table 2). Compared to CF, SOC, TN, and TP contents decreased in CF-BL and CF-BN, with extremely significant differences in TP (p < 0.01). The SOC and TN contents increased, and TP content decreased in CF-NL, but the difference was not significant. SOC content in CF-NL was extremely significantly higher than that in CF-BN (p < 0.01). TN and TP contents in CF-NL were significantly higher than in the other reconstruction patterns (p < 0.05). AN, AP, and AK contents in four reconstruction patterns respectively ranged between 62.17~119.36 mg·kg−1, 1.32~3.83 mg·kg−1, and 34.29~60.51 mg·kg−1. AN and AP contents in CF-BN were significantly lower than in CF (p < 0.05), while CF-NL was extremely significantly higher than the other reconstruction patterns (p < 0.05). Compared to CF, AK content extremely significantly decreased in CF-BN (p < 0.01) and AK content significantly increased in CF-NL (p < 0.05), while AK content in CF-NL was extremely significantly higher than in the other reconstruction patterns (p < 0.001).
Table 2.
Soil nutrient content in reconstruction patterns.
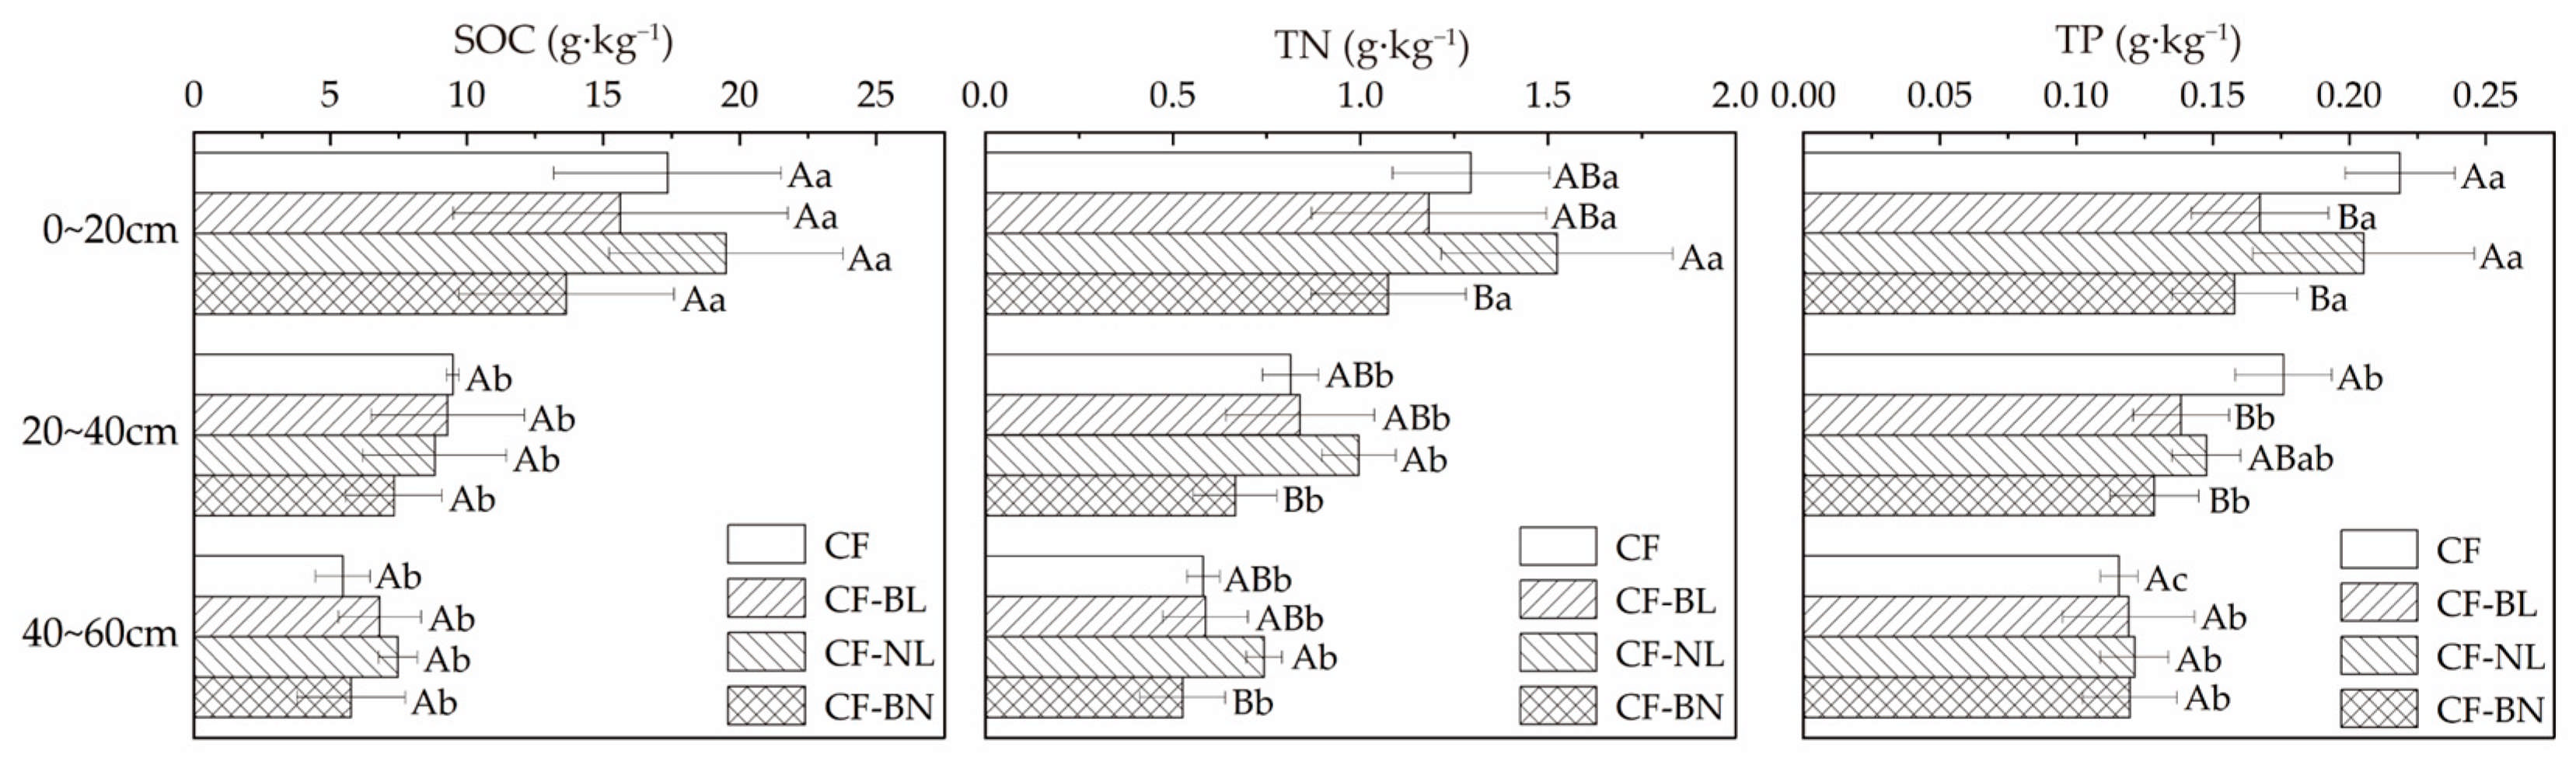
There were significant differences in the soil total nutrient content among different reconstruction patterns in different soil layers (Figure 4). Compared to CF, different patterns did not result in significant changes in SOC content. TP content was significantly decreased in CF-BL in 0~40 cm (p < 0.05), while extremely significantly decreased in CF-BN (p < 0.01). TN content in CF-NL was significantly higher than in CF-BN in 0~60 cm (p < 0.05). TP content in the surface soil layer (0~20 cm) was significantly higher than in the other reconstruction patterns (p < 0.05). SOC, TN, and TP contents in 0~20 cm were significantly higher than in other soil layers (p < 0.05).
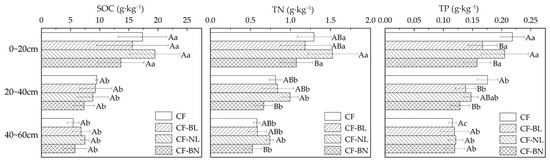
Figure 4.
The total nutrient content with soil depth in different reconstruction patterns. Note: Capital letters represent the significance (p < 0.05) in different patterns and lowercase letters represent the significance (p < 0.05) in different soil layers.
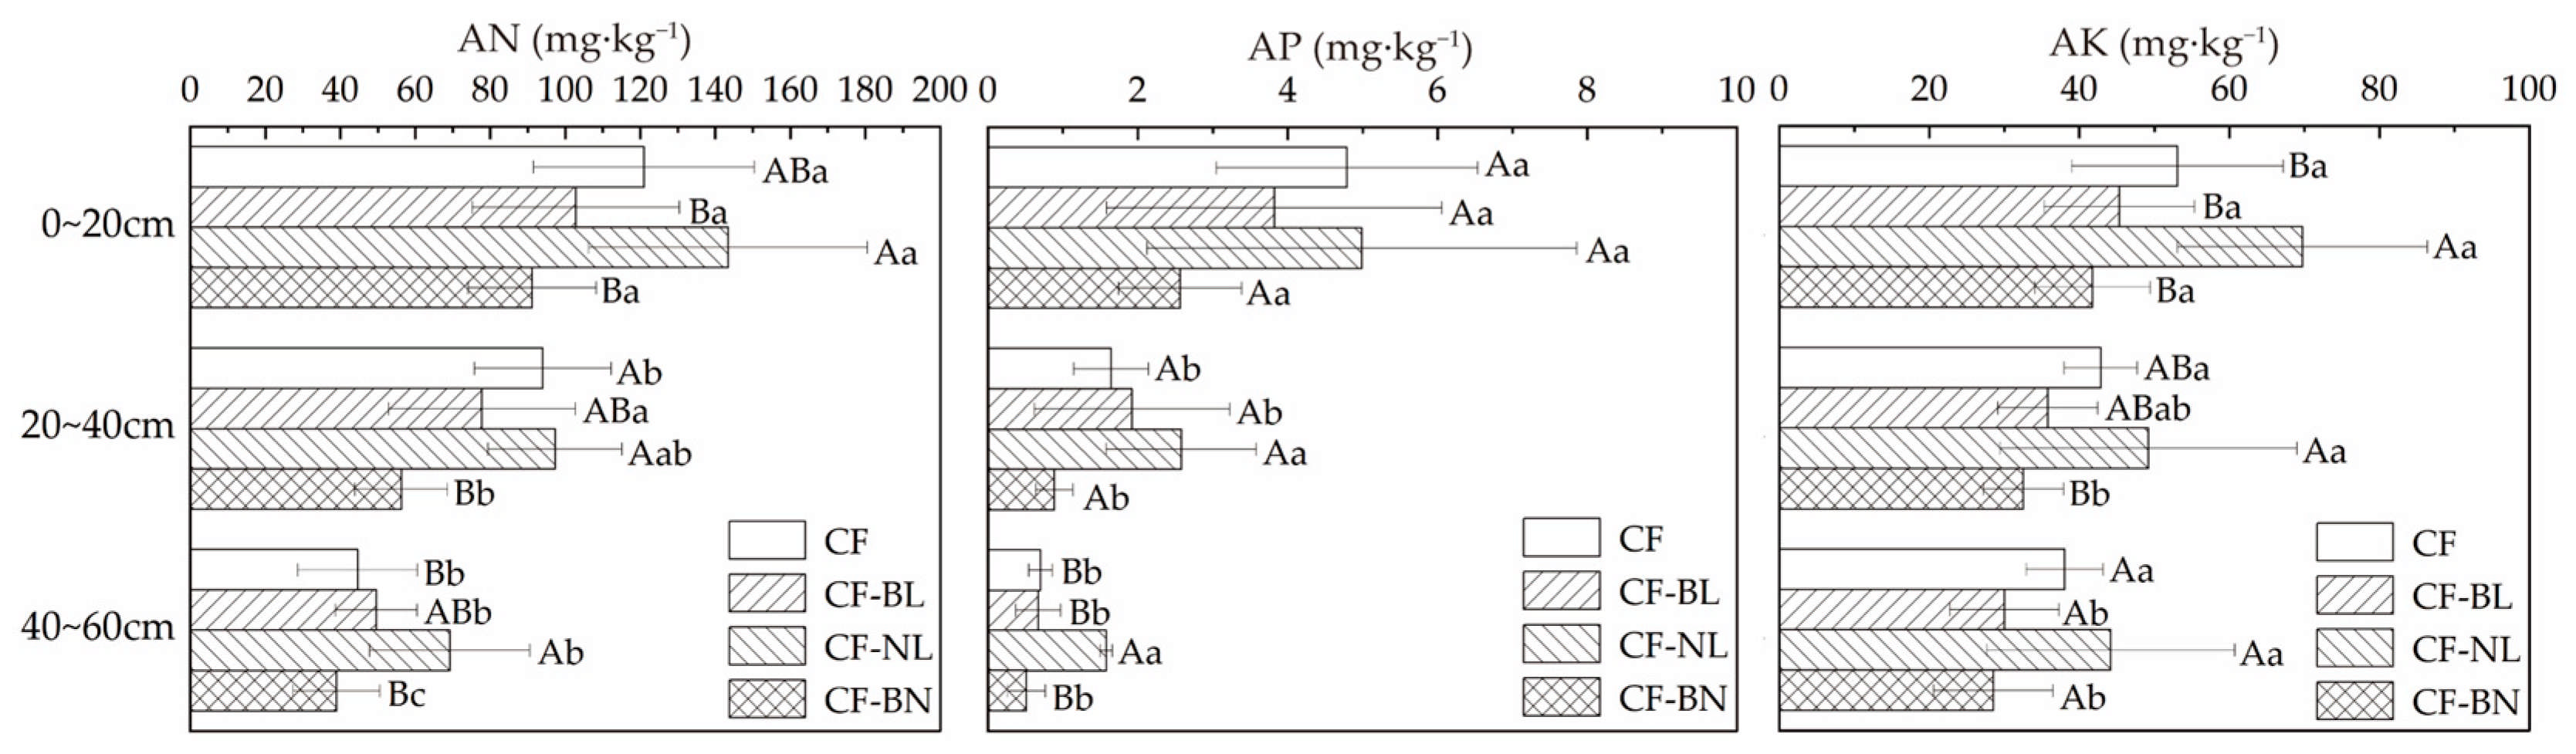
The content of the available nutrients in different patterns changed significantly at different soil depths (Figure 5). Compared to CF, AN, AP, and AK contents increased in CF-NL. There were extremely significant differences in AP in 40~60 cm (p < 0.01) and significant differences in AK in 0~20 cm (p < 0.05). The AN content in 20~40 cm significantly decreased in CF-BN (p < 0.05). AN and AK contents in CF-NL were significantly higher than in the other reconstruction patterns (p < 0.05), and AP content was extremely significantly different in 40~60 cm (p < 0.001). There were extremely significant differences in the AN content of different layers in CF-BN (p < 0.01). In CF-BL and CF-BN, AK content in the surface layer (0~20 cm) was significantly higher than that in 20~40 cm (p < 0.05).
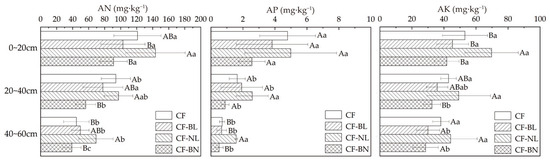
Figure 5.
The available nutrient content with soil depth in different reconstruction patterns. Note: Capital letters represent the significance (p < 0.05) in different patterns and lowercase letters represent the significance (p < 0.05) in different soil layers.
3.3. Soil Fertility Index
The endogenous latent variable SCT and SCA were combined to construct the exogenous latent variable SFI. To seek the best prediction relationship and estimate the prediction model using latent variables, PLS-PM was used to construct the SFI evaluation model. The KMO of sampling adequacy and Bartlett’s test of sphericity were conducted on soil nutrient indicators, indicating that the selected indicators were suitable for factor analysis (KMO = 0.779 > 0.5, p < 0.05) (Table 3). The reliability test of PLS-PM showed that the C.Alpha of the model’s unique dimension was 0.962 (>0.8), and CR was more than 0.6. The first eigenvalue of the principal component analysis was 5.08 (>1), and the factor loading was more than 0.7. DG.rho was more than 0.7, indicating that the data were highly reliable and the latent variables had high consistency and singleness. AVE was 0.843 (>0.5) and the aggregation effect passed the test. The GoF of the model was 0.924, indicating that the model had a good fit.
Table 3.
Sample data reliability and validity test.
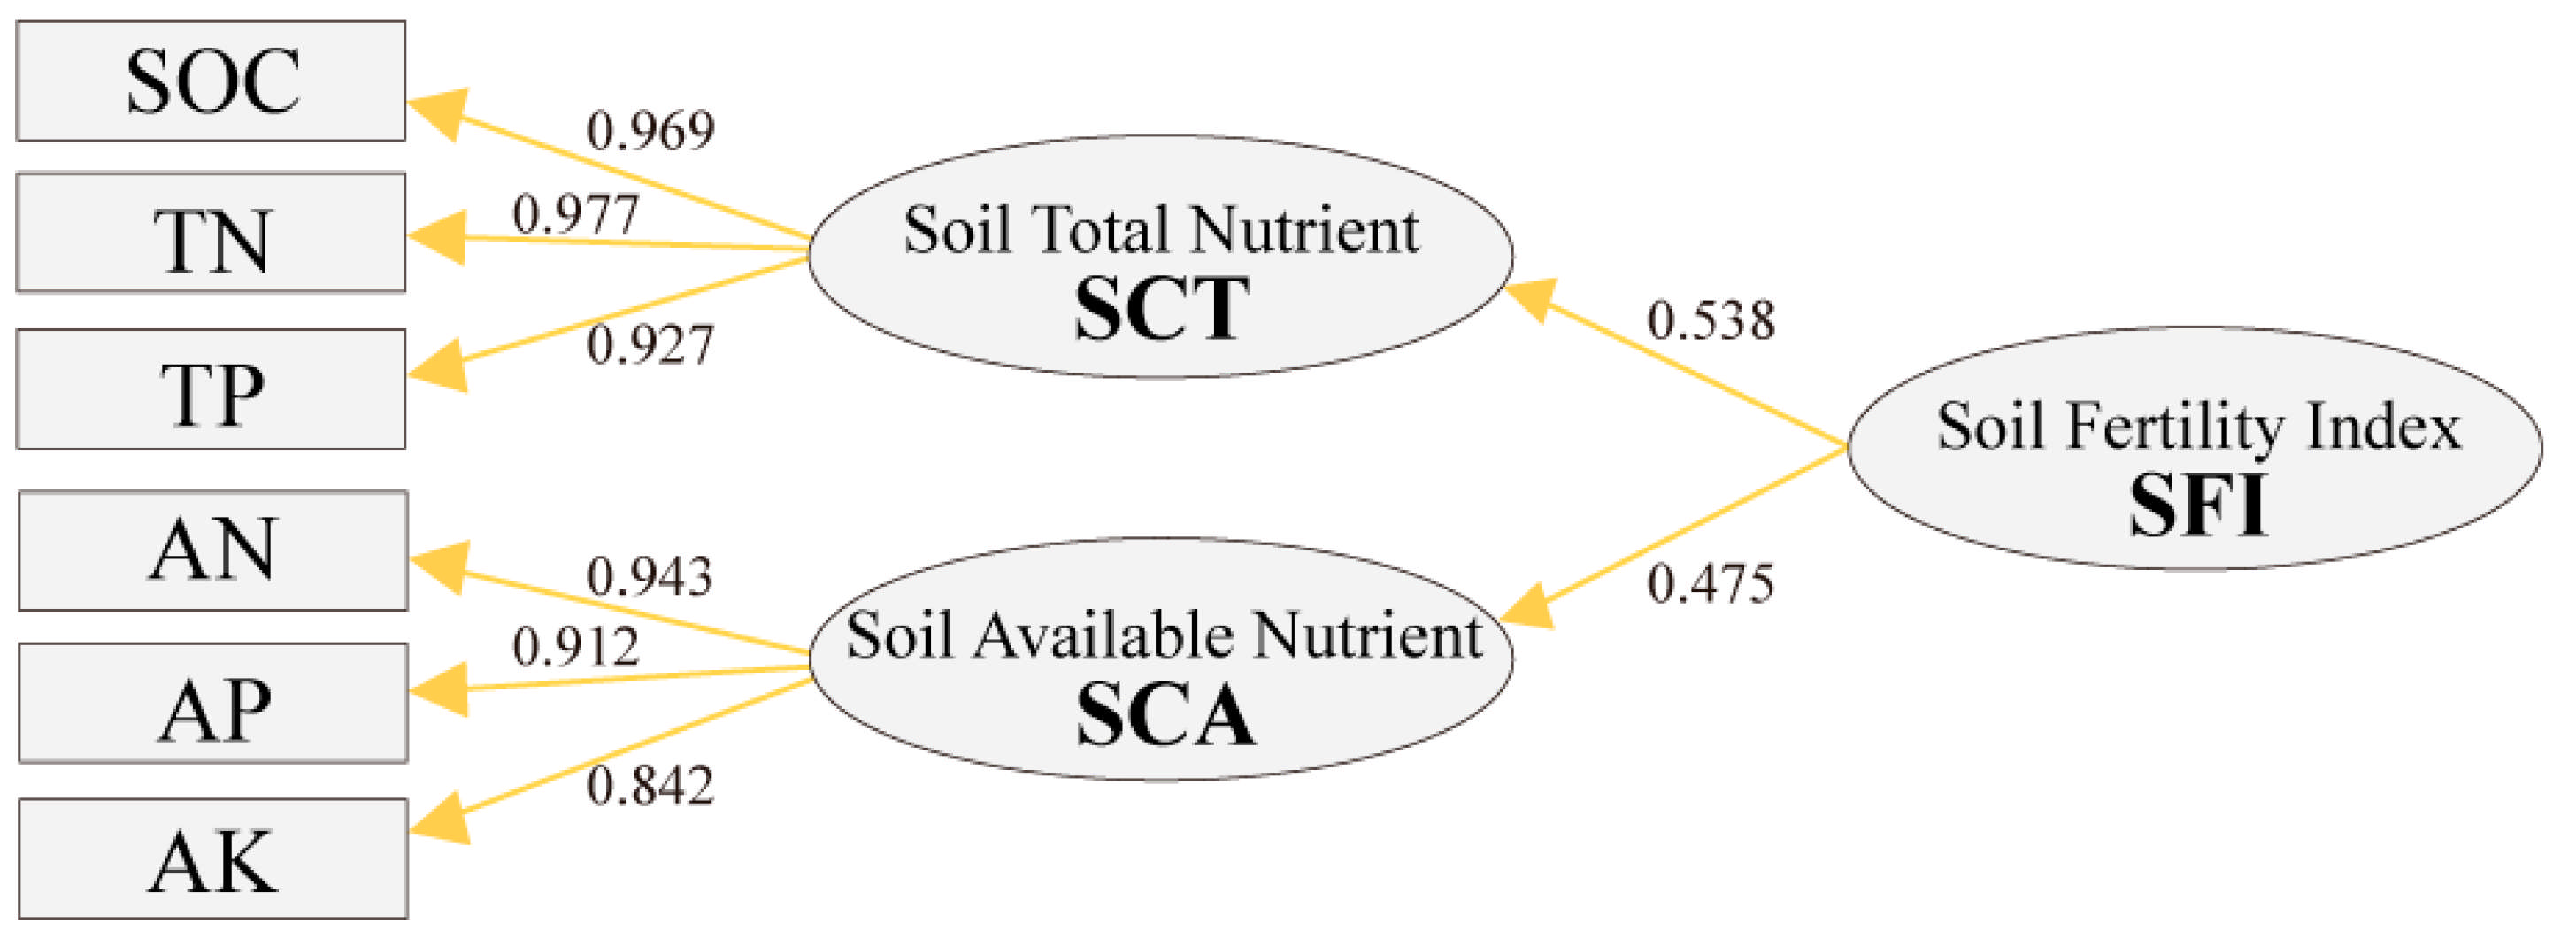
The influence coefficients of SCT and SCA were 0.538 and 0.475, respectively (Figure 6). The influence coefficients of SCT including SOC, TN, and TP were 0.969, 0.977, and 0.927. The influence coefficients of SCA including AN, AP, and AK were 0.943, 0.912, and 0.842. Based on the influence coefficient, the weight of observed variables and endogenous latent variables was calculated (Table 4). The weight of SCT (0.516) and SCA (0.484) showed no significant difference in soil nutrients, and the weights of the observed variable were similar in soil nutrients.
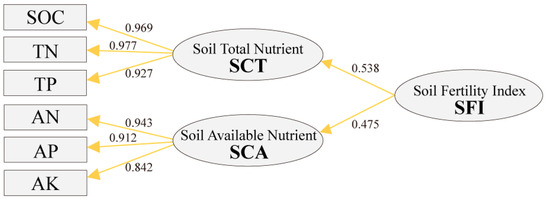
Figure 6.
Model of SFI.
Table 4.
Weights of SFI.
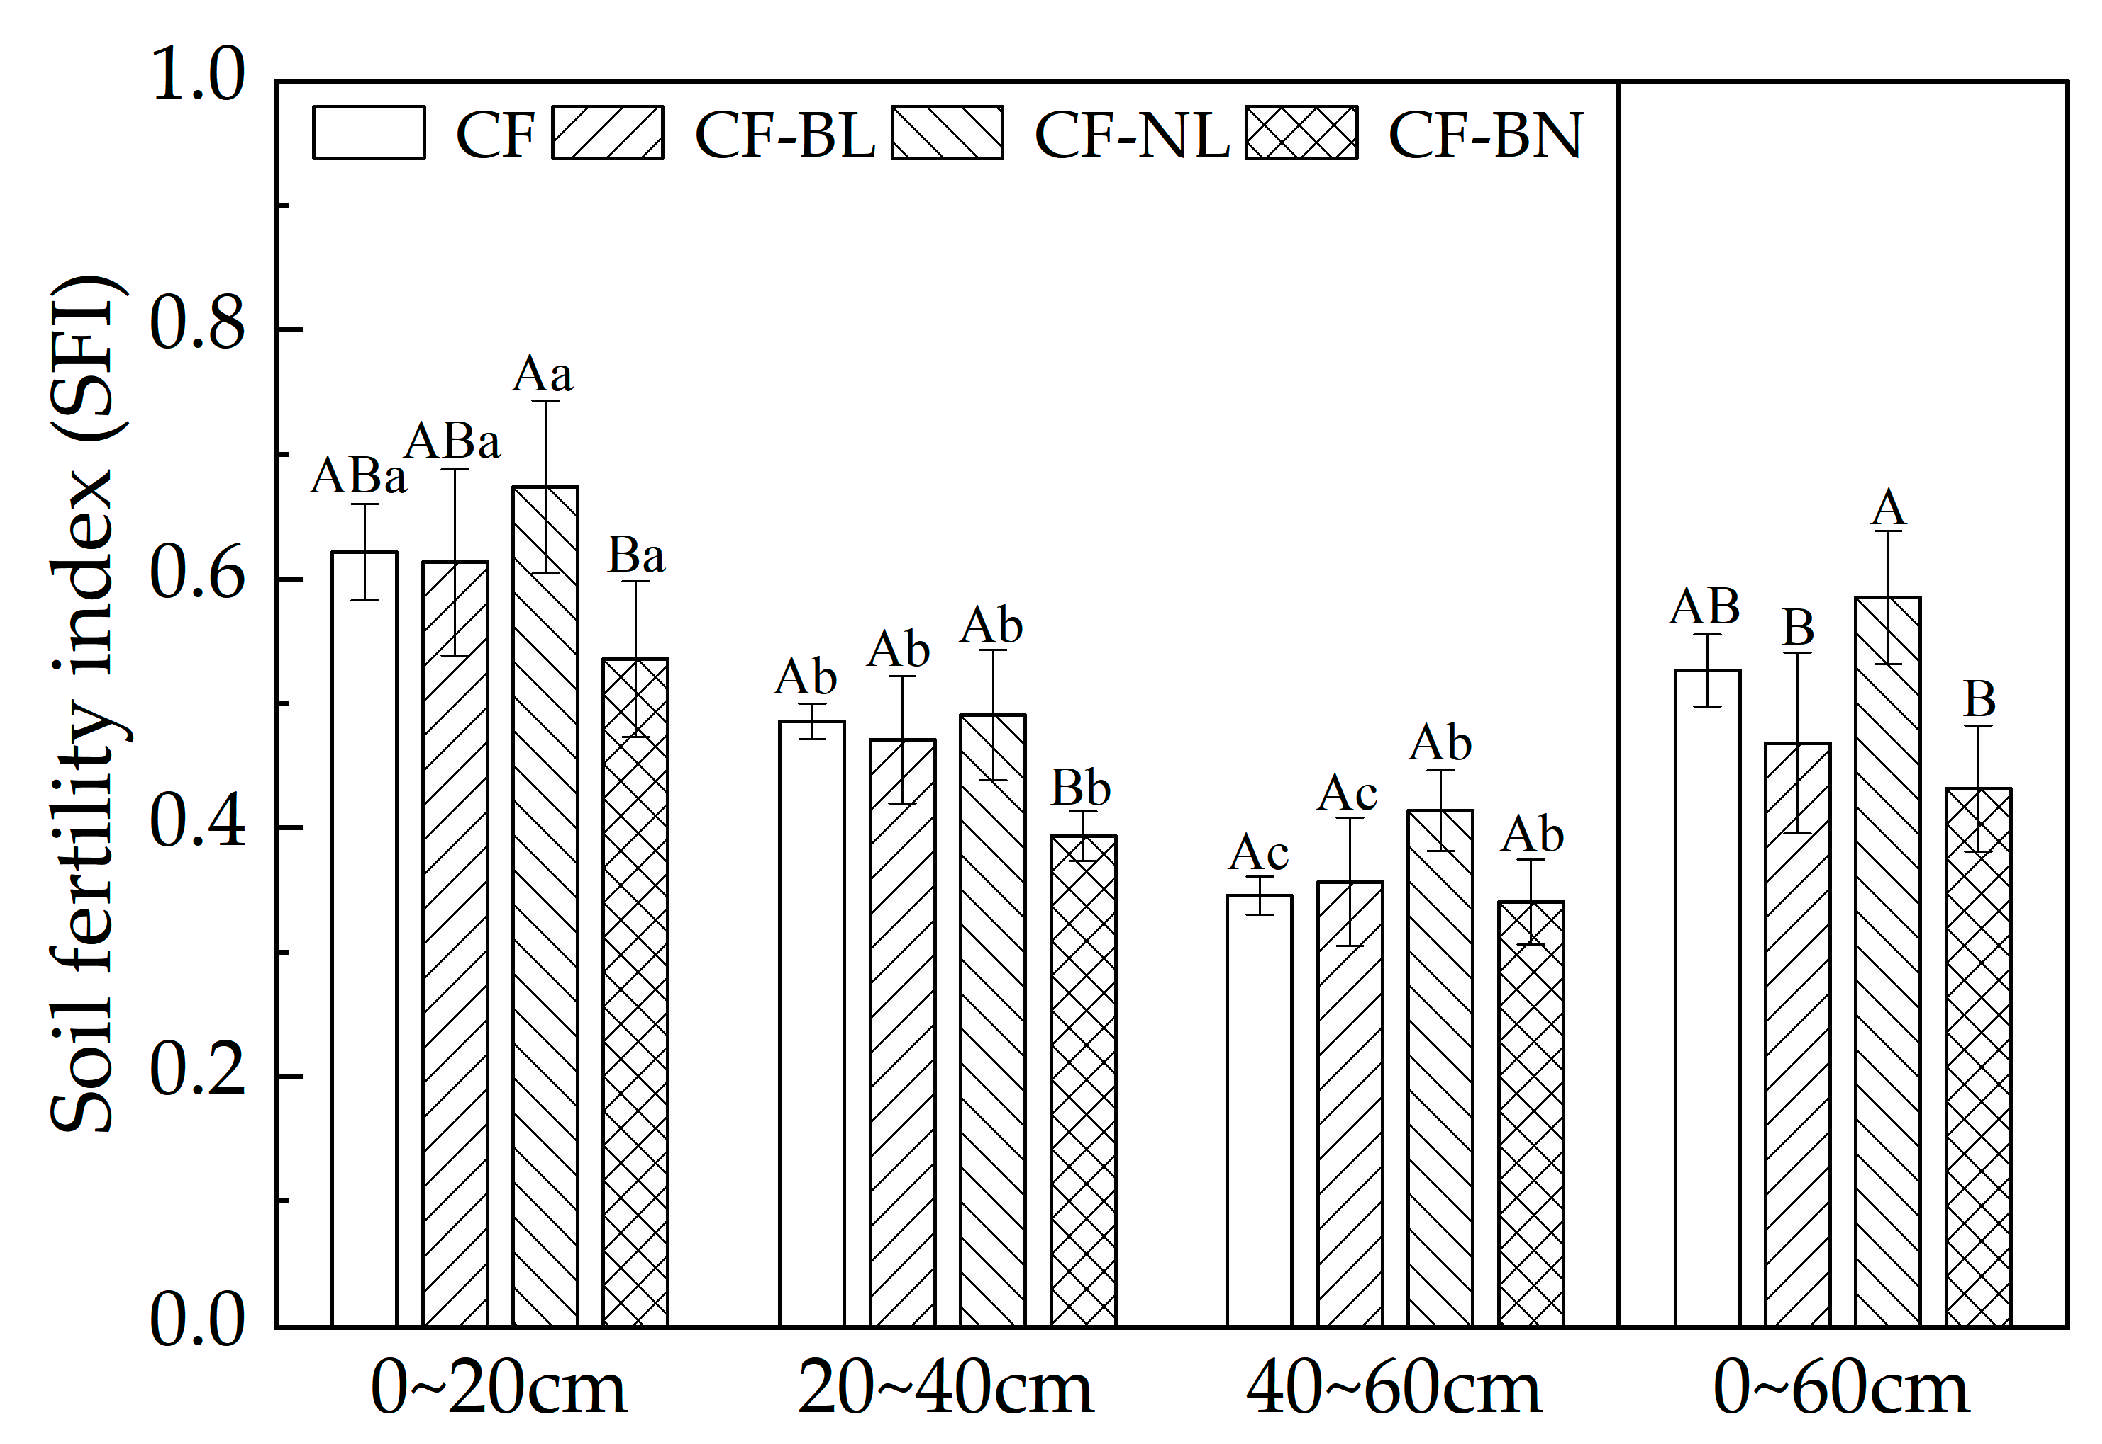
The SFI of Chinese fir plantations in different reconstruction patterns is shown in Figure 7. The SFI of the surface layer (0~20 cm) in four patterns was significantly higher than in other soil layers (p < 0.01). The SFI of CF-NL (0.67) was extremely significantly higher than that of CF-BN (0.54) in 0~20 cm (p < 0.01). In 20~40 cm, the SFI of CF-BN (0.39) was significantly lower than that of other reconstruction patterns (p < 0.05). There was no significant difference among different reconstruction patterns in 40~60 cm. In 0~60 cm, compared to CF, there was no significant difference in SFI of different patterns. The SFI of CF-NL (0.58) was significantly higher than that of other reconstruction patterns (p < 0.05).
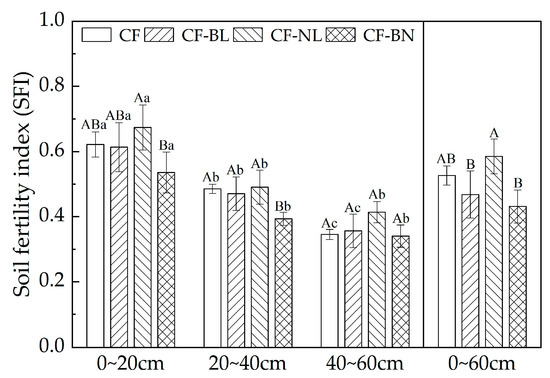
Figure 7.
SFI with soil depth in different reconstruction patterns. Note: Capital letters represent the significance (p < 0.05) in different patterns and lowercase letters represent the significance (p < 0.05) in different soil layers.
3.4. Effects of Stand Construction on Soil Fertility
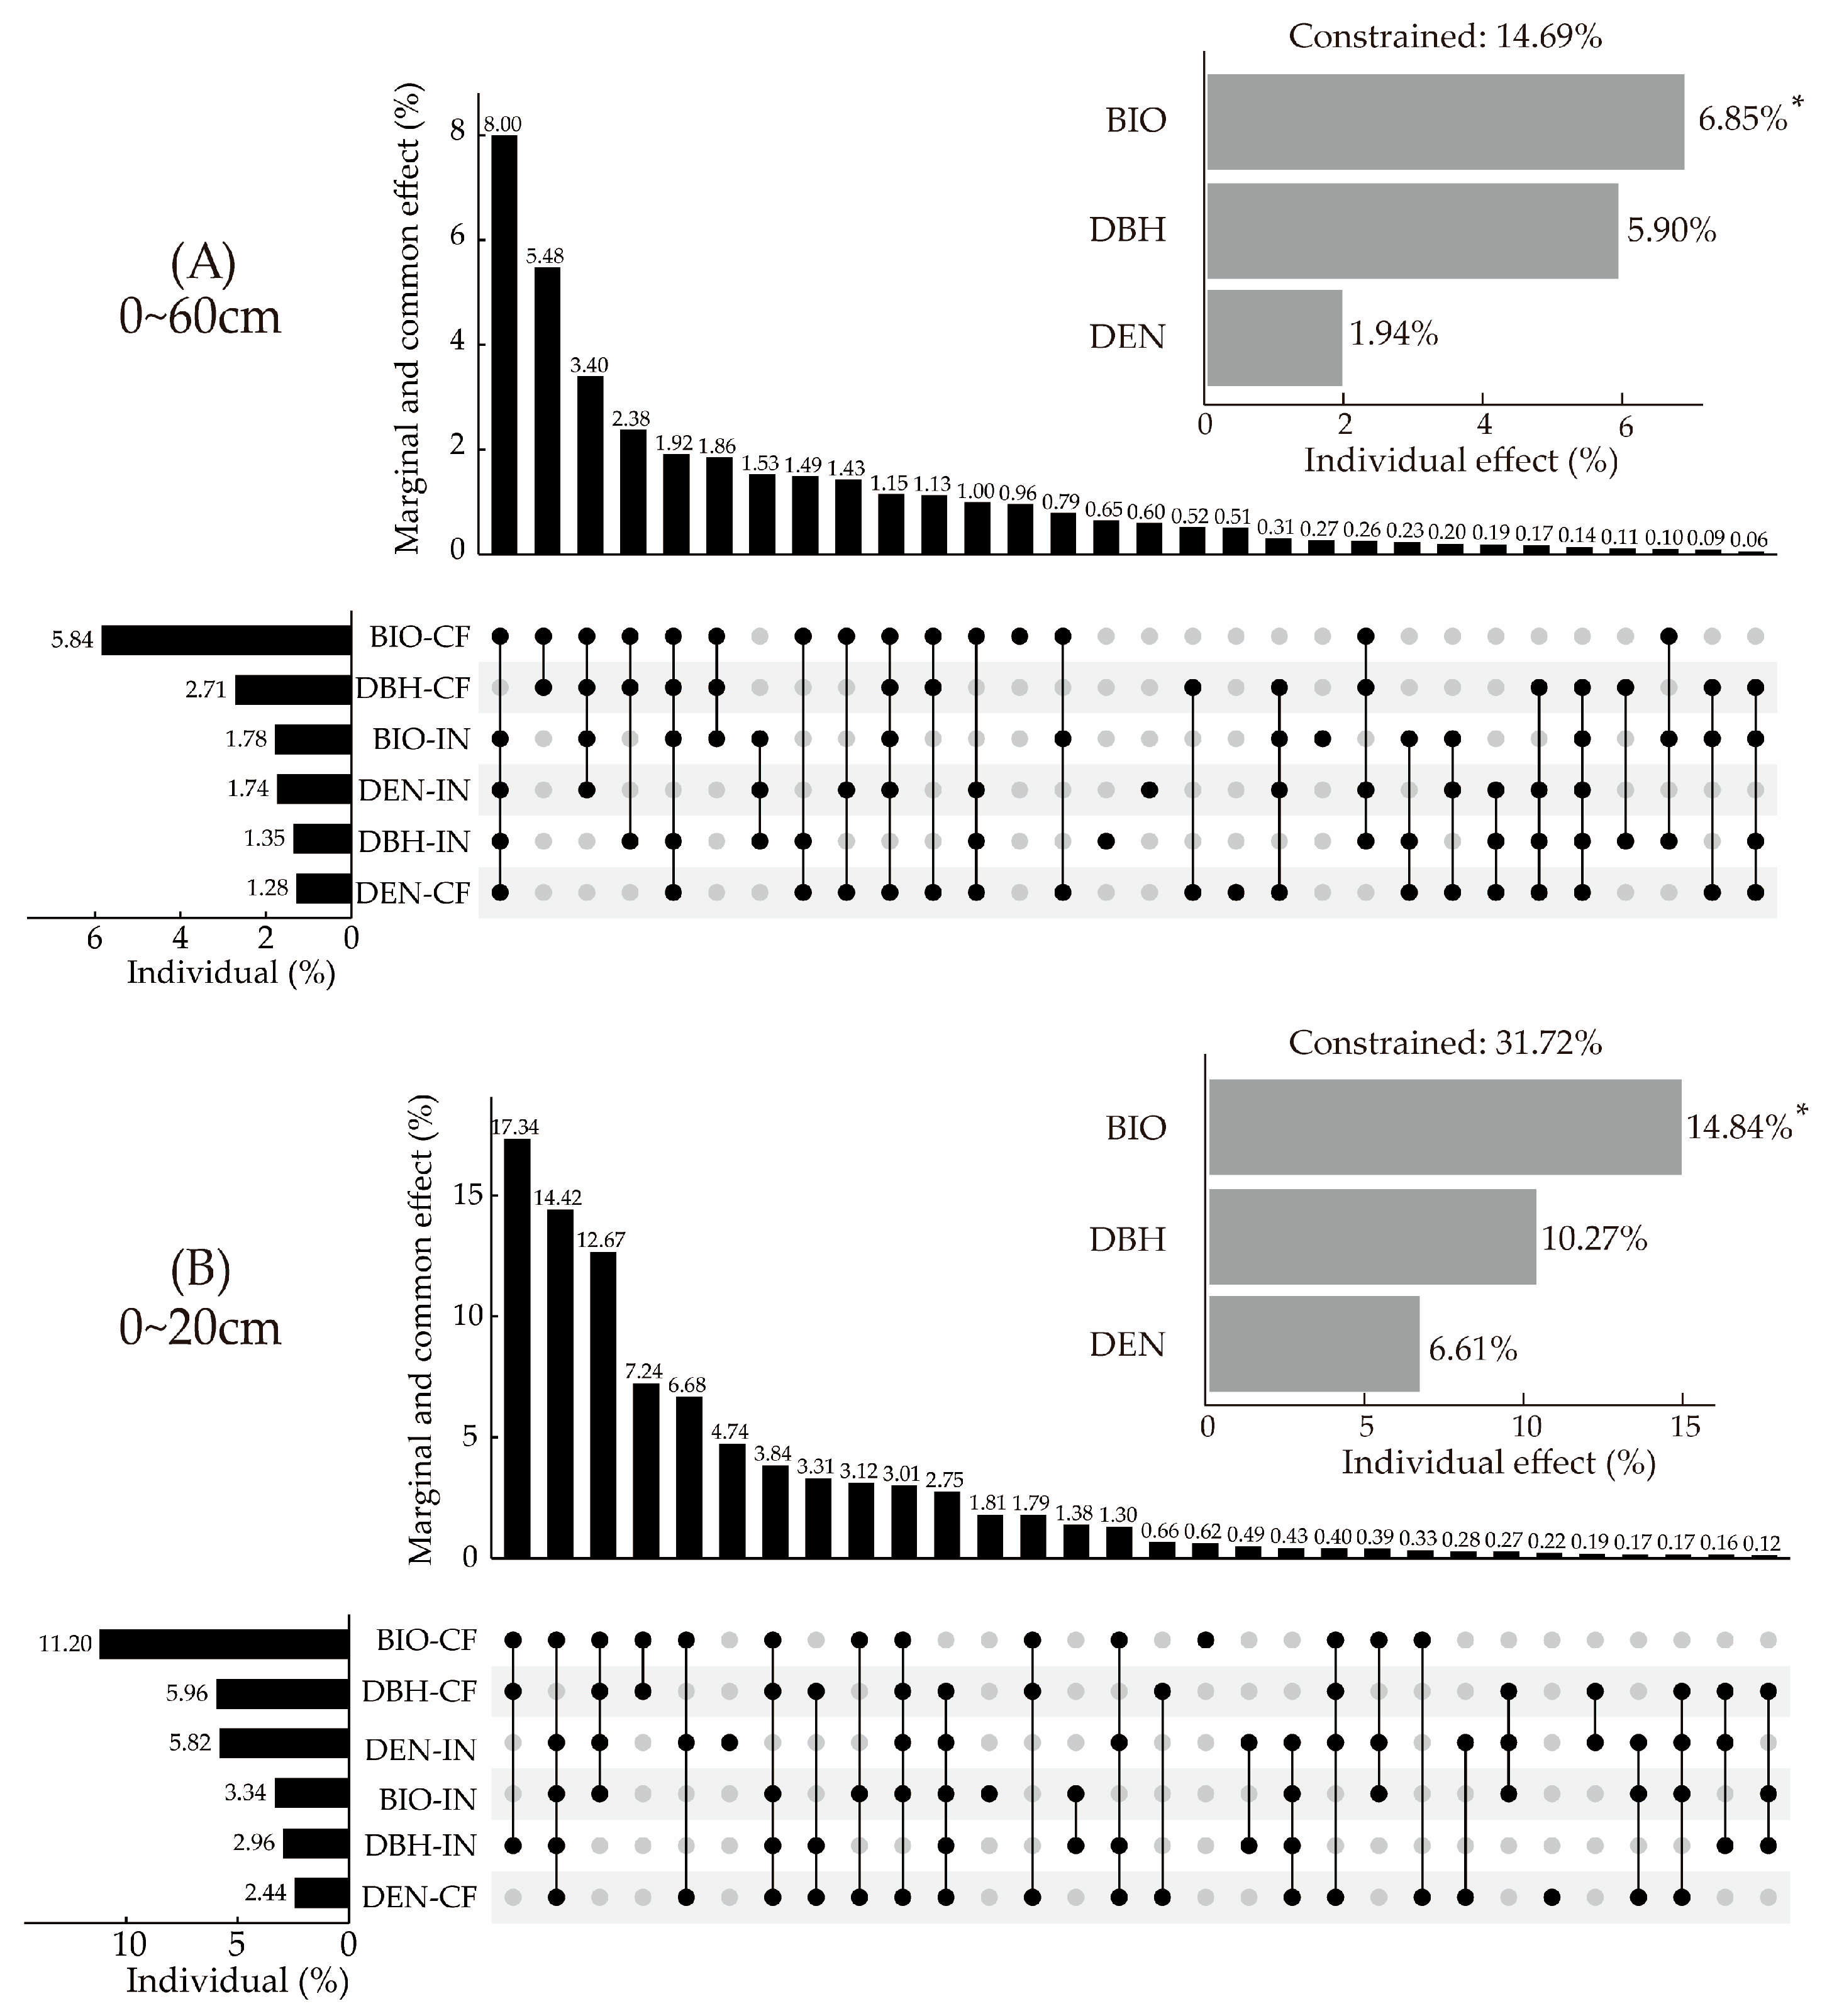
RDA combined with HP was used to quantify the effects of stand construction on SFI (Figure 8). Among all factors, the biomass of retained trees (Chinese fir) contributed the most to SFI. The contribution of Chinese fir BIO was significantly higher than that of introduced trees BIO, which accounted for 39.73% and 12.11% of that in all factors, respectively (Figure 8A). In the surface soil layer (0~20 cm), the contribution in BIO of Chinese fir and introduced trees accounted for 35.31% and 10.53% of all factor contributions, respectively (Figure 8B). The co-effects of BIO and DBH showed high contribution, in which the co-contributions of these accounted for more than 20%.
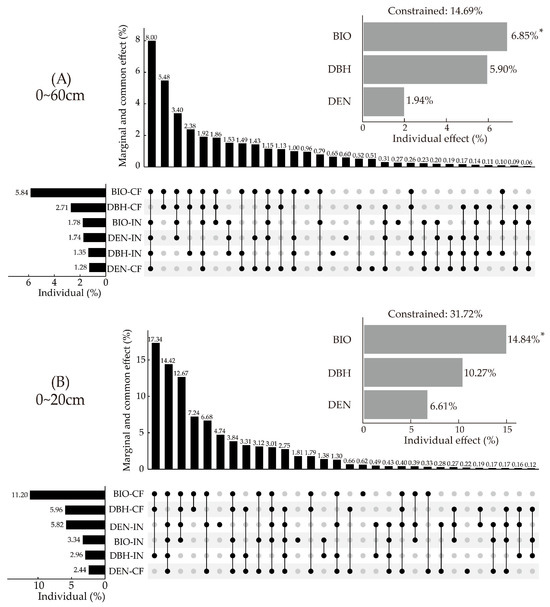
Figure 8.
The effects of stand construction on SFI by HP of RDA. (A) HP of RDA in 0~60 cm, (B) HP of RDA in 0~20 cm. Note: * represents the p value (<0.05) of each factor. BIO represents tree biomass, BIO-CF represents the biomass of the Chinese fir, BIO-IN represents the biomass of the introduced trees, DBH represents the diameter at breast height, DBH-CF represents the diameter at breast height of the Chinese fir, DBH-IN represents the diameter at breast height of the introduced trees, DEN represents tree density, DEN-CF represents the density of the Chinese fir, and DEN-IN represents the density of the introduced trees.
In general, BIO, DBH, and DEN explained 14.69% of SFI variation in 0~60 cm. BIO significantly affected SFI variation, contributing 6.85% (p < 0.05). In the surface layer (0~20 cm), the combined contribution of BIO, DBH, and DEN accounted for 31.72% of SFI variation. BIO significantly affected the variation of SFI, contributing 14.84% (p < 0.05). There was no significant effect in deeper soil layers.
4. Discussion
4.1. Soil Nutrient Characteristics in Different Reconstruction Patterns
Soil nutrients are essential for supplying tree growth and development, serving as key indicators for the comprehensive assessment of soil fertility and offering direct insights into stand conditions in forest ecosystems [5,39]. In this study, significant variations were observed across different reconstruction patterns. Introduced needleleaf increased total nutrient content by 13.94% to 21.15% and available nutrient content by 18.21% to 26.91%. Chinese fir was the species with high fertilizer consumption and poor self-fertilizing ability. Soil nutrients decreased under the continuous pure pattern in Chinese fir plantations [14]. However, Taxus wallichiana var. chinensis introduction significantly enhanced soil enzyme activity, which might enhance the assimilation process of soil microorganisms by introducing trees, leading to the transformation of soil nutrients from inorganic to organic forms [12]. Concurrently, it promoted nutrient cycling, enhanced soil fertility, and played a critical role in the restoration of forest soil ecosystems [40].
Compared to pure plantation, soil nutrient content decreased in introduced broadleaf and mixed broadleaf-needleleaf, with total nutrient content decreasing by 16.35%~26.92% and 26.32%~32.14%, and available nutrient content decreasing by 22.27%~33.95% and 28.08%~59.26%, respectively. This finding contrasted with previous studies, which proposed that introducing broadleaf could enhance soil nutrient content and improve soil fertility [41,42,43]. To ensure the balanced coexistence of both species in the later stages of succession, they needed to achieve mutual exclusion in one or more dimensions of the ecological niche [44,45]. During tree growth and community reconstruction, trees adjusted their morphological and physiological characteristics in response to fluctuations in resource availability and the composition of neighboring plants [46,47]. Phoebe chekiangensis, a deep-rooted evergreen broadleaf species, contrasted with the shallow-rooted Chinese fir. In the early stage of reconstruction, Chinese fir and Phoebe chekiangensis had similar ecological niches, where the abiotic survival requirements were similar in the same time and space. Their similar growth rates resulted in intensified resource competition [48], leading to nutrient depletion in both shallow and deep soil layers. In the meantime, the diversified tree composition enhanced the microclimate within the reconstructed Chinese fir plantations. The vertical stratification of trees facilitated the development of a dense litter layer, which promoted phosphorus accumulation and reduced potassium loss due to precipitation [49,50].
4.2. Soil Fertility Evaluation Based on PLS-PM Path Model
Soil fertility evaluation is the comprehensive assessment of various basic properties of soil conditions, which is an important indicator for characterizing soil quality and evaluating the effects of forest management [51]. Given the heterogeneity of vegetation, soil types, and physicochemical properties across regions, selecting appropriate methods for index construction is essential [52]. PLS-PM was the correlation-based structural equation modeling algorithm. It expressed variable causality through linear conditional expectations, identifying optimal linear predictive relationships, while enabling the use of latent variables to estimate the model [53]. Compared to traditional methods (e.g., multiplication and division, membership function, and principal component analysis for constructing the minimum data set), PLS-PM used path coefficients to determine the weights of soil nutrients. It could salve the influence of multicollinearity among soil nutrient indicators providing a more equitable method for soil fertility evaluation [21,54]. In this study, through model construction, reliability, and validity analysis, PLS-PM effectively reflected the relationship among soil nutrients and constructed the calculation model to reasonably predict SFI.
Variations in indicator weights significantly influenced soil fertility evaluation [13]. In this model, soil total nutrients (0.52) and available nutrients (0.48) were assigned nearly equal weights. Total nutrient content characterized the ability to supply nutrients, while available nutrients reflected the intensity of the nutrient supply. TN (0.35) and AN (0.37) accounted for the highest weights among soil nutrients in SFI, which was consistent with the results of previous studies [22,55]. Available nitrogen in forest soils primarily existed as inorganic nitrogen, which was highly soluble and mobile in the soil solution [40]. In this study, different reconstruction patterns influenced the formation of soil inorganic nitrogen, plant proteins, and nucleic acids. Soil nitrogen was an important indicator that could effectively reflect plant composition, functional dynamics, and soil fertility [56]. The SFI across the four patterns ranged from 0.43 to 0.58, and the SFI of the introduced needleleaf was significantly higher than that of the other two introduction patterns (p < 0.05). The soil fertility in Chinese fir plantations could be enhanced by introducing needleleaf [4]. However, SFI in 0~60 cm was in a relatively low state, with no significant differences between soil layers. Improving soil fertility was a long-term process. After the introduction of early stand reconstruction in Chinese fir plantations, research indicated that trees rapidly grow during the middle and young age stages, maintaining the high demand for soil nutrients [21]. Sparse understory vegetation and failure of litter to replenish soil nutrient deficiencies resulted in insignificant improvements in soil fertility.
4.3. Factors Affecting SFI in Stand Reconstruction
Important factors influencing soil fertility in pure Chinese fir plantations include soil nutrients, microbial population, and soil enzyme activity [8]. Thinning Chinese fir and introducing new trees directly changed the structure of the retained community. The changes in composition and stand biomass affected the ability of trees to consume soil nutrients [50,53]. In previous studies about forest reconstruction, stand age had significant effects on soil nutrients and fertility in short-rotation plantations [20]. There were differences in soil fertility effects of different introduced species and introduction densities [19]. In this study, stand structure contributed 14.69% to SFI, with its contribution increasing to 31.72% in the surface soil layer (0~20 cm). Stand biomass significantly influenced soil fertility changes, accounting for more than 40% of all explanations. Forest composition, root growth, and litter properties collectively constrained the improvement of soil ecological function and soil fertility [5]. In the high-density and middle-young Chinese fir plantations, significant differences in stand characteristics under the four patterns led to increased demand for soil carbon, nitrogen, and phosphorus, resulting in nutrient shortages and low soil fertility in early reconstruction [20]. Forest reconstruction promoted root aggregation and growth, which influenced biochemical processes, such as soil nutrient levels, cycling processes, and organic matter degradation [40,57]. The management of long-term pure Chinese fir plantation directly damaged plant roots, with fine roots being the most sensitive. Fine roots biomass showed a significant decreasing trend in the surface soil layer (0~20 cm) [58] while the surface soil layer was susceptible to disturbance by external factors. Fine roots play an important position in soil nitrogen and phosphorus nutrient restitution [57].
The HP of RDA revealed that the effect of retained Chinese fir biomass on soil fertility was significantly higher than that of introduced tree biomass, with the former contributing twice as much as the latter. The reduction in retained Chinese fir biomass was the major influence of soil fertility variation. This may stem from asynchronous interactions between the biomass of introduced trees and the belowground soil nutrient pool [59]. The development of interactions between forest and soil was a long-term process during vegetation restoration and succession. Before tree introduction, the pure Chinese fir plantation had achieved a stable equilibrium in resource utilization. It was difficult to change the properties of the soil nutrient cycling process by adjusting the community structure in early reconstruction [60]. Chinese fir needle litter exhibits slow decomposition rates [61]. Ground residue biomass in pure plantations was higher than in introduction patterns. Due to needle litter deposition, more organic carbon and nutrient elements were accumulated in the soil. The annual diameter growth indicated that the effects of the removal of organic residues on tree growth mainly occurred in the 7~9 years after the introduction of forest management [62]. This explained that changes in the biomass of retained trees (Chinese fir) under early introduction were the important factor limiting soil nutrients and fertility enhancement. In the meantime, interspecific competition among different species directly influenced the development of interspecific relationships and the effect of introduction [63]. It was an effective measure to accelerate vegetation recovery by constructing mixed tree plantations. However, the choice of introduced tree, retained tree biomass, and timing of introduction constrained the degree of restoration. Careful consideration of suitable dominant species and genetic diversity in introductions was essential [60].
In this study, soil fertility decreased under early stand reconstruction, but there was no significant difference in nutrient and SFI between CF and other introductions in the soil layer of 0~60 cm. The soil could maintain the nutrient supply for tree growth in the early period of Chinese fir plantations after introduction [20] and did not cause excessive depletion or significant degradation of soil fertility. We suggest that in the early period of stand reconstruction, cutting intensity in Chinese fir plantations should be moderate. The sharp reduction in retained Chinese fir biomass could decrease soil fertility, eventually restricting the growth of introduced trees. At the same time, soil fertility could be maintained and forest growth enhanced by supplementing organic matter and moderately increasing the application of nitrogen, phosphorus, and potassium fertilizers. Soil fertility is also influenced by factors such as root distribution, litter, and microbial biomass. The varying depths and interwoven structures of root systems significantly enhanced soil permeability and accelerated soil nutrient cycling [64]. Soil microorganisms were involved in many ecological processes, including directly regulating organic matter transformation and biochemical reactions [65]. The decomposition of microbial residues could accelerate nutrient release and regulate soil fertility [66]. Therefore, to enhance the scientific validation and applicability of soil fertility assessment, future research should be enriched with the exploration of soil biological characteristics.
5. Conclusions
In this study, soil nutrient indicators SOC, TN, TP, AN, AP, and AK in Chinese fir plantations were measured under four reconstruction patterns. The SFI evaluation model was well fitted based on the PLS-PM path model, while the potential factors influencing soil fertility were investigated by combining with stand construction. In early stand reconstruction, the soil total and available nutrient contents increased due to the introduced needleleaf and decreased due to the introduced broadleaf and mixed broadleaf-needleleaf. There were significant differences in different introduction patterns. Soil fertility was in a low state in early stand reconstruction in Chinese fir plantations. Compared to the pure plantation, soil fertility did not seem to be increased by introducing trees in early stand reconstruction. The SFI of the introduced needleleaf was significantly higher than that of other reconstruction patterns. The sharp reduction of standing tree biomass might be the reason for the decrease in soil fertility in different reconstruction patterns. Maintaining suitable thinning intensity to retain enough Chinese fir biomass for promoting the growth of introduced trees is suggested. This study provides the scientific basis for the sustainable reconstruction of Chinese fir plantations.
Author Contributions
Conceptualization, Z.Z.; methodology, Z.Z.; software, Z.Z. and Y.Y.; validation, Z.Z., and H.L.; formal analysis, Z.Z.; investigation, A.L.; resources, H.L.; data curation, Z.Z. and Y.Y.; writing—original draft preparation, Z.Z.; writing—review and editing, Z.Z. and B.Z.; visualization, Z.Z.; supervision, Y.Z.; project administration, B.Z.; funding acquisition, Z.Z. and B.Z. All authors have read and agreed to the published version of the manuscript.
Funding
This research was funded by the Leading Goose Project of Zhejiang Department of Science Technology (2023C02035) and the National Key Research and Development Program of China (2023YFD2200404–02).
Data Availability Statement
The datasets presented in this article are not readily available because the data are part of an ongoing study. Requests to access the datasets should be directed to Zhao (email: zhaoziqing@caf.ac.cn).
Conflicts of Interest
The authors declare no conflicts of interest.
Abbreviations
The following abbreviations are used in this manuscript:
| CF | Pure Chinese fir plantation |
| CF-BL | Chinese fir plantation introduced broadleaf (Phoebe chekiangensis) |
| CF-NL | Chinese fir plantation introduced needleleaf (Taxus wallichiana var. Chinensis) |
| CF-BN | Chinese fir plantation introduced mixed broadleaf (Phoebe chekiangensis, Cinnamomum chekiangense)-needleleaf (Taxus wallichiana var. Chinensis) |
| SFI | Soil fertility index |
| PLS-PM | Partial least squares path modeling |
| SEM | Structural equation model |
| SCT | Soil chemistry total nutrient |
| SCA | Soil chemistry available nutrient |
| DBH | Diameter at breast height |
| DBH-CF | Diameter at breast height of Chinese fir |
| DBH-IN | Diameter at breast height of introduced trees |
| H | Height |
| ELE | Elevation |
| SLO | Slope |
| ASP | Aspect |
| IV | Important value |
| BIO | Tree biomass |
| BIO-Above | Aboveground biomass |
| BIO-Below | Belowground biomass |
| BIO-CF | Biomass of Chinese fir |
| BIO-IN | Biomass of introduced trees |
| DEN | Tree density |
| DEN-CF | Density of Chinese fir |
| DEN-IN | Density of introduced trees |
| SOC | Soil organic carbon |
| TN | Soil total nitrogen |
| TP | Soil total phosphorus |
| AN | Soil available nitrogen |
| AP | Soil available phosphorus |
| AK | Soil available potassium |
| KMO | Kaiser-Meyer-Olkin test |
| C.Alpha | Cronbach’s Alpha reliability test |
| CR | Composite reliability |
| DG.rho | Dillon-Goldstein’s rho |
| GoF | Goodness of fit |
| AVE | Average variance extracted |
| RDA | Canonical analysis |
| HP | Hierarchical clustering |
References
- Tang, X.; Pérez-Cruzado, C.; Fehrmann, L.; Álvarez-González, J.G.; Lu, Y.; Kleinn, C. Development of a compatible taper function and stand-level merchantable volume model for Chinese fir plantations. PLoS ONE 2016, 11, e0147610. [Google Scholar] [CrossRef] [PubMed]
- Li, R.H.; Han, J.M.; Duan, X.; Chi, Y.G.; Zhang, W.D.; Chen, L.C.; Wang, Q.K.; Xu, M.; Yang, Q.P.; Wang, S.L. Crown pruning and understory removal did not change the tree growth rate in a Chinese fir (Cunninghamia lanceolata) plantation. For. Ecol. Manag. 2020, 464, 118056. [Google Scholar] [CrossRef]
- Li, W.Y.; Sun, H.M.; Cao, M.M.; Wang, L.Y.; Fang, X.H.; Jiang, J. Diversity and structure of soil microbial communities in Chinese fir plantations and Cunninghamia lanceolata–Phoebe bournei mixed forests at different successional stages. Forests 2023, 14, 1977. [Google Scholar] [CrossRef]
- Yu, Y.C.; Yang, J.Y.; Zeng, S.C.; Wu, D.M.; Jacobs, D.F.; Sloan, J.L. Soil pH, organic matter, and nutrient content change with the continuous cropping of Cunninghamia lanceolata plantations in South China. J. Soils Sediments 2017, 17, 2230–2238. [Google Scholar] [CrossRef]
- Pang, Y.F.; Cao, X.Y.; Li, J.P.; Zhao, W.F.; Xie, Z.C.; Sun, Y.P. Soil fertility analysis and comprehensive evaluation of four typical forest stands in Fushou forest farm. J. West China For. Sci. 2021, 50, 53–60. [Google Scholar] [CrossRef]
- Kang, H.; Lee, D. Inhibition of extracellular enzyme activities in a forest soil by additions of inorganic nitrogen. Commun. Soil Sci. Plant Anal. 2005, 36, 15–16. [Google Scholar] [CrossRef]
- Farooq, T.H.; Kumar, U.; Shakoor, A.; Albasher, G.; Alkahtani, S.; Rizwana, H.; Tayyab, M.; Dobaria, J.; Hussain, M.I.; Wu, P. Influence of intraspecific competition stress on soil fungal diversity and composition in relation to tree growth and soil fertility in sub-tropical soils under Chinese Fir monoculture. Sustainability 2021, 13, 10688. [Google Scholar] [CrossRef]
- Yan, M.M.; Gao, H.D.; Liu, M.H.; Yi, L.T. Research progress on the effect of mixed plantation on the soil fertility in the forests between Cumminghamia lanceolata and other tree species. Ecol. Sci. 2024, 43, 253–259. [Google Scholar] [CrossRef]
- Wang, L.Y.; Sun, Y.Y.; Li, J.; Tigabu, M.; Xu, Q.L.; Ma, X.Q.; Li, M. Rhizosphere soil nutrients and bacterial community diversity of four broad-leaved trees planted under Chinese fir stands with different stocking density levels. Front. For. Glob. Change 2023, 6, 1135692. [Google Scholar] [CrossRef]
- Pan, Y.L.; Lin, G.W.; Chen, Z.W.; Fan, Y.; Chen, X.F.; Wu, C.Z.; Hong, T. Effect of Cunninghamia lanceolata-Aleurites montana mixed forests on soil enzyme activity. Chin. J. Trop. Crops 2018, 39, 846–851. [Google Scholar] [CrossRef]
- Lei, J.; Wu, H.B.; Li, X.Y.; Guo, W.F.; Duan, A.G.; Zhang, J.G. Response of rhizosphere bacterial communities to near-natural forest management and tree species within Chinese fir plantations. Microbiol. Spectr. 2023, 11, e02328-22. [Google Scholar] [CrossRef] [PubMed]
- Sun, S.Y.; Lu, S.X.; Lu, Y.M.; Xu, E.L.; Wu, D.M.; Liu, C.H.; Jiang, Z.K.; Guo, J.F. Effects of Chinese fir interplanted with broadleaved trees on soil ecological enzyme activity and stoichiometry. For. Res. 2021, 34, 106–113. [Google Scholar] [CrossRef]
- Chen, J.; Qu, M.K.; Zhang, J.L.; Xie, E.Z.; Huang, B.; Zhao, Y.C. Soil fertility quality assessment based on geographically weighted principal component analysis (GWPCA) in large-scale areas. CATENA 2021, 201, 105197. [Google Scholar] [CrossRef]
- Luo, Y.J.; Zhang, X.Q. The assessment of soil degradation in successive rotations of Chinese fie plantation and the soil amelioration of mixed plantation of Chinese fir and broad-leaved. Acta Ecol. Sin. 2007, 27, 715–724. [Google Scholar] [CrossRef]
- Jiang, H.Y. Fir, Sassafras tree forest biomass and forest soil fertility research. East Chin. For. Manag. 2009, 23, 13–15. [Google Scholar] [CrossRef]
- He, G.P.; Chen, Y.T.; Hu, B.T.; Feng, J.W.; Liu, H.T.; Cai, H.M. Study on the biomass and soil fertility of pure and mixed stands of Cunninghamia lanceolata, Liriodendron chinense and Sassafras tsumu. For. Res. 2001, 14, 540–547. [Google Scholar] [CrossRef]
- Hong, J.N. The preliminary study on the afforestation effect of the Cunninghamia lanceolata mixed with other seven broad-leaved species. J. Fujian For. Sci. Technol. 2008, 1, 120–124. [Google Scholar] [CrossRef]
- Guo, J.H.; Feng, H.L.; McNie, P.; Liu, Q.Y.; Xu, X.; Pan, C.; Yan, K.; Feng, L.; Goitom, E.A.; Yu, Y.C. Species mixing improves soil properties and enzymatic activities in Chinese fir plantations: A meta-analysis. CATENA 2023, 220, 106723. [Google Scholar] [CrossRef]
- Guo, J.H.; Sun, J.J.; Feng, H.L.; Cao, P.H.; Yu, Y.C. Research progress on evolution trends and maintenance measures of soil fertility quality in Cunninghamia lanceolata plantations. J. Zhejiang A F Univ. 2020, 37, 801–809. [Google Scholar] [CrossRef]
- Du, C.Q.; Zhou, G.Q.; Yuan, H.; Wang, L.K.; Lei, J.; Xu, Y.Z. Comprehensive evaluation of soil fertility in different stand ages in a Chinese fir short rotation plantation. J. For. Environ. 2021, 41, 255–262. [Google Scholar] [CrossRef]
- Cao, X.Y.; Mo, Y.J.; Yan, W.D.; Zhang, Z.L.; Peng, Y.Y. Evaluation of soil quality in five ages of Chinese fir plantations in subtropical China based on a structural equation model. Forests 2023, 14, 1217. [Google Scholar] [CrossRef]
- Zhao, W.F.; Cao, X.Y.; Li, J.P.; Xie, Z.C.; Sun, Y.P.; Peng, Y.Y. Novel weighting method for evaluating forest soil fertility index: A structural quation model. Plants 2023, 12, 410. [Google Scholar] [CrossRef] [PubMed]
- Selvaraj, S.; Duraisamy, V.; Huang, Z.J.; Guo, F.T.; Ma, X.Q. Influence of long-term successive rotations and stand age of Chinese fir (Cunninghamia lanceolata) plantations on soil properties. Geoderma 2017, 306, 127–134. [Google Scholar] [CrossRef]
- Zhang, B.; Zhan, G.Y.; Chen, D.; White, R.E.; Li, L. A quantitative evaluation system of soil productivity for intensive agriculture in China. Geoderma 2004, 123, 319–331. [Google Scholar] [CrossRef]
- Liu, D.H.; Liang, G.Q.; Zhou, W.; Wang, X.B.; Xia, W.J. Fuzzy comprehensive fertility evaluation based on BP artificial network. Soil Fertil. Sci. Chin. 2011, 5, 12–19. [Google Scholar] [CrossRef]
- Ye, H.C.; Zhang, S.W.; Huang, Y.F.; Zhou, Z.M.; Shen, Z.Y. Application of rough set theory to determine weights of soil fertility factor. Sci. Agric. Sin. 2014, 47, 710–717. [Google Scholar] [CrossRef]
- Cao, Y.B.; Wang, B.T.; Wei, T.T.; Ma, H. Ecological stoichiometric characteristics and element reserves of three stands in a closed forest on the Chinese loess plateau. Environ. Monit. Assess 2016, 188, 80. [Google Scholar] [CrossRef]
- Li, X.; Zhang, W.; Wu, L.; Ren, Y.; Zhang, J.; Xu, M. Advance in Indicator Screening and Methodologies of Soil Quality Evaluation. Sci. Agric. Sin. 2021, 54, 3043–3056. [Google Scholar] [CrossRef]
- Bünemanna, E.K.; Bongiorno, G.; Bai, Z.; Creamerb, R.E.; Deyn, G.D.; Goede, R.; Fleskens, L.; Geissen, V.; Kuyper, T.W.; Mäder, P.; et al. Soil quality—A critical review. Soil Biol. Biochem. 2018, 120, 105–125. [Google Scholar] [CrossRef]
- Libório, M.P.; Martinuci, O.D.S.; Laudares, S.; Lyrio, R.D.M.; Machado, A.M.C.; Bernardes, P.; Ekel, P. Measuring intra-urban inequality with structural equation modeling: A theory-grounded indicator. Sustainability 2020, 12, 8610. [Google Scholar] [CrossRef]
- Hair, J.F.; Risher, J.J.; Sarstedt, M.; Ringle, C.M. When to use and how to report the results of PLS-SEM. Eur. Bus. Rev. 2019, 31, 2–24. [Google Scholar] [CrossRef]
- GB/T 43648-2024; National Public Service Platform for Standards Information (SAC/TC 370). Tree Biomass Models and Related Parameters to Carbon Accounting for Major Tree Species. Standards Press of China: Beijing, China, 2024.
- Bao, S.D. Soil and Agricultural Chemistry Analysis, 3rd ed.; China Agriculture Press: Beijing, China, 2000; pp. 25–114. ISBN 9787109066441. [Google Scholar]
- Bonett, D.G.; Wright, T.A. Cronbach’s alpha reliability: Interval estimation, hypothesis testing, and sample size planning. J. Organ. Behav 2014, 36, 3–15. [Google Scholar] [CrossRef]
- Byrne, B.M. Structural Equation Modeling with AMOS: Basic Concepts, Applications, and Programming, 2nd ed.; Routledge: New York, NY, USA, 2022; pp. 3–15. ISBN 978-0-8058-6373-4. [Google Scholar]
- Tenenhaus, M.; Esposito, V.V.; Chatelin, Y.M.; Lauro, C. PLS path modeling. Comput. Stat. Data An. 2005, 48, 159–205. [Google Scholar] [CrossRef]
- Shao, G.D.; Ai, J.J.; Sun, Q.W.; Hou, L.Y.; Dong, Y.F. Soil quality assessment under different forest types in the Mount Tai, Central Eastern China. Ecol. Indic. 2020, 115, 106439. [Google Scholar] [CrossRef]
- Lai, J.S.; Zou, Y.; Zhang, J.L.; Peres-Neto, R.P. Generalizing hierarchical and variation partitioning in multiple regression and canonical analyses using the rdacca.hp R package. Methods Ecol. Evol. 2022, 13, 782–788. [Google Scholar] [CrossRef]
- Bai, Y.F.; Chen, S.Y.; Shi, S.R.; Qi, M.J.; Liu, X.H.; Wang, H.; Wang, Y.X.; Jiang, C.Q. Effects of different management approaches on the stoichiometric characteristics of soil C, N, and P in a mature Chinese fir plantation. Sci. Total Environ. 2020, 723, 137868. [Google Scholar] [CrossRef]
- Zhao, Y.; Yu, W.J.; He, Y.M.; Yu, C.X.; Wu, C.Z.; Li, J. Effects of understory Taxus chinensis var. mairei planting on soil fertility of Chinese fir plantations. Chin. J. Appl. Environ. Biol. 2024, 30, 344–352. [Google Scholar] [CrossRef]
- Wang, X.Y.; Wang, Q.C. Effects of the close-to-nature cultivation of Larix olgensis and Fraxinus mandshurica on the soil physiochemical properties. Sci. Silv. Sin. 2008, 44, 21–27. [Google Scholar] [CrossRef]
- Wang, S.L.; Shen, H.Y.; Sun, Y.; Zhou, Y.Y. Effects of pure Larix olgensis plantation improvement on the soil properties. Sci. Soil Water Conserv. 2009, 7, 98–103. [Google Scholar] [CrossRef]
- Fu, J.Q. Effects of Schima superba interplanting on stand growth and soil properties of Pinus massoniana. Anhui Agric. Sci. Bull. 2012, 18, 126–127. [Google Scholar] [CrossRef]
- Chu, C.J.; Adler, P.B. Large niche differences emerge at the recruitment stage to stabilize grassland coexistence. Ecol. Monogr. 2015, 85, 373–392. [Google Scholar] [CrossRef]
- Yamawo, A. Relatedness of neighboring plants alters the expression of indirect defense traits in an extrafloral nectary-bearing plant. Evol. Biol. 2015, 42, 12–19. [Google Scholar] [CrossRef]
- Lu, D.L.; Wang, G.G.; Yan, Q.L.; Gao, T.; Zhu, J.J. Effects of gap size and within-gap position on seedling growth and biomass allocation: Is the gap partitioning hypothesis applicable to the temperate secondary forest ecosystems in Northeast China? For. Ecol. Manag. 2018, 429, 351–362. [Google Scholar] [CrossRef]
- Jiao, J.J.; Sheng, W.X.; Su, G.L.; Xu, Y.H.; Wu, C.P.; Wang, Z.G.; Yang, L.J.; Zhu, J.R.; Jiang, B.; Li, L.H. Stand increment and diversity of understory species in Cunninghamia lanceolata plantation mixed with different rare tree species. J. Zhejiang For. Sci. Technol. 2022, 42, 1–8. [Google Scholar] [CrossRef]
- Zou, H.L. Preliminary Study on the Species and Stand Feature of 5 Phoebe Trees in Zhejiang Province. Master’ Thesis, Zhejiang A&F University, Hangzhou, China, 2012. [Google Scholar]
- He, J.N.; Xie, J.T. Research on nitrogen and phosphorus content in soil of different forest types in Mangshan. J. Cent. South Univ. For. Technol. 2015, 35, 83–88. [Google Scholar] [CrossRef]
- Sun, Y.; Li, J.P.; Cao, X.Y.; Yan, J.R. Research on the relationship between spatial structure and soil nutrients of Cunninghamia lanceolata forest based on path analysis method. J. Cent. South Univ. For. Technol. 2020, 40, 41–47. [Google Scholar] [CrossRef]
- Planavsky, N.J.; Rouxel, O.J.; Bekker, A.; Lalonde, S.V.; Konhauser, K.O.; Reinhard, C.T.; Lyons, T.W. The evolution of the marine phosphate reservoir. Nature 2010, 467, 1088–1090. [Google Scholar] [CrossRef]
- Chen, S.; Lin, B.W.; Li, Y.Q.; Zhou, S.M. Spatial and temporal changes of soil properties and soil fertility evaluation in a large grain-production area of subtropical plain, China. Geoderma 2020, 357, 113937. [Google Scholar] [CrossRef]
- Dǎnescu, A.; Albrecht, A.T.; Bauhus, J. Structural diversity promotes productivity of mixed, uneven-aged forests in southwestern Germany. Oecologia 2016, 182, 319–333. [Google Scholar] [CrossRef]
- Jiang, B.; Wang, S.T.; Sun, Z.B.; Zhang, H.R.; Wang, J.; Liu, Y. Evaluation of cultivated land soil fertility based on membership function and principal component analysis. Chin. Agric. Sci. Bull. 2023, 39, 22–27. [Google Scholar] [CrossRef]
- Zhang, Y.H.; Xu, X.L.; Li, Z.W.; Liu, M.X.; Xu, C.H.; Zhang, R.F.; Luo, W. Effects of vegetation restoration on soil quality in degraded karst landscapes of southwest China. Sci. Total Environ. 2019, 650, 2657–2665. [Google Scholar] [CrossRef] [PubMed]
- Liu, X.; Zhang, W.; Wu, M.; Ye, Y.Y.; Wang, K.L.; Li, D.J. Changes in soil nitrogen stocks following vegetation restoration in a typical karst catchment. Land Degrad. Dev. 2019, 30, 60–72. [Google Scholar] [CrossRef]
- Liu, S.N.; Yu, H.; Li, S.M.; Wei, X.L. A review on soil fertility in mixed Chinese fir and broad forest. Chin. For. Sci. Technol. 2005, 5, 4–6. [Google Scholar] [CrossRef]
- Yang, Y.S.; Cai, L.P.; Chen, G.S.; He, Z.M.; Chen, Y.X. Dynamics of standing crop of N and P for fine roots of mixed forest of Cunninghamia lanceolata and Tsoongiodendron odorum. For. Res. 2002, 15, 575–581. [Google Scholar] [CrossRef]
- Chen, Y.Q.; Liu, Z.F.; Rao, X.Q.; Wang, X.L.; Liang, C.F.; Lin, Y.B.; Zhou, L.X.; Cai, X.A.; Fu, S.L. Carbon storage and allocation pattern in plant biomass among different forest plantation stands in Guangdong, China. Forests 2015, 6, 794–808. [Google Scholar] [CrossRef]
- Yu, Q.S.; Rao, X.Q.; Chu, C.J.; Liu, S.P.; Lin, Y.B.; Sun, D.; Tan, X.P.; Hanif, A.; Shen, W.J. Species dominance rather than species asynchrony determines the temporal stability of productivity in four subtropical forests along 30 years of restoration. For. Ecol. Manag. 2020, 457, 117687. [Google Scholar] [CrossRef]
- Chang, E.H.; Chen, T.H.; Tian, G.H.; Hsu, C.K.; Chiu, C.Y. Effect of 40 and 80 years of conifer regrowth on soil microbial activities and community structure in subtropical low mountain forests. Forests 2016, 7, 244. [Google Scholar] [CrossRef]
- Huang, Z.Q.; He, Z.M.; Wan, X.H.; Hu, Z.H.; Fan, S.H.; Yang, Y.S. Harvest residue management effects on tree growth and ecosystem carbon in a Chinese fir plantation in subtropical China. Plant Soil 2013, 364, 303–314. [Google Scholar] [CrossRef]
- Sun, Y.K.; Tang, J.M.; Wang, Y. Soil physical-chemical properties and comprehensive evaluation of Larix kaempferi plantations under different management models. J. Northeast For. Univ. 2022, 50, 70–75. [Google Scholar] [CrossRef]
- Chen, C.; Fang, X.; Xiang, W.H.; Lei, P.F.; Ouyang, S.; Kuzyalov, Y. Soil-plant co-stimulation during forest vegetation restoration in a subtropical area of southern China. For. Ecosyst. 2020, 7, 32. [Google Scholar] [CrossRef]
- Žifčáková, L.; Větrovský, T.; Howe, A.; Baldrian, P. Microbial activity in forest soil reflects the changes in ecosystem properties between summer and winter. Environ. Microbiol. 2016, 18, 288–301. [Google Scholar] [CrossRef]
- Camenzind, T.; Mason-Jones, K.; Mansour, I.; Rilling, M.C.; Lehmann, J. Formation of necromass-derived soil organic carbon determined by microbial death pathways. Nat. Geosci. 2023, 16, 115–122. [Google Scholar] [CrossRef]

Disclaimer/Publisher’s Note: The statements, opinions and data contained in all publications are solely those of the individual author(s) and contributor(s) and not of MDPI and/or the editor(s). MDPI and/or the editor(s) disclaim responsibility for any injury to people or property resulting from any ideas, methods, instructions or products referred to in the content. |
© 2025 by the authors. Licensee MDPI, Basel, Switzerland. This article is an open access article distributed under the terms and conditions of the Creative Commons Attribution (CC BY) license (https://creativecommons.org/licenses/by/4.0/).