Article

Spatiotemporal Trend and Influencing Factors of Surface Soil Moisture in Eurasian Drylands over the Past Four Decades

1
State Key Laboratory of Soil Erosion and Dryland Farming on the Loess Plateau, Institute of Soil and Water Conservation, Northwest A&F University, Yangling 712100, China
2
Shandong Provincial Key Laboratory of Water and Soil Conservation and Environmental Protection, College of Resources and Environment, Linyi University, Linyi 276000, China
3
Southern Marine Science and Engineering Guangdong Laboratory (Guangzhou), Guangzhou 511458, China
4
College of Natural Resources and Environment, Northwest A&F University, Yangling 712100, China
5
State Key Laboratory of Soil Erosion and Dryland Farming on the Loess Plateau, Northwest A&F University, Yangling 712100, China
*
Authors to whom correspondence should be addressed.
Forests 2025, 16(4), 589; https://doi.org/10.3390/f16040589
Submission received: 12 February 2025 / Revised: 22 March 2025 / Accepted: 26 March 2025 / Published: 28 March 2025
(This article belongs to the Special Issue Remote Sensing Approach for Early Detection of Forest Disturbance)

Abstract

:
Eurasian drylands are vital for the global climate and ecological balance. Quantifying spatiotemporal variations in surface soil moisture (SSM) is essential for monitoring water, energy, and carbon cycles. The suitability of recent global-scale surface soil moisture datasets for Eurasian arid and semi-arid regions has not been comprehensively evaluated. This study investigates spatiotemporal trends of five SSM products—MERRA-2, ESACCI, GLEAM, GLDAS, and ERA5—from 1980 to 2023. The performance of these products was evaluated using in situ station data and the three-cornered hat (TCH) method, followed by partial correlation analysis to assess the influence of environmental factors, including mean annual temperature (MAT), mean annual precipitation (MAP), potential evapotranspiration (PET), vapor pressure deficit (VPD), and leaf area index (LAI), on SSM from 1981 to 2018. The results showed consistent SSM patterns: higher values in India, the North China Plain, and Russia, and lower values in the Arabian Peninsula, the Iranian Plateau, and Central Asia. Regionally, MAT, PET, VPD, and LAI increased significantly (0.04 °C yr−1, 1.66 mm yr−1, 0.004 kPa yr−1, and 0.003 m2 m−2 yr−1, respectively; p < 0.05), while MAP rose non-significantly (0.29 mm yr−1). ERA5 exhibited the strongest correlation with in situ station data (R2 = 0.42), followed by GLEAM (0.37), ESACCI (0.28), MERRA2 (0.19), and GLDAS (0.17). Additionally, ERA5 showed the highest correlation (correlation = 0.72), while GLEAM had the lowest bias (0.03 m3 m−3) and ESACCI exhibited the lowest ubRMSE (0.03 m3 m−3). The three-cornered hat method identified ERA5 and GLDAS as having the lowest uncertainties (<0.03 m3 m−3), with ESACCI exceeding 0.05 m3 m−3 in northern regions. Across land cover types, cropland had the lowest uncertainty among the five SSM products, while forest had the highest. Partial correlation and dominant factor analysis identified MAP as the primary driver of SSM. This study comprehensively evaluated SSM products, highlighting their strengths and limitations. It underscored MAP’s crucial role in SSM dynamics and provided insights for improving SSM datasets and water resource management in drylands, with broader implications for understanding the hydrological impacts of climate change.

1. Introduction

Surface soil moisture (SSM) plays a crucial role in the global water cycle, influencing land–atmosphere energy exchange [1,2]. Large-scale and long-term SSM products are indispensable for drought monitoring, flood forecasting, climate change assessments, and cropland growth analysis [3,4,5]. Given the high spatial and temporal variability of SSM, comprehensive monitoring is necessary for understanding its patterns and improving water resource management.
Over the past decades, global SSM have been analyzed using satellite observations, model simulations, and reanalysis datasets, offering valuable insights into land surface hydrology and climate variability [6,7,8]. Among these, multi-satellite assimilated remote sensing datasets, such the European Space Agency Climate Change Initiative (ESACCI), provide long-term, high-resolution SSM records derived from various satellite sensors [9,10]. Additionally, simulated SSM datasets, such as the Global Land Data Assimilation System (GLDAS [11]) and the Global Land Evaporation Amsterdam Model (GLEAM [12,13]), integrate meteorological forcing data and land surface parameters to estimate soil moisture conditions. Meanwhile, reanalysis datasets, including the fifth-generation reanalysis of the European Reanalysis-Interim v5 (ERA5 [14]) and the Modern-Era Retrospective Analysis for Research and Applications Version 2 (MERRA-2 [15]), combine observational data with numerical weather prediction models to generate consistent, long-term SSM records. While remote sensing products offer high spatial coverage, they were limited to the surface layer (<5 cm) due to microwave penetration constraints [16]. In contrast, reanalysis and model-based datasets estimated deeper soil moisture (>100 cm) [17] but rely on parameterizations that introduce uncertainties. These grid-based products facilitated large-scale SSM analysis but were affected by model limitations, input data inaccuracies, and scaling issues [18,19]. In dry and semi-arid regions, the scarcity of field station data further amplified these uncertainties, posing challenges for high-precision modeling and data assimilation [16]. Consequently, evaluating the reliability of these products was essential for advancing model development and enhancing ecosystem monitoring.
Despite their potential, SSM products face challenges that require robust validation methods. Traditional verification relies on in situ station data [17,20], yet the high spatial and temporal resolution requirements of such measurements in drylands restrict their applicability for large-scale hydrometeorological studies [21]. As a complement, the triple collocation (TC) method provided an alternative by estimating dataset uncertainty without requiring in situ station data [22,23]. The TC method estimates the uncertainty of three observation sequences without requiring true values (in situ data). For situations involving more than three SSM datasets, which extended to the triple collocation (TCH) method, estimated dataset uncertainty without in situ measurements required more than three datasets and the provision of reference-independent assessments [18]. These approaches were widely applied to validate SSM [24], terrestrial water storage [25,26], precipitation [27], and evapotranspiration products [28], supporting research in data-scarce regions.
SSM regulated vegetation growth, carbon cycling, and land–atmosphere interactions, playing a key role in ecosystem functioning. Understanding its spatiotemporal variability and drivers was critical. Recent studies highlighted temperature, precipitation, and vegetation cover as primary influences on global SSM trends. For example, Deng, et al. [29] found that from 1979 to 2017, 65.1% of global drying trends were driven by rising temperatures, while 82% of wetting trends resulted from temperature, precipitation, and vegetation cover. Similarly, Liu and Yang [30] concluded that precipitation and evapotranspiration primarily influence multi-layer soil moisture changes, though their effects weaken with depth due to upper soil buffering. Jia, et al. [31] further demonstrated that afforestation significantly reduced deep soil water storage in the Loess Plateau. Additionally, vapor pressure deficit (VPD), an indicator of atmospheric aridity, accelerates SSM depletion by enhancing evapotranspiration, especially in arid conditions [32]. Despite these advances, critical gaps remain. The Eurasian drylands, the world’s largest arid and semi-arid region, faced increasing aridity and human pressures, yet long-term SSM trends and drivers in this region remained underexplored. Addressing these gaps was crucial for improving hydrological modeling, drought monitoring, and water resource management.
Despite advances in SSM evaluation methods, their application to the Eurasian drylands remained limited. These regions, home to millions, warmed at rates above the global average, exacerbating drought conditions. Large-scale, long-term SSM monitoring was essential, yet in situ data scarcity left the reliability of existing SSM products uncertain. To address this gap, the study aimed to (1) characterize the spatiotemporal dynamics of SSM and environmental factors in Eurasian drylands (1980–2023); (2) evaluate five SSM products using in situ station data and TCH methods; and (3) analyze SSM responses to environmental factors using partial correlation analysis.

2. Materials and Methods

2.1. Study Area

The Eurasian drylands is the largest arid zones globally [33]. Rising temperatures, combined with low and highly variable precipitation and elevated potential evapotranspiration, intensify water scarcity [34]. The topography of Eurasian drylands varies from extensive plains to plateaus and isolated mountain ranges, shaping local climatic conditions and water availability. The main vegetation cover types include forest, shrubland, grassland, cropland, sparse vegetation, and bareland (Figure 1a). The classification of Eurasian drylands is based on the standard aridity index (AI) [35,36], defined as <0.65 (Figure 1b) (https://figshare.com/articles/dataset/Global_Aridity_Index_and_Potential_Evapotranspiration_ET0_Climate_Database_v2/7504448/3?file=13901336) (accessed on 1 February 2025).

2.2. Dataset

2.2.1. In Situ SSM

In this study, the in situ station data are from the International Soil Moisture Network (ISMN, https://www.geo.tuwien.ac.at/insitu/data_viewer/#, accessed on 1 February 2025) spanning 1 April 1980 to 31 October 2023. The in situ station data were obtained from 261 in situ stations across 13 networks (Table 1). The quality flags in the ISMN dataset were utilized to identify and retain high-quality data points. To ensure reliable observations, only sites with at least one year of valid data during the growing season (April–October) were included. Remote sensing-based SSM products were limited to the surface layer (<5 cm) due to the shallow penetration depth of microwave signals, while reanalysis and model-based datasets estimated soil moisture at deeper layers (>100 cm). To enhance result robustness, the 0–5 cm depth was selected for the original site data [37]. The growing season data (1980–2023) were used to validate soil moisture products while minimizing snow and frozen soil influences [18,20,38]. The study period 1980–2023 was chosen as the study period for this study because this time period covers the longest records available in multiple datasets, ensuring a comprehensive trend analysis over four decades.

2.2.2. SSM Products

This study assessed the performance of five SSM products—ERA5, ESACCI, GLDAS, GLEAM, and MERRA-2—during the growing season in the Eurasian drylands. Only data classified as “good” in the respective datasets were utilized.
ERA5: The ERA5 reanalysis datasets, developed by the European Centre for Medium-Range Weather Forecasts (ECMWF), succeed those of the ERA-Interim reanalysis [39,40]. Spanning 1950 to the present, ERA5 provides SM data (m3m−3) at a spatial resolution of 0.1° and captures the first soil layer (0–7 cm) (http://climate.copernicus.eu/climate-reanalysis, accessed on 1 February 2025).
ESACCI: Produced under the ESA Program Climate Change Initiative CCI project (ESA CCI), the ESA CCI SM includes active, passive, and combined datasets products [41]. This study employed the combined ESA CCI v09.1 dataset, which covers the period from April 1980 to October 2023 with a spatial resolution of 0.25°. The top soil layer (2–5 cm) was analyzed (https://data.ceda.ac.uk/neodc/esacci/soil_moisture/data/daily_files/COMBINED/v09.1, accessed on 1 February 2025).
GLDAS: The Global Land Data Assimilation System (GLDAS) combines satellite and ground-based observations with land surface modeling and data assimilation techniques [11]. We utilized the GLDAS Noah SM datasets (versions 2.0: 1980–2000; 2.1: 2000–2023) at 0.25° resolution for the first layer (0–10 cm) (https://disc.gsfc.nasa.gov/datasets/, accessed on 1 February 2025).
GLEAM: The Global Land Evaporation Amsterdam Model (GLEAM), a collaborative effort between Vrije Universiteit Amsterdam and the European Space Agency (ESA), provides global estimates of terrestrial evaporation [42]. This research employed GLEAM version 4.1, covering the period from 1980 to 2023, with a spatial resolution of 0.25°, and concentrated on the surface layer.
MERRA2: The second Modern-Era Retrospective analysis for Research and Applications (MERRA-2) is an atmospheric reanalysis dataset from NASA, available since 1980 (https://disc.gsfc.nasa.gov/datasets/M2TMNXLND_5.12.4/summary?keywords=MERRA-2, accessed on 1 February 2025). The MERRA-2 SM dataset (April 1980–October 2023) has a resolution of 0.5° × 0.625°, capturing the surface layer [43].

2.2.3. Environmental Datasets

To investigate the primary environmental factors affecting SSM products over time series, mean annual temperature (MAT), VPD, potential evapotranspiration (PET), and mean annual precipitation (MAP)) were selected as Eurasian drylands impact factors. The Climate Research Unit (CRU 4.08) provides monthly datasets of hydrological and meteorological variables for the growing seasons from 1981 to 2018 [44], including temperature, precipitation, PET, maximum and minimum air temperatures (TEMmax and TEMmin), and actual vapor pressure (AVP) (https://crudata.uea.ac.uk/cru/data/hrg/cru_ts_4.08/, accessed on 1 February 2025).
The VPD was calculated:
V P D   =   0.5   ×   0.611 × exp 17.3 × T E M m i n T E M m i n + 237.3 + 0.611 × exp 17.3 × T E M m a x T E M m a x + 237.3 A V P
The GLASS LAI (v40) dataset provides 8-day vegetation dynamics from 1981 to 2018 (http://www.glass.umd.edu/Download.html, accessed on 1 February 2025). From 1981 to 1999, the dataset was derived from Advanced Very High Resolution Radiometer (AVHRR) reflectance with a spatial resolution of 0.05° [45]. Since 2000, the dataset has been based on moderate resolution imaging spectroradiometer (MODIS) products, with a spatial resolution of 1 km [46]. Previous studies in arid regions have verified the reliability of GLASS LAI data [47,48].
In this study, MAT, VPD, and LAI were calculated by averaging their corresponding monthly values (April to October) for all years from 1981 to 2018. MAP and PET were calculated by summing the monthly values (growing season: April to October) for each year. All environmental and SSM datasets were resampled to a 0.5° resolution using a bilinear interpolation algorithm.
The land cover data, with a spatial resolution of 300 m, were provided by the European Space Agency for the Global Climate Change Initiative (ESACCI) and are accessible at http://maps.elie.ucl.ac.be/CCI/viewer/download.php (accessed on 1 February 2025). The 2010 annual land cover product, obtained from ESA CCI, categorized areas into forest, shrubland, grassland, cropland, sparse vegetation, and bareland [49] (Figure 1a).

2.3. Methods

2.3.1. Evaluation Metrics

Four statistical metrics were employed to assess the accuracy of SSM: the Pearson correlation coefficient (R; Equation (2)), bias (m3/m3; Equation (3)), root mean square error (RMSE, m3/m3; Equation (4)), and unbiased root mean square error (ubRMSE, m3/m3; Equation (5)).
R = i = 1 n x i x ¯ y i y ¯ i = 1 n x i x ¯ 2 i = 1 n y i y ¯ 2
b i a s = i = 1 n x i y i n
R M S E = i = 1 n x i y i 2 n
u b R M S E = i = 1 n x i y i 2 i = 1 n x i y i 2 n
where x i and y i denote the SSM products and in situ station data, respectively, x ¯ and y ¯ are the average of the SSM products and in situ station data, respectively, and n is the total number of SSM products.
The Pearson correlation coefficient (R) quantifies the linear relationship between x i and y i [50]. The bias represents the mean deviation of simulations from observations, where a value close to zero denotes minimal bias, and positive or negative values approaching infinity indicate large deviations [51]. The RMSE reflects the overall estimation error relative to SSM observations, with smaller values signifying better accuracy [52]. The ubRMSE removes the mean signal, measuring the absolute difference between x i and y i after subtracting their mean values [53].

2.3.2. Three-Cornered Hat

The triple collocation (TCH) method estimates dataset uncertainty without in situ measurements, requiring >3 datasets and providing reference-independent assessments [54,55]. Here, TCH was applied to quantify annual uncertainties in each SSM dataset.
The TCH method are described as follows:
X i = X t r u e + ε i       i = 1,2 , N
where X i is the time series of the ith SSM product, X t r u e is the true value, ε i represents the error term, and N represents the number of SSM products. Since the true value cannot be obtained, any observation sequence is selected as the reference, and the difference between the remaining observation ( X i ) and the reference ( X R ) sequences is obtained [56].
Y i , M = X i X R = ϵ i ϵ R
where Y is an M × (N − 1) matrix, and M is the time samples.
σ i R 2 = σ ε R 2 + σ ε R 2 2 c o v ϵ i , ϵ R
Since the differences between any two products are independent, the covariance c o v ϵ i , ϵ R equals zero. The (N − 1) differences can be derived and organized into a matrix as follows:
Y = y 11 y 12 y 1 N 1 y 21 y N 2 1 y 2 N 1 y N 2 N 1 y N 1 1 y N 1 2 y N 1 N 1
The covariance matrix for the differences can be derived using the following equation:
S = c o v Y = S 11 S 12 S 1 N 1 S 21 S N 2 1 S 2 N 1 S N 2 N 1 S N 1 1 S N 1 2 S N 1 N 1
where S is an (N − 1) × (N − 1) covariance matrix of Y. The relationship between R0 and S is
S = J T R 0 J
where J can be represented as
J = 1 0 0 0 0 0 1 1 1 1 1
R 0 has N × (N + 1)/2 unknown elements; however, Equation (11) only gives N × (N − 1)/2 solution equations [57]. The function is as follows:
F r 1 N , r 2 N , r N N = 1 K 2   i < j N r i j 2 ; K = S N 1
G r 1 N , r 2 N , r N N = R 0 s · K < 0
where r 1 N , …, r N N are the elements of R 0 .
The initial conditions for the iteration are given as
r i N 0 = 0 ,   i < N ;   r N N 0 = 1 2 1 , 1 · S 1 · 1 , 1 T
After minimizing Equation (12) to determine the N free parameters, the square roots of the diagonal values of R 0 ( r 11 , r 22 ) represent the uncertainties of the evaluated SSM.

2.3.3. Partial Correlation Analysis

This study applied partial correlation analysis to assess the relationship between two variables while accounting for other influencing factors [58]. This technique has been widely adopted to explore the potential drivers of various target variables [59,60]. Prior to analysis, the ERA5 SSM, ESACCI SSM, GLDAS SSM, GLEAM SSM, MERRA2 SSM, MAT, MAP, PET, VPD, and LAI datasets were linearly detrended to remove long-term trends.

3. Results

3.1. Spatial and Temporal Patterns of SSM and Environmental Factors

Figure A1 illustrates the spatiotemporal characteristics of SSM across five SM products from 1980 to 2023. The annual averages showed a consistent spatial pattern: lower SSM in the Arabian Peninsula, the Iranian Plateau, Western Central Asia, the Qinghai–Tibet Plateau, the Mongolian Plateau, and the Loess Plateau, and higher SSM in India, the North China Plain, and Russia. ERA5 exhibited greater spatial variation in mean values than the other products. Figure A2a,c,e,g,i indicated that SSM is highest in forests, followed by cropland, grassland, shrubland, sparse vegetation, and bareland. Figure A2b,d,f,h,j showed a consistent trend across all products, where SSM decreases as aridity increases.
At the regional scale, except for ERA5, other SSM products demonstrated increasing trends during the growing seasons from 1980 to 2023, with rates of increase as follows: 3 × 10⁻⁴ (p < 0.01), 1 × 10⁻⁴ (p < 0.05), 2 × 10⁻⁵ (p > 0.05), and 1 × 10⁻⁴ (p > 0.05) (Figure A3). At the pixel scale, ERA5 and GLEAM indicated declining trends in 71.6% and 53.1% of the area, respectively, while over 33% of regions show significant increases (p < 0.05) (Figure 2). In contrast, ESACCI, GLDAS, and MERRA2 exhibited more significant SSM increases than decreases (24.9% > 7.7%, 26.4% > 17.1%, and 17.5% > 13.2%, respectively).
Figure A4 and Figure A5 illustrate the environmental factor changes at both regional and pixel scales across Eurasian drylands. At the regional scale, growing season trends (1981–2018) show significant increases in MAT (0.04 °C yr−1, p < 0.05), PET (1.66 mm yr−1), VPD (0.004 kPa yr−1, p < 0.05), and LAI (0.003 m2 m−2 yr−1) (Figure A4). Although MAP increases at 0.29 mm yr−1, this trend was not statistically significant (p > 0.05) (Figure A4b). At the pixel scale, over 90.0% of the Eurasian drylands exhibited significant increases in MAT, PET, VPD, and LAI during the growing seasons from 1981 to 2018 (p < 0.05). MAP increased slightly across 57.9% of the Eurasian drylands. PET and VPD trends diverge from MAT, with significant decreases in 81.9% and 77.1% of the area, respectively (Figure A5c,d). From 1981 to 2018, 32.2% of Eurasian drylands experienced a significant increase in LAI (Figure A5e), notably, in India and northern China, aligning with MAP increases.

3.2. In Situ Evaluation

Figure 3 illustrated the relationship between five SSM products and in situ station data. Among these, ERA5 exhibited the strongest correlation with in situ station data (R2 = 0.42), followed by GLEAM (0.37), ESACCI (0.28), MERRA2 (0.19), and GLDAS (0.17). ERA5 also captured long-term trends, with the highest average correlation (0.72), followed by ESACCI and GLDAS (0.61), MERRA2 (0.59), and GLEAM (0.54) (Figure 4a). GLEAM exhibited the lowest mean bias (0.03 m3 m−3), with ERA5, ESACCI, GLDAS, and MERRA2 showing biases of 0.10, 0.04, 0.04, and 0.05 m3 m−3, respectively (Figure 4b). The RMSE were 0.11, 0.07, 0.07, 0.07, and 0.08 m3 m−3 for ERA5, ESACCI, GLDAS, GLEAM, and MERRA2, respectively (Figure 4c). For ubRMSE, ESACCI had the lowest value (0.03 m3 m−3), while ERA5, GLDAS, GLEAM, and MERRA2 were around 0.04 m3 m−3 (Figure 4d). These results suggested that ERA5, ESACCI, and GLEAM outperform the others in characterizing SSM.

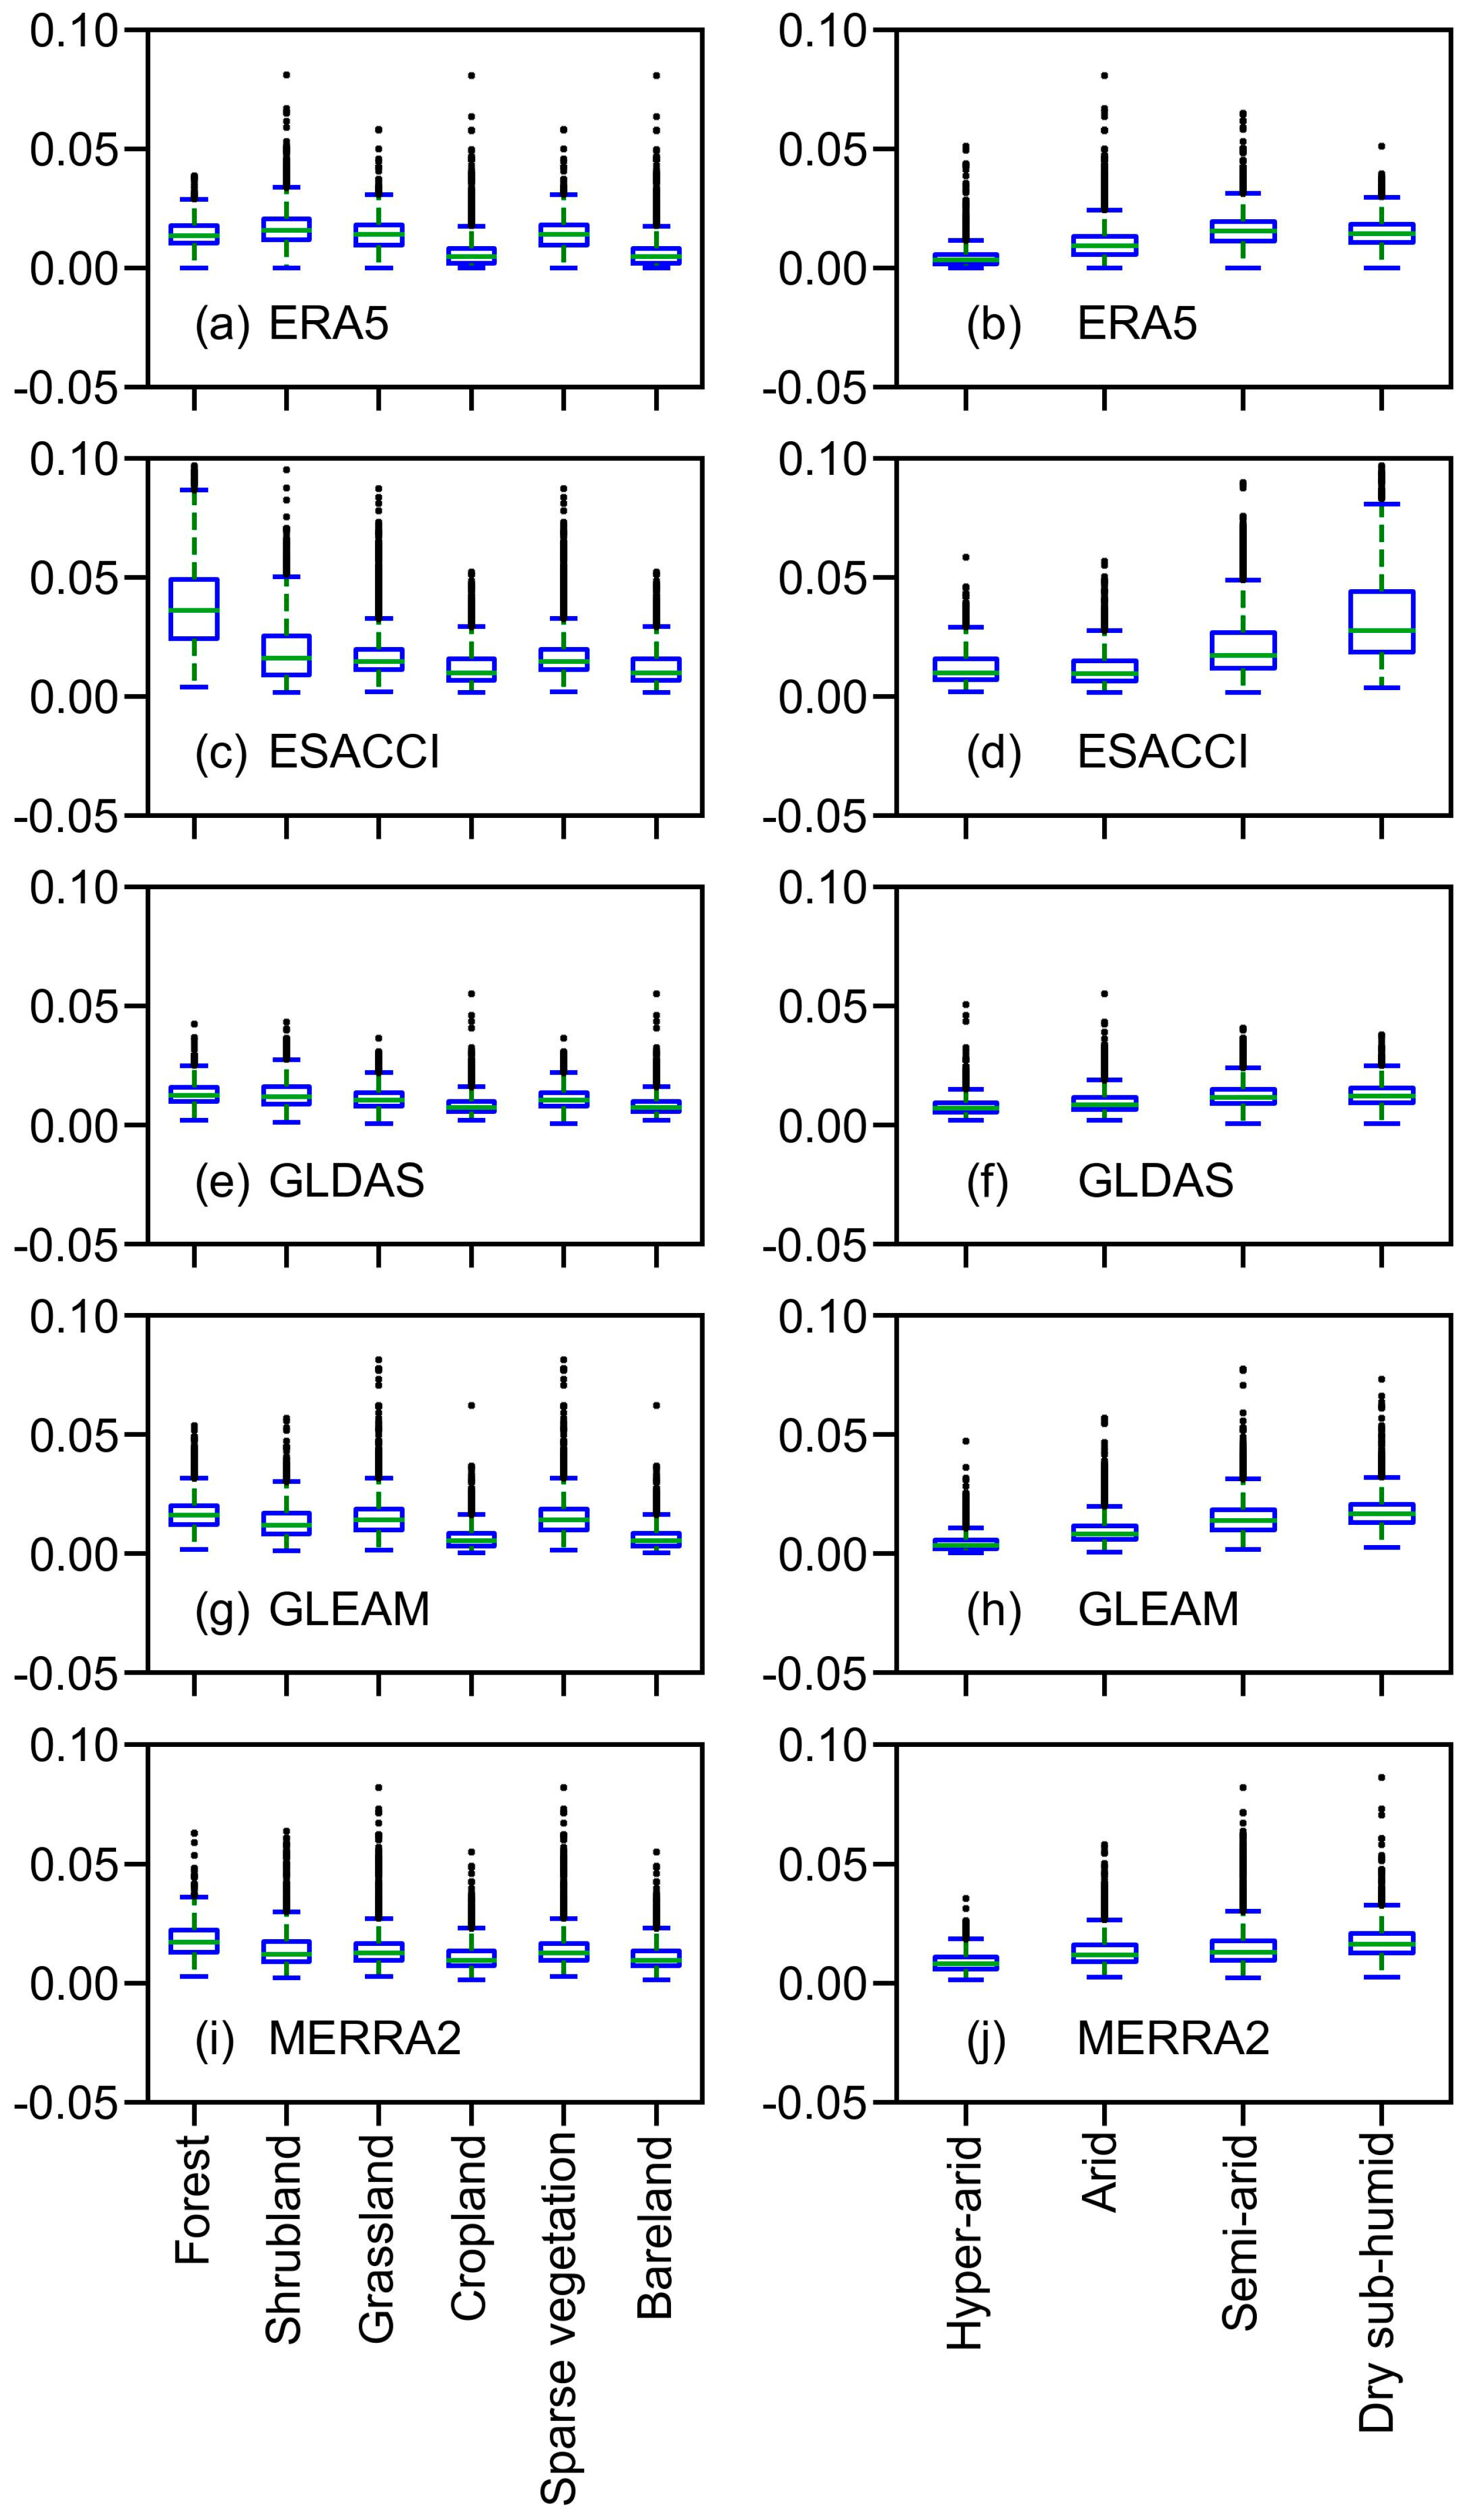
3.3. Three-Cornered Hat Assessment

The TCH method evaluated the uncertainties of five SSM products across Eurasian drylands during 1980–2023 (Figure 5). Most products displayed low uncertainties (<0.03 m3/m3), except ESACCI, which exceeded 0.05 m3/m3 in northern Central Asia, the Russian drylands, Mongolia, northern China, and the Qinghai–Tibet Plateau (Figure 5b). Among land cover types (Figure 6a,c,e,g,i), among the five SSM products evaluated, cropland showed the lowest uncertainty, while forest had the highest uncertainty. For aridity classes, uncertainties were minimal in hyper-arid regions (avg: 0.004–0.009 m3/m3), rising to maxima in dry sub-humid zones (Figure 6b,d,f,h,j). Overall, ERA5 and GLDAS demonstrated lower uncertainty for land cover and aridity classes than the other products.
Spatially, ERA5 and GLDAS covered the largest areas of lowest uncertainty (39.98% and 21.35%, respectively; Figure 7). ERA5 prevailed in the Arabian Peninsula, Iranian Plateau, southern Black Sea and Caspian Sea regions, and Qinghai–Tibet Plateau; ESACCI in western Central Asia; GLDAS in India and North China Plain; GLEAM in southern Arabia and eastern Mongolia; and MERRA2 in northern Kazakhstan and northeastern China. Similar results were observed for the land cover (Figure A6a) and aridity classes (Figure A6b). In terms of lowest uncertainty, ERA5 dominated across land cover types except for cropland. For cropland, GLDAS showed the least uncertainty. Across aridity classes, ERA5 covered the largest area with minimal uncertainty.

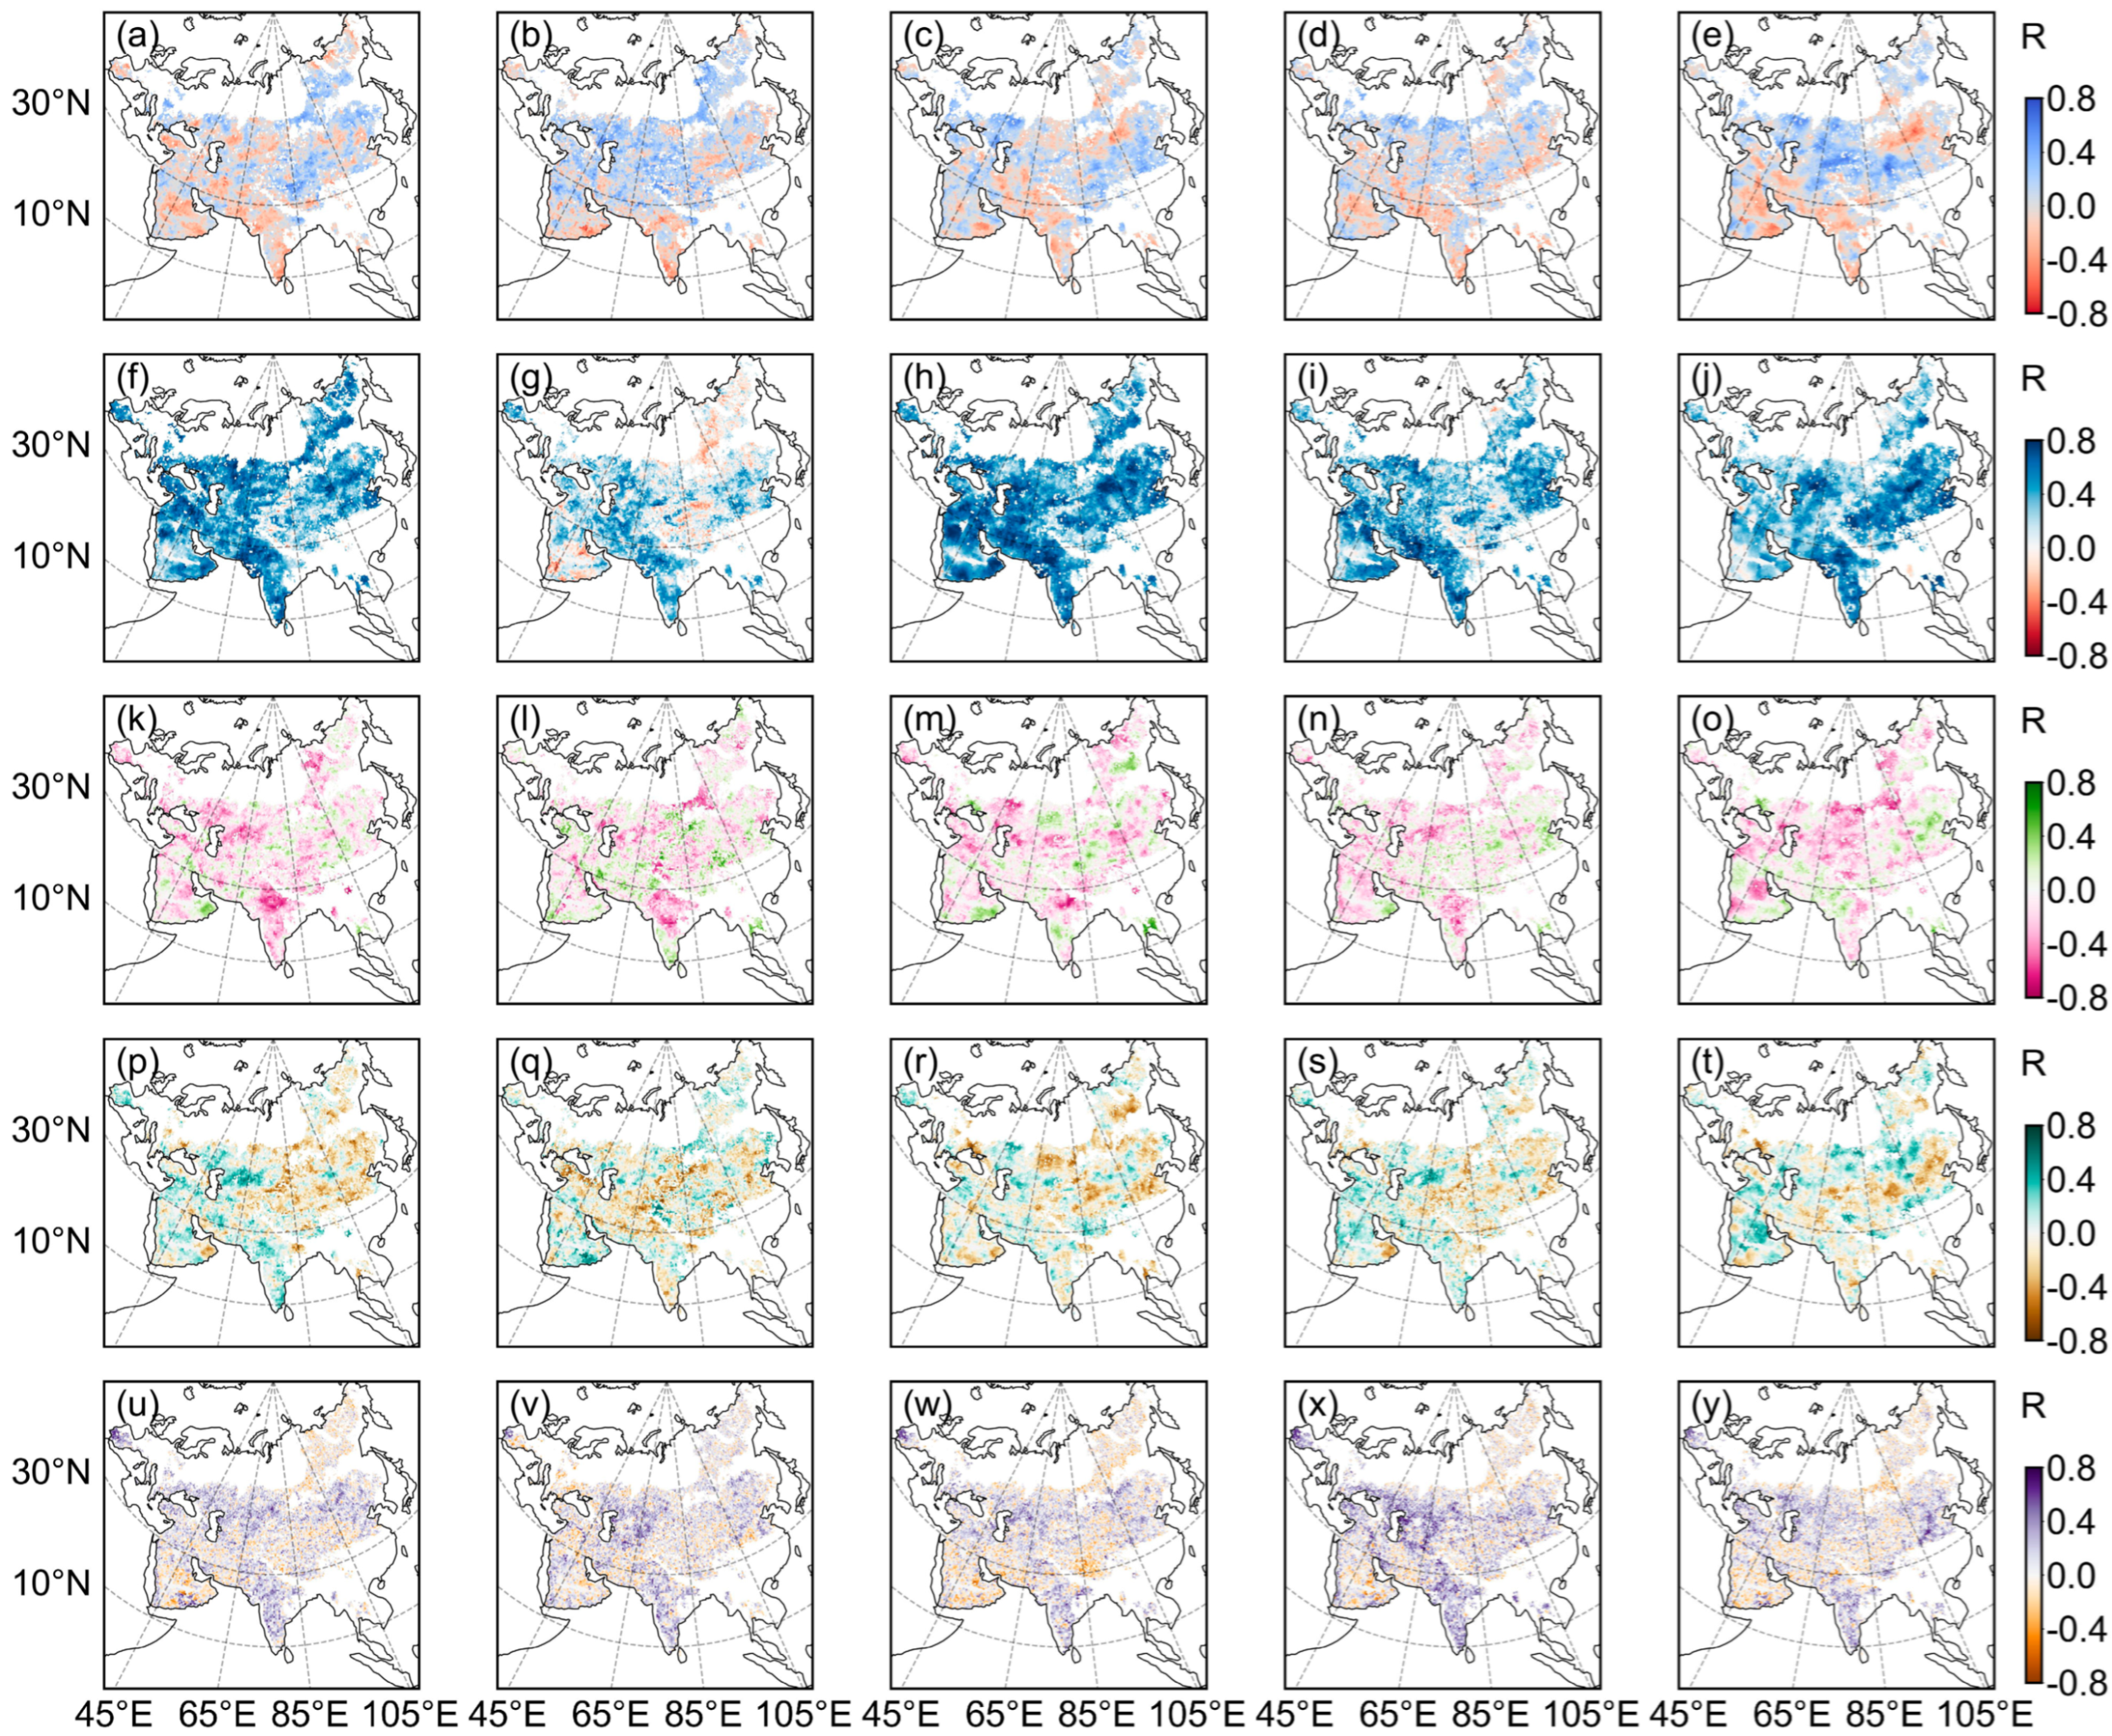
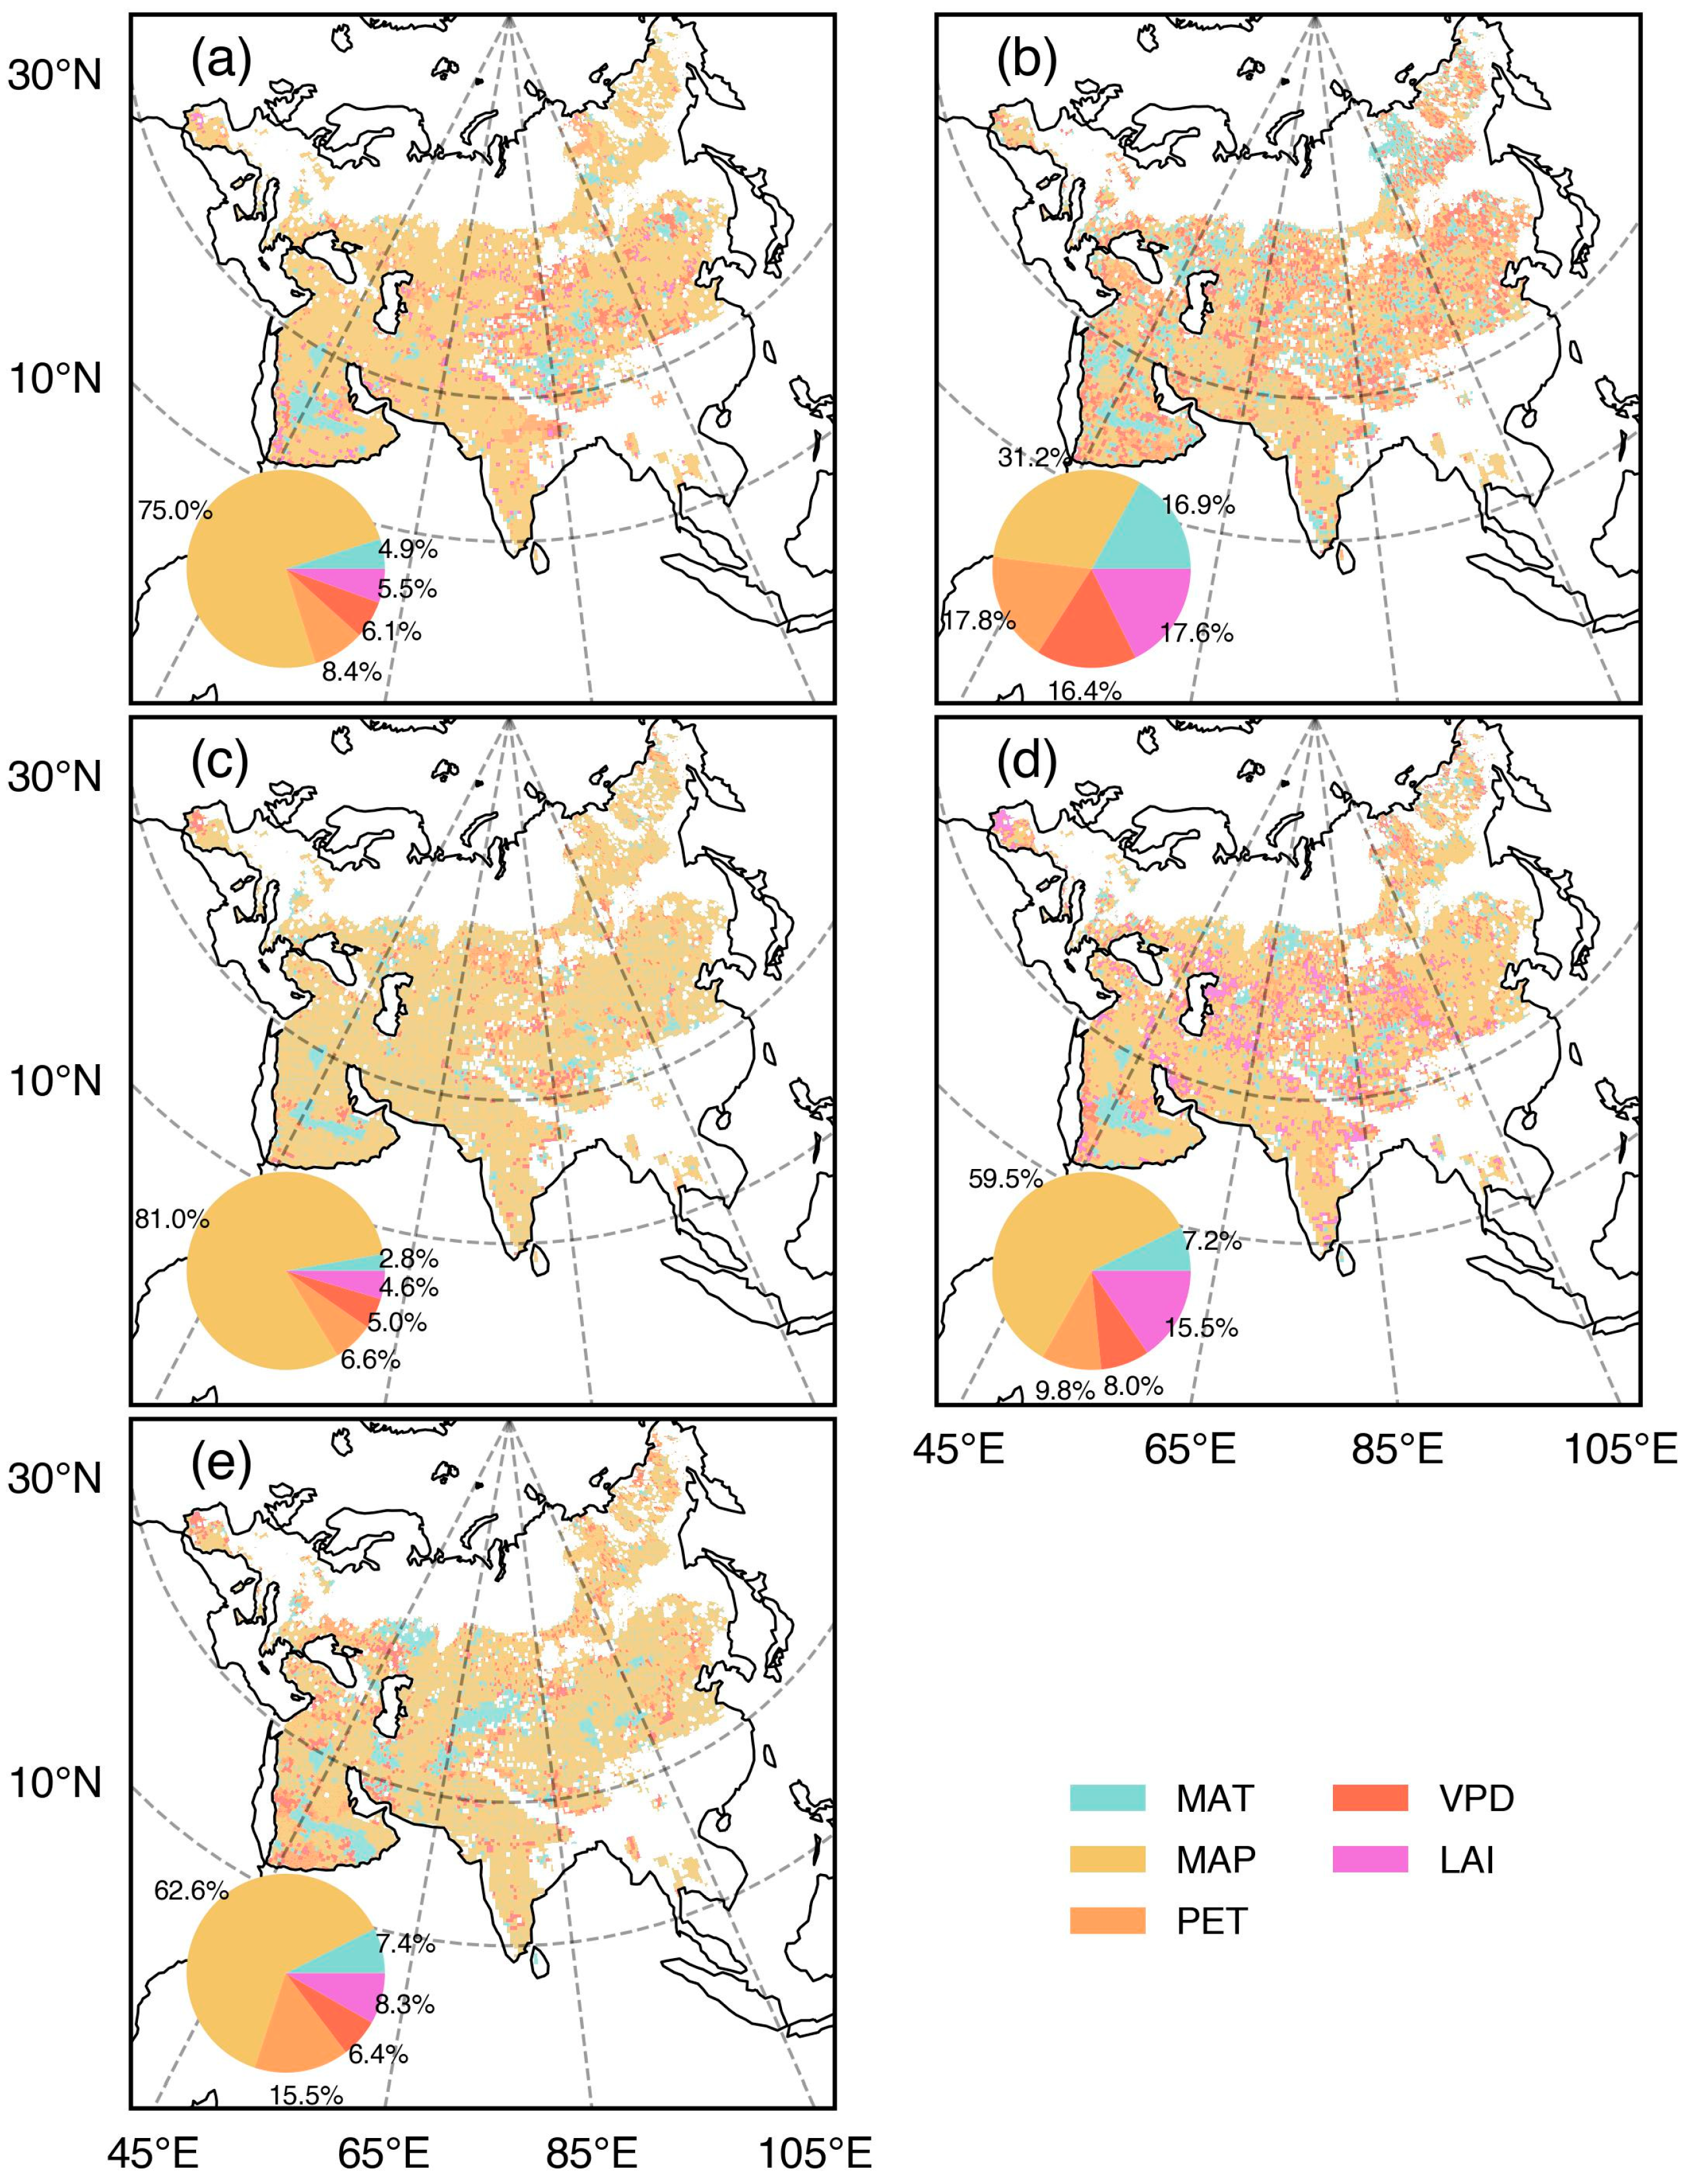
3.4. Response of SSM to Environmental Factors

Figure 8 showed the partial correlation analysis between detrended environmental factors (VPD, LAI, PET, MAT, and MAP) and detrended SSM products (ERA5, ESACCI, GLDAS, GLEAM, and MERRA2) (Figure A7). The results indicated that MAP exhibited the strongest correlation with SSM, with significant pixel percentages of 74.5% (ERA5), 23.1% (ESACCI), 81.7% (GLDAS), 57.2% (GLEAM), and 58.8% (MERRA2) (p < 0.05, Figure 8f–j). SSM correlations with MAT were mostly insignificant, with significant pixels accounting for 7.5% (ERA5), 13.0% (ESACCI), 7.4% (GLDAS), 6.9% (GLEAM), and 9.7% (MERRA2) (p < 0.05, Figure 8a–e). SSM was negatively correlated with PET, with significant negative correlations observed in 16.4% (ERA5), 13.3% (ESACCI), 13.8% (GLDAS), 11.1% (GLEAM), and 17.6% (MERRA2) of pixels (Figure 8k–o). VPD and SSM showed similar proportions of positive and negative correlations, which were mostly insignificant (Figure 8p–t). LAI showed significant positive correlations in 1.0% (ERA5), 11.2% (ESACCI), 10.1% (GLDAS), 17.4% (GLEAM), and 10.8% (MERRA2) of pixels (p < 0.05, Figure 8u–y).
The dominant environmental variables influencing SSM variability in the Eurasian drylands (1981–2018) were analyzed (Figure 9). The results showed consistent dominance patterns across the five SSM products. MAP was the primary driver of SSM variability, accounting for 75.0% (ERA5), 31.2% (ESACCI), 80.1% (GLDAS), 59.5% (GLEAM), and 62.6% (MERRA2). For ERA5 and GLDAS, MAT, PET, VPD, and LAI, each contributed less than 10%. In ESACCI, these variables had similar contributions, ranging from 16.4% to 17.8%. VPD had a stronger influence on GLEAM, while PET played a larger role in MERRA2. In forests, MAP was the primary driver for ERA5 (77.1%), GLDAS (80.5%), GLEAM (58.7%), and MERRA2 (56.5%), while MAT (24.3%) and PET (23.9%) dominated ESACCI (Table 2). Similarly, MAP governed SSM variations in hyper-arid, arid, and semi-arid regions. In dry sub-humid areas, MAT (24.4%) and PET (22.0%) were the main drivers for ESACCI (Table 2).

4. Discussion

4.1. Performance of SSM Products in Eurasian Drylands

The spatiotemporal analysis of SSM across Eurasian drylands from 1980 to 2023 using ERA5, ESACCI, GLDAS, GLEAM, and MERRA2 revealed distinct patterns. SSM was lower in the Arabian Peninsula, the Iranian Plateau, western Central Asia, the Tibetan Plateau, the Mongolian Plateau, and the Loess Plateau, and higher in India, the North China Plain, and Russia, consistent with Dorigo, et al. [41]. ERA5 exhibited greater spatial variability due to overestimated precipitation and underestimated temperatures [61,62], which enhanced infiltration and reduced evaporation, causing SSM overestimation [63]. Across land cover types, forests had the highest SSM, followed by cropland and grassland (Figure A2a,c,e,g,i). Forests, mainly in Russian drylands, benefited from higher temperatures and precipitation (Figure 1a and Figure A5). Croplands, concentrated in eastern China and India, had elevated SSM due to irrigation. All five products showed an inverse relationship between SSM and aridity, reaffirming the dominant role of water availability in soil moisture dynamics (Figure A2b,d,f,h,j). Regionally, ESACCI, GLDAS, GLEAM, and MERRA2 showed increasing SSM trends (Figure A3), aligning with Deng, et al. [29] and McColl, et al. [64], who linked global SSM increases to precipitation and vegetation shifts. ERA5, however, lacked this increase, suggesting biases noted by Jiao, et al. [61], and Sun, et al. [62], who identified the ERA5 tendency to overestimate precipitation, potentially masking broader trends. At the pixel scale, declining trends in ERA5 and GLEAM (71.6% and 53.1%; Figure 2) diverged from the significant increases in ESACCI (24.9%), GLDAS (26.4%), and MERRA2 (17.5%) (Figure 2), adding granularity to the Dorigo, et al. [41] global SSM patterns. This multi-product study improved the understanding of SSM variability and dryland dynamics, emphasizing spatial heterogeneity and product reliability [29].
Evaluation with in situ data clarified product performance. ERA5 had the highest correlation with in situ observations (R2 = 0.42, average correlation = 0.72), aligning with Hersbach, et al. [39], highlighting its reliability in trend detection. GLEAM showed the lowest bias (0.03 m3 m−3), indicating high precision in local measurements, while ESA CCI had the lowest unbiased RMSE (0.03 m3 m−3), demonstrating its strength in capturing variability [65,66]. The limited availability of in situ data in Eurasian drylands posed challenges for validation. However, TCH-based evaluations effectively complemented these observations, reinforcing the robustness of the results [17]. Most products exhibited low uncertainties (<0.03 m3 m−3), confirming the effectiveness of TCH in uncertainty assessment. ERA5 and GLDAS showed extensive low uncertainty (39.98% and 21.35%, respectively) and were supported Hersbach, et al. [39], confirming their reliability. In contrast, ESA CCI displayed higher uncertainty (>0.05 m3 m−3) in northern Central Asia and the Qinghai–Tibet Plateau, likely due to complex topography and sparse in situ data [16].
SSM product performance varied across land cover types and aridity gradients. Forests were identified as the land cover with the highest uncertainty due to complex biophysical factors and remote sensing limitations. On the one hand, dense canopies attenuate microwave signals, introducing noise that hinders accuracy, especially with vegetation water content variations [67,68]. On the other hand, soil heterogeneity, driven by roots, organic litter, and topography, further complicates retrievals at coarse resolutions, as satellite footprints poorly capture forest microscale dynamics [16,69]. Additionally, the aridity gradient (0.004–0.009 m3 m−3 from hyper-arid to dry sub-humid zones) reflected the expected moisture–aridity relationship, reinforcing the influence of climatic conditions on soil moisture variability [70]. These findings highlight the need for tailored product selection based on study objectives, land cover, and climate conditions.

4.2. SSM Dynamic and Relationship to Environmental Factors

This study examined the response of SSM to environmental factors (VPD, LAI, PET, MAT, and MAP) across Eurasian drylands from 1981 to 2018, using partial correlation and dominance analyses on five SSM products (ERA5, ESACCI, GLDAS, GLEAM, and MERRA2) [71,72]. MAP consistently emerged as the primary driver of SSM variability, with significant positive correlations in 74.5% (ERA5), 23.1% (ESACCI), 81.7% (GLDAS), 57.2% (GLEAM), and 58.8% (MERRA2) of pixels (p < 0.05), and dominance contributions of 75.0% (ERA5), 31.2% (ESACCI), 80.1% (GLDAS), 59.5% (GLEAM), and 62.6% (MERRA2) [59]. This supported findings by Nicolai-Shaw, et al. [73], who identified precipitation as the leading global control on soil moisture in arid regions, and Luo, et al. [74], who reported its dominance in Inner Mongolian steppes. This work advanced these insights by quantifying MAP’s pervasive influence across products and ecosystems, notably, in forests (77.1% for ERA5, 80.5% for GLDAS) and hyper-arid to semi-arid zones. High-SSM regions like India and eastern China exhibited robust MAP-SSM correlations, where moist soils with high retention and permeability enhanced precipitation conversion into SSM [75,76]. This contribution, supported by soil property studies like those of Saxton and Rawls [77], underscored the amplifying role of edaphic factors, offering a refined lens on precipitation impact in water-limited systems. In contrast, MAT had limited influence, with significant positive correlations in only 7.5% (ERA5), 13.0% (ESACCI), 7.4% (GLDAS), 6.9% (GLEAM), and 9.7% (MERRA2) of pixels, and contributions below 10% for ERA5 and GLDAS. Positive MAT-SSM correlations were mainly in the Qinghai–Tibet Plateau and Russian drylands, likely due to snow and ice melting in high-altitude or high-latitude areas, increasing SSM [29,78].
Furthermore, VPD increases led to enhanced transpiration, as plants released more water through stomata, increasing root water uptake and reducing SSM. Lower VPD slowed transpiration, decreasing soil water demand and allowing SSM to stabilize or recover with precipitation. Despite the clear VPD–SSM relationship, MAP showed a stronger influence on SSM [79]. In arid regions, precipitation dominated soil moisture dynamics, outweighing VPD transpiration effects. Studies confirmed precipitation as the primary driver in water-limited ecosystems [59], with VPD amplifying short-term water loss [79].

4.3. Limitations and Perspectives

In this study, we evaluated five SSM products (ERA5, ESACCI, GLDAS, GLEAM, and MERRA2) using in situ station data and the TCH method [70,80]. However, several uncertainties remain. First, while in situ data were widely used for SSM evaluation [65,81], they contained representativeness errors due to measurement inaccuracies, topography [17,78], vegetation, and climate [20,82]. Second, anthropogenic influences, notably, irrigation and land-use change, played a critical role in shaping SSM patterns. Previous studies have quantified these effects in drylands. For instance, Leng, et al. [83] demonstrated that irrigation-dependent regions faced either surface water depletion or groundwater depletion. Gu, et al. [84] found that anthropogenic greenhouse gas forcing reduced global soil moisture by 2.1 × 10⁻³ m3 m−3, which was comparable to the drought trend observed in GLDAS-2 over the past 58 years (2.4 × 10⁻³ m3 m−3). These factors were not explicitly resolved within the SSM products, highlighting the need to include anthropogenic data in future studies. Finally, this study identified MAT, MAP, PET, VPD, and LAI as key SSM drivers but did not consider other factors, such as radio frequency interference (RFI). RFI typically caused remote sensing instruments to receive radio signals from non-target sources, interfering with signal interpretation and compromising soil moisture measurements [17,85].

5. Conclusions

This study evaluated five SSM products from reanalysis datasets, satellite observations, and model simulations over the Eurasian drylands (1980–2023), integrating in situ data, error metrics, and uncertainty assessments to analyze spatiotemporal patterns, product reliability, and environmental drivers of SSM dynamics. Several conclusions can be drawn from the present results:
(i)
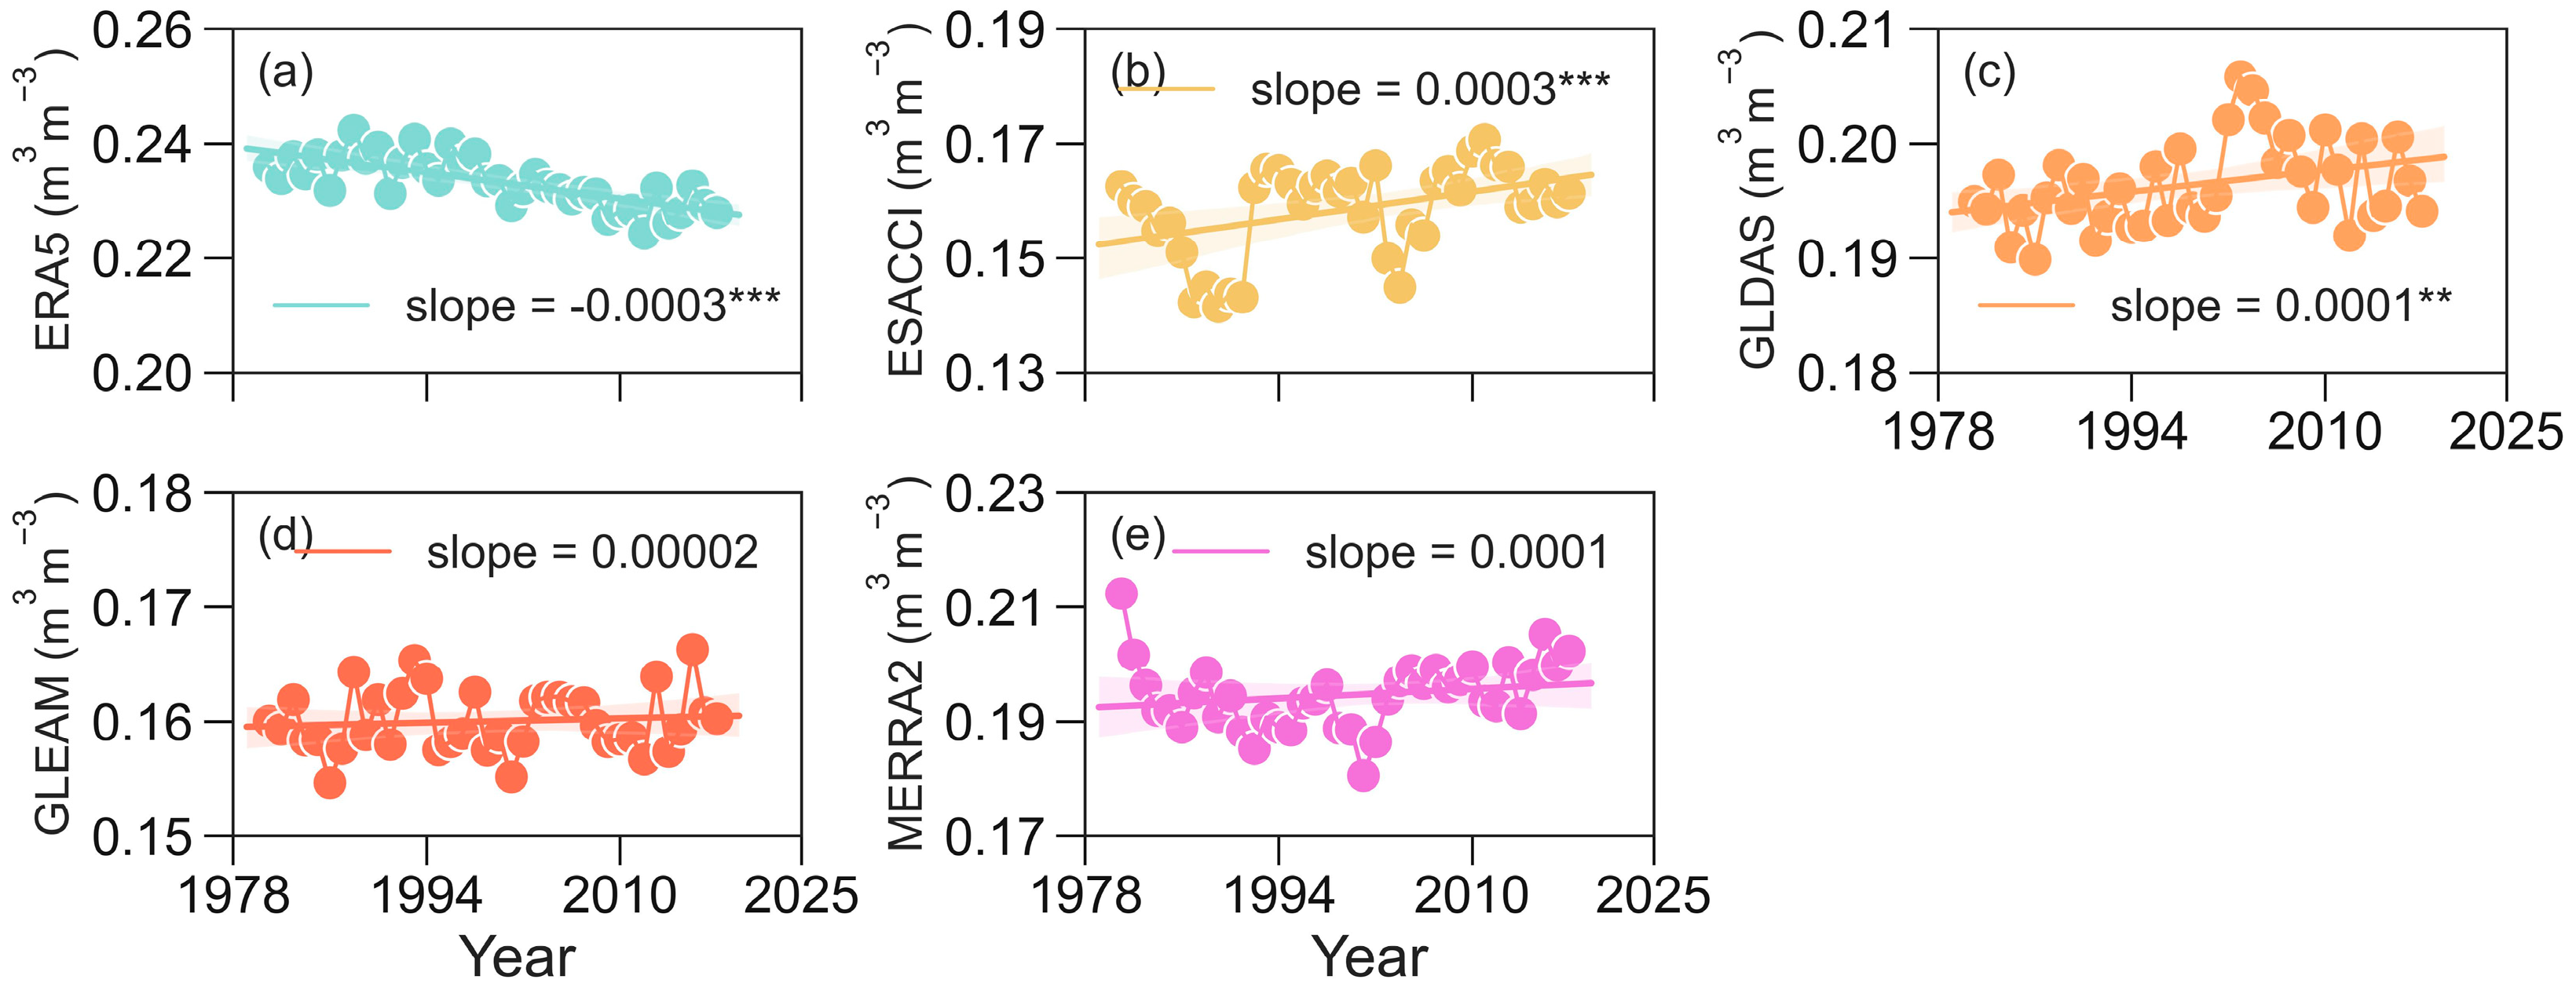
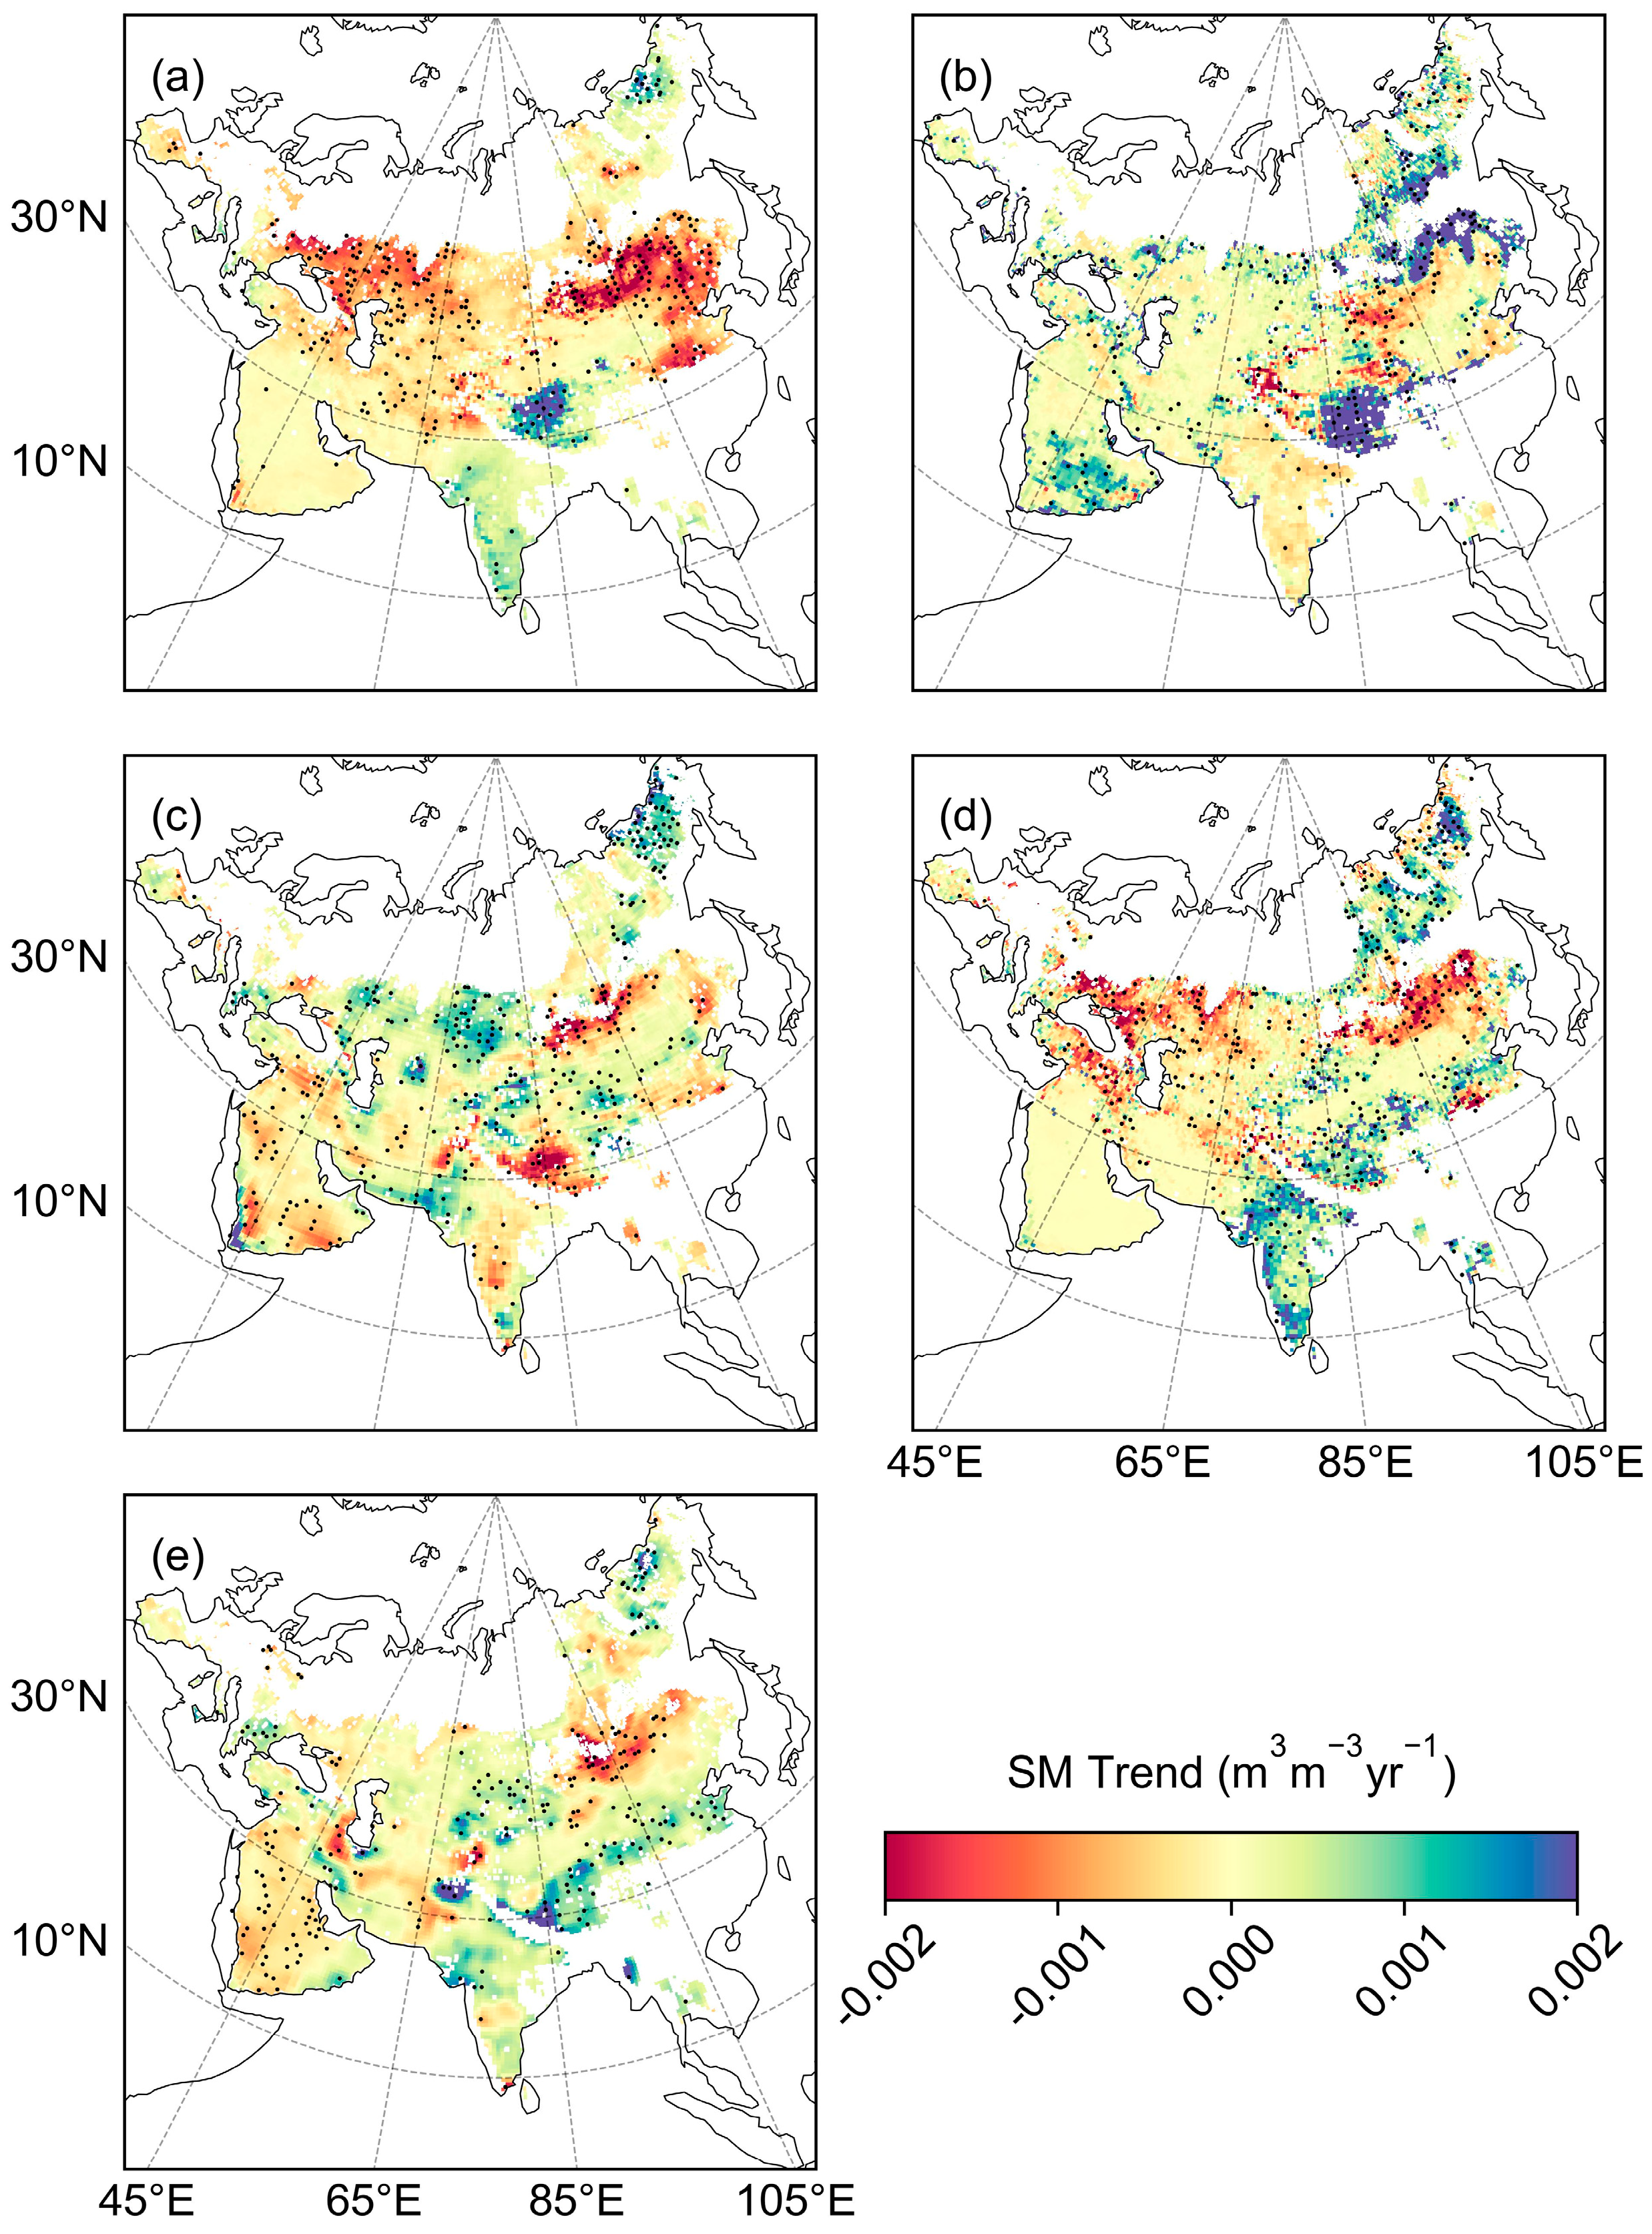
ERA5 exhibited the greatest spatial variability among the products. Annual average SSM was consistently higher in India, the North China Plain, and Russia, and lower in the Arabian Peninsula, the Iranian Plateau, Western Central Asia, the Qinghai–Tibet Plateau, the Mongolian Plateau, and the Loess Plateau. SSM was highest in forests, followed by cropland and grassland. Across aridity classes, SSM consistently decreased with increasing aridity. Regionally, all products except ERA5 showed increasing trends in growing-season SSM, with ESACCI and GLDAS exhibiting the most significant increases. At the pixel scale, ERA5 and GLEAM indicated widespread decreases, while ESACCI, GLDAS, and MERRA2 displayed more areas of significant increases than those of decreases, underscoring the importance of multi-product analyses in dryland studies.
(ii)
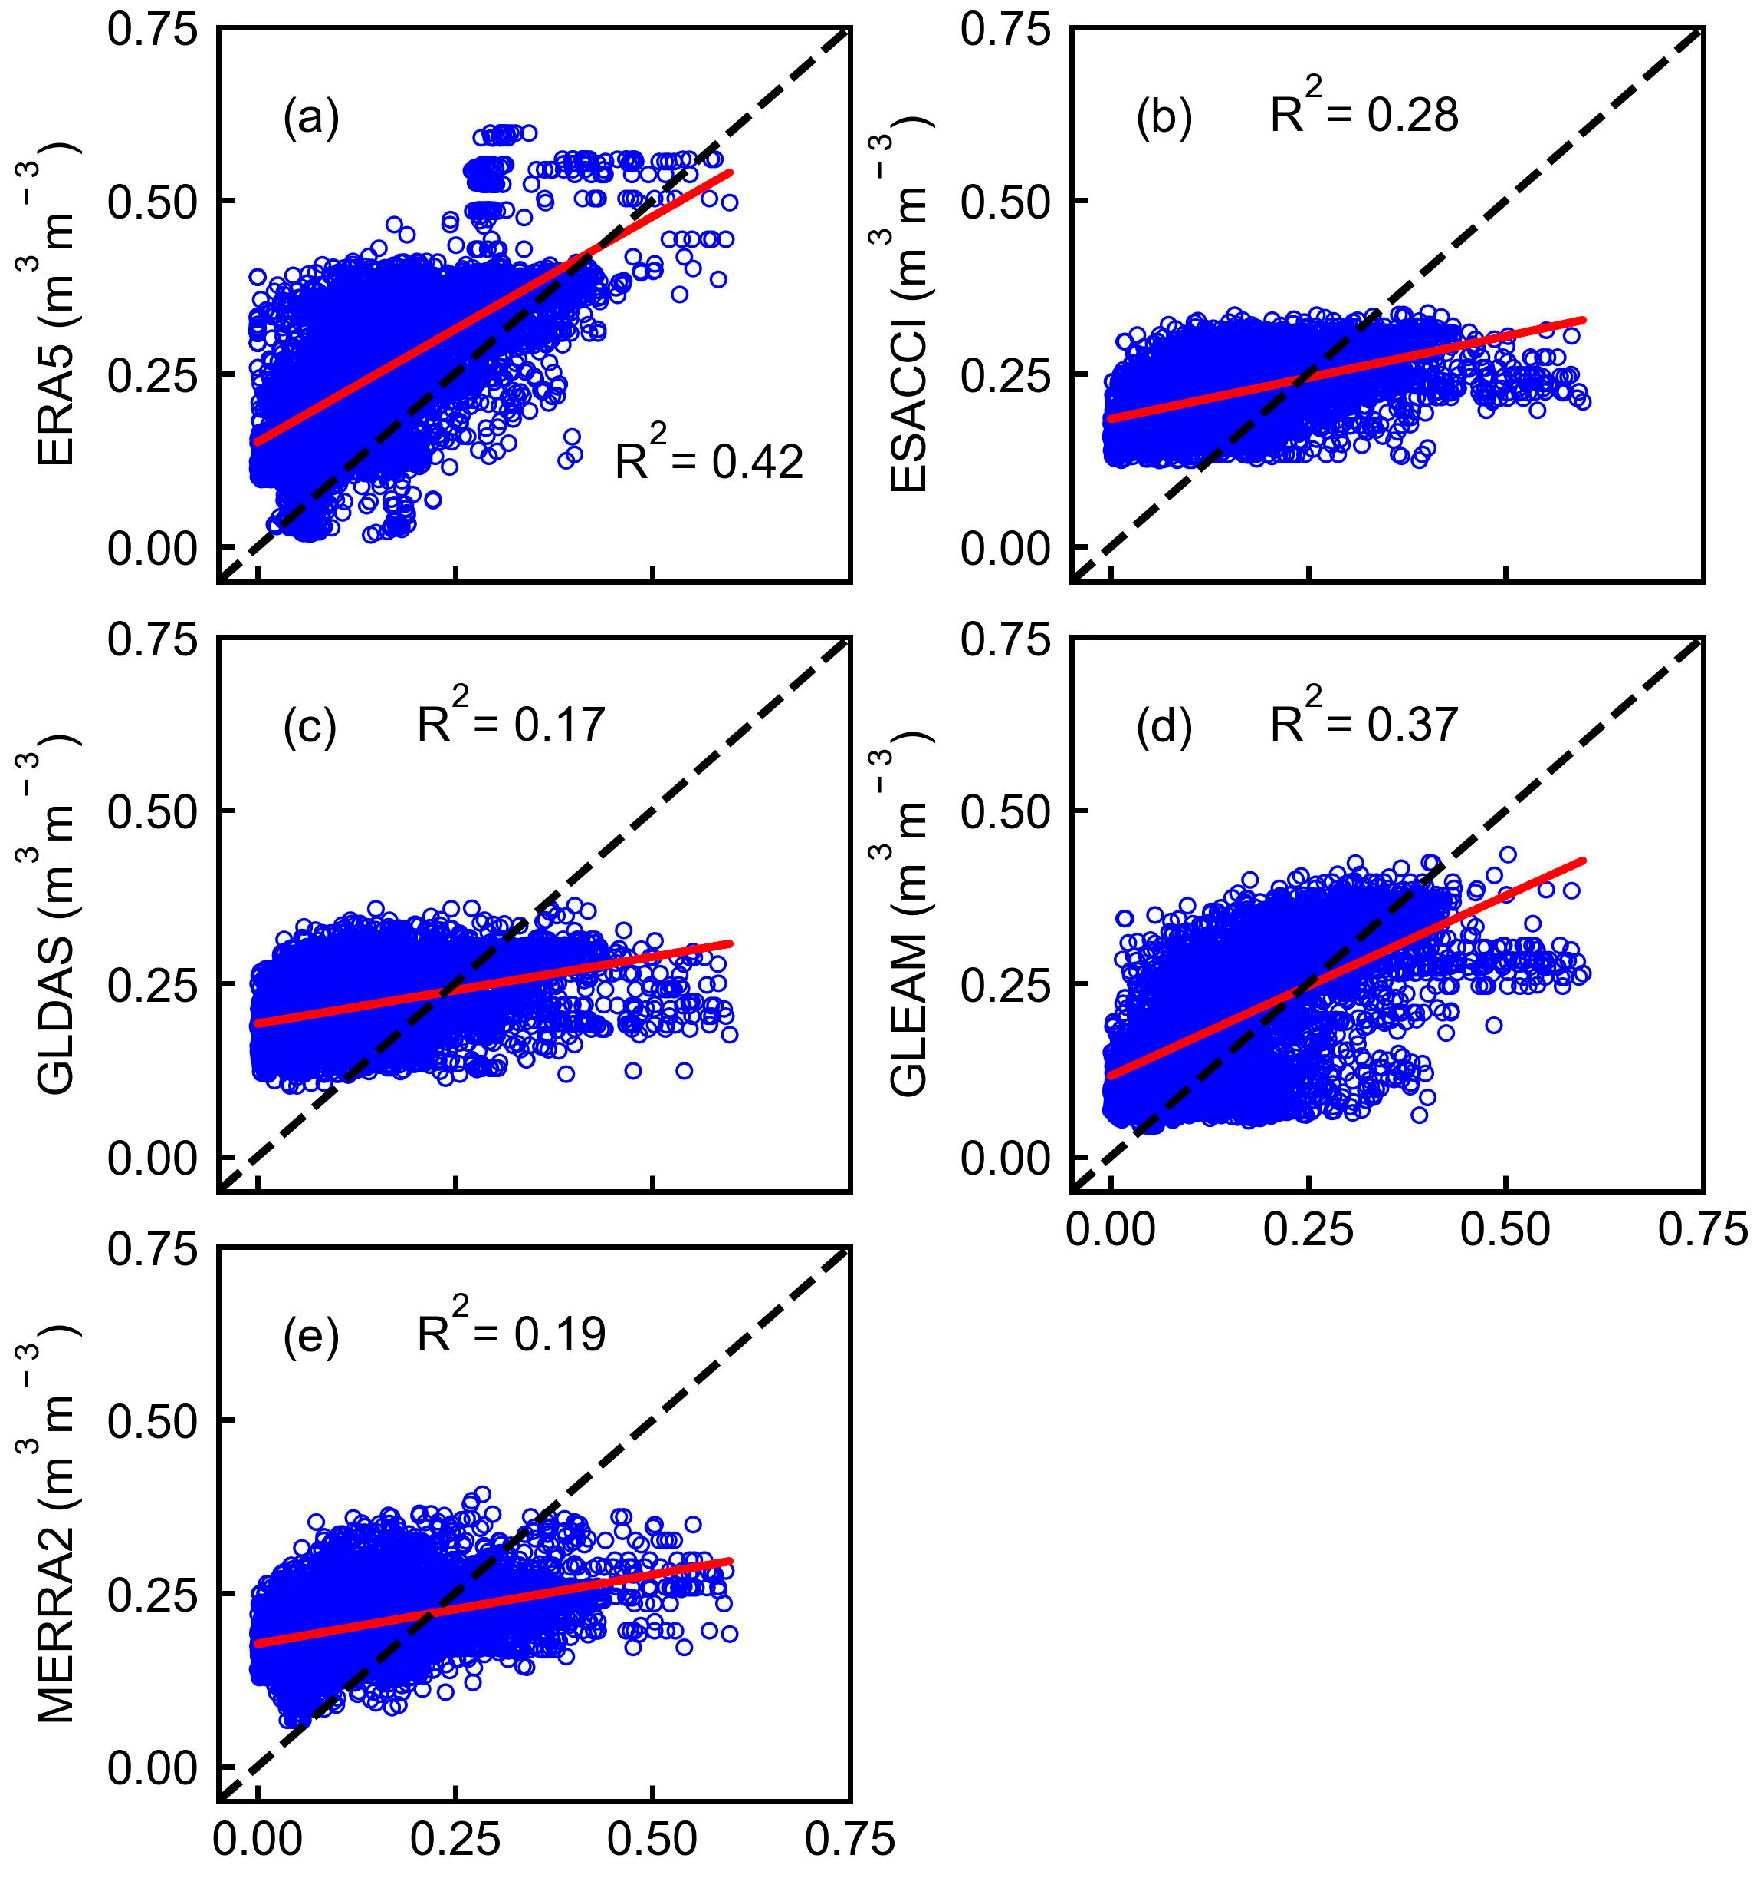
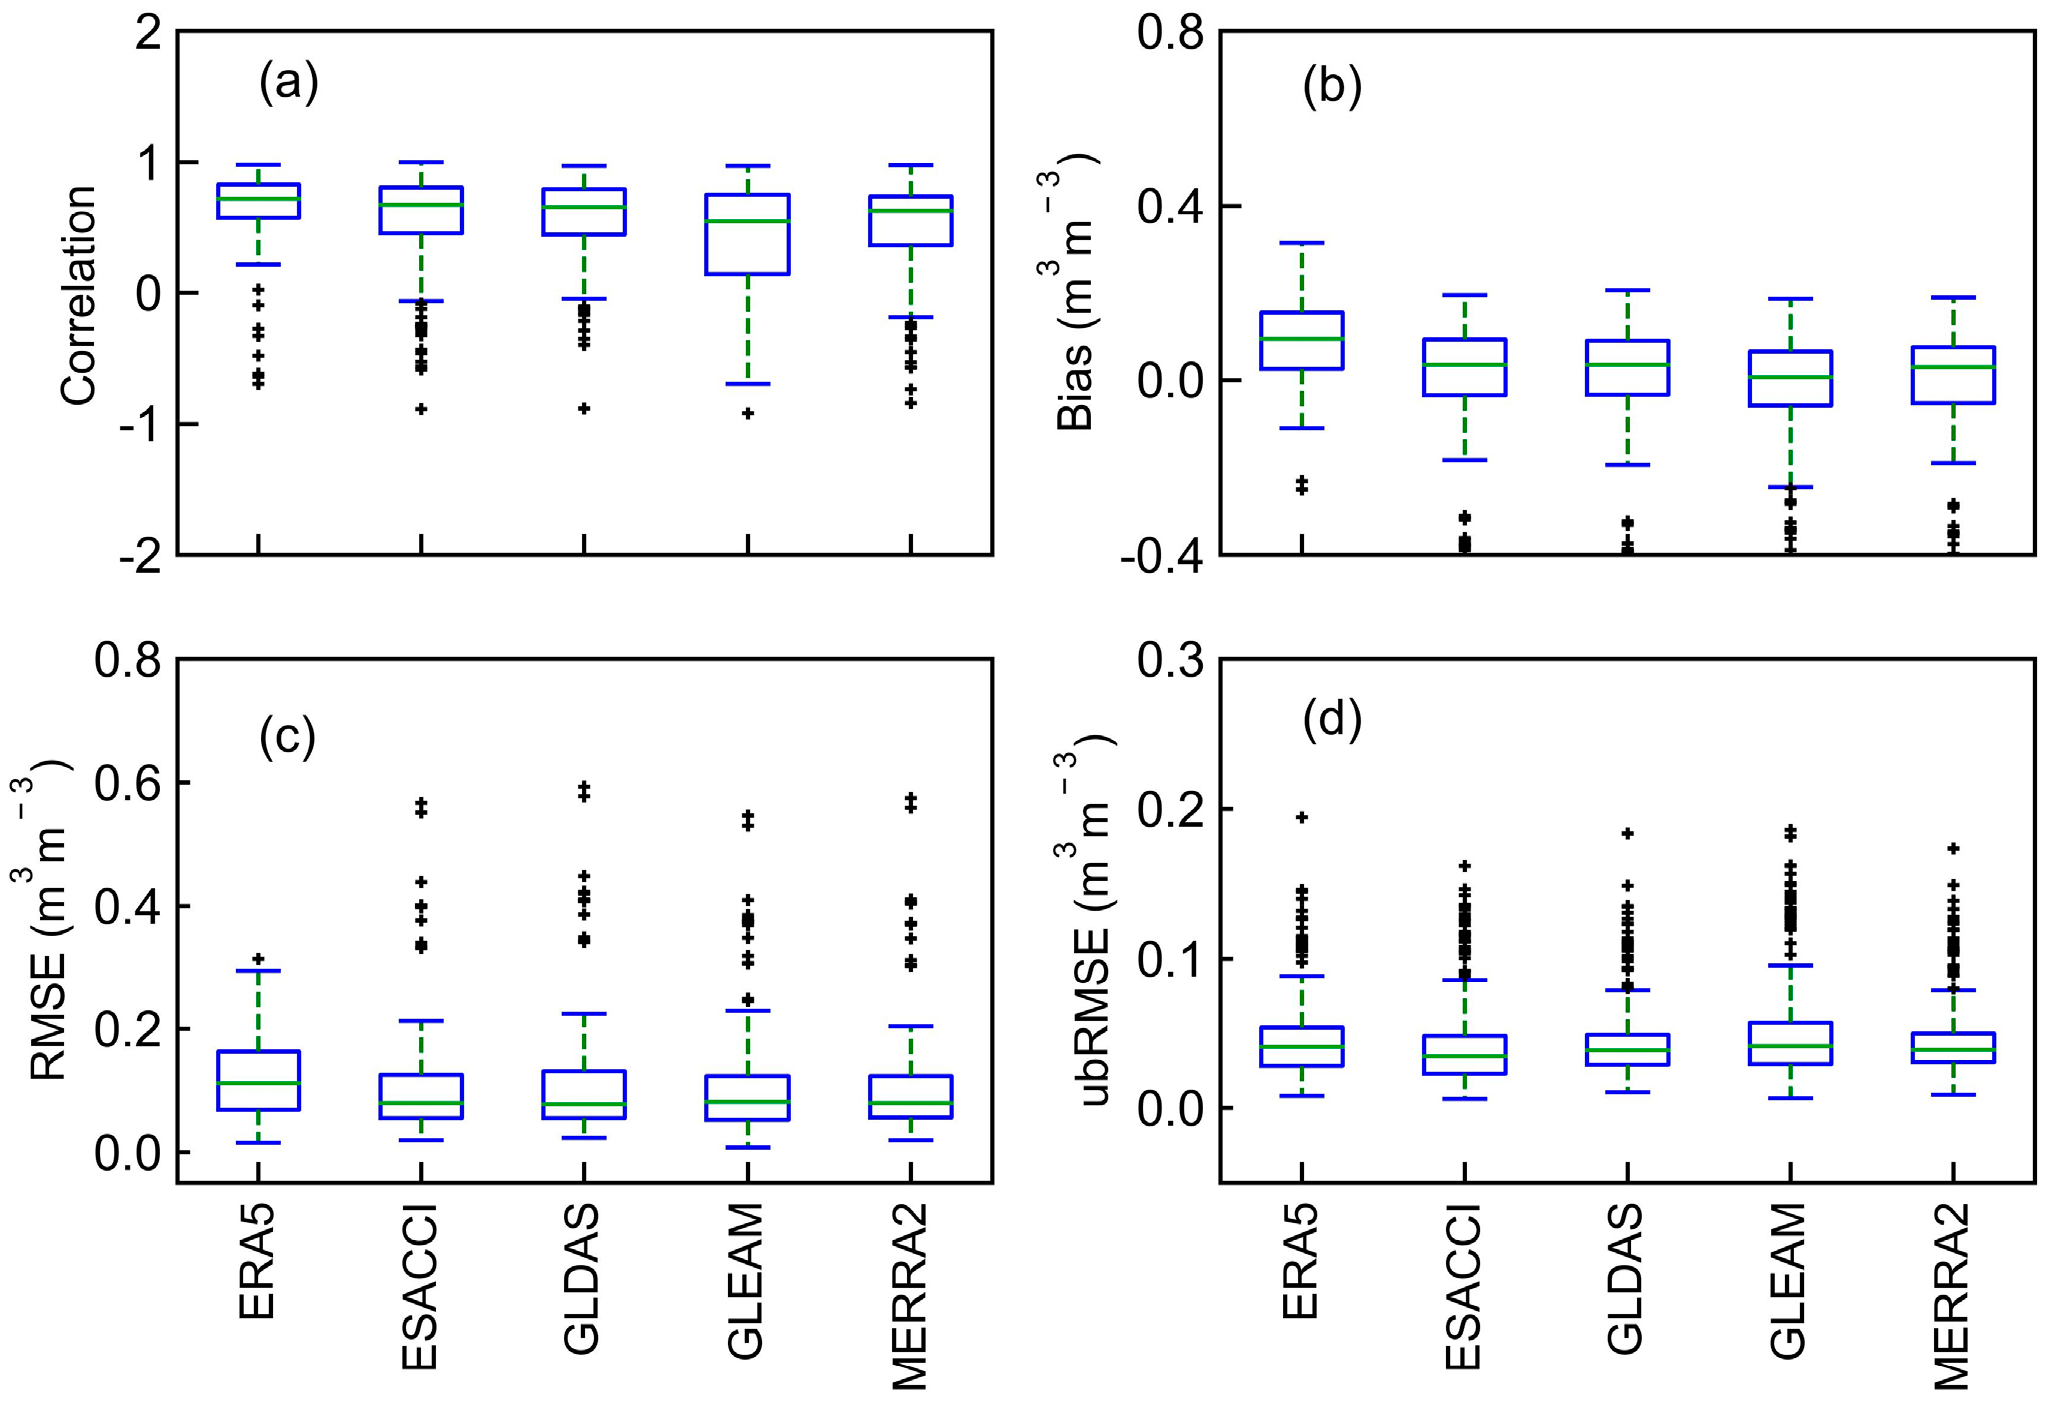
ERA5 had the highest correlation with in situ data (R2 = 0.42, mean correlation = 0.72), while GLEAM had the lowest bias (0.03 m3m−3). ESACCI and GLEAM exhibited the best error metrics, with ESACCI achieving the lowest ubRMSE (0.03 m3m−3). TCH analysis indicated generally low uncertainty, though ESACCI showed higher uncertainty in northern Central Asia, the Qinghai–Tibet Plateau, and Russian drylands. ERA5 and GLDAS were the most reliable across land cover types and aridity classes.
(iii)
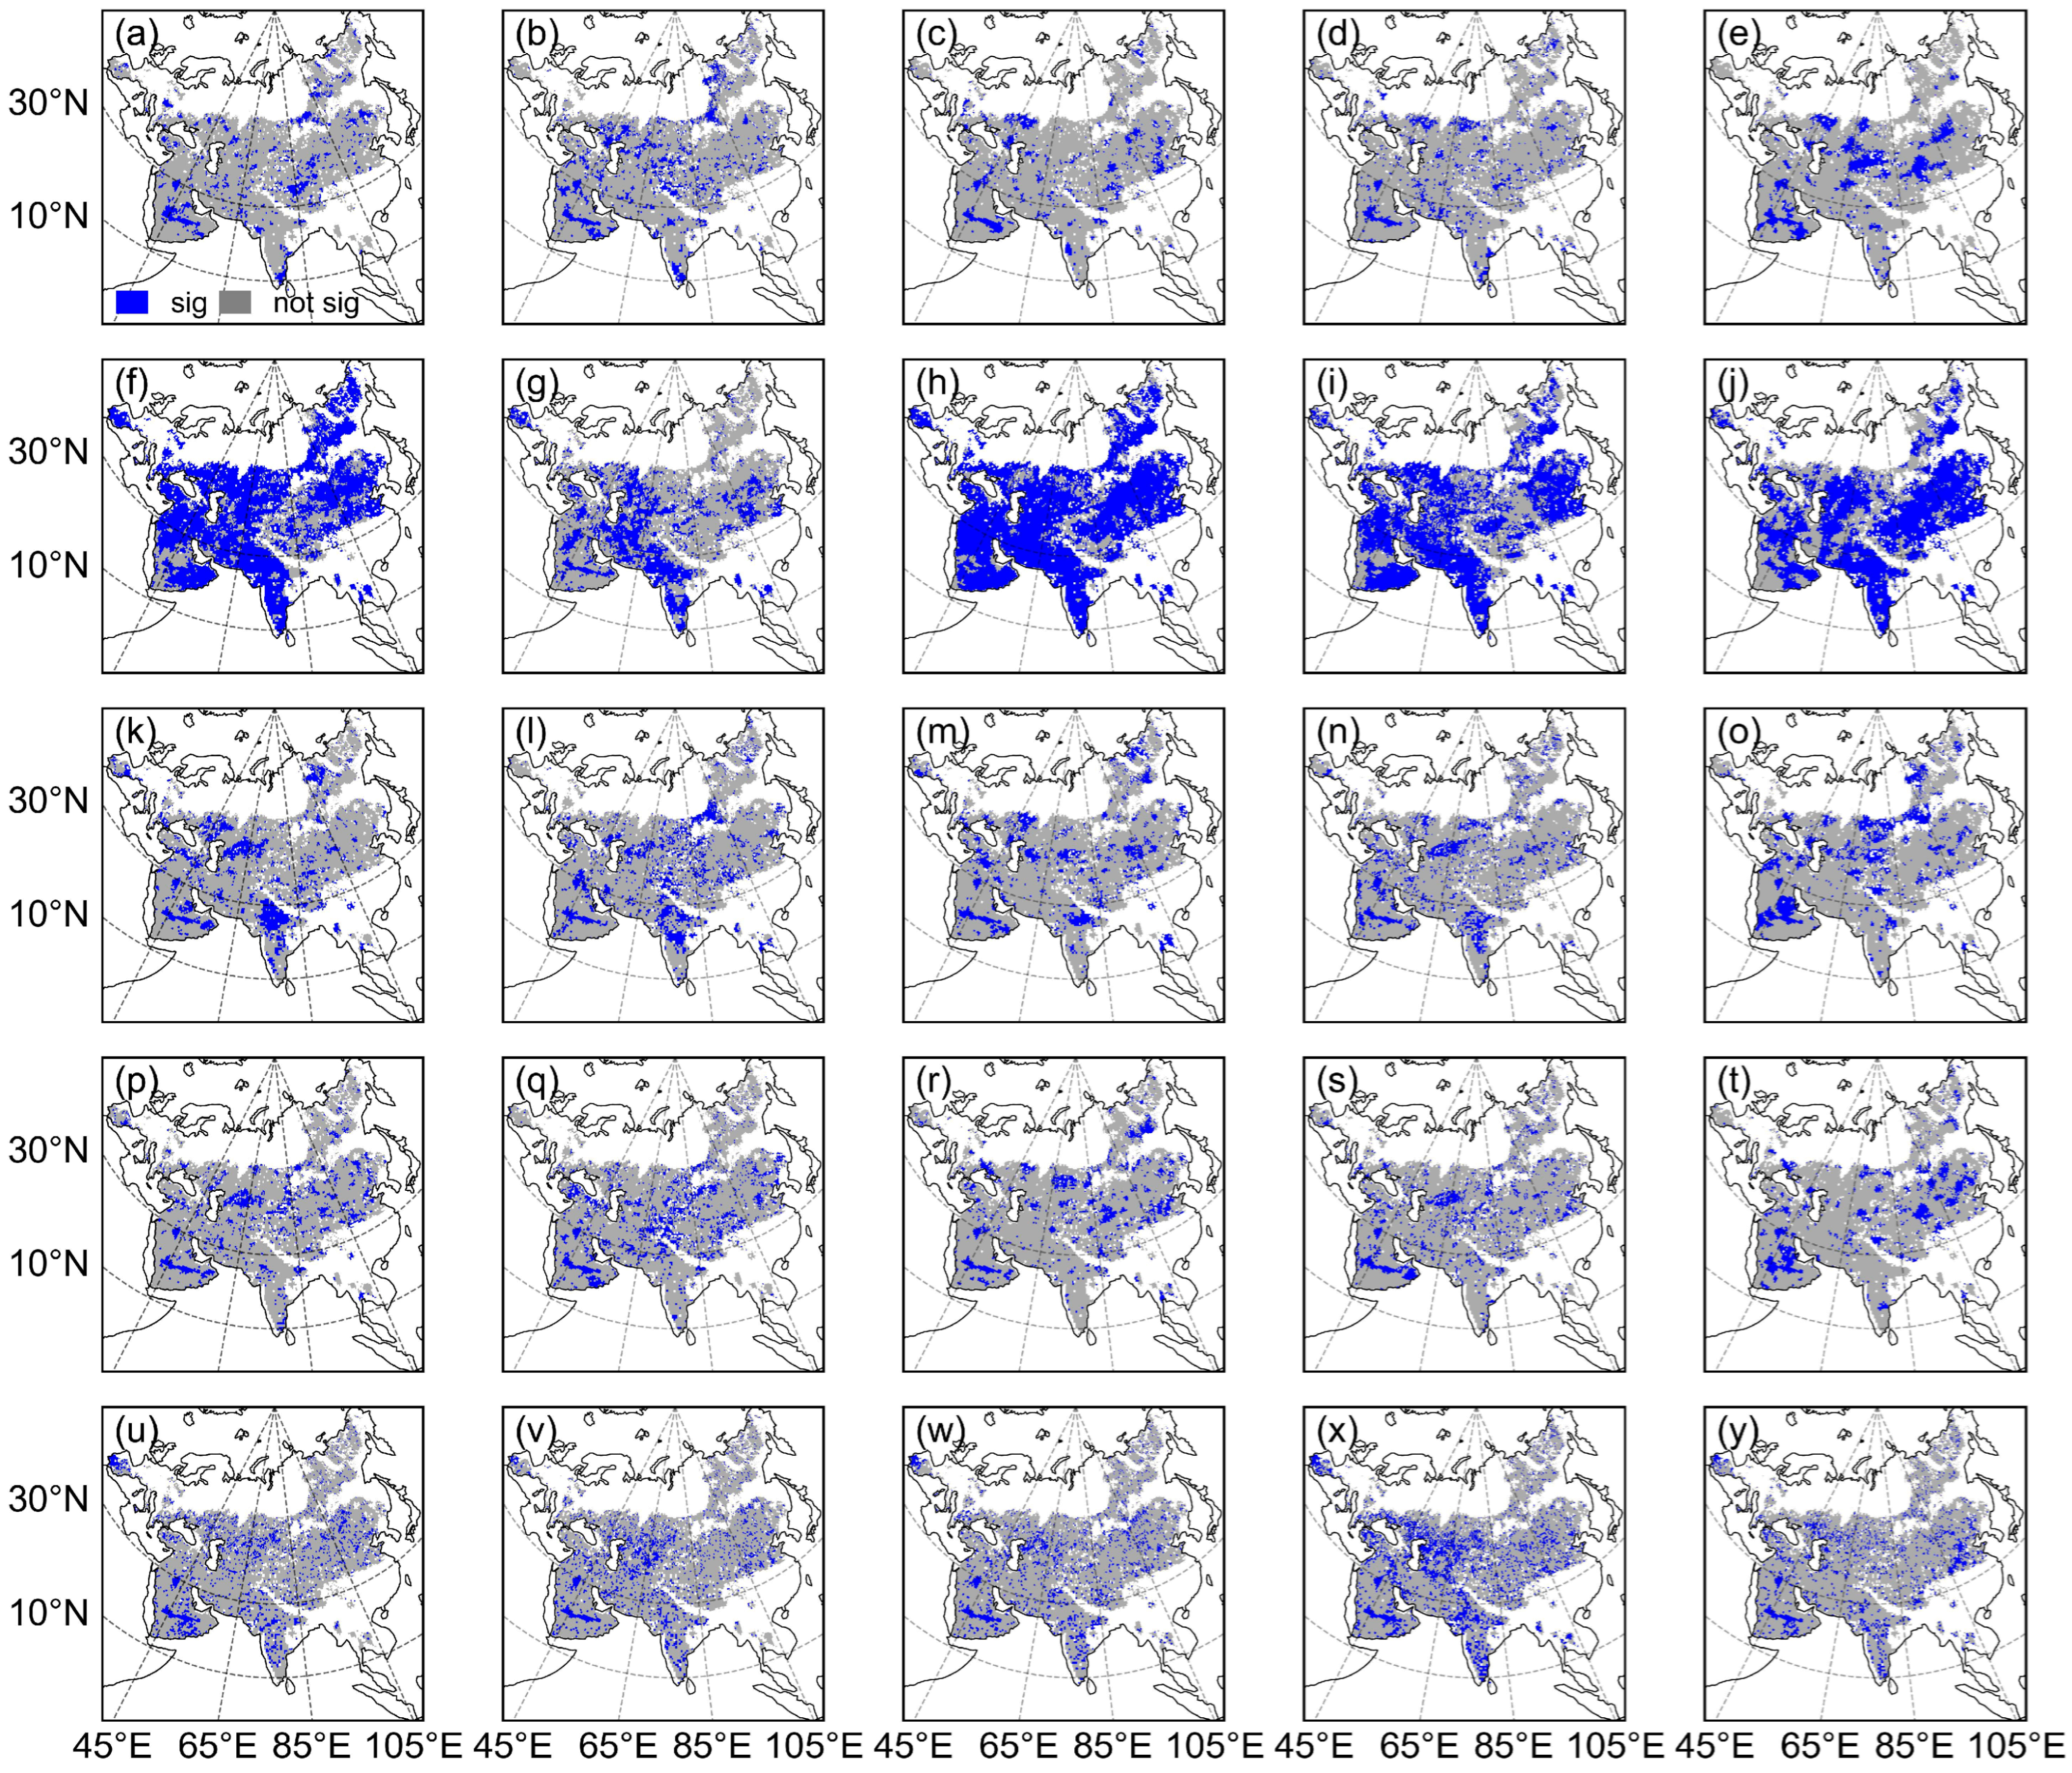
The analysis across five SSM products consistently underscored MAP’s widespread and statistically significant positive correlation with SSM, while other variables exhibited more variable and generally weaker impacts. These findings highlighted the critical role of precipitation as a primary regulator of soil moisture dynamics in water-limited ecosystems.

Author Contributions

Conceptualization, J.L. and J.Z.; Methodology, L.W. and J.L.; Software, J.L.; Validation, J.L., R.D. and J.Q.; Formal Analysis, J.H. and X.T.; Investigation, J.L.; Resources, L.W.; Data Curation, Y.X. and S.C.; Writing—Original Draft Preparation, J.L.; Writing—Review and Editing, J.Z.; Visualization, J.L.; Supervision, J.H.; Project Administration, J.Z. and C.Y.; Funding Acquisition, J.Z. and C.Y. All authors have read and agreed to the published version of the manuscript.

Funding

This study is jointly funded by the Project of Young Innovation Team in the Universities of Shandong Province (2024KJG051).

Data Availability Statement

The original contributions presented in this study are included in the article. Further inquiries can be directed to the corresponding author.

Acknowledgments

We sincerely appreciate the editors and anonymous reviewers for their valuable comments.

Conflicts of Interest

The authors declare no conflicts of interest.

Appendix A

Figure A1. Spatial distribution of the mean SSM in Eurasian drylands during the period of 1980–2023 based on the five products (i.e., (a): ERA5, (b): ESACCI, (c): GLDAS, (d): GLEAM, (e): MERRA2).
Forests 16 00589 g0a1
Figure A2. Statistical results of the five SSM products in land cover (a,c,e,g,i) and aridity classes (b,d,f,h,j).
Forests 16 00589 g0a2
Figure A3. The temporal trends of ERA5 (a), ESACCI (b), GLDAS (c) GLEAM (d), and MERRA2 (e) in Eurasian drylands from 1980 to 2023. Note: the “**”, and “***” indicates p < 0.05, and p < 0.01.
Forests 16 00589 g0a3
Figure A4. The temporal trends of MAT (a), MAP (b), PET (c) VPD (d), and LAI (e) in Eurasian drylands from 1981 to 2018. Note: the “***” indicates p < 0.01.
Forests 16 00589 g0a4
Figure A5. Spatial distribution of the environmental factors trend ((a): MAT, (b): MAP, (c): PET, (d): VPD, (e): LAI) in Eurasian drylands during the period of 1981–2018. The statistically significant regions (p < 0.05) are labeled with black spots.
Forests 16 00589 g0a5
Figure A6. The SM products with the least uncertainty were identified based on statistical analyses across land cover (a) and aridity classes (b).
Forests 16 00589 g0a6
Figure A7. Spatial patterns of significance of partial correlation coefficient between SSM dynamics (ERA5 (a,f,k,p,u), ESACCI (b,g,l,q,v), GLDAS (c,h,m,r,w), GLEAM (d,i,n,s,x), and MERRA2 (e,j,o,t,y)) and environmental change (MAT (ae), MAP (fj), PET (ko), VPD (pt), and LAI (uy)). Blue: significant; grey: insignificant.
Forests 16 00589 g0a7

References

  1. Liu, H.; Liu, Y.; Chen, Y.; Fan, M.; Chen, Y.; Gang, C.; You, Y.; Wang, Z. Dynamics of global dryland vegetation were more sensitive to soil moisture: Evidence from multiple vegetation indices. Agric. For. Meteorol. 2023, 331, 109327. [Google Scholar] [CrossRef]
  2. Liu, X.; Lai, Q.; Yin, S.; Bao, Y.; Qing, S.; Mei, L.; Bu, L. Exploring sandy vegetation sensitivities to water storage in China’s arid and semi-arid regions. Ecol. Indic. 2022, 136, 108711. [Google Scholar] [CrossRef]
  3. Xu, L.; Gao, G.; Wang, X.; Fu, B. Distinguishing the effects of climate change and vegetation greening on soil moisture variability along aridity gradient in the drylands of northern China. Agric. For. Meteorol. 2023, 343, 109786. [Google Scholar] [CrossRef]
  4. Wanders, N.; Karssenberg, D.; De Roo, A.; De Jong, S.; Bierkens, M. The suitability of remotely sensed soil moisture for improving operational flood forecasting. Hydrol. Earth Syst. Sci. 2014, 18, 2343–2357. [Google Scholar] [CrossRef]
  5. Bolten, J.D.; Crow, W.T.; Zhan, X.; Jackson, T.J.; Reynolds, C.A. Evaluating the utility of remotely sensed soil moisture retrievals for operational agricultural drought monitoring. IEEE J. Sel. Top. Appl. Earth Obs. Remote Sens. 2009, 3, 57–66. [Google Scholar] [CrossRef]
  6. Qin, J.; Liang, S.; Yang, K.; Kaihotsu, I.; Liu, R.; Koike, T. Simultaneous estimation of both soil moisture and model parameters using particle filtering method through the assimilation of microwave signal. J. Geophys. Res. Atmos 2009, 114. [Google Scholar] [CrossRef]
  7. Cheng, S.; Guan, X.; Huang, J.; Ji, F.; Guo, R. Long-term trend and variability of soil moisture over East Asia. J. Geophys. Res. Atmos. 2015, 120, 8658–8670. [Google Scholar] [CrossRef]
  8. Chen, X.; Su, Y.; Liao, J.; Shang, J.; Dong, T.; Wang, C.; Liu, W.; Zhou, G.; Liu, L. Detecting significant decreasing trends of land surface soil moisture in eastern China during the past three decades (1979–2010). J. Geophys. Res. Atmos. 2016, 121, 5177–5192. [Google Scholar] [CrossRef]
  9. Liu, Y.Y.; Parinussa, R.M.; Dorigo, W.A.; De Jeu, R.A.M.; Wagner, W.; van Dijk, A.I.J.M.; McCabe, M.F.; Evans, J.P. Developing an improved soil moisture dataset by blending passive and active microwave satellite-based retrievals. Hydrol. Earth Syst. Sci. 2011, 15, 425–436. [Google Scholar] [CrossRef]
  10. Dorigo, W.A.; Gruber, A.; De Jeu, R.A.M.; Wagner, W.; Stacke, T.; Loew, A.; Albergel, C.; Brocca, L.; Chung, D.; Parinussa, R.M.; et al. Evaluation of the ESA CCI soil moisture product using ground-based observations. Remote Sens. Environ. 2015, 162, 380–395. [Google Scholar] [CrossRef]
  11. Rodell, M.; Houser, P.; Jambor, U.; Gottschalck, J.; Mitchell, K.; Meng, C.-J.; Arsenault, K.; Cosgrove, B.; Radakovich, J.; Bosilovich, M. The global land data assimilation system. Bull. Am. Meteorol. Soc. 2004, 85, 381–394. [Google Scholar] [CrossRef]
  12. Martens, B.; Miralles, D.G.; Lievens, H.; Van Der Schalie, R.; De Jeu, R.A.; Fernández-Prieto, D.; Beck, H.E.; Dorigo, W.A.; Verhoest, N.E. GLEAM v3: Satellite-based land evaporation and root-zone soil moisture. Geosci. Model Dev. 2017, 10, 1903–1925. [Google Scholar] [CrossRef]
  13. Miralles, D.G.; Holmes, T.R.H.; De Jeu, R.A.M.; Gash, J.H.; Meesters, A.G.C.A.; Dolman, A.J. Global land-surface evaporation estimated from satellite-based observations. Hydrol. Earth Syst. Sci. 2011, 15, 453–469. [Google Scholar] [CrossRef]
  14. Hoffmann, L.; Günther, G.; Li, D.; Stein, O.; Wu, X.; Griessbach, S.; Heng, Y.; Konopka, P.; Müller, R.; Vogel, B.; et al. From ERA-Interim to ERA5: The considerable impact of ECMWF’s next-generation reanalysis on Lagrangian transport simulations. Atmos. Chem. Phys. 2019, 19, 3097–3124. [Google Scholar] [CrossRef]
  15. Woollen, J.; Sienkiewicz, M.; Ruddick, A.G.; Robertson, F.R.; Reichle, R.; Redder, C.R.; Pegion, P.; Pawson, S.; Owens, T.; Molod, A.; et al. MERRA: NASA’s Modern-Era Retrospective Analysis for Research and Applications. J. Clim. 2011, 24, 3624–3648. [Google Scholar] [CrossRef]
  16. Xing, Z.; Fan, L.; Zhao, L.; De Lannoy, G.; Frappart, F.; Peng, J.; Li, X.; Zeng, J.; Al-Yaari, A.; Yang, K.; et al. A first assessment of satellite and reanalysis estimates of surface and root-zone soil moisture over the permafrost region of Qinghai-Tibet Plateau. Remote Sens. Environ. 2021, 265, 112666. [Google Scholar] [CrossRef]
  17. Xu, L.; Chen, N.; Zhang, X.; Moradkhani, H.; Zhang, C.; Hu, C. In-situ and triple-collocation based evaluations of eight global root zone soil moisture products. Remote Sens. Environ. 2021, 254, 112248. [Google Scholar] [CrossRef]
  18. Liu, J.; Chai, L.; Dong, J.; Zheng, D.; Lu, Z. Uncertainty analysis of eleven multisource soil moisture products in the third pole environment based on the three-corned hat method. Remote Sens. Environ. 2021, 255, 112225. [Google Scholar] [CrossRef]
  19. Yi, C.; Li, X.; Zeng, J.; Fan, L.; Xie, Z.; Gao, L.; Xing, Z.; Ma, H.; Boudah, A.; Zhou, H.; et al. Assessment of five SMAP soil moisture products using ISMN ground-based measurements over varied environmental conditions. J. Hydrol. 2023, 619, 129325. [Google Scholar] [CrossRef]
  20. Luo, M.; Sa, C.; Meng, F.; Duan, Y.; Liu, T.; Bao, Y. Assessing remotely sensed and reanalysis products in characterizing surface soil moisture in the Mongolian Plateau. Int. J. Digit. Earth 2020, 14, 1255–1272. [Google Scholar] [CrossRef]
  21. Bárdossy, A.; Lehmann, W. Spatial distribution of soil moisture in a small catchment. Part 1: Geostatistical analysis. J. Hydrol. 1998, 206, 1–15. [Google Scholar] [CrossRef]
  22. Kim, H.; Parinussa, R.; Konings, A.G.; Wagner, W.; Cosh, M.H.; Lakshmi, V.; Zohaib, M.; Choi, M. Global-scale assessment and combination of SMAP with ASCAT (active) and AMSR2 (passive) soil moisture products. Remote Sens. Environ. 2018, 204, 260–275. [Google Scholar] [CrossRef]
  23. Kim, H.; Wigneron, J.-P.; Kumar, S.; Dong, J.; Wagner, W.; Cosh, M.H.; Bosch, D.D.; Collins, C.H.; Starks, P.J.; Seyfried, M.; et al. Global scale error assessments of soil moisture estimates from microwave-based active and passive satellites and land surface models over forest and mixed irrigated/dryland agriculture regions. Remote Sens. Environ. 2020, 251, 112052. [Google Scholar] [CrossRef]
  24. Liu, J.; Chai, L.; Lu, Z.; Liu, S.; Qu, Y.; Geng, D.; Song, Y.; Guan, Y.; Guo, Z.; Wang, J.; et al. Evaluation of SMAP, SMOS-IC, FY3B, JAXA, and LPRM Soil Moisture Products over the Qinghai-Tibet Plateau and Its Surrounding Areas. Remote Sens. 2019, 11, 792. [Google Scholar] [CrossRef]
  25. Long, D.; Pan, Y.; Zhou, J.; Chen, Y.; Hou, X.; Hong, Y.; Scanlon, B.R.; Longuevergne, L. Global analysis of spatiotemporal variability in merged total water storage changes using multiple GRACE products and global hydrological models. Remote Sens. Environ. 2017, 192, 198–216. [Google Scholar] [CrossRef]
  26. Gao, S.; Hao, W.; Fan, Y.; Li, F.; Wang, J. A Multi-Source GRACE Fusion Solution via Uncertainty Quantification of GRACE-Derived Terrestrial Water Storage (TWS) Change. J. Geophys. Res. Solid Earth 2023, 128, e2023JB026908. [Google Scholar] [CrossRef]
  27. Xu, L.; Chen, N.; Moradkhani, H.; Zhang, X.; Hu, C. Improving Global Monthly and Daily Precipitation Estimation by Fusing Gauge Observations, Remote Sensing, and Reanalysis Data Sets. Water Resour. Res. 2020, 56, e2019WR026444. [Google Scholar] [CrossRef]
  28. Xu, T.; Guo, Z.; Xia, Y.; Ferreira, V.G.; Liu, S.; Wang, K.; Yao, Y.; Zhang, X.; Zhao, C. Evaluation of twelve evapotranspiration products from machine learning, remote sensing and land surface models over conterminous United States. J. Hydrol. 2019, 578, 124105. [Google Scholar] [CrossRef]
  29. Deng, Y.; Wang, S.; Bai, X.; Luo, G.; Wu, L.; Cao, Y.; Li, H.; Li, C.; Yang, Y.; Hu, Z.; et al. Variation trend of global soil moisture and its cause analysis. Ecol. Indic. 2020, 110, 105939. [Google Scholar] [CrossRef]
  30. Liu, Y.; Yang, Y. Spatial-temporal variability pattern of multi-depth soil moisture jointly driven by climatic and human factors in China. J. Hydrol. 2023, 619, 129313. [Google Scholar] [CrossRef]
  31. Jia, X.; Shao, M.a.; Zhu, Y.; Luo, Y. Soil moisture decline due to afforestation across the Loess Plateau, China. J. Hydrol. 2017, 546, 113–122. [Google Scholar] [CrossRef]
  32. Zhang, Y.; Zhang, Y.; Lian, X.; Zheng, Z.; Zhao, G.; Zhang, T.; Xu, M.; Huang, K.; Chen, N.; Li, J.; et al. Enhanced dominance of soil moisture stress on vegetation growth in Eurasian drylands. Natl. Sci. Rev. 2023, 10, nwad108. [Google Scholar] [CrossRef] [PubMed]
  33. Maestre, F.T.; Benito, B.M.; Berdugo, M.; Concostrina-Zubiri, L.; Delgado-Baquerizo, M.; Eldridge, D.J.; Guirado, E.; Gross, N.; Kéfi, S.; Le Bagousse-Pinguet, Y. Biogeography of global drylands. New Phytol. 2021, 231, 540–558. [Google Scholar] [CrossRef]
  34. He, B.; Wang, S.; Guo, L.; Wu, X. Aridity change and its correlation with greening over drylands. Agric. For. Meteorol. 2019, 278, 107663. [Google Scholar] [CrossRef]
  35. Zomer, R.J.; Trabucco, A.; Bossio, D.A.; Verchot, L.V. Climate change mitigation: A spatial analysis of global land suitability for clean development mechanism afforestation and reforestation. Agric. Ecosyst. Environ. 2008, 126, 67–80. [Google Scholar] [CrossRef]
  36. Jiao, W.; Wang, L.; Smith, W.K.; Chang, Q.; Wang, H.; D’Odorico, P. Observed increasing water constraint on vegetation growth over the last three decades. Nat. Commun. 2021, 12, 3777. [Google Scholar] [CrossRef]
  37. Dorigo, W.A.; Xaver, A.; Vreugdenhil, M.; Gruber, A.; Hegyiová, A.; Sanchis-Dufau, A.D.; Zamojski, D.; Cordes, C.; Wagner, W.; Drusch, M. Global Automated Quality Control of In Situ Soil Moisture Data from the International Soil Moisture Network. Vadose Zone J. 2013, 12, 1–21. [Google Scholar] [CrossRef]
  38. Chen, Y.; Yang, K.; Qin, J.; Cui, Q.; Lu, H.; La, Z.; Han, M.; Tang, W. Evaluation of SMAP, SMOS, and AMSR2 soil moisture retrievals against observations from two networks on the Tibetan Plateau. J. Geophys. Res. Atmos. 2017, 122, 5780–5792. [Google Scholar] [CrossRef]
  39. Hersbach, H.; Bell, B.; Berrisford, P.; Hirahara, S.; Horányi, A.; Muñoz-Sabater, J.; Nicolas, J.; Peubey, C.; Radu, R.; Schepers, D.; et al. The ERA5 global reanalysis. Q. J. R. Meteorol. Soc. 2020, 146, 1999–2049. [Google Scholar] [CrossRef]
  40. Dee, D.P.; Uppala, S.M.; Simmons, A.J.; Berrisford, P.; Poli, P.; Kobayashi, S.; Andrae, U.; Balmaseda, M.A.; Balsamo, G.; Bauer, P.; et al. The ERA-Interim reanalysis: Configuration and performance of the data assimilation system. Q. J. R. Meteorol. Soc. 2011, 137, 553–597. [Google Scholar] [CrossRef]
  41. Dorigo, W.; Wagner, W.; Albergel, C.; Albrecht, F.; Balsamo, G.; Brocca, L.; Chung, D.; Ertl, M.; Forkel, M.; Gruber, A.; et al. ESA CCI Soil Moisture for improved Earth system understanding: State-of-the art and future directions. Remote Sens. Environ. 2017, 203, 185–215. [Google Scholar] [CrossRef]
  42. Miralles, D.G.; Bonte, O.; Koppa, A.; Villanueva, O.B.; Tronquo, E.; Zhong, F.; Beck, H.; Hulsman, P.; Dorigo, W.; Verhoest, N.E. GLEAM4: Global land evaporation dataset at 0.1° resolution from 1980 to near present. Res. Sq. 2024. [Google Scholar] [CrossRef]
  43. Molod, A.; Takacs, L.; Suarez, M.; Bacmeister, J. Development of the GEOS-5 atmospheric general circulation model: Evolution from MERRA to MERRA2. Geosci. Model Dev. 2015, 8, 1339–1356. [Google Scholar] [CrossRef]
  44. Harris, I.; Osborn, T.J.; Jones, P.; Lister, D. Version 4 of the CRU TS monthly high-resolution gridded multivariate climate dataset. Sci. Data 2020, 7, 109. [Google Scholar] [CrossRef] [PubMed]
  45. Xiao, Z.; Liang, S.; Wang, J.; Chen, P.; Yin, X.; Zhang, L.; Song, J. Use of General Regression Neural Networks for Generating the GLASS Leaf Area Index Product From Time-Series MODIS Surface Reflectance. IEEE Trans. Geosci. Remote Sens. 2014, 52, 209–223. [Google Scholar] [CrossRef]
  46. Xiao, Z.; Liang, S.; Wang, J.; Xiang, Y.; Zhao, X.; Song, J. Long-Time-Series Global Land Surface Satellite Leaf Area Index Product Derived From MODIS and AVHRR Surface Reflectance. IEEE Trans. Geosci. Remote Sens. 2016, 54, 5301–5318. [Google Scholar] [CrossRef]
  47. Hu, Y.; Li, H.; Wu, D.; Chen, W.; Zhao, X.; Hou, M.; Li, A.; Zhu, Y. LAI-indicated vegetation dynamic in ecologically fragile region: A case study in the Three-North Shelter Forest program region of China. Ecol. Indic. 2021, 120, 106932. [Google Scholar] [CrossRef]
  48. Meng, S.; Xie, X.; Zhu, B.; Wang, Y. The relative contribution of vegetation greening to the hydrological cycle in the Three-North region of China: A modelling analysis. J. Hydrol. 2020, 591, 125689. [Google Scholar] [CrossRef]
  49. Hartley, A.J.; MacBean, N.; Georgievski, G.; Bontemps, S. Uncertainty in plant functional type distributions and its impact on land surface models. Remote Sens. Environ. 2017, 203, 71–89. [Google Scholar] [CrossRef]
  50. Wagner, W.; de Jeu, R.; Isaksen, L.; Muñoz-Sabater, J.; de Rosnay, P.; Balsamo, G.; Reichle, R.H.; Dorigo, W.; Albergel, C. Skill and Global Trend Analysis of Soil Moisture from Reanalyses and Microwave Remote Sensing. J. Hydrometeorol. 2013, 14, 1259–1277. [Google Scholar] [CrossRef]
  51. Al-Yaari, A.; Wigneron, J.P.; Kerr, Y.; de Jeu, R.; Rodriguez-Fernandez, N.; van der Schalie, R.; Al Bitar, A.; Mialon, A.; Richaume, P.; Dolman, A.; et al. Testing regression equations to derive long-term global soil moisture datasets from passive microwave observations. Remote Sens. Environ. 2016, 180, 453–464. [Google Scholar] [CrossRef]
  52. Entekhabi, D.; Reichle, R.H.; Koster, R.D.; Crow, W.T. Performance Metrics for Soil Moisture Retrievals and Application Requirements. J. Hydrometeorol. 2010, 11, 832–840. [Google Scholar] [CrossRef]
  53. Wigneron, J.-P.; Li, X.; Frappart, F.; Fan, L.; Al-Yaari, A.; De Lannoy, G.; Liu, X.; Wang, M.; Le Masson, E.; Moisy, C. SMOS-IC data record of soil moisture and L-VOD: Historical development, applications and perspectives. Remote Sens. Environ. 2021, 254, 112238. [Google Scholar] [CrossRef]
  54. Premoli, A.; Tavella, P. A revisited three-cornered hat method for estimating frequency standard instability. IEEE Trans. Instrum. Meas. 1993, 42, 7–13. [Google Scholar] [CrossRef]
  55. Tavella, P.; Premoli, A. Estimating the instabilities of N clocks by measuring differences of their readings. Metrologia 1994, 30, 479. [Google Scholar] [CrossRef]
  56. Koot, L.; Viron, O.d.; Dehant, V. Atmospheric Angular Momentum Time-Series: Characterization of their Internal Noise and Creation of a Combined Series. J. Geod. 2006, 79, 663–674. [Google Scholar] [CrossRef]
  57. Galindo, F.J.; Palacio, J. Estimating the instabilities of N correlated clocks. In Proceedings of the 31st Annual Precise Time and Time Interval Systems and Applications Meeting, Dana Point, CA, USA, 7–9 December 1999; pp. 285–296. [Google Scholar]
  58. Park, H.; Jeong, S.; Penuelas, J. Accelerated rate of vegetation green-up related to warming at northern high latitudes. Glob. Change Biol. 2020, 26, 6190–6202. [Google Scholar] [CrossRef]
  59. Peng, C.; Zeng, J.; Chen, K.-S.; Li, Z.; Ma, H.; Zhang, X.; Shi, P.; Wang, T.; Yi, L.; Bi, H. Global spatiotemporal trend of satellite-based soil moisture and its influencing factors in the early 21st century. Remote Sens. Environ. 2023, 291, 113569. [Google Scholar] [CrossRef]
  60. Wang, J.; Liu, D.; Ciais, P.; Peñuelas, J. Decreasing rainfall frequency contributes to earlier leaf onset in northern ecosystems. Nat. Clim. Change 2022, 12, 386–392. [Google Scholar] [CrossRef]
  61. Jiao, D.; Xu, N.; Yang, F.; Xu, K. Evaluation of spatial-temporal variation performance of ERA5 precipitation data in China. Sci. Rep. 2021, 11, 17956. [Google Scholar] [CrossRef]
  62. Sun, H.; Su, F.; Yao, T.; He, Z.; Tang, G.; Huang, J.; Zheng, B.; Meng, F.; Ou, T.; Chen, D. General overestimation of ERA5 precipitation in flow simulations for High Mountain Asia basins. Environ. Res. Commun. 2021, 3, 121003. [Google Scholar] [CrossRef]
  63. Borchers, A.; Pieler, T. Programming pluripotent precursor cells derived from Xenopus embryos to generate specific tissues and organs. Genes 2010, 1, 413–426. [Google Scholar] [CrossRef]
  64. McColl, K.A.; Alemohammad, S.H.; Akbar, R.; Konings, A.G.; Yueh, S.; Entekhabi, D. The global distribution and dynamics of surface soil moisture. Nat. Geosci. 2017, 10, 100–104. [Google Scholar] [CrossRef]
  65. Al-Yaari, A.; Wigneron, J.P.; Dorigo, W.; Colliander, A.; Pellarin, T.; Hahn, S.; Mialon, A.; Richaume, P.; Fernandez-Moran, R.; Fan, L.; et al. Assessment and inter-comparison of recently developed/reprocessed microwave satellite soil moisture products using ISMN ground-based measurements. Remote Sens. Environ. 2019, 224, 289–303. [Google Scholar] [CrossRef]
  66. Guan, Y.; Gu, X.; Slater, L.J.; Li, J.; Kong, D.; Zhang, X. Spatio-temporal variations in global surface soil moisture based on multiple datasets: Intercomparison and climate drivers. J. Hydrol. 2023, 625, 130095. [Google Scholar] [CrossRef]
  67. Grant, J.P.; Wigneron, J.P.; Van de Griend, A.A.; Kruszewski, A.; Søbjærg, S.S.; Skou, N. A field experiment on microwave forest radiometry: L-band signal behaviour for varying conditions of surface wetness. Remote Sens. Environ. 2007, 109, 10–19. [Google Scholar] [CrossRef]
  68. Truong-Loi, M.-L.; Saatchi, S.; Jaruwatanadilok, S. Soil Moisture Estimation Under Tropical Forests Using UHF Radar Polarimetry. IEEE Trans. Geosci. Remote Sens. 2015, 53, 1718–1727. [Google Scholar] [CrossRef]
  69. Saeedi, M.; Sharafati, A.; Tavakol, A. Evaluation of gridded soil moisture products over varied land covers, climates, and soil textures using in situ measurements: A case study of Lake Urmia Basin. Theor. Appl. Climatol. 2021, 145, 1053–1074. [Google Scholar] [CrossRef]
  70. Yu, T.; Jiapaer, G.; Bao, A.; Zhang, J.; Tu, H.; Chen, B.; De Maeyer, P.; Van de Voorde, T. Evaluating surface soil moisture characteristics and the performance of remote sensing and analytical products in Central Asia. J. Hydrol. 2023, 617, 128921. [Google Scholar] [CrossRef]
  71. Berg, A.; McColl, K.A. No projected global drylands expansion under greenhouse warming. Nat. Clim. Change 2021, 11, 331–337. [Google Scholar] [CrossRef]
  72. Zhou, S.; Williams, A.P.; Lintner, B.R.; Berg, A.M.; Zhang, Y.; Keenan, T.F.; Cook, B.I.; Hagemann, S.; Seneviratne, S.I.; Gentine, P. Soil moisture–atmosphere feedbacks mitigate declining water availability in drylands. Nat. Clim. Change 2021, 11, 38–44. [Google Scholar] [CrossRef]
  73. Nicolai-Shaw, N.; Zscheischler, J.; Hirschi, M.; Gudmundsson, L.; Seneviratne, S.I. A drought event composite analysis using satellite remote-sensing based soil moisture. Remote Sens. Environ. 2017, 203, 216–225. [Google Scholar] [CrossRef]
  74. Luo, M.; Meng, F.; Wang, Y.; Sa, C.; Duan, Y.; Bao, Y.; Liu, T. Quantitative detection and attribution of soil moisture heterogeneity and variability in the Mongolian Plateau. J. Hydrol. 2023, 621, 129673. [Google Scholar] [CrossRef]
  75. Tautges, N.; Borrelli, K.; Goldberger, J.; Machado, S.; Fuerst, E.; Roberts, D.; Burke, I. Growing small grains organically in the semiarid West: A review of markets and management practices to optimize productivity and sustainability. Adv. Agron. 2022, 171, 111–141. [Google Scholar] [CrossRef]
  76. Cao, R.; Jia, X.; Huang, L.; Zhu, Y.; Wu, L.; Shao, M. Deep soil water storage varies with vegetation type and rainfall amount in the Loess Plateau of China. Sci. Rep. 2018, 8, 12346. [Google Scholar] [CrossRef] [PubMed]
  77. Saxton, K.E.; Rawls, W.J. Soil Water Characteristic Estimates by Texture and Organic Matter for Hydrologic Solutions. Soil Sci. Soc. Am. J. 2006, 70, 1569–1578. [Google Scholar] [CrossRef]
  78. Zhang, Q.; Fan, K.; Singh, V.P.; Sun, P.; Shi, P. Evaluation of Remotely Sensed and Reanalysis Soil Moisture Against In Situ Observations on the Himalayan-Tibetan Plateau. J. Geophys. Res. Atmos. 2018, 123, 7132–7148. [Google Scholar] [CrossRef]
  79. Yuan, W.; Zheng, Y.; Piao, S.; Ciais, P.; Lombardozzi, D.; Wang, Y.; Ryu, Y.; Chen, G.; Dong, W.; Hu, Z. Increased atmospheric vapor pressure deficit reduces global vegetation growth. Sci. Adv. 2019, 5, eaax1396. [Google Scholar] [CrossRef]
  80. Liu, S.; Liu, X.; Yu, L.; Wang, Y.; Zhang, G.J.; Gong, P.; Huang, W.; Wang, B.; Yang, M.; Cheng, Y. Climate response to introduction of the ESA CCI land cover data to the NCAR CESM. Clim. Dynam. 2021, 56, 4109–4127. [Google Scholar] [CrossRef]
  81. Zheng, J.; Zhao, T.; Lü, H.; Shi, J.; Cosh, M.H.; Ji, D.; Jiang, L.; Cui, Q.; Lu, H.; Yang, K.; et al. Assessment of 24 soil moisture datasets using a new in situ network in the Shandian River Basin of China. Remote Sens. Environ. 2022, 271, 112891. [Google Scholar] [CrossRef]
  82. Crow, W.T.; Berg, A.A.; Cosh, M.H.; Loew, A.; Mohanty, B.P.; Panciera, R.; de Rosnay, P.; Ryu, D.; Walker, J.P. Upscaling sparse ground-based soil moisture observations for the validation of coarse-resolution satellite soil moisture products. Rev. Geophys. 2012, 50. [Google Scholar] [CrossRef]
  83. Leng, G.; Huang, M.; Tang, Q.; Leung, L.R. A modeling study of irrigation effects on global surface water and groundwater resources under a changing climate. J. Adv. Model. Earth Syst. 2015, 7, 1285–1304. [Google Scholar] [CrossRef]
  84. Gu, X.; Zhang, Q.; Li, J.; Singh, V.P.; Liu, J.; Sun, P.; Cheng, C. Attribution of Global Soil Moisture Drying to Human Activities: A Quantitative Viewpoint. Geophys. Res. Lett. 2019, 46, 2573–2582. [Google Scholar] [CrossRef]
  85. Oliva, R.; Daganzo, E.; Richaume, P.; Kerr, Y.; Cabot, F.; Soldo, Y.; Anterrieu, E.; Reul, N.; Gutierrez, A.; Barbosa, J. Status of Radio Frequency Interference (RFI) in the 1400–1427 MHz passive band based on six years of SMOS mission. Remote Sens. Environ. 2016, 180, 64–75. [Google Scholar] [CrossRef]
Figure 1. Spatial distribution of (a) land cover and (b) aridity classes in the Eurasian drylands.
Forests 16 00589 g001
Figure 2. Spatial distribution of the SSM trend ((a): ERA5, (b): ESACCI, (c): GLDAS, (d): GLEAM, (e): MERRA2) in Eurasian drylands during the period of 1980–2023. The statistically significant regions (p < 0.05) are labeled with black spots.
Forests 16 00589 g002
Figure 3. Scatterplot comparison of five SSM products ((a): ERA5, (b): ESACCI, (c): GLDAS, (d): GLEAM, (e): MERRA2) with the in situ station data in Eurasian drylands. The black dashed line represents the 1:1 reference, while the red dashed line denotes the fitted trend. The coefficient of determination (R2) quantifies the fit’s accuracy.
Forests 16 00589 g003
Figure 4. Evaluation five SSM products based on in situ stations data; (a) Correlation, (b) Bais, (c) RMSE, (d) ubRMSE.
Forests 16 00589 g004
Figure 5. Uncertainty of the five SSM products ((a): ERA5, (b): ESACCI, (c): GLDAS, (d): GLEAM, (e): MERRA2) during the period of 1980–2023 quantified by the TCH method.
Forests 16 00589 g005
Figure 6. Uncertainty of the five SSM products in land cover (a,c,e,g,i) and aridity classes (b,d,f,h,j) during the period of 1980–2023. The green line in the box plot indicates the median value of uncertainty.
Forests 16 00589 g006
Figure 7. The spatial patterns of SSM products with the least uncertainty among the five SM products.
Forests 16 00589 g007
Figure 8. Spatial patterns of partial correlation coefficient between SSM dynamics (ERA5 (a,f,k,p,u), ESACCI (b,g,l,q,v), GLDAS (c,h,m,r,w), GLEAM (d,i,n,s,x), and MERRA2 (e,j,o,t,y)) and environmental change (MAT (ae), MAP (fj), PET (ko), VPD (pt), and LAI (uy)).
Forests 16 00589 g008
Figure 9. Spatial patterns of dominant environmental variables on five SSM products ((a): ERA5, (b): ESACCI, (c): GLDAS, (d): GLEAM, (e): MERRA2) from 1981 to 2018 in Eurasian drylands.
Forests 16 00589 g009
Table 1. In situ station data from ISMN.
Network NameNumber of Available Sites
BIEBRZA S-122
CTP SMTMN47
FR Aqui4
HOAL31
IPE1
MAQU12
NAQU9
NGARI15
REMEDHUS20
RSMN19
SMN-SDR32
SMOSMANIA29
SONTE-China20
Table 2. Statistical results of the dominant environmental variables on five SSM products in land cover (forest, shrubland, grassland, cropland, and bareland) and aridity classes (hyper-arid, arid, semi-arid, and dry sub-humid).
ERA5ESACCIGLDASGLEAMMERRA2
ForestMAT3.924.32.010.33.5
MAP77.117.980.558.756.5
PET9.523.97.012.227.3
VPD6.714.06.09.25.8
LAI2.819.94.59.56.8
ShrublandMAT3.917.33.210.711.8
MAP74.331.974.948.754.1
PET9.915.810.89.818.4
VPD5.615.54.79.17.0
LAI6.319.66.421.88.6
GrasslandMAT7.518.75.19.16.2
MAP68.726.673.255.865.5
PET8.414.78.27.911.1
VPD7.723.16.39.88.4
LAI7.716.97.117.58.8
CroplandMAT3.213.23.47.99.4
MAP79.237.079.861.761.3
PET8.215.86.88.012.9
VPD4.717.15.87.06.2
LAI4.716.94.315.510.1
Sparse vegetationMAT3.616.92.59.713.1
MAP74.234.381.845.361.4
PET8.413.97.911.011.8
VPD5.116.62.59.06.0
LAI8.818.35.425.07.6
BarelandMAT11.716.55.710.111.4
MAP68.839.185.561.167.4
PET6.916.73.59.48.9
VPD6.212.82.85.25.3
LAI6.414.92.414.37.0
Hyper-aridMAT16.819.48.711.814.0
MAP65.336.183.565.763.1
PET6.517.32.98.611.1
VPD5.713.72.84.45.9
LAI5.713.52.19.55.9
AridMAT6.514.03.48.112.6
MAP73.743.485.054.669.7
PET7.313.05.08.65.9
VPD5.512.32.66.24.2
LAI7.117.34.022.57.6
Semi-aridMAT4.818.34.310.16.4
MAP76.326.476.757.562.7
PET7.116.16.68.914.4
VPD6.020.66.68.56.5
LAI5.818.55.815.09.9
Dry sub-humidMAT6.224.44.112.18.7
MAP73.123.277.356.848.3
PET11.522.08.911.427.9
VPD6.013.65.79.57.4
LAI3.316.83.910.27.7
Disclaimer/Publisher’s Note: The statements, opinions and data contained in all publications are solely those of the individual author(s) and contributor(s) and not of MDPI and/or the editor(s). MDPI and/or the editor(s) disclaim responsibility for any injury to people or property resulting from any ideas, methods, instructions or products referred to in the content.

