Abstract
As a critical ecological security barrier, Yunnan Province has significantly reduced forest fragmentation through ecological restoration programs in recent years. However, the optimization process of the forest landscape and the most effective ecological restoration projects remain unclear. Our study combined land use data with 13 driving factors, including meteorological and socioeconomic data, to analyze the spatial distribution, temporal dynamics, and key ecological restoration programs of forest fragmentation using dynamic and static indexes, morphological spatial pattern analysis, boosted regression tree models, and partitioned statistical methods. We found that over the past 30 years, FF has significantly decreased. Fragmentation was higher before 2000 but has steadily declined, with eastern regions more fragmented than western areas. Forest landscapes have transitioned from degradation to recovery, with core forest areas expanding by 6997.72 km2. Afforestation was the main driver, adding 238,109.21 km2 of forest cover, while reforestation contributed 17,254.47 km2, improving patch size and connectivity. Regionally, the southwest has lower fragmentation due to ample rainfall and reforestation efforts, while central and northeastern areas face higher fragmentation from drought, human activities, and urban expansion. Our study offers a scientific basis for formulating effective ecological restoration policies.
1. Introduction
Global deforestation and land-use changes have led to forest fragmentation (FF), posing severe threats to ecosystems, including biodiversity loss, habitat isolation, and local ecosystem disruption. FF impacts biodiversity by lowering the survival rates of some plant species [1] and reducing mammal species diversity [2,3,4]. FF further threatens ecosystem stability, often triggering local microclimate shifts [4,5], which can elevate extinction risks for thousands of species [6]. Additionally, FF disrupts animal habitats [7] and disturbs food chains, exposing animals to risks like food scarcity, habitat loss, and heightened predation [8,9]. However, the effects of FF on ecosystems are twofold. On one hand, the high mortality rate of trees at forest edges leads to significant carbon emissions from fragmented forests [10]. On the other hand, fragmentation can enhance interactions between certain species, particularly parasitic relationships [11].
It is important to investigate the factors influencing FF, particularly the dual impacts of climate change and human activities. On the one hand, extreme climate events [12] and urban expansion [13,14] may exacerbate fragmentation; on the other, favorable climates [15] and effective ecological restoration [16,17,18] can slow or even reverse it. These restoration efforts have increased forest area and reduced fragmentation, positively impacting ecosystems [19]. Since 2000, China has successively implemented a series of ecological projects, including the Natural Forest Conservation Program, the Grain-for-Green Project, the Three-North Shelter Forest Program, and the Grassland Restoration through Grazing Exclusion. These projects cover 44.8% of the country’s forest area and 23.2% of its grassland area [20,21,22]. These ecological projects have significantly increased the area and quality of vegetation cover through management measures such as afforestation, reforestation and reforestation, planting and weeding fences, and horological measures [23,24]. Understanding the patterns and drivers of FF is essential for biodiversity conservation, ecosystem service maintenance, carbon cycling, climate change mitigation, and sustainable forest management.
A range of techniques has been applied to investigate FF. The static methods in current use include metrics-based approaches, morphological spatial pattern analysis, forest fragmentation models, and the moving window method. Among various methods, the landscape index approach stands out as the predominant technique for evaluating FF. This method quantitatively assesses spatial patterns in land cover and use [25], offering critical insights into forest structural changes, species composition, fragmentation, and connectivity. At the same time, landscape indicators provide a powerful tool for analyzing spatial patterns of land cover and land use and for identifying areas of degraded forests [26]. These indicators include measurements of patch size, shape, connectivity, edge density, and landscape diversity [27]. These indicators, calculated from remotely sensed data, help identify degraded forest areas and prioritize restoration efforts [28]. Spatial analysis and landscape indicators enable the evaluation of forest landscape ecological vulnerability, supporting improved land management [29]. On the other hand, the morphological spatial pattern analysis method provides a more intuitive representation of the spatial aspects of forest landscape fragmentation [30]. The forest fragmentation model uses the moving window analysis technique to depict the fragmentation status of the study area. It quantifies FF by analyzing the characteristics of forest pixels and their neighboring pixel boundaries in the land cover data [31]. For example, in Jinwei Dong’s study, the forest fragmentation model is combined with 50-m forest cover data to reveal extensive details about FF [32]. Combining the moving window method with landscape feature indices can intuitively reveal the spatiotemporal changes in landscape fragmentation and support the analysis of drivers’ impacts [33]. For instance, in 2016, Alex Hagen-Zanker used a weighted moving window method to study the spatial variability of multiscale landscape patterns [34]. Similarly, in 2024, Jiaming Wang applied the moving window method, geographic detectors, land use dynamics, and transition matrices to explore landscape fragmentation and its driving forces in semi-arid ecologically fragile regions [35]. Landscape indexes reflect the characteristics of FF at a statistical scale but do not offer detailed spatial information.
In summary, while landscape metrics can reflect the overall characteristics of FF at a statistical scale, they lack spatial information and suffer from inconsistent metric selection, limiting their application in fragmentation assessment. Forest fragmentation models, although capable of quantitatively describing fragmentation features, require high-quality data and precise parameters, making them unsuitable for large-scale assessments. In contrast, the moving window method calculates landscape metrics within selected areas and generates raster maps, intuitively revealing spatial variability and patterns. However, this method struggles to capture the full complexity of fragmentation. Moreover, traditional studies often focus on static patterns, overlooking the dynamic nature of FF. Currently, dynamic analysis methods, such as index-based approaches and landscape evaluation models, combined with long-term land use and forest cover data, enable deeper analysis of landscape evolution. For example, Zhen Shiyong proposed the forest fragmentation composite index (FFCI) to assess dynamic fragmentation through spatial distribution patterns [36]. Similarly, Liu Shuhan used a landscape fragmentation model and dynamic change information to analyze land use transition trajectories [37]. Additionally, morphological spatial pattern analysis identifies key habitat patches and corridors, providing a more effective way to evaluate the impact of human activities on landscape fragmentation.
Yunnan Province, a critical ecological security barrier, has implemented multiple ecological restoration programs since 2000 to reduce FF and improve ecological integrity. However, the optimization process of Yunnan’s fragmented forest landscapes and the most effective restoration measures remain unclear. Our study revealed the spatiotemporal patterns and dynamics of forest fragmentation in Yunnan, identified key driving factors, and evaluated the impact of various ecological restoration projects. Using dynamic and static forest fragmentation indexes, morphological spatial pattern analysis, boosted regression trees, and partitioned statistical analyses, utilizing nearly 30 years of land use and socioeconomic data to address the following: (1) spatiotemporal patterns of FF and its dynamics; (2) key ecological restoration measures impacting FF; (3) regional variations in restoration effectiveness. This study reveals forest fragmentation dynamics, evaluates restoration efforts, and provides guidance for forest management and sustainable development in Yunnan and other ecologically fragile regions.
2. Materials and Methods
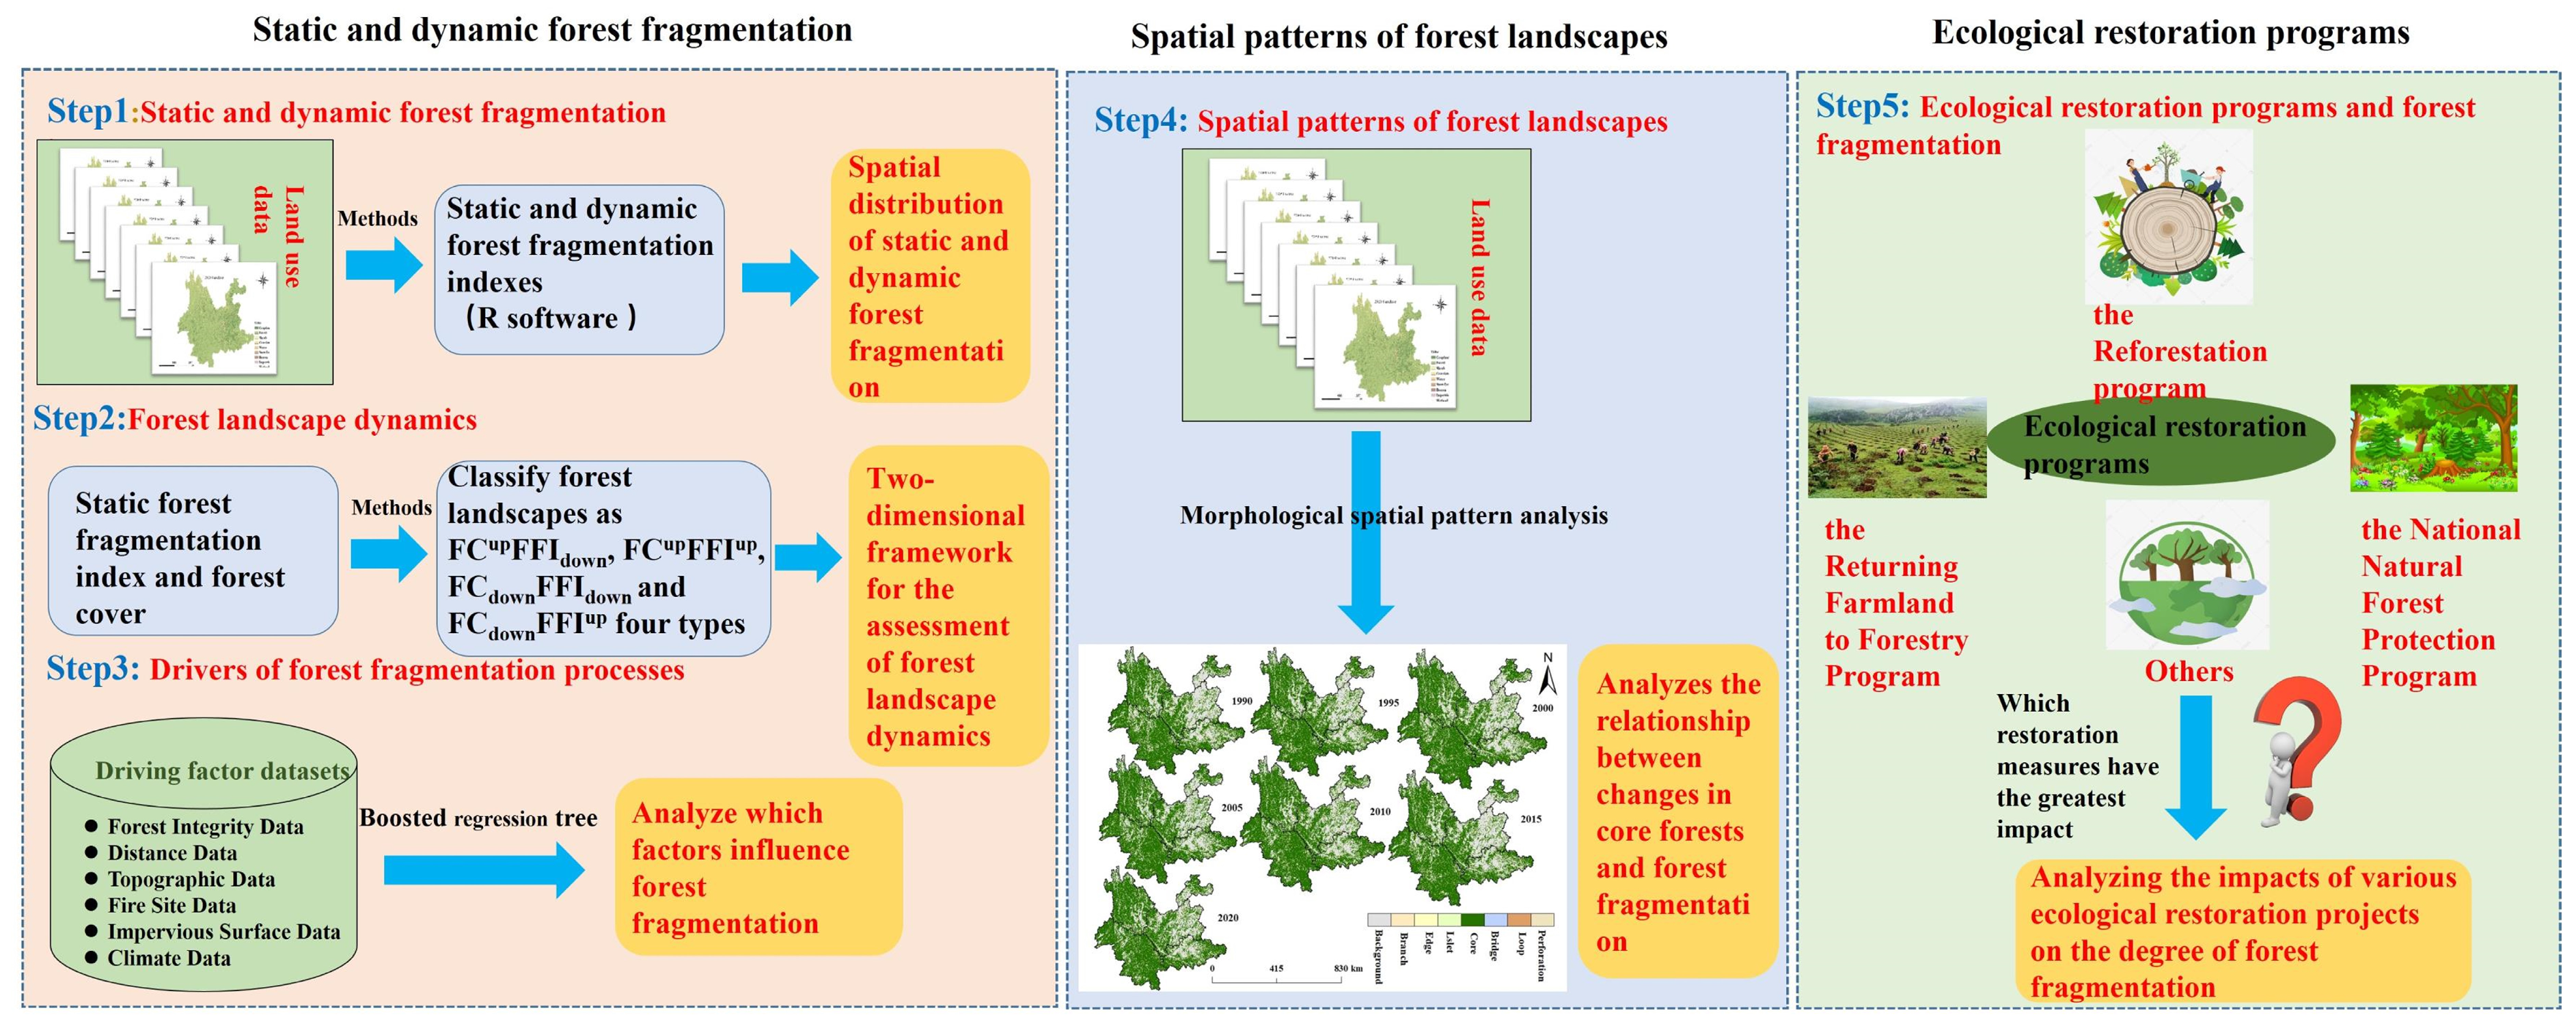
The research framework, as depicted in Figure 1, systematically investigates forest fragmentation (FF) in Yunnan from 1990 to 2020. First, we quantified the spatiotemporal distribution of FF using both static and dynamic fragmentation indices. Subsequently, an augmented regression tree model was employed to analyze 13 potential driving factors and identify the most significant contributors to FF. Morphological spatial pattern analysis (MSPA) was then utilized to characterize the spatial configuration of forest landscapes and assess their temporal changes, along with the underlying driving factors, over the past three decades. Finally, we evaluated the effectiveness of ecological restoration programs in mitigating FF, demonstrating their significant role in reducing forest fragmentation.

Figure 1.
Forest fragmentation research framework.
2.1. Study Area
Yunnan Province, located in southwest China, spans from 97°31′ E to 106°11′ E and from 21°8′ N to 29°15′ N (Figure 2). It features a tropical and subtropical monsoon climate with abundant rainfall and warm temperatures. The province’s topography slopes from higher elevations in the northeast to lower ones in the southwest, with altitudes ranging from 78 to 6445 m. The region receives 1200–1700 mm of annual rainfall and maintains an average temperature of 12–22 °C. Over the past 30 years, Yunnan’s forest cover has increased from 24.38% to 55.04%, ranking sixth nationwide. Its forest area of 21.06 million hectares is the second-largest in China [38]. From 1990 to 2020, Yunnan’s population grew from 36.97 million to 47.21 million [39], and its per capita GDP rose from 21,080 yuan to 51,877 yuan, reflecting significant economic growth [40].
Since 2000, Yunnan Province has implemented several ecological restoration programs, including the Returning Farmland to Forestry Program (RFFP), Slope Land Conversion Program (SLCP), and National Natural Forest Protection Program (NFPP) [41,42]. These programs have significantly increased forest cover by converting farmland to forests, with large-scale afforestation efforts by the government playing a crucial role [43,44]. The SLCP, part of the RFFP, is widely implemented in Yunnan’s rugged terrain to convert marginal farmland into forests [45]. The natural forest protection program includes measures to prohibit commercial logging, reforestation, and forestry reorganization [46]. These ecological restoration programs are crucial for understanding FF.
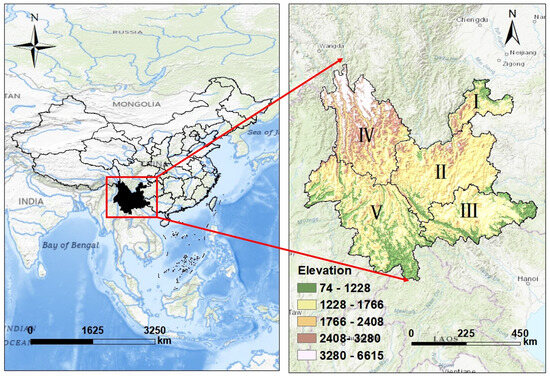
Figure 2.
Geographic overview and subdivisions of Yunnan Province. Zone I represents the northeastern part of Yunnan, Zone II the central part, Zone III, the southeastern part, Zone IV the northwestern part, and Zone V the southwestern part [47].
Figure 2.
Geographic overview and subdivisions of Yunnan Province. Zone I represents the northeastern part of Yunnan, Zone II the central part, Zone III, the southeastern part, Zone IV the northwestern part, and Zone V the southwestern part [47].

2.2. Data Sources
The main data used in this study were land use and driver analysis data. The land use data consisted of China’s annual 30 m land cover data from 1990 to 2022 [48], covering nine land types: farmland, forest, shrub, grassland, watershed, snow and ice, bare ground, impervious surface, and wetland. Driver data included climatic, topographic, distance, forest integrity, fire trail, and impervious surface data, as detailed in Table 1.

Table 1.
Data sources of driving factors.
2.3. Methods
2.3.1. Forest Landscape Metrics Related to Fragmentation
The edge effect, segregation effect, and patch size effect are essential features of FF, measurable by three landscape pattern metrics: edge density (ED), patch density (PD), and mean patch area (MPA). Their ecological significance is shown in Table 2. The forest landscape index and its ecological significance are as follows, calculated as below:
where is the total number of patches comprising the landscape of type ; A is the total landscape area. is the area of each patch in hectares, is the total side length in meters and a is the total landscape area in square meters.
Table 2.
Forest landscape index and its ecological significance.
These three landscape indexes were calculated using the “landscapemetrics (v2.2.1)” package in R (v4.3.2) software [51]. The calculations in R software were performed by first reclassifying the land use classification image into a binarization image (1 for forest and 0 for non-forest), which was later converted into a raster image for subsequent calculations.
2.3.2. Static and Dynamic Forest Fragmentation Indexes
A synthesized forest fragmentation index was obtained in ArcGIS10.8, and the FFI was calculated by normalization using a single fragmentation indicator. These indicators represent various aspects of FF, and normalizing them enables comparison across different years. The upper and lower limits of the landscape pattern indicators were first derived using the following formula to identify outliers.
where and denote the upper and lower limits of each landscape pattern index, respectively, and represent the first and third quartiles, respectively, and IQR denotes the interquartile range. This limit was then used as a standard to calculate a static forest fragmentation index at five-year intervals in order to make side-by-side comparisons of these data, after which they were normalized according to the following formula.
where is the result after normalization of ED, PD and MPA, taking values ranging from 0 to 1, is the original value of ED, PD and MPA, and and are the corresponding maximum and minimum values, respectively.
Finally, the three landscape pattern indicators were used together to construct the FF index (FFI).
where k is the specific year and is the static forest fragmentation index, which takes a value in the range of 0~1.
The dynamic FF index is obtained by using the difference between two adjacent years on the basis of the static forest fragmentation index, and the specific formula is shown below:
where ∆FFI calculates the dynamic forest fragmentation change over the 30-year period as a whole, refers to the dynamic forest fragmentation change at every five-year interval, and k is the specific year that needs to be calculated. The range of values for ΔFFI is from −1 to 1. Negative and positive values of ∆FFI denote a decrease and an increase in fragmentation, respectively.
2.3.3. Two-Dimensional Framework for the Assessment of Forest Landscape Dynamics
In this paper, a two-dimensional framework for evaluating the dynamics of forest landscapes [52], was used to classify forest landscapes as FCupFFIdown, FCupFFIup, FCdownFFIdown, and FCdownFFIup four types.
where A denotes the overall area of the study area and FA denotes the area of forest in the study area.
2.3.4. Identification of Forest Landscape Changes
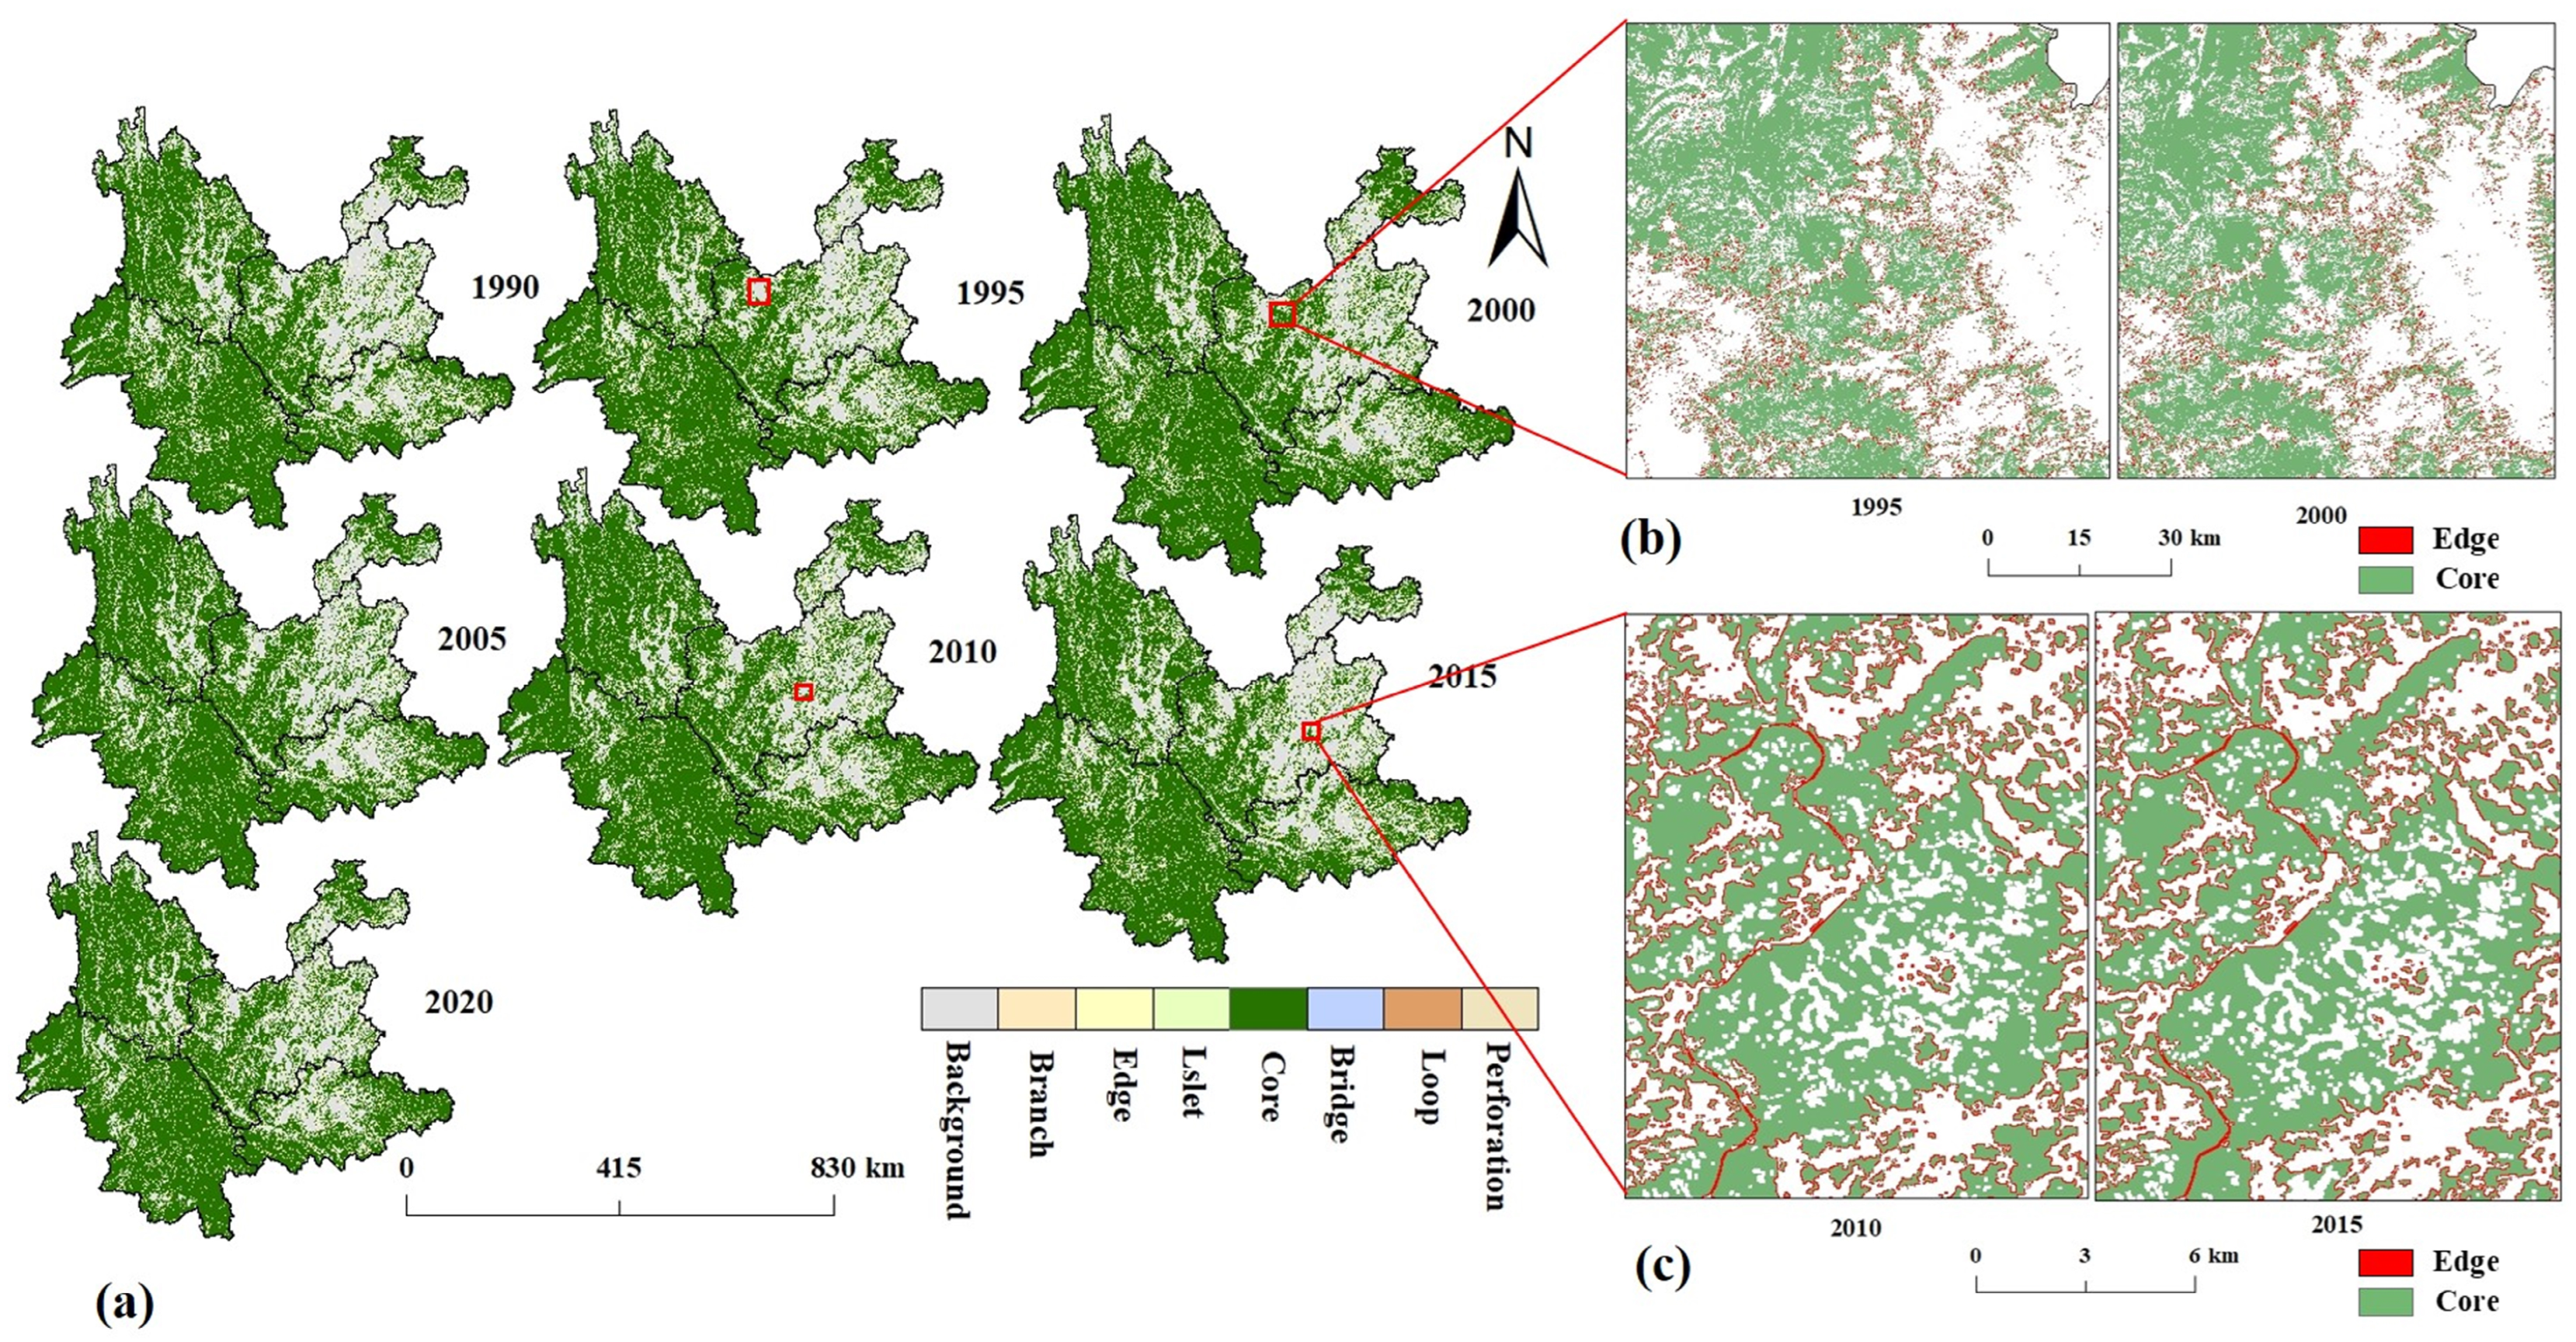
Morphological spatial pattern analysis (MSPA) proficiently identifies the spatial patterns of connecting features [53]. It is used to investigate forest expansion and loss, providing a more detailed explanation of changes in forest landscape patterns and patches (Figure 3). MSPA, based on morphological principles, divides the study area’s landscape into foreground (forest) and background (nonforest) for assessment, identification, and segmentation. This study used land-use data from 1990 to 2020 [48] to classify forest landscapes in the GUIDOS (v1.9.5) software (https://forest.jrc.ec.europa.eu/en/activities/lpa/gtb/, accessed on 1 January 2024) based on the green infrastructure theory, generating seven types of landscape maps with a 30-m spatial resolution, each spanning a five-year interval. Each type has specific ecological significance (Table 3). This method improves classification accuracy and provides a scientific basis for forest management and conservation strategies.
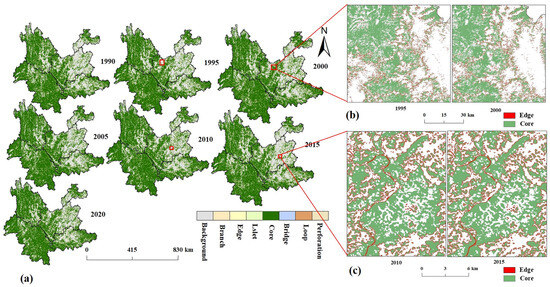
Figure 3.
Spatial distribution of forest landscapes. Where (a) is the spatial distribution of forested landscapes, (b) is local regions with distinctive marginal forest characteristics from 1995 to 2000, and (c) is local regions with distinctive marginal forest characteristics from 2010 to 2015.
Table 3.
Ecological meaning of landscape types based on MSPA.
2.3.5. Drivers of Forest Fragmentation Processes
The boosted regression tree (BRT) is a self-learning method based on the categorical regression tree algorithm (CART). The boosted regression tree model is used with the gbm function in the “generalized boosted regression model (gbm)” package in R (v4.3.2) software. The learning rate is set to 0.05, and each time, 50% of the data are extracted to be analyzed and 50% are used for training with 100 times of cross-validation; the training tree is chosen to be 10,000.
Due to the complex terrain in Yunnan Province, different regions have varying impacts on the degree of FF. Therefore, a zoning approach was adopted for discussing the driving factors [54], which was divided into five distinct regions (Figure 2).
3. Results
3.1. Spatiotemporal Pattern Changes of Forest Landscapes
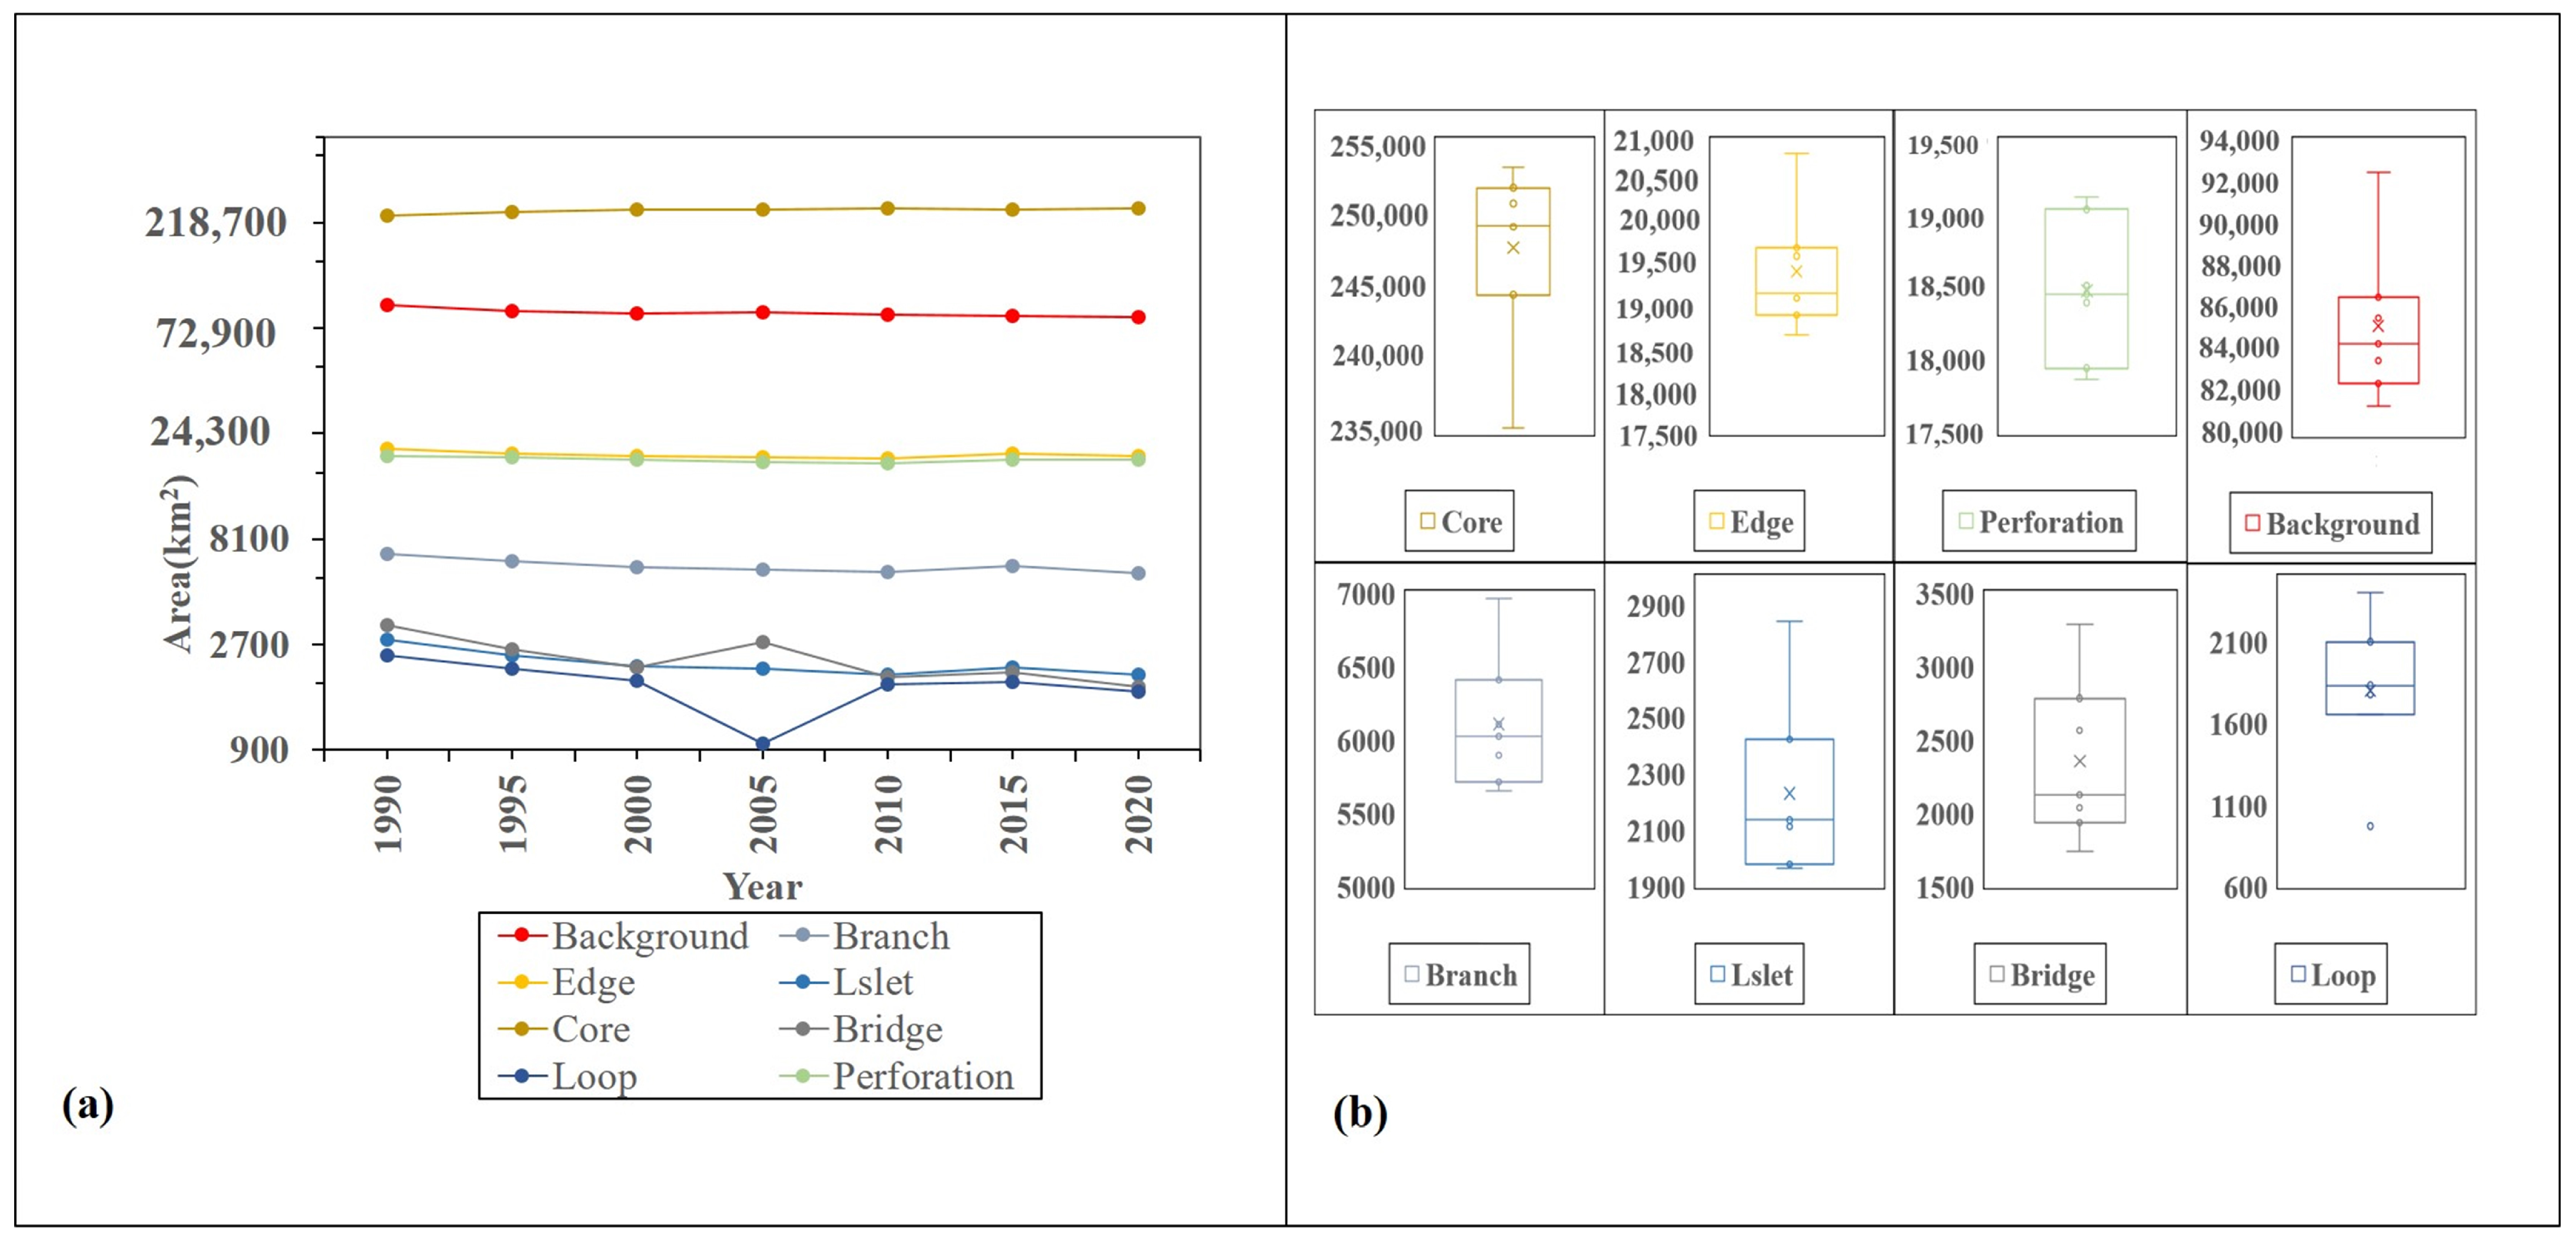
MSPA analysis reveals the spatial distribution of Yunnan’s forest landscape over 30 years (Figure 3) and the changes in area (Figure 4). MSPA analysis, based on land-use data, classifies forest landscapes into seven types. In Yunnan, land-use data from 1990 to 2020 helped distinguish forest patterns. Changes in the forest landscape were due to land-use changes, not image-acquisition technology or sensors. Thus, the changes in the area’s landscape patterns mainly reflect those of the seven forest-landscape types. Spatially, the core forest dominates, accounting for 61.4% of the area, with an average size of 247,632.84 km2. Southwest and northwest Yunnan are the most concentrated core forest regions. The central and northeastern areas have more fragmented patches with many edge areas (average area 19,430.87 km2). Perforation, as the third largest forest landscape (average area 18,470.51 km2), is mainly distributed in the southwest and northwest, serving as one of the primary internal fragmentation methods and is less common in central. From 1995 to 2000, edge forest areas in central Yunnan increased (Figure 3b), and from 2010 to 2015, forest loss occurred in central areas (Figure 3c). Between 1990 and 2020, the area of forest landscape types showed opposing trends; the core forest area peaked in 2020 (253,143.26 km2) and was smallest in 1990 (235,314.85 km2). In contrast, the edge forest area was largest in 1990 (20,837.05 km2) and smallest in 2010 (18,672.79 km2). The area of perforation also followed a similar trend, the largest in 1990 at 19,111.79 km2 and the lowest in 2000 at 17,864.13 km2. This change suggests enhanced forest interior filling and natural regeneration during this period, improving forest continuity and ecological stability. Other forest landscape types (branch, islet, bridge) reached their maximum in 1990 and minimum in 2020. In 2005, the loop landscape area reached its smallest size (968.4675 km2). This was mainly because core areas expanded, squeezing edge zones and turning loop and other edge types into core types. At the same time, forest expansion connected isolated patches, reducing fragmentation. Therefore, the 2005 loop area drop was likely because these processes linked small, isolated loop areas to larger forest patches, changing them into other landscape types.
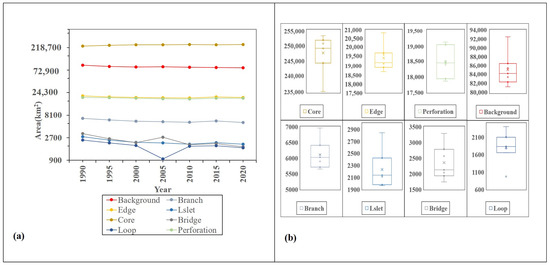
Figure 4.
Area of forested landscapes. Where (a) is the change in area and (b) is the mean and extreme values.
3.2. The Results and Potential Causes of Static and Dynamic Forest Fragmentation
3.2.1. Results of Static Forest Fragmentation
The fragmentation of forests can be represented by the forest fragmentation index (FFI) (Figure 5). Our study classifies forest fragmentation (FF) into five levels using the mean standard deviation method: extremely low (0–0.2), low (0.2–0.4), moderate (0.4–0.6), high (0.6–0.8), and extremely high (0.8–1). Areas with high and extremely high fragmentation are mainly in the northeast, southeast, and central regions; moderate fragmentation is predominantly in the southwest and northwest; while low and extremely low fragmentation occurs in southwestern areas like the Dai Autonomous Prefectures of Xishuangbanna and Dehong. Spatially, eastern regions have higher FF levels than western regions, with the southwest having the lowest. From 1990 to 2000, FF was low in the southern southwest and northern northwest but high in the central and northeast regions. From 2000 to 2020, the southwest had the lowest FF levels, while the central region had the highest; in 2015, the southeastern region had the highest level of FF. To better assess regional FF degrees, the average FFI for each region was calculated (Table 4). The data shows that Qujing City has the highest degree of fragmentation (0.762815286), and the Dai Autonomous Prefecture of Xishuangbanna has the lowest (0.320616429), with FF in central and eastern Yunnan generally being higher than in the western regions.
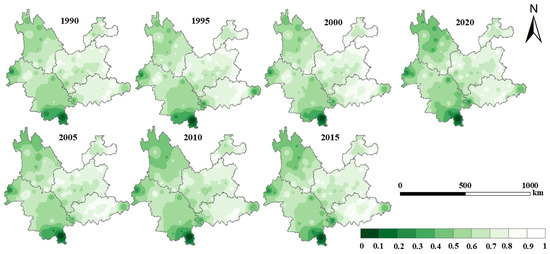
Figure 5.
Static FFI results.
Table 4.
Average FFI values by city from 1990 to 2020.
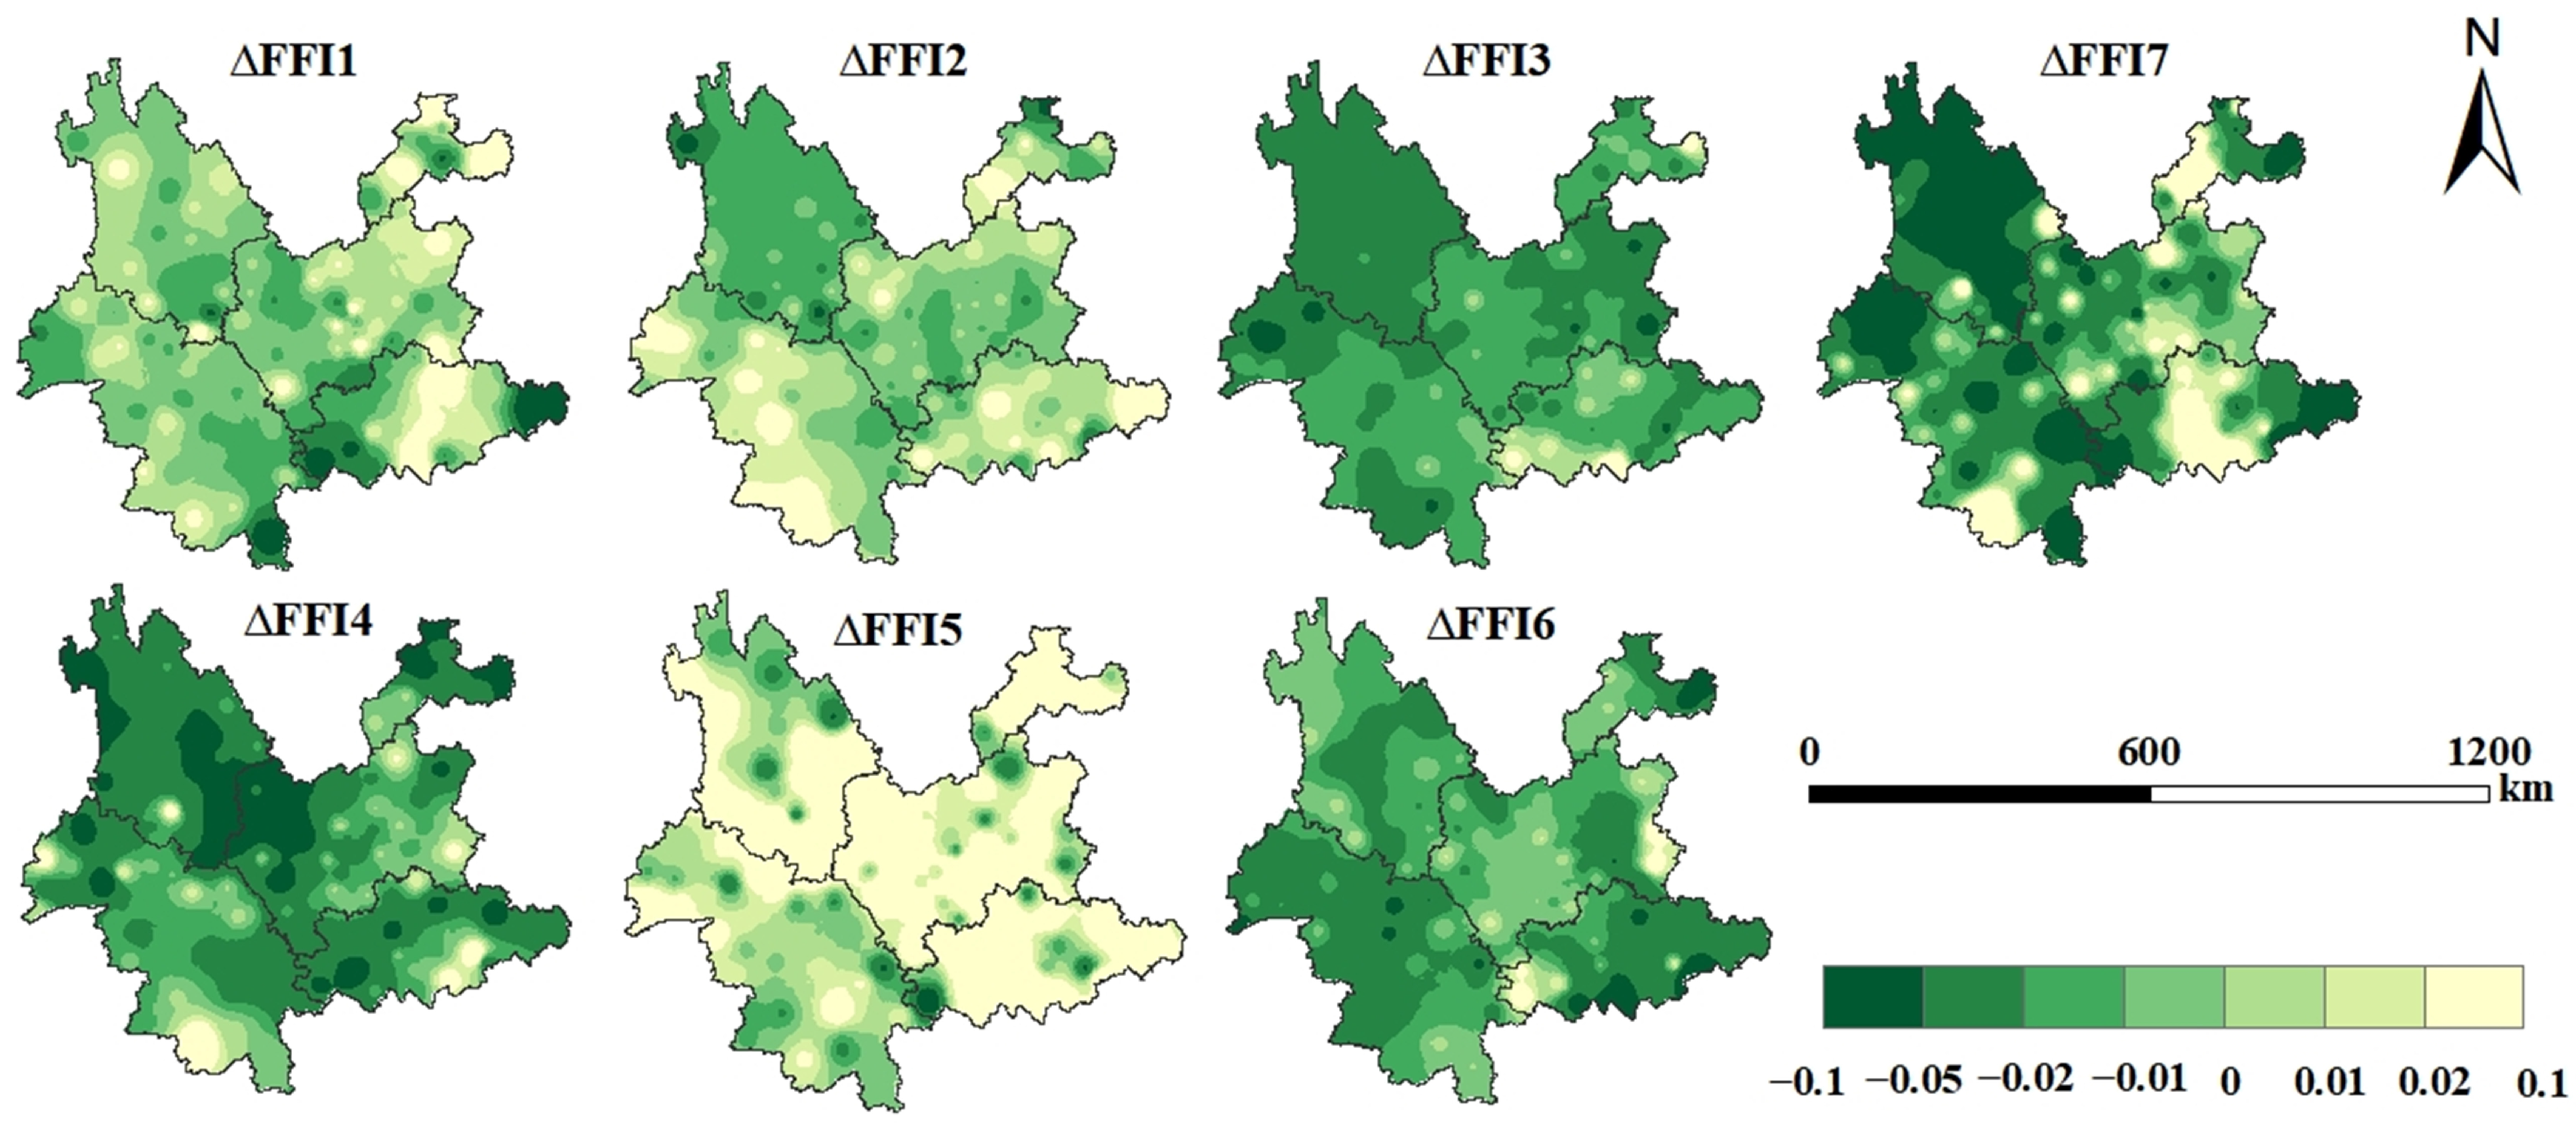
3.2.2. Results of Dynamic Forest Fragmentation
While the static FFI does not account for dynamic changes in forest landscapes, the dynamic FFI provides a more accurate representation of the FF process. The change ΔFFI change reflects the variation in FF over a five-year interval (Figure 6). Geographically, the northwest region witnesses the most remarkable FF changes, while the southwest sees the least. Temporally, the period from 1990 to 1995 experienced the most drastic changes in FF. However, only the interval from 2015 to 2020 saw an increase in fragmentation compared to other years. FF has generally declined over the past three decades, particularly in the northwest. A positive dynamic FFI value signifies increased fragmentation, while a negative value signifies a decrease. Results show that before 2000, there were more positive FFI values than negative ones, suggesting that the degree of FF was intensifying. From 2010 to 2015, mostly negative FFI values indicate a sharp FF reduction. From 1990 to 2020, FF generally decreased across Yunnan, though some central, southeastern, and southwestern areas had ΔFFI values above 0.

Figure 6.
Dynamic FFI results.
3.2.3. Result of Driving Factor Analysis
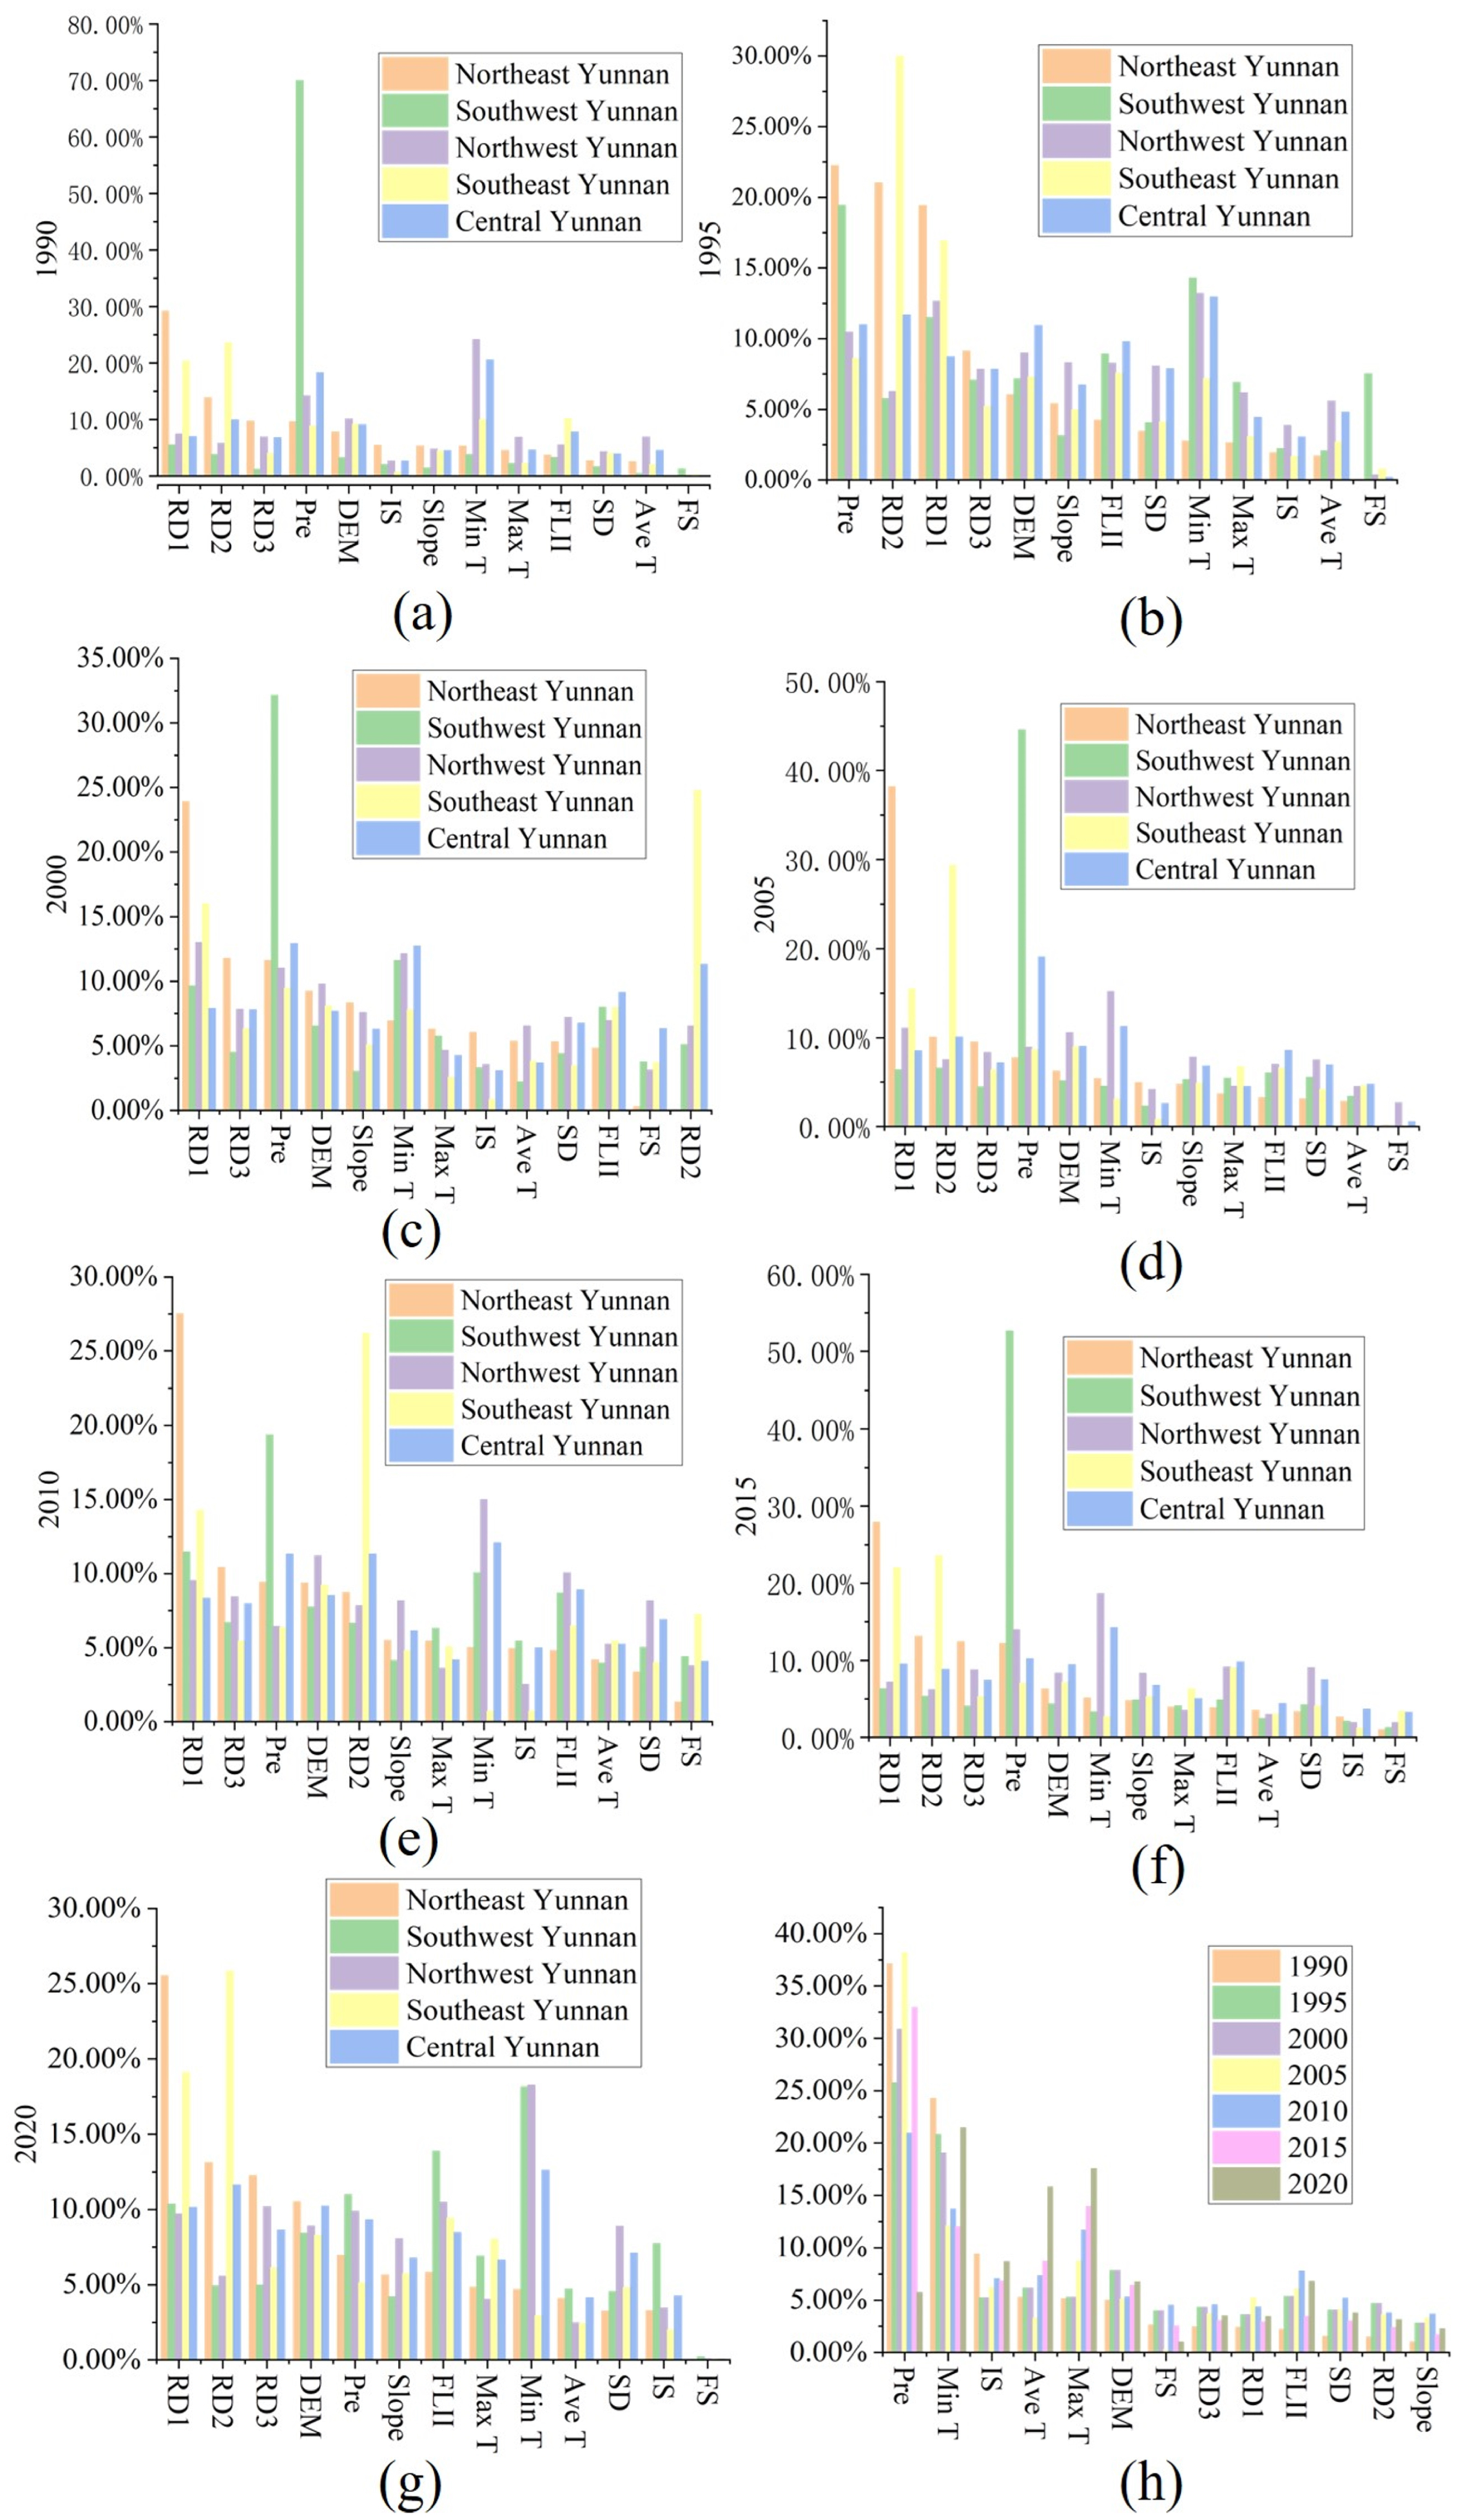
To explore the main causes affecting forest fragmentation, we selected 13 influencing factors and analyzed them as driving factors using the augmented regression tree method (Figure 7). We found that on the regional scale, from 1990 to 2020, the climate was the primary significant factor impacting FF (62.23%), whereas topographical factors had the least influence (8.84%). Given the diverse natural conditions of Yunnan Province, local analyses revealed varying dominant factors. Locally, the predominant driving factors differed: in the northeastern, it was the proximity to roads (27.61%); in the southwestern, precipitation levels (35.60%); in the northwestern, the minimum temperature (16.65%); in the southeastern, the distance to settlements (26.19%); and in the central, both the minimum temperature (13.78%) and precipitation (13.16%) were influential. Influencing factors varied by region over time. Between 1990 and 2020, the main factors influencing FF in Yunnan’s regions changed. In the northeast, distance to roads was the primary factor in 1990 and 2000, while precipitation dominated in 1995 and 2015. In the southwest, precipitation consistently remained the dominant factor. The northwest and central regions were mainly influenced by minimum temperature in most years, with precipitation as the primary factor in the central region only in 2000. In the southeast, distance to settlements influenced most years, except in 2000 when distance to roads became more significant. By 2020, the main factor in the northeast shifted to distance to roads, while in the southwest, it was minimum temperature. In the northwestern, southeastern, and central regions, minimum temperature was the primary influence.
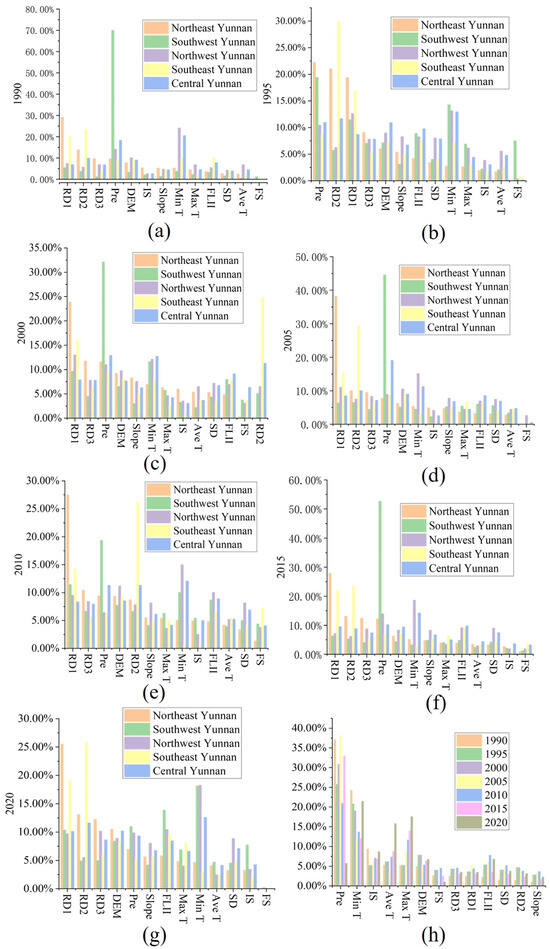
Figure 7.
Driver factor analysis results. Here, (a–g) are the results of driving factor analysis in different regions of Yunnan Province from 1990 to 2020, and (h) is the overall driving factor of Yunnan Province in the past 30 years. Where RD1—Road distance, RD2—Residential distance, RD3—River distance, Pre—Precipitation, DEM—Digital elevation model, IS—Impervious surface, Min T—Minimum temperature, Max T—Maximum temperature, FLII—Forest landscape integrity index, SD—Slope direction, Ave T—Average temperature, FS—Fire site.
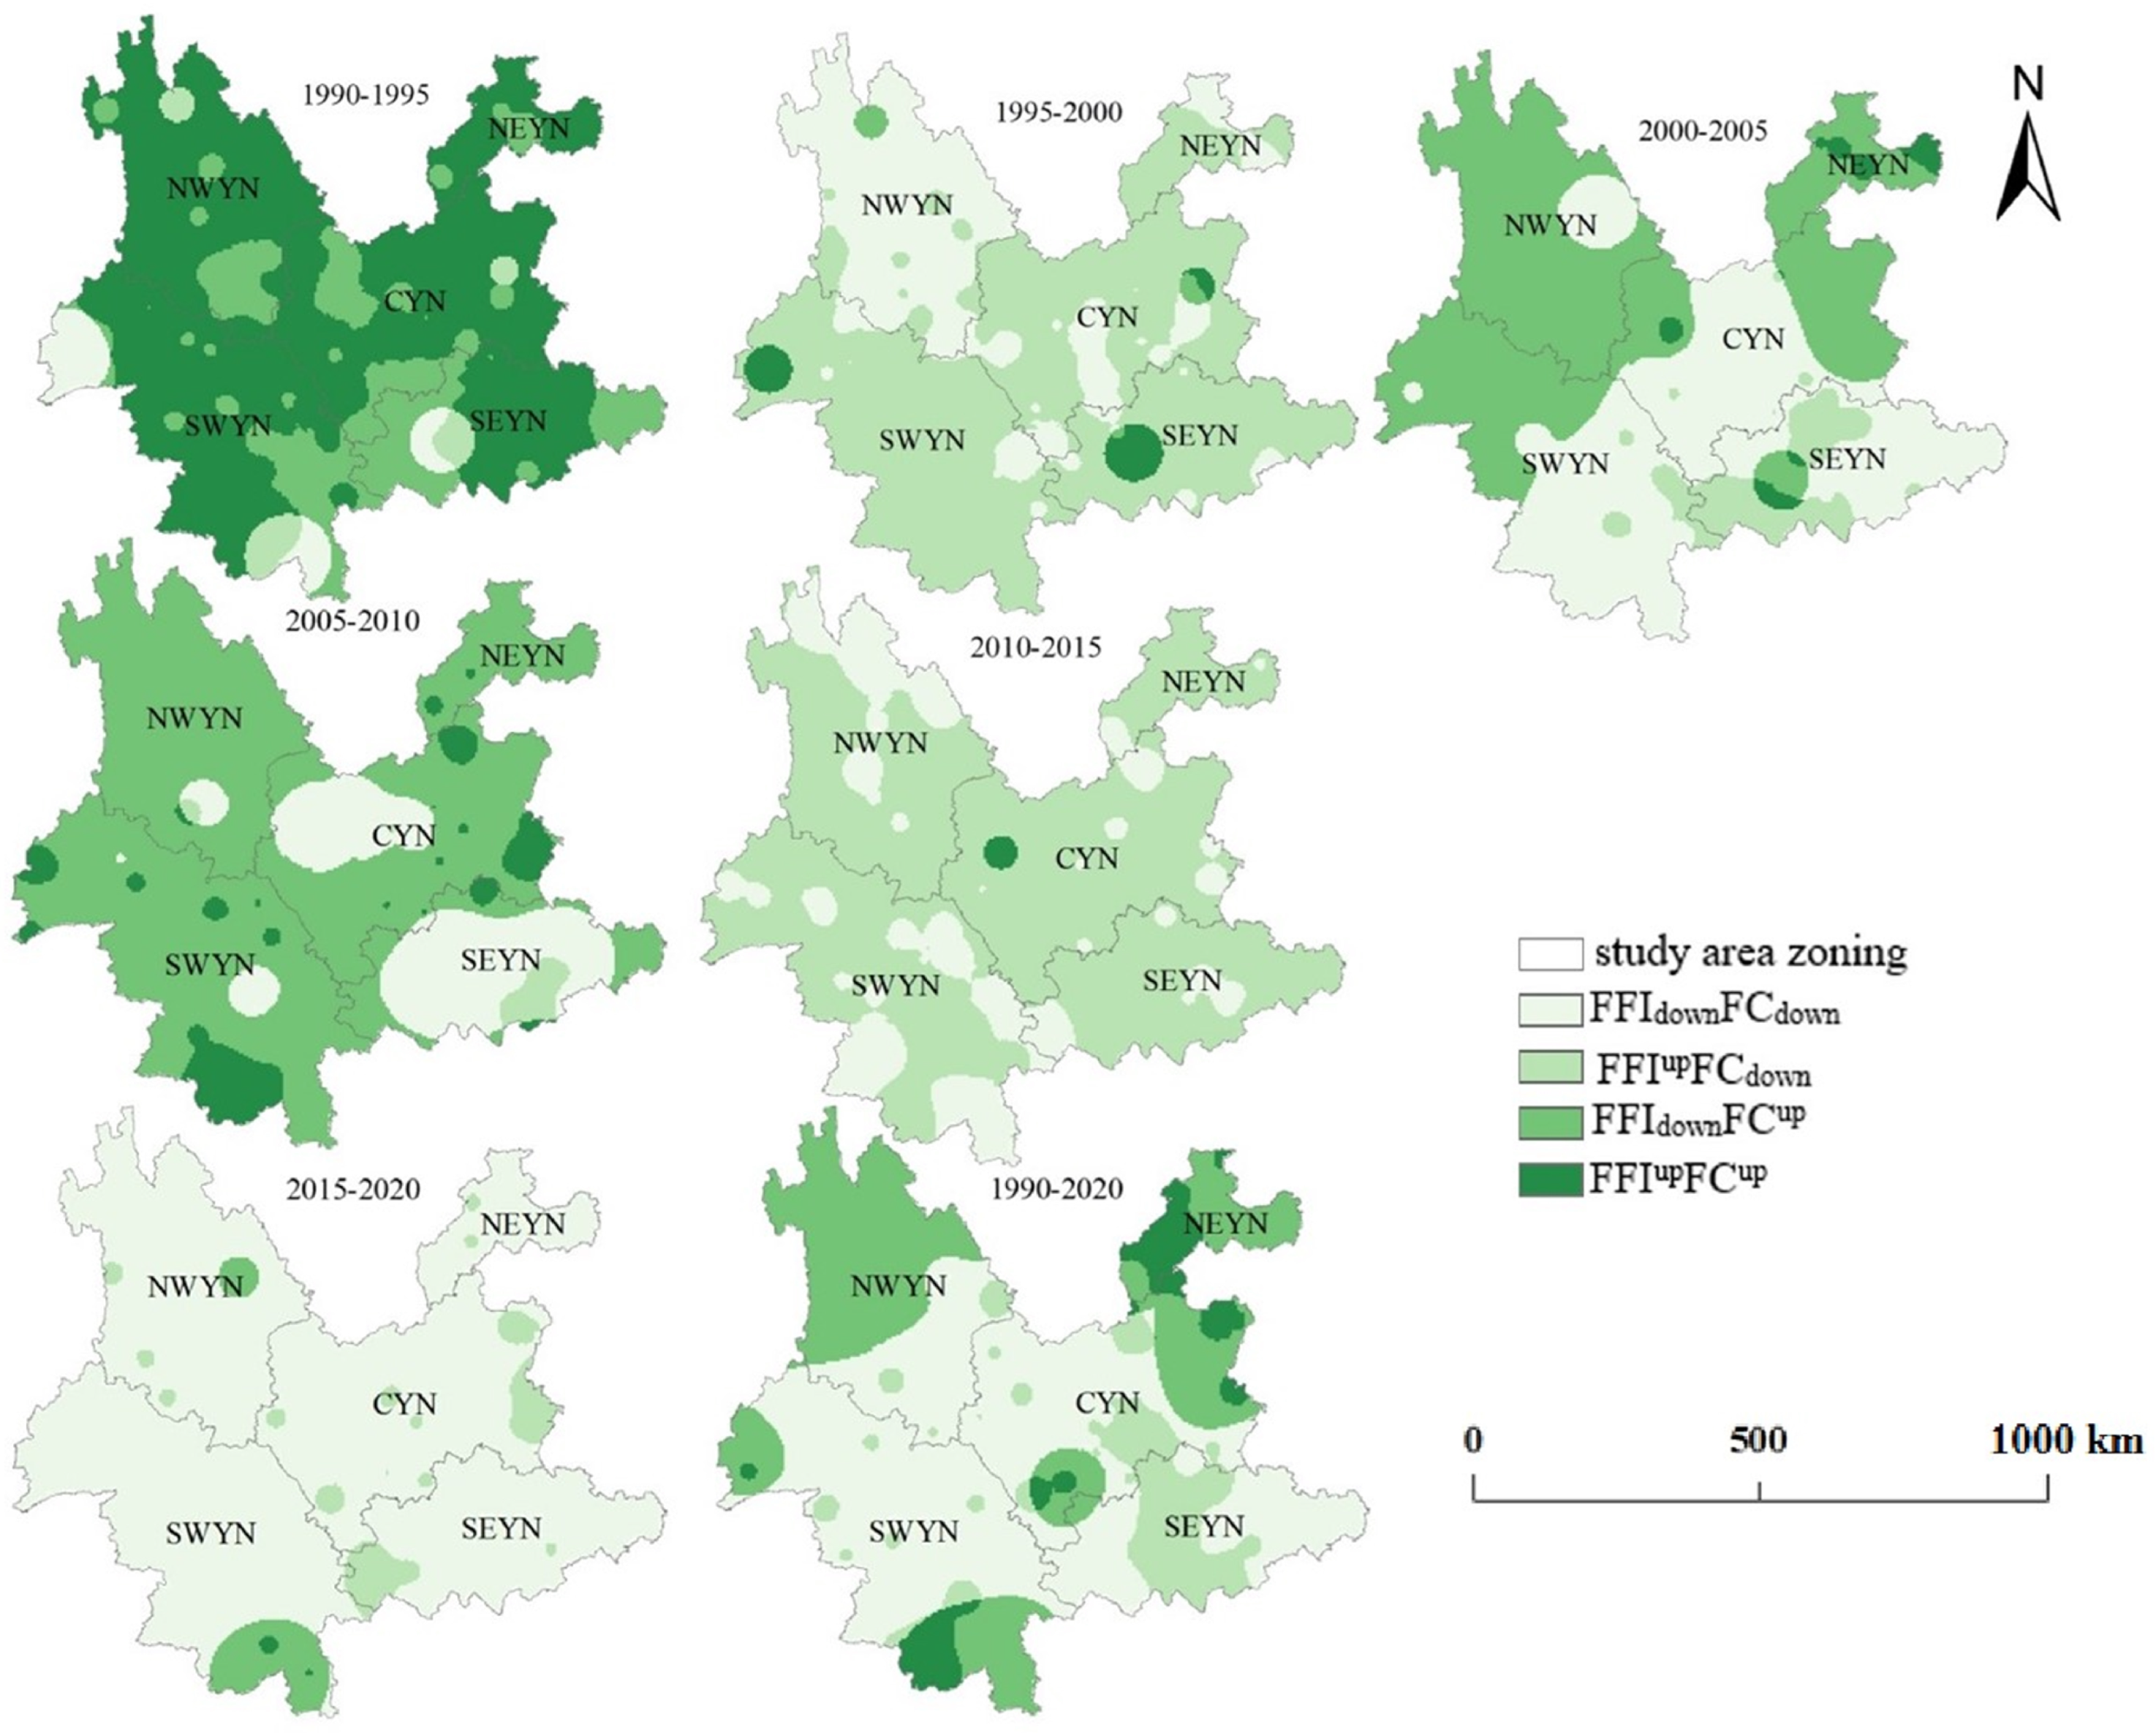
3.3. A Two-Dimensional Framework for the Assessment of Forest Landscape Dynamics
To gain a deeper understanding and assess the temporal dynamics of forest landscapes, our study used a two-dimensional analytical framework (Figure 8). Our results reveal that, in terms of time series, between 1990 and 1995, both forest fragmentation and cover showed an upward trend (), making up 71.05% and seen across the province. However, during the period from 1995 to 2000, the predominant pattern was (67.19%), primarily distributed in the southeastern, southwestern, central regions, and southern northeast regions. Concurrently, the northwestern region was mainly characterized by the pattern (29.23%). From 2000 to 2005, the northwestern, northeastern, and northern parts of the southeastern regions of Yunnan primarily displayed the pattern (49.67%), but the southeastern and central regions were mainly characterized by the pattern (41.08%). From 2005 to 2010, the pattern became the main pattern (73.71%), although the southwestern and some central regions continued to exhibit the pattern (17.72%). From 2010 to 2015, the pattern once again became the leading trend (78.28%). From 2015 to 2020, the pattern became the main pattern (90.50%). Over 30 years, landscape dynamics showed that the northern parts of the northwestern and northeastern regions, along with the eastern central region and the southern part of the southeastern region, mainly exhibited the pattern (29.98%), but the pattern still held a significant proportion across the province (52.10%).
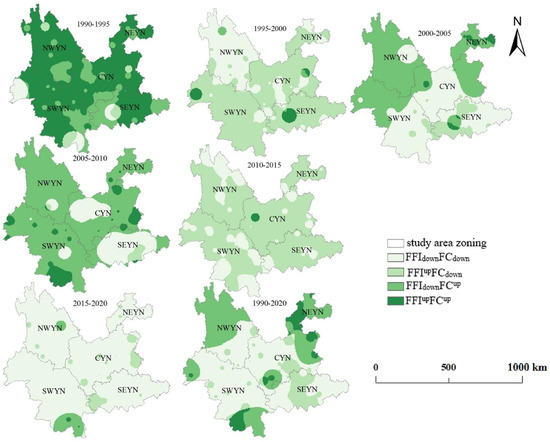
Figure 8.
Spatial distribution of forest landscape dynamic pattern.
3.4. Effects of Different Ecological Restoration Programs on Forest Area
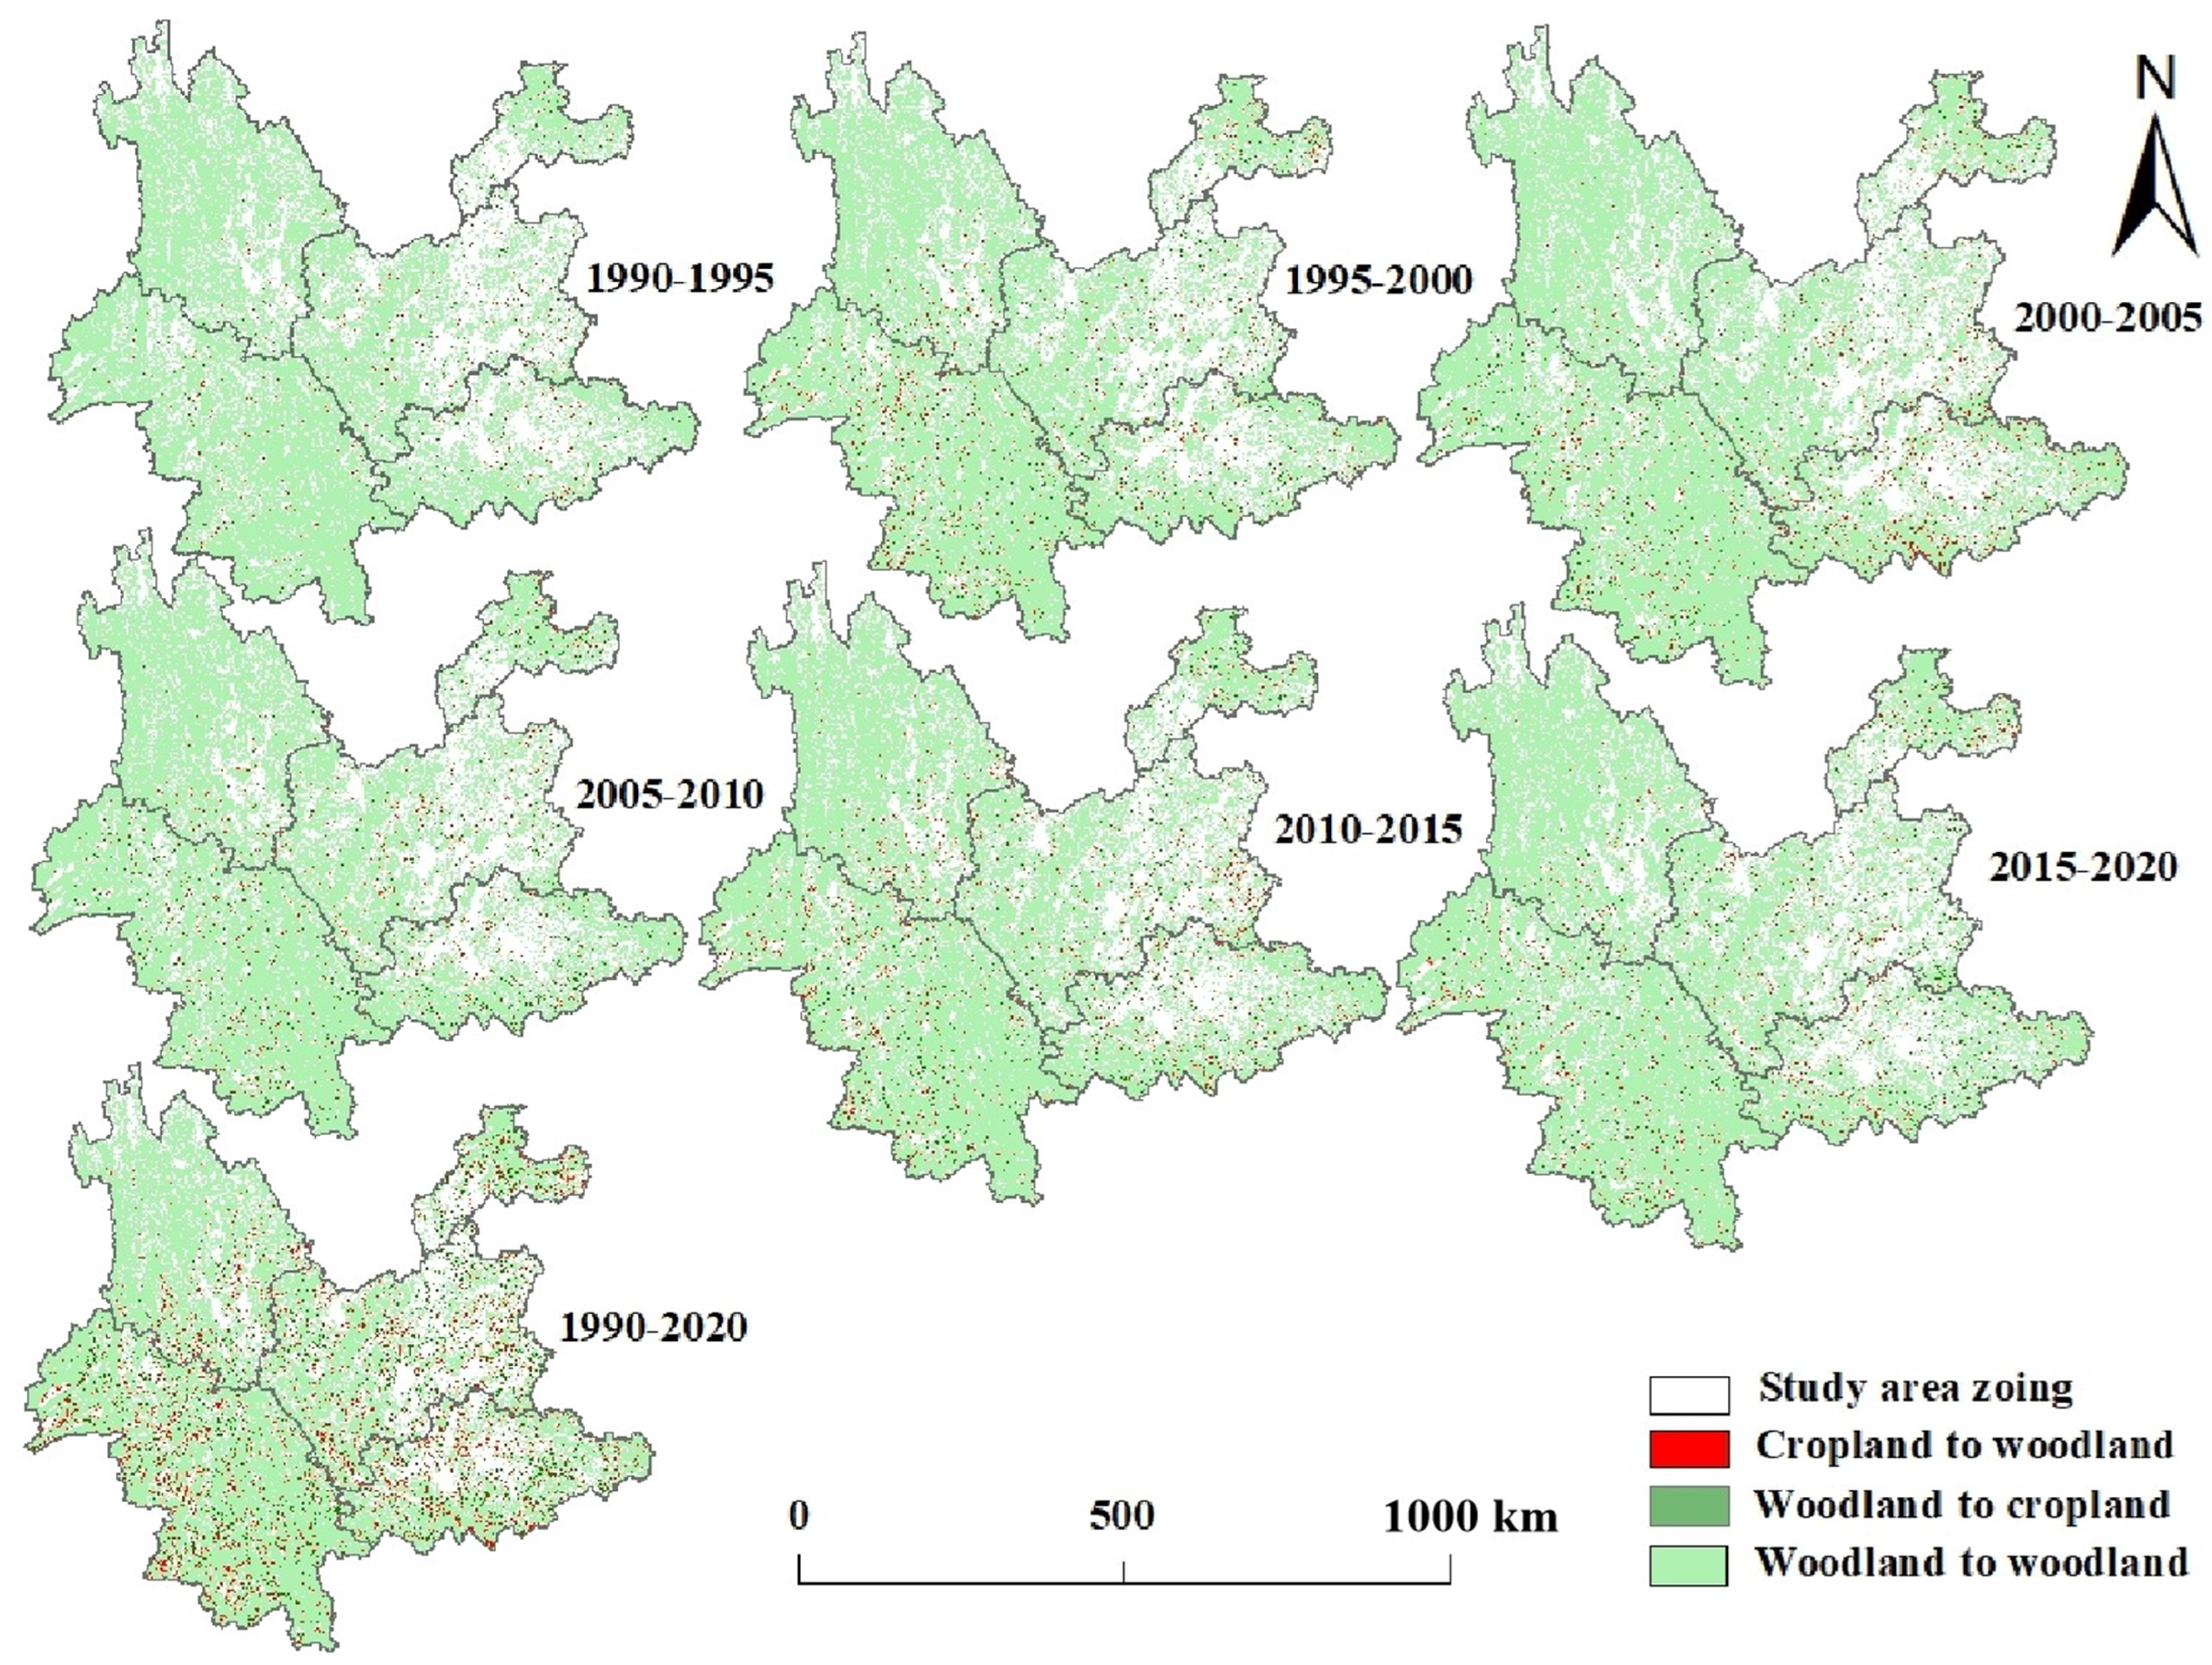
Land-use transition analysis identifies the key drivers of forest fragmentation (FF) (Figure 9 and Figure 10). Over 30 years, significant changes in cropland and forest land have occurred, with cropland changes covering 17,254.5 km2 and woodland changes reaching 234,087 km2. These changes are closely linked to the policies of returning farmland to forest and afforestation. Particularly between 2000 and 2005, there was a notable increase in the conversion of cropland to forest land. The policy of returning farmland to forest was most effective in the southwest and less so in the northwest. Forest land conversions were also most frequent in the southwestern region and least in the central region, especially in the central city cluster area. Overall, the southwestern region showed the most significant changes in the conversion of farmland back to forest and forest land, effectively promoting an increase in forest area. However, urban development in the central region limited the conversion of impervious surfaces to forest land, restricting the improvement of forest coverage.

Figure 9.
Spatial distribution of land-use change, mainly showing the transformation between cropland and forest land.
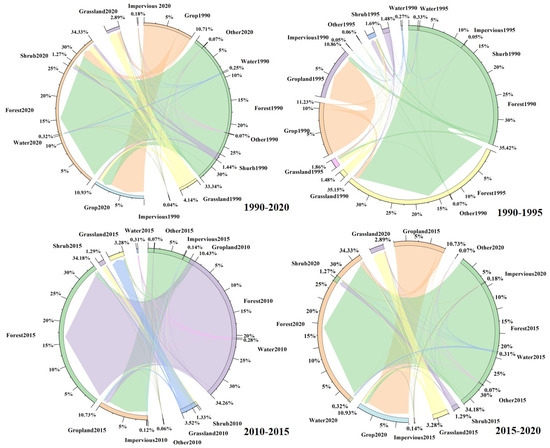
Figure 10.
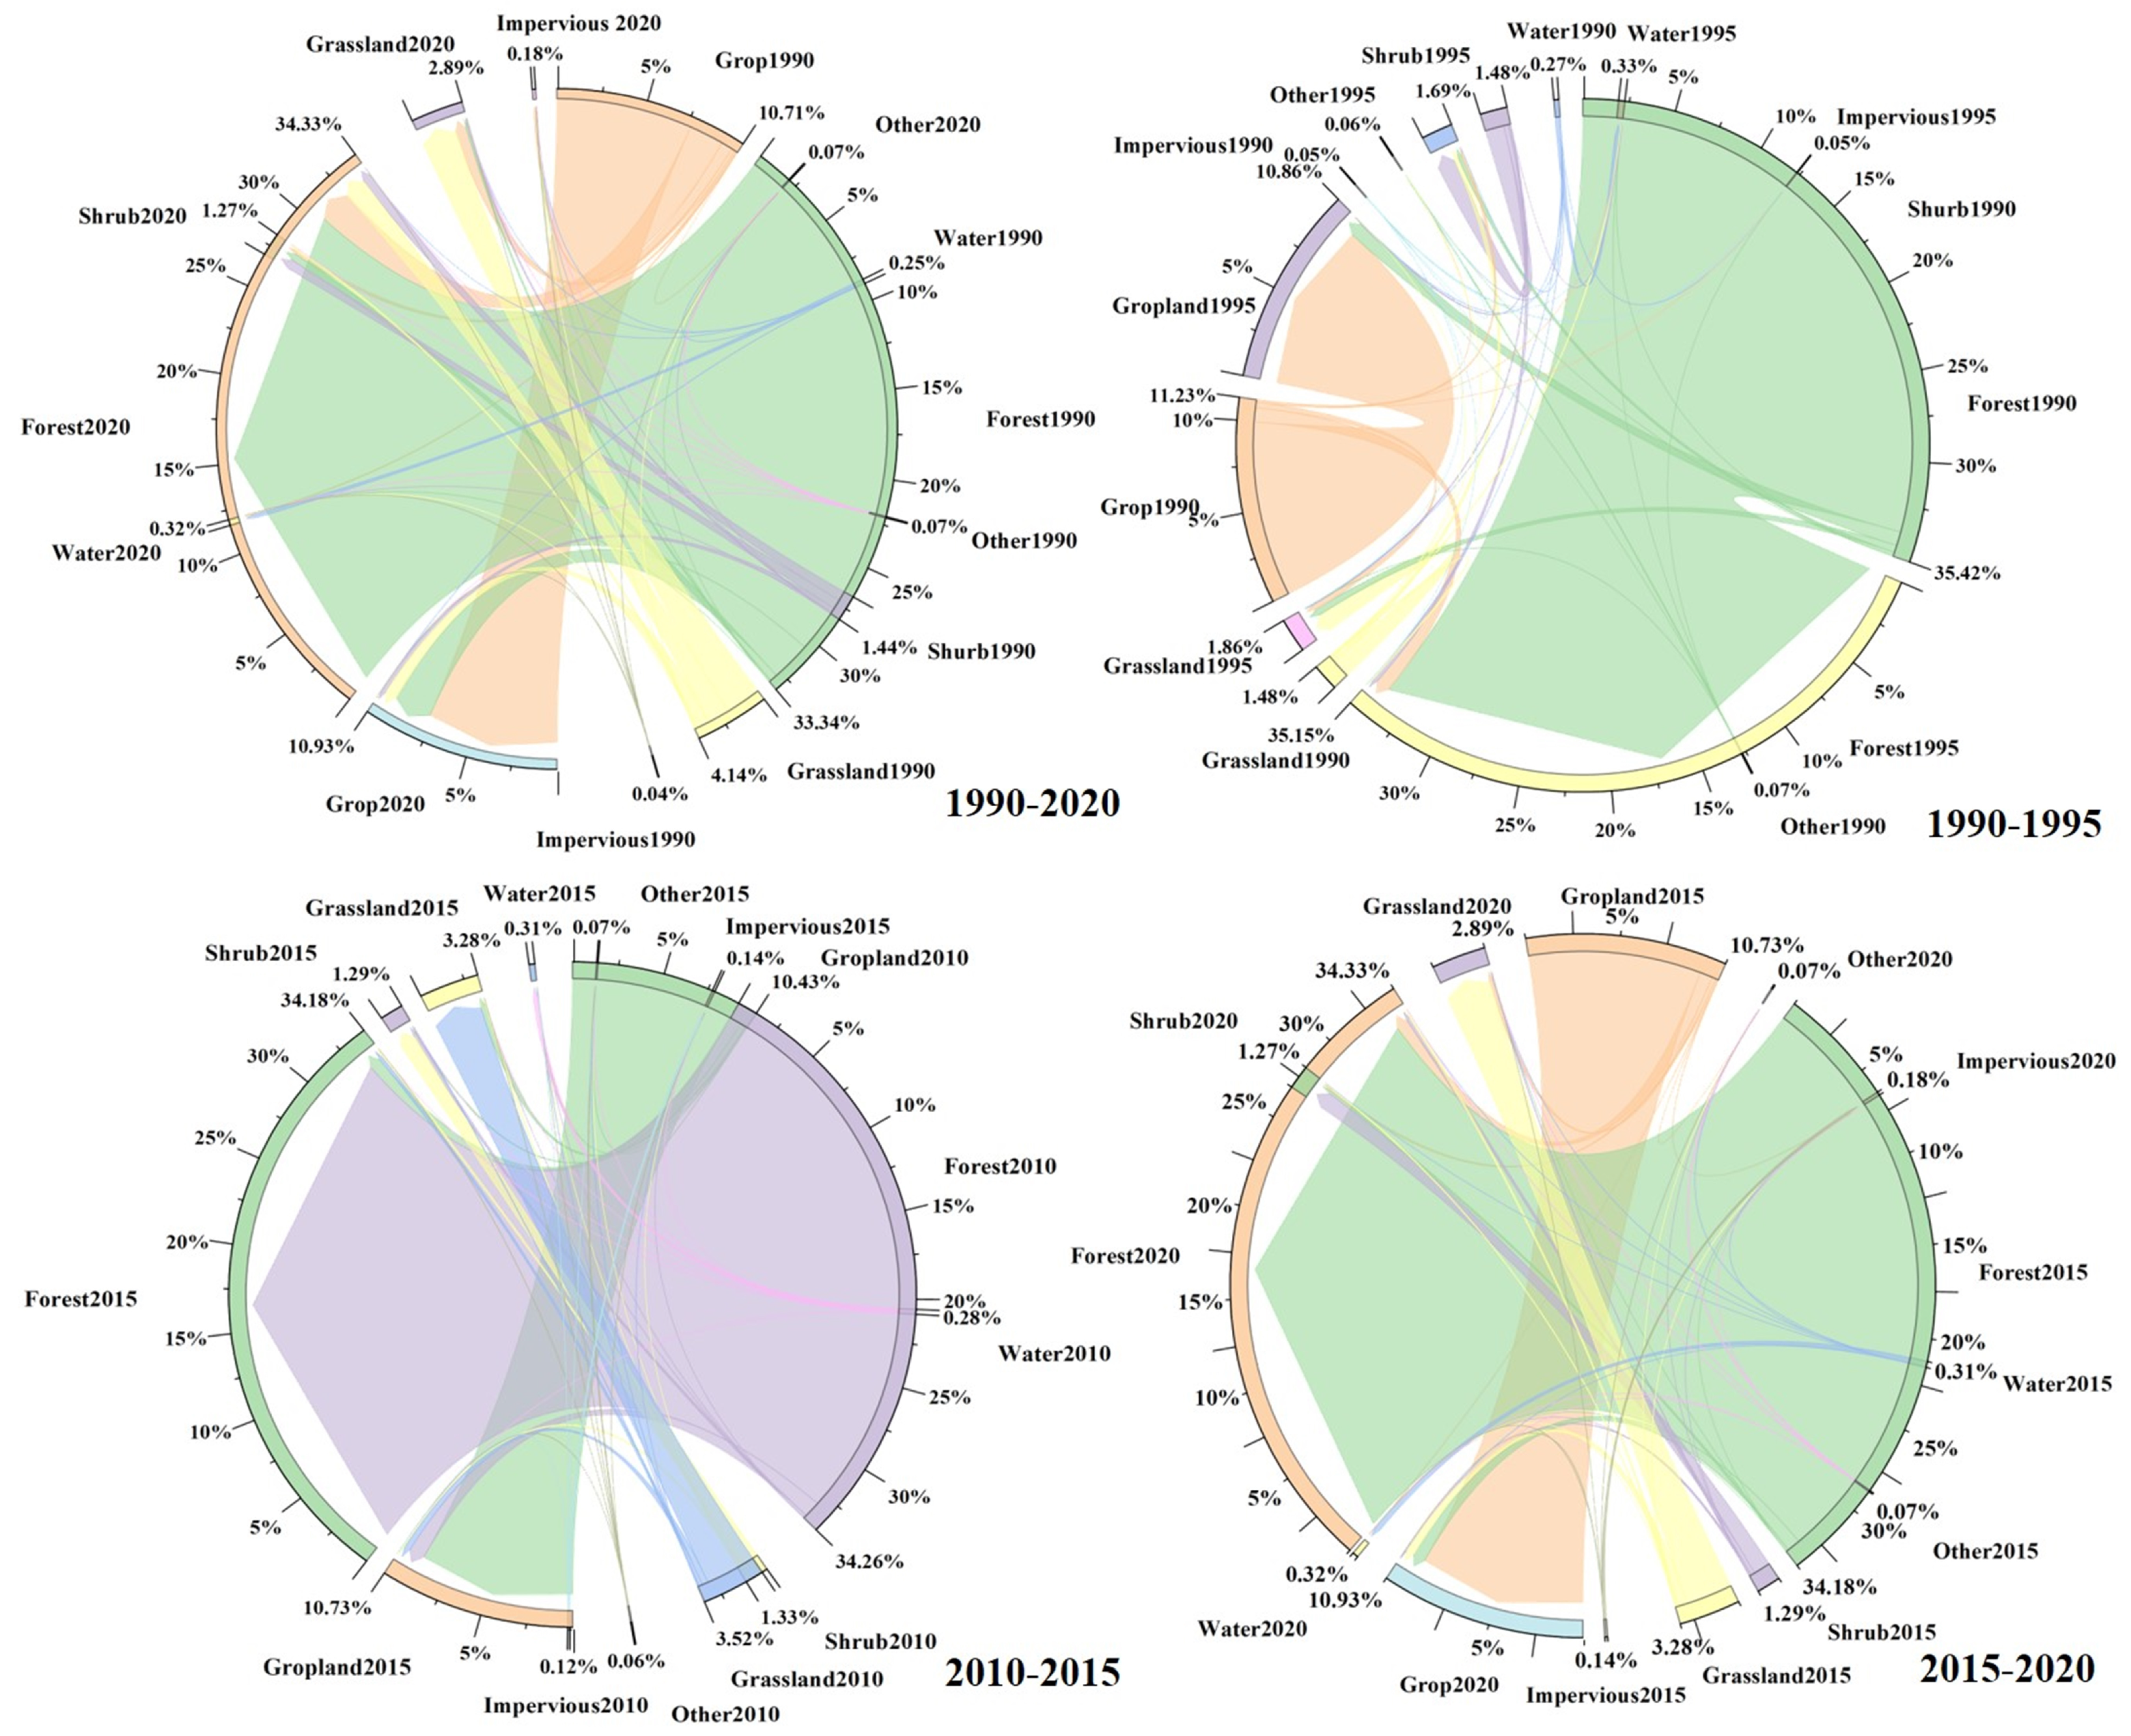
Land-use transfer matrix 1990–2020, where the years with significant changes are selected.
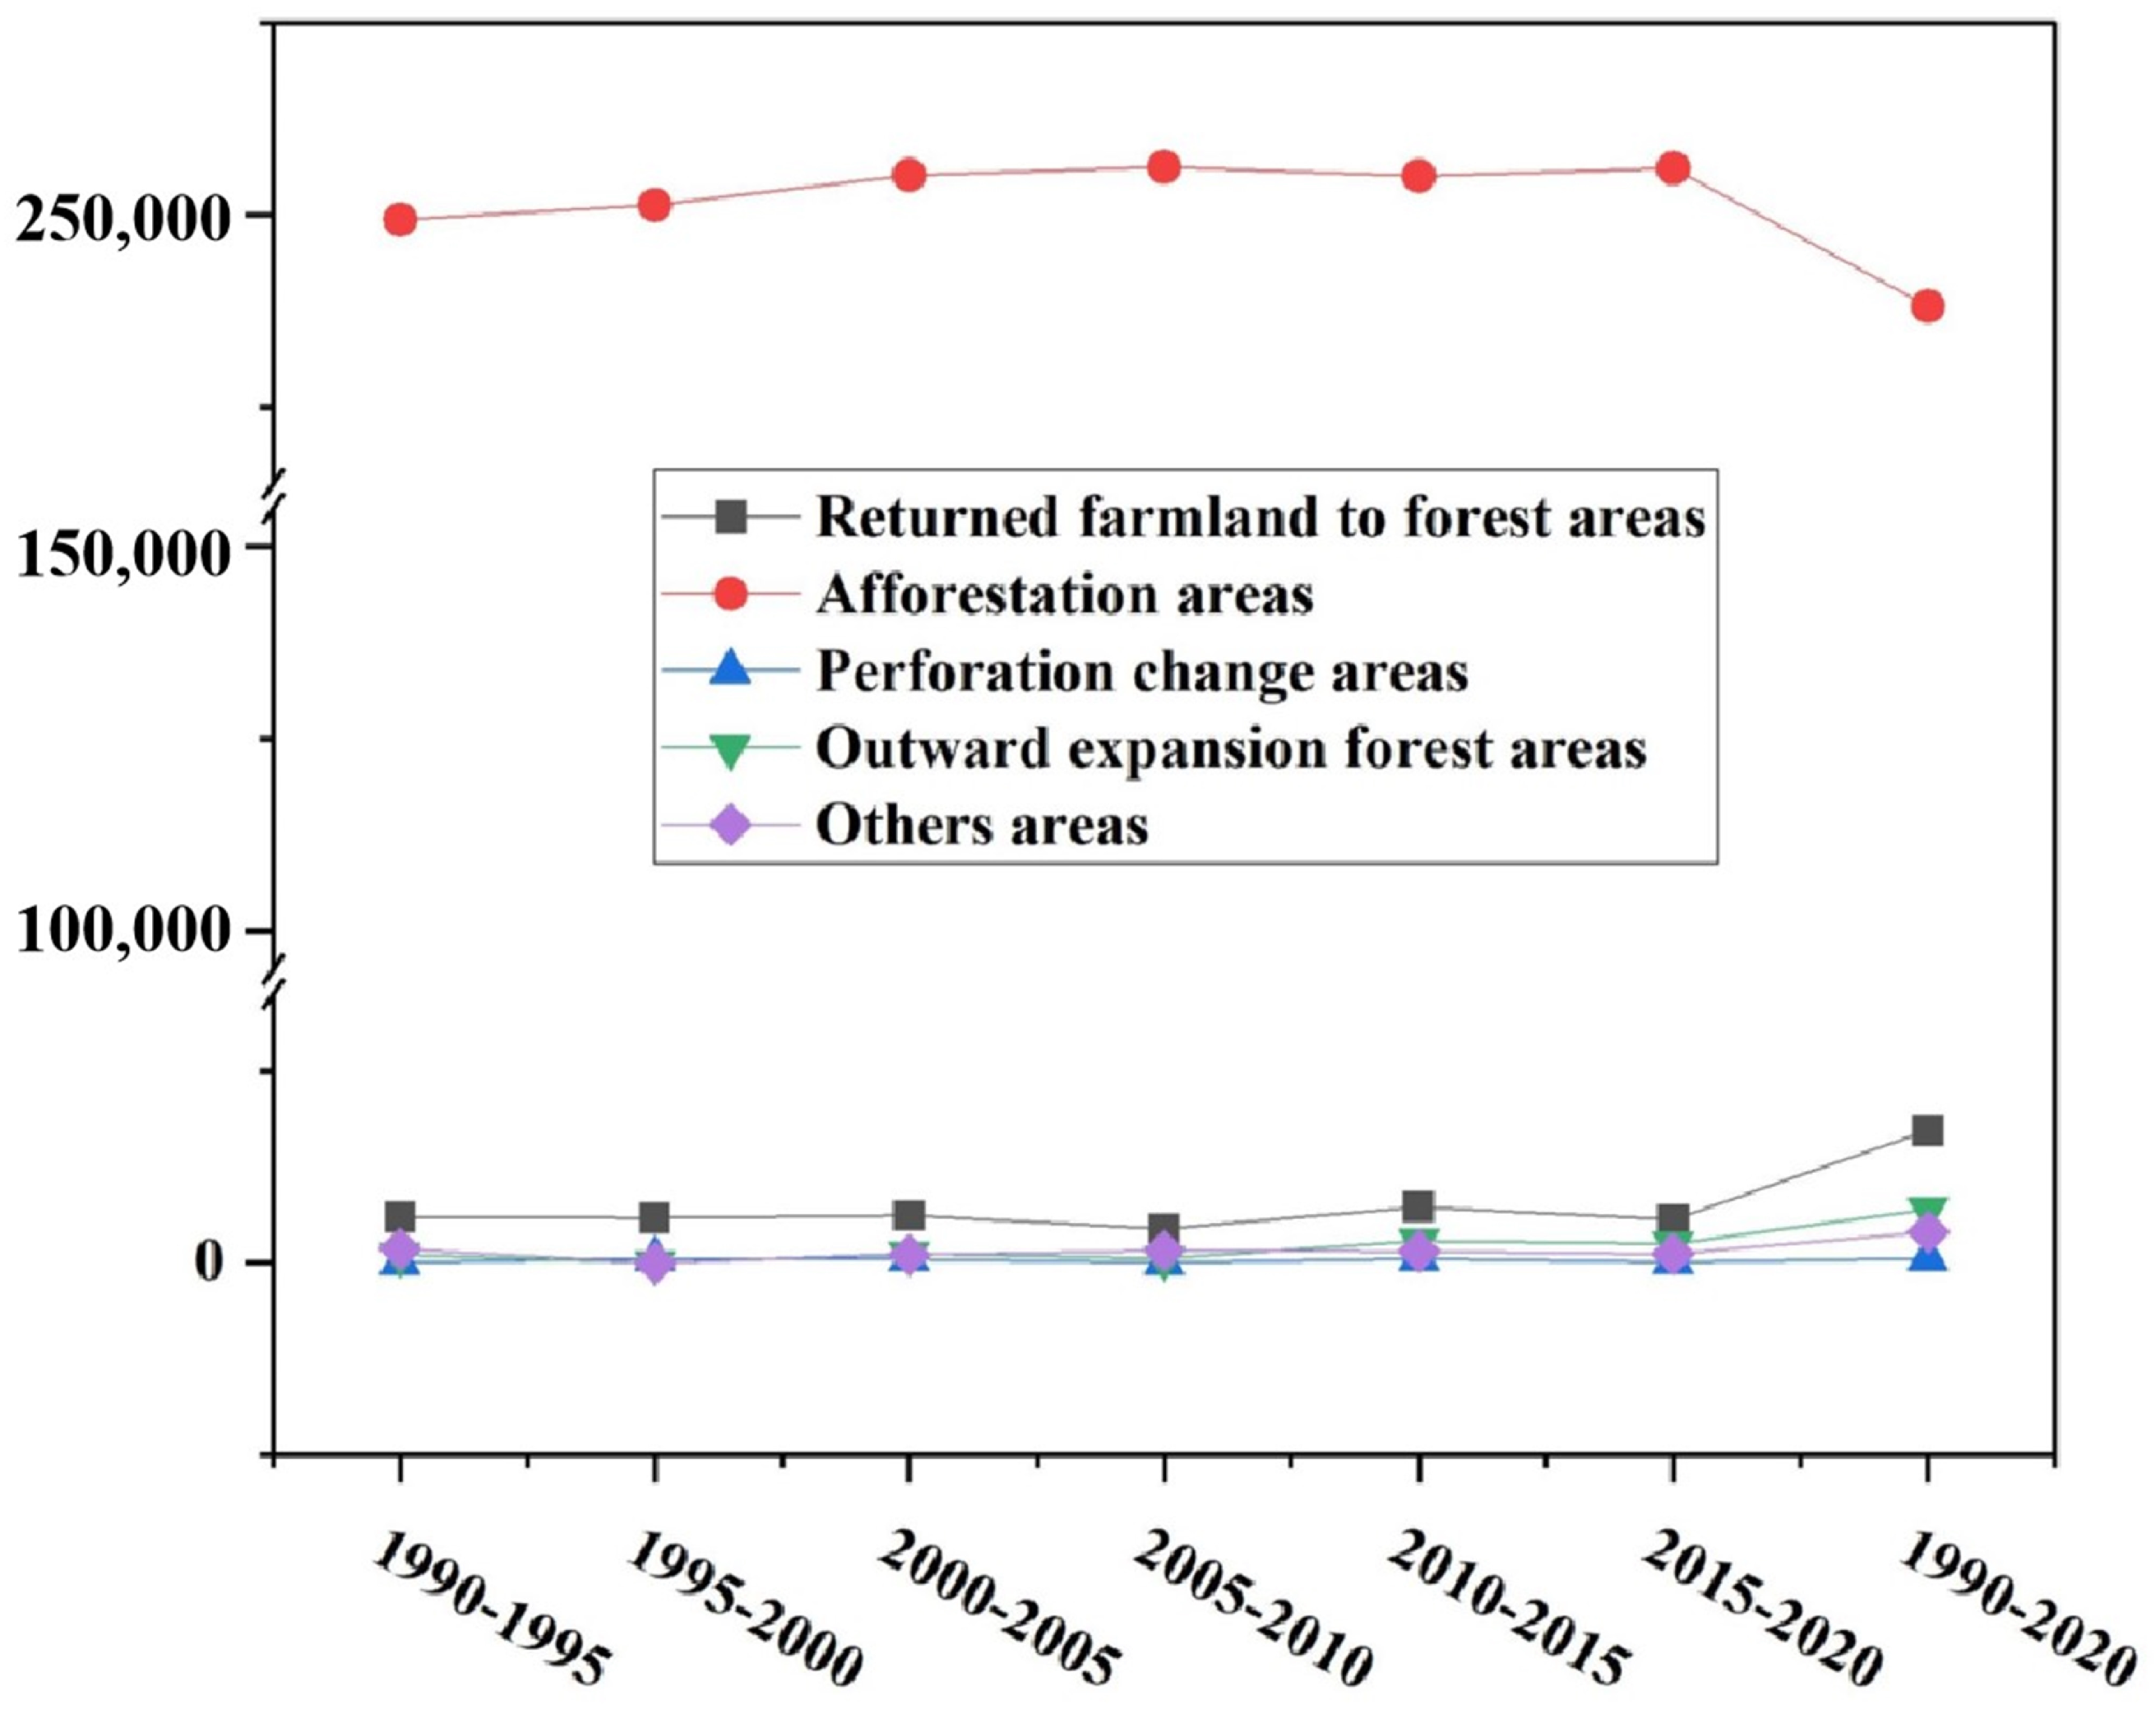
Changes in each ecological restoration project were calculated by comparing forest change areas with land use transfer areas (Figure 11). Afforestation policies most significantly drove forest expansion, followed by the policy of return of farmland to forest. In terms of patterns, the outward expansion of forests contributed the most to the total area increase. Over the 30-year period, ecological restoration plans have successfully increased forest areas and significantly reduced FF levels. Afforestation policies had a particularly notable impact. Between 1995 and 2000, the “perforation” caused by FF expanded to its maximum (575.21 km2), while the area of outward forest expansion was at its lowest (40.85 km2), with fewer restoration projects implemented. However, after 2000, the area of afforestation areas grew significantly, peaking in 2010 at 256,257.14 km2. Although forest area declined slightly in the five years following the first phase of the Natural Forest Protection Project in 2010, it rebounded in the subsequent five years.

Figure 11.
Changes in forest area due to ecological management measures.
4. Discussion
4.1. Analysis of Forest Fragmentation Degree Factors
Our research used the FFI to evaluate both the static and dynamic patterns of FF across Yunnan Province from 1990 to 2020. We found that fragmentation levels were highest in the central region and lowest in the southwest [55,56]. High fragmentation zones are mainly in the northeast, southeast, and central regions, while medium fragmentation zones are concentrated in the southwest and northwest. Low fragmentation areas are largely situated in southwestern Yunnan. Dynamic FFI analysis has shown that FF intensified between 1990 and 2000, decreased significantly from 2000 to 2010 (especially in the northwest), rose again from 2010 to 2015 (particularly in the central and southeast regions), and has since steadily slowed. The static FFI indicates long-term impacts from climate, topography, and past land use, while the dynamic FFI more precisely captures current fragmentation trends. Thus, due to its precision in reflecting present conditions, the dynamic FFI is better suited for assessing FF.
Static FFI analysis from 1990 to 2020 shows that climatic factors most influenced FF regionally, with topographic factors having the least impact. Among these, precipitation was the most significant factor, and the slope the least. The findings from the study suggest that following the introduction of afforestation policies after the year 2000, the influence of precipitation as a dominant factor has been on the rise, peaking in 2005. This indicates that precipitation affects forest growth and, thus, FF levels. During this period, afforestation drove forest growth, making precipitation the main FF drive [57]. Forest fragmentation varies across Yunnan: roads in the northeast, rainfall in the southwest, low temperatures in the northwest, settlement distance in the southeast, and both temperature and rainfall in central Yunnan. The northeast, with rich minerals and dense settlements, sees the most severe fragmentation [58]. Southwestern Yunnan, particularly Xishuangbanna Dai Autonomous Prefecture, has abundant precipitation. Forming a distinct climate system due to its unique geography and topography [59]. Northwestern Yunnan has lower temperatures compared to the rest of Yunnan Province, most notably in the Diqing Tibetan Autonomous Prefecture [44]. The region’s diverse topography and climate contribute to its moderate FF. Central Yunnan experiences the highest level of fragmentation, largely due to droughts from September to April and high population density [60]. Additionally, high population density is a key factor exacerbating FF in Central Yunnan. As the most densely populated area in Yunnan Province [61], Central Yunnan urban agglomeration’s high population concentration and associated human activities are major drivers of increased FF.
An analysis of the factors influencing the dynamic FFI indicates that policy factors have a considerable impact on the degree of FF. We find that before 2000, unrestrained deforestation by humans led to substantial forest loss. However, since 1998, the nation has embarked on extensive ecological construction efforts, initiating key forestry projects like natural forest conservation, the conversion of farmland back to forest, and the establishment of shelterbelt forests with substantial financial investment. The full-scale launch of the Natural Forest Resource Protection Project in 2000 has been instrumental in reducing FF [62], most notably in central Yunnan [58]. Rafael Antonio Chaparro Torre [63] also reported that in the central and eastern regions of Yunnan, the land degradation area is about 7979.7 square kilometers, with new urban districts and suburban growth areas being the most affected. Moreover, the Province also faced three consecutive years of severe drought from 2010 to 2013, further exacerbating forest degradation [64]. Between 2015 and 2020, urban expansion slowed down; the timely introduction of the “13th Five-Year Plan” forestry and grassland construction policy and the improvement of climate conditions are also combined factors that contributed to the slowing down of the degree of FF.
4.2. Analysis of a Two-Dimensional Evaluation Framework for Forest Fragmentation and Coverage
A two-dimensional evaluation framework for forest landscapes can reduce uncertainties in the evaluation of forest landscape dynamics due to inconsistencies. Both area and pattern changes are key indicators for this assessment. Area changes directly reflect the increase or decrease of forest resources, while pattern changes refer to the alterations in forests’ spatial structure and distribution. In the early stages of forest degradation, small or irregular forest patches disappear, showing a FFIdownFCdown pattern. As degradation progresses, large intact forest patches are affected, leading to a further decline in forest cover and increased fragmentation, indicated by the FFIupFCdown pattern, signaling the forest has entered an advanced degradation stage. With forest protection measures like afforestation, forest cover can improve, and the FFI trend varies with forest patch numbers. When there are more forest patches, FFI also rises, presenting an FFIupFCup pattern, representing the initial stage of forest recovery; when there are fewer patches, FFI declines, the FFIdownFCup pattern, indicating an advanced stage of recovery.
We found that from 1990 to 1995, FF in Yunnan Province increased due to fluctuating climatic conditions despite an ascending forest cover rate, marking an early phase of recovery for the area’s forest ecosystems. However, the subsequent five-year period following 1995 saw a further exacerbation of FF, accompanied by a decrease in forest cover rate due to human activities such as unregulated logging, propelling Yunnan’s forest ecosystems into a more severe degradation phase [65]. Post 2000, FF declined notably in Yunnan Province, attributed to supportive policies and improved climatic conditions, while effective afforestation measures further stimulated an increase in forest cover rate [66]. This transitioned most regions into a more advanced recovery phase. Between 2010 and 2015, significant alterations within Yunnan’s forest ecosystems occurred, primarily due to natural condition shifts and intensified droughts, contributing to a rise in FF [67]. Concurrently, a decline in forest cover rate indicated a deep degradation phase for the forest ecosystems. Nevertheless, as climatic conditions continued to evolve, the five years that followed observed a reduction in FF; yet, the ongoing decrease in forest cover rate pushed most areas into the early stages of degradation [17,68]. Spatially, over the last three decades, regions such as the northwestern, the northern part of the eastern region, the central-eastern area, and the southern part of the southeastern region have broadly undergone a significant forest restoration process. The artificial forest farms in Yunnan’s northwestern region [69] and the economic forests in the northern part of the eastern region [70] have substantially promoted the recovery of the regional forest ecosystems.
A closer look at forest degradation and restoration shows a clear link to human activities. Before 2000, forests were severely damaged by human activities like deforestation and population growth, causing forest cover to plummet to its lowest level [71]. However, during the period from 2000 to 2005, with the active intervention of national policies—the promotion of afforestation activities and the prohibition of illegal logging—forest cover began to gradually rebound until 2005 when forest ecosystems entered a recovery phase after a series of management measures [72]. Nevertheless, from 2010 to 2015, forest cover declined due to dry climates [73] as well as human activities such as urban expansion [74] and the conversion of forest lands to agricultural fields [75], shifting from the recovery phase to the degradation phase. However, over the next five years, ongoing efforts and adaptive management somewhat slowed this decline.
4.3. Core Forest Expansion Reduces Forest Fragmentation
We analyze the seven landscape distribution patterns and their change processes by MSPA. We found that core forests occupied 61.4% of the total landscape area, making them the most dominant landscape type (247,632.84 km2), followed by edge forests (19,430.87 km2) and perforation forests (18,470.51 km2). Core forests were mainly in the west, while edge forests and gaps were more common in the east. Over time, core forests exhibited a consistent upward trend, unlike other forest types. Spatially, core forests were concentrated in the west, with edge forests and gaps being more frequent in the east. When integrated with FF research, core forests are aligned with areas of low fragmentation and edge forests with areas of high fragmentation. This indicates that the expansion of core forests helps reduce FF [76]. An increase in edge forests can exacerbate fragmentation, and an increase in forest perforations can reduce internal forest filling, further increasing fragmentation [77,78]. Thus, external expansion and internal filling of core forests play crucial roles in reducing FF.
Changes in forest landscape patterns provide an important perspective in studies exploring the effects of human activities on FF. Actions such as road construction and urban expansion often lead to the fragmentation and marginalization of forests [79]. Meanwhile, core forest growth reflects increased awareness of forest conservation and successful ecological restoration, which are crucial for maintaining the continuity and integrity of forests [80]. We found that from 2000 to 2010, forest restoration drove the expansion of core forest areas. However, between 2010 and 2015, rapid urbanization and drought reduced this expansion, reaching the lowest point in 2020 [81]. Since 2015, improving climatic conditions and increased internal filling have promoted the restorative growth of core forests. Before 2000, excessive logging led to the loss of internal forests. These findings highlight the importance of scientific management and planning in reducing FF.
4.4. Ecological Restoration Programs Reduce Forest Fragmentation
Over the past three decades, ecological restoration programs in Yunnan Province have significantly affected forest fragmentation (FF). By analyzing the areas covered by afforestation, reforestation, and other ecological restoration measures (Figure 9), as well as forest expansion patterns (Figure 7), we can more accurately assess the role of these programs in mitigating FF. We found that afforestation has played a crucial role in reducing FF (238,109.21 km2), followed by returning farmland to the forest program (17,245.25 km2). In the pattern of forest change, external expansion is the main driving force (6997.72 km2). The afforestation program reduces FF by increasing forest cover [82], and the fallowing program reduces FF by reducing forest patches through the returning farmland to forest program. Other forest management measures, including mountain closures and the establishment of nature reserves, also reduced FF by minimizing human impact [83].
It is worth noting that, prior to 2000, forest restoration programs in Yunnan Province did not have a significant impact on FF. However, after 2000, as these programs advanced, they became the dominant factor in reducing FF. Especially since 1998, Yunnan has implemented natural forest resource protection projects and formulated corresponding policies [65]. Afforestation efforts through these ecological engineering projects have significantly increased vegetation coverage in Yunnan’s karst regions [84] and have reduced FF in central Yunnan. Spatial analysis of the ecological restoration program found that afforestation has shown significant effects in the southwestern regions of Yunnan, but less so in the densely populated central urban areas (Figure 8), partly due to limited urban land and an unfavorable climate [85]. In densely forested areas, afforestation has effectively increased forest area and reduced fragmentation. Similarly, the return farmland to forest program has achieved remarkable results in southwestern Yunnan (6505.01 km2), but the results in northwestern Yunnan are relatively weak (1908.78 km2) (Figure 8), which is associated with the diversity of land use limiting the implementation of the fallow forest program to some extent [86]. Since 1990, vegetation coverage changes in Yunnan have mainly been from savanna and shrub restoration, farmland expansion, and afforestation, accounting for 23.7%, 22.9%, and 19.1% of total changes, respectively. Among these, conservation and restoration efforts have played a dominant role in Yunnan’s greening process [87]. This highlights the significant contribution of ecological restoration projects in the 1990s to improving vegetation coverage in Yunnan. In addition, climatic conditions in the northwestern and northeastern regions are disadvantageous for forest growth [88]. These findings show that the effectiveness of ecological restoration programs is closely related to the region’s specific environment and conditions. They emphasize the importance of considering regional differences when formulating and adjusting ecological restoration strategies, which is consistent with previous research [89] and that there are still conservation gaps and deficits.
5. Conclusions
We analyzed the patterns and driving factors of forest fragmentation (FF) in Yunnan from 1990 to 2020, focusing on its spatiotemporal dynamics, identifying key drivers, and evaluating the impact of various ecological restoration programs. The results revealed a significant decline in FF overall, with increased fragmentation before 2000, a decreasing trend from 2000 to 2010, a slight increase from 2010 to 2015, and a marked decline from 2015 to 2020. Moreover, high levels of FF are predominantly located in the eastern and central regions and are moderate in the north of the southwest and the south of the northwest. Low fragmentation is primarily found in the southern parts of the southwestern region, with eastern regions having higher fragmentation than western ones. The forest landscape in most areas recovered over the past 30 years, including early recovery from 1990 to 1995, deep degradation from 1995 to 2000, and significant recovery after 2000. By comprehensively analyzing the spatial pattern of the forest landscape and the impact of ecological restoration programs on the change of forest area, we found that the core forest increased mainly through external expansion (6997.72 km2), effectively reducing the degree of FF. In terms of ecological engineering, afforestation activities, which increased the forest area (238,109.21 km2), significantly reduced FF. Additionally, the conversion of farmland back to forest measures increased the forest area by 17,254.47 km2, promoting the increase in the area of forest patches. At the regional scale, the southwest region has maintained a low fragmentation level over the past 30 years due to abundant precipitation and the ecological restoration programs (afforestation and returning farmland to forest projects). In contrast, central and northeastern regions had higher fragmentation due to drought, human activities, and urban expansion.
To reduce FF, sustainable forest resource management is essential. Governments should establish and enforce forest protection laws to promote sustainable resource use and environmental improvement. Forest management should be scientifically planned to maintain forest cover and ensure ecosystem renewal and sustainability. Additionally, diverse tree planting can enhance forest stability, adaptability, and resilience to extreme weather.
Author Contributions
Writing—original draft preparation, software, methodology, investigation, formal analysis, conceptualization, resources, Y.M.; writing—review and editing, supervision, project administration, investigation, funding acquisition, conceptualization, S.Z.; writing—review and editing, supervision, formal analysis, conceptualization, K.Y.; writing—review and editing, software, resources, data curation, Y.R.; writing—review and editing, software, resources, data curation, X.Y.; writing—review and editing, resources, investigation, conceptualization, W.Z.; writing—review and editing, resources, investigation, conceptualization, J.L.; writing—review and editing, software, conceptualization, C.B. All authors have read and agreed to the published version of the manuscript.
Funding
This study was supported by the National Natural Science Foundation of China 42361064, and the Key Research and Development Program of Yunnan Province No. 202303AC100009.
Data Availability Statement
Data will be made available on request.
Conflicts of Interest
The authors declare no conflicts of interest.
References
- Pías, B.; Matesanz, S.; Herrero, A.; Gimeno, T.E.; Escudero, A.; Valladares, F. Transgenerational effects of three global change drivers on an endemic Mediterranean plant. Oikos 2010, 119, 1435–1444. [Google Scholar] [CrossRef]
- Michalski, F.; Peres, C.A. Gamebird responses to anthropogenic forest fragmentation and degradation in a southern Amazonian landscape. PeerJ 2017, 5, e3442. [Google Scholar] [CrossRef] [PubMed]
- Banks-Leite, C.; Ewers, R.M.; Folkard-Tapp, H.; Fraser, A. Countering the effects of habitat loss, fragmentation, and degradation through habitat restoration. One Earth 2020, 3, 672–676. [Google Scholar] [CrossRef]
- Zhang, C.; Su, Y.; Liu, L.; Wu, J.; Huang, G.; Li, X.; Bi, C.; Yan, W.; Lafortezza, R. Seasonal and long-term dynamics in forest microclimate effects: Global pattern and mechanism. npj Clim. Atmos. Sci. 2023, 6, 116. [Google Scholar] [CrossRef]
- Driscoll, D.A.; Banks, S.C.; Barton, P.S.; Lindenmayer, D.B.; Smith, A.L. Conceptual domain of the matrix in fragmented landscapes. Trends Ecol. Evol. 2013, 28, 605–613. [Google Scholar] [CrossRef]
- Harper, G.J.; Steininger, M.K.; Tucker, C.J.; Juhn, D.; Hawkins, F. Fifty years of deforestation and forest fragmentation in Madagascar. Environ. Conserv. 2008, 34, 325–333. [Google Scholar] [CrossRef]
- Laurance, W.F.; Pérez-Salicrup, D.; Delamônica, P.; Fearnside, P.M.; D’Angelo, S.; Jerozolinski, A.; Pohl, L.; Lovejoy, T.E. Rain forest fragmentation and the structure of amazonian liana communities. Ecology 2001, 82, 105–116. [Google Scholar] [CrossRef]
- Acharya, K.P.; Paudel, P.K.; Jnawali, S.R.; Neupane, P.R.; Köhl, M. Can forest fragmentation and configuration work as indicators of human–wildlife conflict? Evidences from human death and injury by wildlife attacks in Nepal. Ecol. Indic. 2017, 80, 74–83. [Google Scholar] [CrossRef]
- Wilson, M.C.; Chen, X.-Y.; Corlett, R.T.; Didham, R.K.; Ding, P.; Holt, R.D.; Holyoak, M.; Hu, G.; Hughes, A.C.; Jiang, L.; et al. Habitat fragmentation and biodiversity conservation: Key findings and future challenges. Landsc. Ecol. 2015, 31, 219–227. [Google Scholar] [CrossRef]
- Brinck, K.; Fischer, R.; Groeneveld, J.; Lehmann, S.; Dantas De Paula, M.; Putz, S.; Sexton, J.O.; Song, D.; Huth, A. High resolution analysis of tropical forest fragmentation and its impact on the global carbon cycle. Nat. Commun. 2017, 8, 14855. [Google Scholar] [CrossRef]
- Siegel, T.; Magrach, A.; Laurance, W.F.; Luther, D. A global meta-analysis of the impacts of forest fragmentation on biotic mutualisms and antagonisms. Conserv. Biol. 2024, 38, e14206. [Google Scholar] [CrossRef]
- González-Trujillo, J.D.; Román-Cuesta, R.M.; Muñiz-Castillo, A.I.; Amaral, C.H.; Araújo, M.B. Multiple dimensions of extreme weather events and their impacts on biodiversity. Clim. Change 2023, 176, 155. [Google Scholar] [CrossRef]
- Wan, M.; Han, Y.; Song, Y.; Hashimoto, S. Estimating and projecting the effects of urbanization on the forest habitat quality in a highly urbanized area. Urban For. Urban Green. 2024, 94, 128270. [Google Scholar] [CrossRef]
- Mitchell, M.G.E.; Devisscher, T. Strong relationships between urbanization, landscape structure, and ecosystem service multifunctionality in urban forest fragments. Landsc. Urban Plan. 2022, 228, 104548. [Google Scholar] [CrossRef]
- Xie, Y.; Li, J.; Wulan, T.; Zheng, Y.; Shen, Z. Scale dependence of forest fragmentation and its climate sensitivity in a semi-arid mountain: Comparing Landsat, Sentinel and Google Earth data. Geogr. Sustain. 2024, 5, 200–210. [Google Scholar] [CrossRef]
- Li, L.; Gou, M.; Wang, N.; La, L.; Liu, C. Do ecological restoration programs reduce forest fragmentation? Case study of the Three Gorges Reservoir Area, China. Ecol. Eng. 2021, 172, 106410. [Google Scholar] [CrossRef]
- Crouzeilles, R.; Curran, M.; Ferreira, M.S.; Lindenmayer, D.B.; Grelle, C.E.; Rey Benayas, J.M. A global meta-analysis on the ecological drivers of forest restoration success. Nat. Commun. 2016, 7, 11666. [Google Scholar] [CrossRef] [PubMed]
- Qiu, S.; Peng, J.; Zheng, H.; Xu, Z.; Meersmans, J. How can massive ecological restoration programs interplay with social-ecological systems? A review of research in the South China karst region. Sci. Total Environ. 2022, 807, 150723. [Google Scholar] [CrossRef]
- Xu, Y.; Price, M.; Yang, B.; Zhang, K.; Yang, N.; Tang, X.; Ran, J.; Yi, Y.; Wang, B. Have China’s national forest reserves designated since 1990 conserved forests effectively? J. Environ. Manag. 2022, 306, 114485. [Google Scholar] [CrossRef]
- Liu, J.; Li, S.; Ouyang, Z.; Tam, C.; Chen, X. Ecological and socioeconomic effects of China’s policies for ecosystem services. Proc. Natl. Acad. Sci. USA 2008, 105, 9477–9482. [Google Scholar] [CrossRef]
- Huang, B.; Lu, F.; Wang, X.; Zheng, H.; Wu, X.; Zhang, L.; Yuan, Y.; Ouyang, Z. Ecological restoration is crucial in mitigating carbon loss caused by permafrost thawing on the Qinghai–Tibet Plateau. Commun. Earth Environ. 2024, 5, 341. [Google Scholar] [CrossRef]
- Yue, C.; Xu, M.; Ciais, P.; Tao, S.; Shen, H.; Chang, J.; Li, W.; Deng, L.; He, J.; Leng, Y.; et al. Contributions of ecological restoration policies to China’s land carbon balance. Nat. Commun. 2024, 15, 9708. [Google Scholar] [CrossRef]
- Li, Z.; Ning, K.; Chen, J.; Liu, C.; Wang, D.; Nie, X.; Hu, X.; Wang, L.; Wang, T. Soil and water conservation effects driven by the implementation of ecological restoration projects: Evidence from the red soil hilly region of China in the last three decades. J. Clean. Prod. 2020, 260, 121109. [Google Scholar] [CrossRef]
- Sihi, D.; Wu, D.; Zou, C.; Cao, W.; Xiao, T.; Gong, G. Ecosystem services changes between 2000 and 2015 in the Loess Plateau, China: A response to ecological restoration. PLoS ONE 2019, 14, e0209483. [Google Scholar] [CrossRef]
- Lee, S.Y.; Shin, S.; Kim, H.; Kim, M.K.; Yoon, S.Y.; Lee, S. Assessing the Visualization-Based Decision Support System for Environmental Impact Assessments. Int. J. Environ. Res. Public Health 2022, 19, 1345. [Google Scholar] [CrossRef]
- Flowers, B.; Huang, K.-T.; Aldana, G.O. Analysis of the Habitat Fragmentation of Ecosystems in Belize Using Landscape Metrics. Sustainability 2020, 12, 3024. [Google Scholar] [CrossRef]
- Wang, Y.; Pan, J. Landscape-based ecological resilience and impact evaluation in arid inland river basin: A case study of Shiyang River Basin. Appl. Geogr. 2024, 167, 103299. [Google Scholar] [CrossRef]
- Torun, P.; Altunel, A.O. Effects of environmental factors and forest management on landscape-scale forest storm damage in Turkey. Ann. For. Sci. 2020, 77, 39. [Google Scholar] [CrossRef]
- Mansori, M.; Badehian, Z.; Ghobadi, M.; Maleknia, R. Assessing the environmental destruction in forest ecosystems using landscape metrics and spatial analysis. Sci. Rep. 2023, 13, 15165. [Google Scholar] [CrossRef]
- Soille, P.; Vogt, P. Morphological Spatial Pattern Analysis: Open Source Release. Int. Arch. Photogramm. Remote Sens. Spat. Inf. Sci. 2022, 48, 427–433. [Google Scholar] [CrossRef]
- Wade, T.G.; Riitters, K.; Wickham, J.D.; Jones, K.B. Distribution and Causes of Global Forest Fragmentation. Conserv. Ecol. 2003, 7, 7. [Google Scholar] [CrossRef]
- Dong, J.; Xiao, X.; Sheldon, S.; Biradar, C.; Zhang, G.; Duong, N.D.; Hazarika, M.; Wikantika, K.; Takeuhci, W.; Moore, B., 3rd. A 50-m forest cover map in Southeast Asia from ALOS/PALSAR and its application on forest fragmentation assessment. PLoS ONE 2014, 9, e85801. [Google Scholar] [CrossRef]
- Whittaker, R.H.J.E.M. Vegetation of the Siskiyou Mountains Oregon and California. Ecol. Monogr. Ecol. Monogr. 1960, 30, 1943563. [Google Scholar] [CrossRef]
- Hagen-Zanker, A. A computational framework for generalized moving windows and its application to landscape pattern analysis. Int. J. Appl. Earth Obs. Geoinf. 2016, 44, 205–216. [Google Scholar] [CrossRef]
- Wang, J. Spatiotemporal evolution and driving force of landscape fragmentation in semi-arid ecologically fragile region: A case study of Jingning County. Acad. J. Environ. Earth Sci. 2024, 6, 42–50. [Google Scholar] [CrossRef]
- Zhen, S.; Zhao, Q.; Liu, S.; Wu, Z.; Lin, S.; Li, J.; Hu, X. Detecting Spatiotemporal Dynamics and Driving Patterns in Forest Fragmentation with a Forest Fragmentation Comprehensive Index (FFCI): Taking an Area with Active Forest Cover Change as a Case Study. Forests 2023, 14, 1135. [Google Scholar] [CrossRef]
- Liu, S.; Wang, D.; Li, H.; Li, W.; Wang, Q. Ecological Land Fragmentation Evaluation and Dynamic Change of a Typical Black Soil Farming Area in Northeast China. Sustainability 2017, 9, 300. [Google Scholar] [CrossRef]
- Chen, Z.; Zhang, C.; Raza, S.T. Evaluation of Forest Ecological Security and Its Influencing Factors in Multi-Climatic Zones: A Case Study of Yunnan Province. Appl. Sci. 2023, 13, 12345. [Google Scholar] [CrossRef]
- Sang, M.; Jiang, J.; Huang, X.; Zhu, F.; Wang, Q. Spatial and temporal changes in population distribution and population projection at county level in China. Hum. Soc. Sci. Commun. 2024, 11, 288. [Google Scholar] [CrossRef]
- Hipsher, S. Yunnan, China: Background, economic conditions, and tourism. In Poverty Reduction, the Private Sector, and Tourism in Mainland Southeast Asia; Palgrave Macmillan: Singapore, 2017; pp. 211–230. [Google Scholar] [CrossRef]
- Trac, C.J.; Harrell, S.; Hinckley, T.M.; Henck, A.C. Reforestation programs in Southwest China: Reported success, observed failure, and the reasons why. J. Mt. Sci. 2007, 4, 275–292. [Google Scholar] [CrossRef]
- Aguilar, F.X.; Wen, Y. Socio-economic and ecological impacts of China’s forest sector policies. For. Policy Econ. 2021, 127, 102454. [Google Scholar] [CrossRef]
- Zhang, J.; Pham, T.-T.-H.; Kalacska, M.; Turner, S. Using Landsat Thematic Mapper records to map land cover change and the impacts of reforestation programmes in the borderlands of southeast Yunnan, China: 1990–2010. Int. J. Appl. Earth Obs. Geoinf. 2014, 31, 25–36. [Google Scholar] [CrossRef]
- Li, W.; Wang, W.; Chen, J.; Zhang, Z. Assessing effects of the Returning Farmland to Forest Program on vegetation cover changes at multiple spatial scales: The case of northwest Yunnan, China. J. Environ. Manag. 2022, 304, 114303. [Google Scholar] [CrossRef]
- He, J. Governing forest restoration: Local case studies of sloping land conversion program in Southwest China. For. Policy Econ. 2014, 46, 30–38. [Google Scholar] [CrossRef]
- Wang, H.; He, M.; Ran, N.; Xie, D.; Wang, Q.; Teng, M.; Wang, P. China’s Key Forestry Ecological Development Programs: Implementation, Environmental Impact and Challenges. Forests 2021, 12, 101. [Google Scholar] [CrossRef]
- Shi, P.; Sun, S.; Wang, M.; Li, N.; Wang, J.A.; Jin, Y.; Gu, X.; Yin, W. Climate change regionalization in China (1961–2010). Sci. China Earth Sci. 2014, 57, 2676–2689. [Google Scholar] [CrossRef]
- Yang, J.; Huang, X. 30 m annual land cover and its dynamics in China from 1990 to 2019. Earth Syst. Sci. Data 2021, 13, 3907–3925. [Google Scholar] [CrossRef]
- European Space Agency, S. Copernicus Global Digital Elevation Model; OpenTopography: La Jolla, CA, USA, 2021. [Google Scholar] [CrossRef]
- Grantham, H.S.; Duncan, A.; Evans, T.D.; Jones, K.R.; Beyer, H.L.; Schuster, R.; Walston, J.; Ray, J.C.; Robinson, J.G.; Callow, M.; et al. Anthropogenic modification of forests means only 40% of remaining forests have high ecosystem integrity. Nat. Commun. 2020, 11, 5978. [Google Scholar] [CrossRef]
- Hesselbarth, M.H.K.; Sciaini, M.; With, K.A.; Wiegand, K.; Nowosad, J. Landscapemetrics: An open-source R tool to calculate landscape metrics. Ecography 2019, 42, 1648–1657. [Google Scholar] [CrossRef]
- Ma, J.; Li, J.; Wu, W.; Liu, J. Global forest fragmentation change from 2000 to 2020. Nat. Commun. 2023, 14, 3752. [Google Scholar] [CrossRef]
- Riitters, P.V.K. GuidosToolbox: Universal digital image object analysis. Eur. J. Remote Sens. 2017, 50, 352–361. [Google Scholar] [CrossRef]
- Yan, W.; He, Y.; Cai, Y.; Qu, X.; Cui, X. Relationship between extreme climate indices and spatiotemporal changes of vegetation on Yunnan Plateau from 1982 to 2019. Glob. Ecol. Conserv. 2021, 31, e01813. [Google Scholar] [CrossRef]
- Liu, J.; Coomes, D.A.; Gibson, L.; Hu, G.; Liu, J.; Luo, Y.; Wu, C.; Yu, M. Forest fragmentation in China and its effect on biodiversity. Biol. Rev. Camb. Philos. Soc. 2019, 94, 1636–1657. [Google Scholar] [CrossRef] [PubMed]
- Zhu, H.; Xu, Z.; Wang, H.; Li, B. Tropical rain forest fragmentation and its ecological and species diversity changes in southern Yunnan. Biodivers. Conserv. 2004, 13, 1355–1372. [Google Scholar] [CrossRef]
- Huang, B.; Zhu, J.; Wen, Q. A Study on the Growth Law of Yunnan Pine Natural Forest in Subtropical Regions of Yunnan Province at Different Altitudes. Agric. Sci. China 2021, 46, 157–162. [Google Scholar]
- Liu, S.; Dong, Y.; Deng, L.; Liu, Q.; Zhao, H.; Dong, S. Forest fragmentation and landscape connectivity change associated with road network extension and city expansion: A case study in the Lancang River Valley. Ecol. Indic. 2014, 36, 160–168. [Google Scholar] [CrossRef]
- Hua, Z. The tropical rainforest vegetation in Xiahuangbanna. Chin. Geogr. Sci. 2019, 2, 64–73. [Google Scholar] [CrossRef]
- Yu, Y.; Shen, Y.; Wang, J.; Wei, Y.; Liu, Z. Simulation and mapping of drought and soil erosion in Central Yunnan Province, China. Adv. Space Res. 2021, 68, 4556–4572. [Google Scholar] [CrossRef]
- Wang, S.; Li, Z.; Long, Y.; Yang, L.; Ding, X.; Sun, X.; Chen, T. Impacts of urbanization on the spatiotemporal evolution of ecological resilience in the Plateau Lake Area in Central Yunnan, China. Ecol. Indic. 2024, 160, 111836. [Google Scholar] [CrossRef]
- Tong, X.; Brandt, M.; Yue, Y.; Zhang, X.; Fensholt, R.; Ciais, P.; Wang, K.; Liu, S.; Zhang, W.; Mao, C.; et al. Reforestation policies around 2000 in southern China led to forest densification and expansion in the 2010s. Commun. Earth Environ. 2023, 4, 260. [Google Scholar] [CrossRef]
- Torres, R.A.C.; Wang, J.; Zhang, J.; Liu, L.; Lan, Y. Temporal analysis of land degradation and urban expansion in central Yunnan Province using remote sensing for supporting sustainable development goals 11/15. Ecol. Indic. 2024, 163, 112058. [Google Scholar] [CrossRef]
- Gao, L.; Han, X.; Chen, X.; Liu, B.; Li, Y. The Spring Drought in Yunnan Province of China: Variation Characteristics, Leading Impact Factors, and Physical Mechanisms. Atmosphere 2023, 14, 294. [Google Scholar] [CrossRef]
- Frayer, J.; Müller, D.; Sun, Z.; Munroe, D.; Xu, J. Processes Underlying 50 Years of Local Forest-Cover Change in Yunnan, China. Forests 2014, 5, 3257–3273. [Google Scholar] [CrossRef]
- Moseley, R.K. Historical Landscape Change in Northwestern Yunnan, China: Using Repeat Photography to Assess the Perceptions and Realities of Biodiversity Loss. Mt. Res. Dev. 2006, 26, 214–219. [Google Scholar]
- Qiu, J. China drought highlights future climate threats. Nature 2010, 465, 142–143. [Google Scholar] [CrossRef]
- Chen, Y.; Feng, X.; Tian, H.; Wu, X.; Gao, Z.; Feng, Y.; Piao, S.; Lv, N.; Pan, N.; Fu, B. Accelerated increase in vegetation carbon sequestration in China after 2010: A turning point resulting from climate and human interaction. Glob. Change Biol. 2021, 27, 5848–5864. [Google Scholar] [CrossRef] [PubMed]
- Shang, X. The main problems and countermeasures in the development of Yunnan’s forestry industry. Agric. Sci. China 2009, 4, 6. [Google Scholar] [CrossRef]
- Lu, J.; Song, W.; Zuo, X.; Zhu, D.; Wei, Q. A Study of Apple Orchards Extraction in the Zhaotong Region Based on Sentinel Images and Improved Spectral Angle Features. Appl. Sci. 2023, 13, 11194. [Google Scholar] [CrossRef]
- Wang, M.; Shen, C.; Sun, Q.; Meng, H.; Huang, L.; Zhang, H.; Sun, H. Vegetation Dynamics since the Last Glacial Maximum in Central Yunnan, Southwest China. Forests 2024, 15, 1075. [Google Scholar] [CrossRef]
- Cheng, C.; Li, F. Ecosystem restoration and management based on nature-based solutions in China: Research progress and representative practices. Nat.-Based Solut. 2024, 6, 100176. [Google Scholar] [CrossRef]
- Zhang, Y.; Gu, T.; He, S.; Cheng, F.; Wang, J.; Ye, H.; Zhang, Y.; Su, H.; Li, Q. Extreme drought along the tropic of cancer (Yunnan section) and its impact on vegetation. Sci. Rep. 2024, 14, 7508. [Google Scholar] [CrossRef]
- He, Y.; Liang, Y.; Liu, L.; Yin, Z.; Huang, J. Loss of green landscapes due to urban expansion in China. Resour. Conserv. Recycl. 2023, 199, 107228. [Google Scholar] [CrossRef]
- Wang, X.; Hao, J.-Q.; Dai, Z.-Z.; Haider, S.; Chang, S.; Zhu, Z.-Y.; Duan, J.-j.; Ren, G.-X. Spatial-temporal characteristics of cropland distribution and its landscape fragmentation in China. Farming Syst. 2024, 2, 100078. [Google Scholar] [CrossRef]
- Cai, Y.; Zhu, P.; Liu, X.; Zhou, Y. Forest fragmentation trends and modes in China: Implications for conservation and restoration. Int. J. Appl. Earth Obs. Geoinf. 2024, 133, 104094. [Google Scholar] [CrossRef]
- Hending, D.; Randrianarison, H.; Andriamavosoloarisoa, N.N.M.; Ranohatra-Hending, C.; Holderied, M.; McCabe, G.; Cotton, S. Forest fragmentation and its associated edge-effects reduce tree species diversity, size, and structural diversity in Madagascar’s transitional forests. Biodivers. Conserv. 2023, 32, 3329–3353. [Google Scholar] [CrossRef]
- Powers, J.S.; Marín-Spiotta, E. Ecosystem Processes and Biogeochemical Cycles in Secondary Tropical Forest Succession. Annu. Rev. Ecol. Evol. Syst. 2017, 48, 497–519. [Google Scholar] [CrossRef]
- Zhang, Y.; Shen, W.; Li, M.; Lv, Y. Assessing spatio-temporal changes in forest cover and fragmentation under urban expansion in Nanjing, eastern China, from long-term Landsat observations (1987–2017). Appl. Geogr. 2020, 117, 102190. [Google Scholar] [CrossRef]
- Wang, Y.; Brandt, M.; Zhao, M.; Xing, K.; Wang, L.; Tong, X.; Xue, F.; Kang, M.; Jiang, Y.; Fensholt, R. Do afforestation projects increase core forests? Evidence from the Chinese Loess Plateau. Ecol. Indic. 2020, 117, 106558. [Google Scholar] [CrossRef]
- Wang, R.; Zhao, J.; Lin, Y.; Qin, B.; Chen, G.; Bao, L.; Long, X. Study on the response and prediction of SDGs based on different climate change scenarios: The case of the urban agglomeration in central Yunnan. Ecol. Indic. 2023, 156, 111076. [Google Scholar] [CrossRef]
- Yao, L.; Liu, T.; Qin, J.; Jiang, H.; Yang, L.; Smith, P.; Chen, X.; Zhou, C.; Piao, S. Carbon sequestration potential of tree planting in China. Nat. Commun. 2024, 15, 8398. [Google Scholar] [CrossRef]
- Ren, G.; Young, S.S.; Wang, L.; Wang, W.; Long, Y.; Wu, R.; Li, J.; Zhu, J.; Yu, D.W. Effectiveness of China’s National Forest Protection Program and nature reserves. Conserv. Biol. 2015, 29, 1368–1377. [Google Scholar] [CrossRef]
- Zhang, X.; Yue, Y.; Tong, X.; Wang, K.; Qi, X.; Deng, C.; Brandt, M. Eco-engineering controls vegetation trends in southwest China karst. Sci. Total Environ. 2021, 770, 145160. [Google Scholar] [CrossRef] [PubMed]
- Endreny, T.A. Strategically growing the urban forest will improve our world. Nat. Commun. 2018, 9, 1160. [Google Scholar] [CrossRef]
- Brown, M. Diversity and Adaptation in Local Forest Governance in Yunnan, China. Hum. Ecol. 2020, 48, 253–265. [Google Scholar] [CrossRef]
- Xiahou, M.; Shen, Z.; Yang, T.; Duan, J.; Peng, M.; Wang, C.; Ou, X. Biodiversity conservation and ecological restoration dominated vegetation dynamics during the 1980s-2010s in Yunnan, China. Biol. Conserv. 2024, 299, 110798. [Google Scholar] [CrossRef]
- Chi, H.; Wu, Y.; Zheng, H.; Zhang, B.; Sun, Z.; Yan, J.; Ren, Y.; Guo, L. Spatial patterns of climate change and associated climate hazards in Northwest China. Sci. Rep. 2023, 13, 10418. [Google Scholar] [CrossRef]
- Qian, L.-S.; Chen, J.-H.; Deng, T.; Sun, H. Plant diversity in Yunnan: Current status and future directions. Plant Divers. 2020, 42, 281–291. [Google Scholar] [CrossRef]

Disclaimer/Publisher’s Note: The statements, opinions and data contained in all publications are solely those of the individual author(s) and contributor(s) and not of MDPI and/or the editor(s). MDPI and/or the editor(s) disclaim responsibility for any injury to people or property resulting from any ideas, methods, instructions or products referred to in the content. |
© 2025 by the authors. Licensee MDPI, Basel, Switzerland. This article is an open access article distributed under the terms and conditions of the Creative Commons Attribution (CC BY) license (https://creativecommons.org/licenses/by/4.0/).