Abstract
This study investigates the anatomical adaptations and ecological plasticity of C. ambiguus in extreme environmental conditions by analyzing the structural characteristics of its leaves and annual shoots collected from 12 populations in the arid regions of Mangystau, including Western Karatau, Northern Aktau, and the Tyubkaragan Peninsula. Microscopic and statistical analyses revealed significant variability in key anatomical traits, including epidermal thickness, collenchyma, primary cortex, and vascular bundle area, highlighting the species’ adaptive responses to drought, high solar radiation, and limited water availability. The epidermal thickness ranged from 14.85 µm (Pop_12 Botakan) to 22.51 µm (Pop_6 Samal), demonstrating xeromorphic adaptations for reducing transpiration. At the same time, the vascular bundle area varied from 286.06 × 10⁻³ mm2 (Pop_3 Emdikorgan) to 528.51 × 10⁻³ mm2 (Samal), indicating differences in water transport efficiency across populations. Despite substantial anatomical variation, the low coefficients of variation (0.31%–6.31%) suggested structural stability, reinforcing C. ambigua’s ability to maintain functional integrity under environmental stress. Canonical Correlation Analysis (CCA) confirmed that environmental factors such as soil type, elevation, and water availability significantly influenced anatomical traits. Floristic analysis revealed distinct patterns of species richness, with the highest diversity recorded in Pop_4 and Pop_7, while Pop_12 and Pop_9 exhibited lower diversity, indicating potential vulnerability. Furthermore, the identified anatomical traits could serve as key markers for selecting drought-resistant genotypes in afforestation and restoration programs. This study also highlighted the need for the long-term monitoring of C. ambigua populations to assess the impact of climate change on structural adaptations. These findings offer a framework for integrating ecological and genetic studies to refine conservation strategies for xerophytic species.
1. Introduction
Wild trees have historically provided essential resources for human needs, including raw materials, ornamental elements, valuable food components, and phytopreparations [1]. The Rosaceae Juss., one of the most prominent plant families, comprises numerous economically significant species [2,3]. Among these are rare and endemic species, which are particularly valuable for assessing the current state of their natural populations, identifying genetic resources for their introduction, and exploring their practical applications [4,5].
One of the most notable genera within the Rosaceae is Crataegus L. (hawthorn), whose species are known for their wide range of beneficial properties, including uses in the food industry, ornamental horticulture, phytoremediation, and medicine [6,7,8,9,10,11,12]. In Kazakhstan, Crataegus is represented by diverse species that demonstrate high adaptability and ecological plasticity. According to the Flora of Kazakhstan [13], seven hawthorn species are recorded in the country, including C. sanguinea Pall., C. altaica Lge., C. pontica C. Koch., C. songarica C. Koch., C. turkestanica Pojark., C. almaatensis Pojark., and C. ambigua C.A. Mey ex. A.K. Beck. Other studies [14,15] list two additional species, C. chlorocarpa Lenne & K. Koch. and C. korolkowii L. Henry. Notably, C. almaatensis is endemic to Kazakhstan, while C. ambigua is endemic to the Caspian region [16,17]. C. ambigua, commonly known as Russian hawthorn, is a broadleaf deciduous tree (4.5–12 m in height) that is native to Eastern Europe and Western Asia and is characterized by white flowers, stems bearing thorny spines, and initially reddish fruits (1.5 cm long). It can survive as a hardy plant in USDA Zone 5 (4–9), and taxonomic, morphological, ecological, and additional resources can be found at the links in References for Kew Botanic Gardens Plants of the World Online, World Flora Online, Global Biodiversity Information Facility, and horticultural information is available at Oregon State University Landscape Plants and Plant Select, among others. C. ambigua C.A. Mey. ex A.K. Becker (sometimes referred to simply as C. ambigua C.A. Mey.) is a woody plant of the family Rosaceae, which is native to arid regions of Eurasia, including Kazakhstan. The correct taxonomic designation of the species is confirmed in the Kew Royal Botanic Gardens—Plants of the World Online (POWO) database [18]. To ensure accuracy in scientific publications, it is important to provide full taxonomic attribution, especially when discussing the species’ morphological, ecological and phylogenetic features. Online resources such as the Global Biodiversity Information Facility are available [19], and World Flora Online [20] and specialized botanical catalogs [21] provide valuable data on the distribution, ecology, and anatomical characteristics of C. ambigua [22].
Global environmental changes and increasing anthropogenic pressure make natural populations of endemic species particularly vulnerable [23]. These species, often restricted to small areas and narrow ecological niches, are susceptible to environmental changes, habitat reduction, and population decline. In the Mangystau Region, C. ambigua is an essential study subject as a key component of desert forests. It is a species in the Red Books of Kazakhstan [24] and Mangystau [25]. Despite its ecological significance, the International Union for Conservation of Nature (IUCN) classifies C. ambigua as a Data Deficient (DD) taxon, emphasizing the need for further research [26].
In Kazakhstan, C. ambigua is distributed across the Western and Eastern Karatau Mountains, Northern Aktau, Tyubkaragan Peninsula, and Northern Ustyurt escarpments. Outside the country, it is found in the Caucasus and Iran [27]. The species typically grows in lower parts of gorges with temporary or permanent watercourses, playing a critical role in stabilizing desert ecosystems and maintaining local biodiversity [28].
The Mangystau Region’s arid environment is characterized by high drought, extreme temperature fluctuations, and limited water resources. Under these conditions, woody species like C. ambigua are crucial for preventing soil erosion, maintaining water balance, and supporting biodiversity. Desert forests where C. ambigua occurs provide habitats for various plant and animal species while contributing to the region’s carbon balance.
Previous research has examined the phytocenotic and morphological characteristics of C. ambigua populations [29,30] and certain anatomical features [31,32]. However, no comparative analysis of anatomical traits across multiple populations has been conducted. Vegetative organ structures vary with environmental factors such as temperature, light, altitude, soil properties, and anthropogenic influence [33,34,35,36,37]. These structural changes can serve as indicators of plant adaptation to stress.
Studying the anatomical features of C. ambigua contributes to understanding the mechanisms underlying its resilience to harsh conditions. Integrating morpho-anatomical studies with ecological and physiological observations offers valuable insights into plant adaptation processes. This is particularly relevant for endemic species like C. ambigua, critical for biodiversity conservation and potential applications in bioresource programs. This study aims to assess the anatomical features of the leaves and young shoots of C. ambigua from various populations in the Mangystau Region of Western Kazakhstan. Special focus is given to the species’ role in desert forests and its adaptations to the region’s extreme conditions.
2. Materials and Methods
2.1. Study Area and Climate
The study area is in the western part of the Karatau mountain system, Mangystau Region, Kazakhstan, known for its biologically diverse arid flora, including valuable fruit and berry trees. Karatau spans 110 km from west to east and 12 km in width, divided into Western and Eastern Mangystau. Mount Beshoky (552 m) is the highest peak in Western Mangystau. The region features mountain gorges with isolated ecosystems formed from Permian metamorphic limestones, sandstones, and conglomerates. The climate is sharply continental and arid, with hot summers and cold winters. The Caspian Sea slightly moderates the environment along the coast, increasing the humidity and reducing the temperature fluctuations. Annual precipitation is below 200 mm, peaking in spring, with extreme variations between 50 mm and 250 mm every 5–10 years. Strong winds occur for 90 days annually, often causing dust storms. Summers reach +42 to +43 °C, while winter temperatures drop to −42 °C, with a frost-free period of 180 days. The region receives 2500 h of sunshine annually, with average annual temperatures of +12.6 °C [38].
2.2. Plant Materials
Twelve populations across the Mangystau Region were selected for material collection for the anatomical analysis of C. ambigua (young shoots and leaves). The sampling locations included the following gorges: Karasau, Kendirli, Akmysh, Samal, Zhemsem-Sai, Kogez, and Botakan (Western Karatau range); Emdikorgan gorge (Northern Aktau range); and Tulkyli-Sai, Sultan Epe, Karakozayim, and Kezim (Tyubkaragan Peninsula). Table 1 provides a detailed description of these populations. Photographs of the area and the geographic location of the populations are shown in Figure 1.

Table 1.
Description of natural populations of C. ambigua.
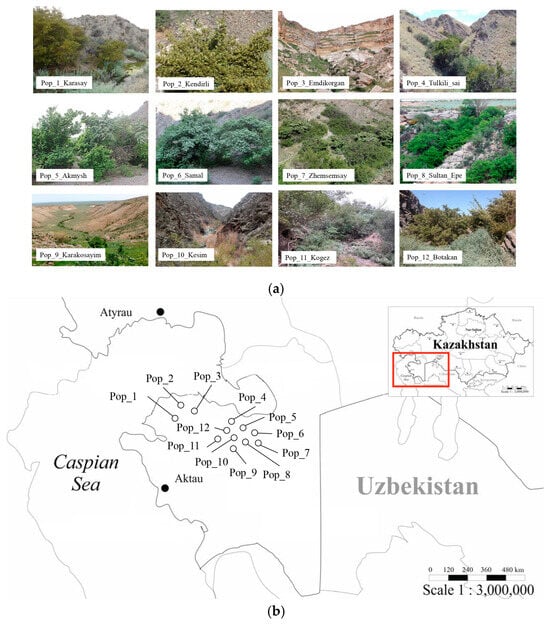
Figure 1.
Photographs (a) and distribution map (b) of the populations: Pop_1 Karasay, Pop_2 Kendirli, Pop_3 Emdikorgan, Pop_4 Tulkili_Sai, Pop_5 Akmysh, Pop_6 Samal, Pop_7 Zhemsem-Say, Pop_8 Sultan_Epe, Pop_9 Karakosayim, Pop_10 Kesim, Pop_11 Kogez, Pop_12 Botakan.
2.3. Floristic, Ecological, and Anatomical Methods of Analysis
This study examined literary sources and regional research. The investigation of birch and alder communities followed the established methodologies of V.N. Sukachev, V.S. Zon, and G.P. Motovilov [39], and V.N. Sukachev and N.V. Dylis [40]. The geobotanical assessment was conducted using forest stand taxation methods [41]. Soil conditions were classified according to standard soil taxonomy methods and the recommendations of the Diagnostic Horizons of Soils in the World [42]. Over 100 geobotanical descriptions were compiled, documenting the sample sites’ geographical location, relief, environment, and microrelief. A total of 3–6 sample plots (0.25–0.5 ha) were established to define their complex characteristics. The forest stand was assessed using standard density and stock tables, the site quality was determined visually, and the stand composition was analyzed based on stem species. The shrub layer was described by species composition, height, and general condition. Species identification was verified using POWO data [38]. For anatomical analysis, the organs of C. ambigua were fixed in Strauss–Fleming solution (96% ethanol–50% glycerin–distilled water in a ratio of 1:1:1) [43,44]. Fully developed, undamaged leaves from the middle portion of the shoots were selected for the study. Up to twenty plants were chosen from each population. Fragments of the leaf from its middle section, located between the central vein and the edge, were used for microscopy. Cross-sections of young (annual) shoots were taken along their entire length at 2–3 cm intervals. Sections were prepared using an OMT freezing microtome, and micro-preparations were cleared with glycerin. The samples were analyzed using a scanning microscope “MT 4310 L” (Melji-Techno) equipped with a BisionCamV 500B camera BisonCam 500B camera (Bison Electronics Inc., Taipei City, Taiwan). Image processing was carried out using the Bivisual Studio software Visual Studio software (Version 17.13, Microsoft Corporation, Redmond, WA, USA). The literature data were used as references to describe the micro-preparations [45,46,47,48,49,50]. Measurements of microscopic parameters were conducted using the ImageJ software ImageJ software (Version 1.53t, National Institutes of Health (NIH), Bethesda, MD, USA).
2.4. Statistical Analyses
Statistical analysis was conducted using R software (Version 4.4.3, R Foundation for Statistical Computing, Vienna, Austria) [51] to examine the anatomical traits of C. ambigua and assess its environmental influences. Mean (M), standard error (SE), and coefficient of variation (CV) were calculated to evaluate trait stability and variability within and between populations [52]. Biodiversity indices were used to analyze birch and alder sites, including the Taxa S, Individuals, Dominance D, Simpson 1-D, Shannon H, Evenness e H/S, Brillouin, Menhinick, Margalef, Equitability J, Fisher alpha, Berger–Parker, and Chao 1 indices [53]. A one-way ANOVA tested for significant differences between populations, with Tukey’s HSD post hoc test used for pairwise comparisons, minimizing false positives [54,55]. Pearson’s correlation assessed the relationships between anatomical traits, with significance set at p < 0.05 [56]. Principal component analysis (PCA) identified key factors influencing variability, ranking principal components by their contribution to total variance [57]. Canonical Correlation Analysis (CCA) examined the relationships between environmental factors (soil type, water availability, altitude) and anatomical traits, integrating multiple data sources to determine key environmental influences [58].
3. Results
3.1. Floristic and Ecological Analysis
Comprehensive research was conducted to describe the studied territories’ floristic composition and ecological characteristics. The following section provides an in-depth analysis of plant communities, soil composition, and environmental influences across multiple gorges and landscapes in the Western Karatau, Northern Aktau, and Tubkaragan Peninsula regions.
Population 1: The Karasay gorge in Western Karatau is characterized by a hawthorn–mint–herbaceous community (Crataegus ambigua C.A.Mey. ex A.K.Becker–Mentha longifolia (L.) Huds.–Herba xerophytica A.G. Krasnov) comprising 51 species. The gorge spans approximately 2000 × 30–50 m, featuring a slightly winding shape. The slopes reach 20–25 m, with gentle inclines and steep sections. The soils are predominantly clayey and stony, with scree deposits at the base. A stream with potable water flows through the bottom of the gorge, influencing the vegetation structure and providing an essential moisture source in this arid environment. The plant community includes various species, including Achnatherum splendens (Trin.) Nevski, Agropyrum desertorum (Fisch. ex Link) Schult., Centaurea adpressa Ledeb., Cynanchum acutum subsp. sibiricum (Willd.) Rech.fil., Echinochloa crus-galli (L.) P.Beauv., Glycyrrhiza aspera Pall., Inula britannica L., Matthiola superba Conti, Peganum harmala L., Poa bulbosa L., and Rubus caesius L. The overall vegetation cover is 61%, indicating moderate density, with species being adapted to dry and semi-arid conditions. The soils exhibit low humus content (0.43%), high carbonate levels (8.3%), and low water-soluble salt levels (0.15%), suggesting a relatively nutrient-poor but well-drained substrate. Livestock grazing in the area impacts vegetation dynamics, potentially influencing species’ composition and regeneration. This ecosystem, shaped by the topography, soil composition, and water availability, supports a unique blend of xerophytic, mesophytic, and ruderal species, contributing to the overall biodiversity of the Western Karatau region.
Population 2: The Kendirli gorge in Western Karatau is characterized by a hawthorn–buckthorn–herbaceous community (Crataegus ambigua C.A.Mey. ex A.K.Becker–Rhamnus erythroxyloides subsp. sintenisii (Rech.f.) Mabb–Herba xerophytica A.G. Krasnov) comprising 48 species. The gorge spans approximately 5500 × 30–120 m, featuring a deep, rugged terrain. The slopes vary significantly in height, ranging from 60 to 200 m, with diverse exposures: the northern slopes are gentle and clayey and stony, while the southern slopes are steep, cliff-like, and gravelly. A freshwater stream runs through the bottom of the gorge, providing an essential moisture source in this arid environment and influencing the local vegetation structure. The soil composition is predominantly brown and clayey, supporting a moderate vegetation cover of 52%. The region is subject to livestock grazing, which may impact the plant community dynamics. The plant community consists of a diverse range of species, including Acanthophyllum pungens (Bunge) Boiss., Agropyron desertorum (Fisch. ex Link) J.A.Schultes, Alhagi pseudalhagi (M.Bieb.) Desv., Artemisia austriaca L., Caragana grandiflora DC., Centaurea adpressa Ledeb., Cynanchum acutum L., Echinochloa crus-galli (L.) P.Beauv., Ephedra distachya L., Inula britannica L., Peganum harmala L., Poa bulbosa L., Polygonum aviculare L., Stellaria media (L.) Vill., Tamarix ramosissima Ledeb., Teucrium polium L., Verbascum songaricum Schrenk, and Ziziphora tenuior L. The soil analysis indicates a low humus content (0.31%), high carbonate levels (7.7%), and low water-soluble salt levels (0.17%), suggesting a relatively nutrient-poor but well-drained substrate. These conditions favor the establishment of xerophytic and semi-arid adapted species, contributing to the biodiversity of the Western Karatau region.
Population 3: The Emdikorgan gorge in Northern Aktau is characterized by a hawthorn–buckthorn–herbaceous community (Crataegus ambigua C.A.Mey. ex A.K.Becker–Rhamnus sintenesii–Herba xerophytica) comprising 60 species. The gorge spans approximately 350 × 50 m, forming a narrow, rugged terrain with steep, cliff-like slopes composed of limestone and shallow clay and gravel soils. Seasonal water streams appear in spring, influencing the vegetation structure and providing an intermittent moisture source in this arid environment. Unlike other gorges, livestock grazing is absent, allowing for relatively undisturbed plant growth. The plant community consists of a variety of species, including Acanthophyllum pungens, Achnatherum splendens, Agropyron fragile, Artemisia gurganica, Artemisia lercheana, Atraphaxis replicata, Caragana grandiflora, Crataegus ambigua, Cynodon dactylon, Ephedra distachya, Falcaria vulgaris, Inula britannica, Juncus articulatus, Medicago romanica, Mentha longifolia, Nepeta cataria, Peganum harmala, Poa bulbosa, Polygonum aviculare, Rhamnus sintenesii, Rubus caesius, Stellaria media, Stipa caucasica, Tanacetum santolina, Teucrium polium, Verbascum blattaria, and Ziziphora tenuior. The overall vegetation cover is 40%, indicating moderate density, with species adapted to dry and semi-arid conditions. The soils exhibit low humus content (0.45%), high carbonate levels (9.8%), and low water-soluble salt levels (0.33%), suggesting a nutrient-poor but well-drained substrate. This ecosystem, shaped by the topography, soil composition, and water availability, supports a unique blend of xerophytic and ruderal species, contributing to the overall biodiversity of the Northern Aktau region.
Population 4: The Tulkili-Sai gorge on the Tubkaragan Peninsula is characterized by a hawthorn–buckthorn–caragana–herbaceous community (Crataegus ambigua C.A.Mey. ex A.K.Becker–Rhamnus sintensii–Caragana grandiflora–Herba xerophytica), comprising 65 species. The gorge spans approximately 600 × 200 m, with steep slopes on the northern side and gentler inclines on the southern side. The soils are predominantly brown, clayey, and gravelly, providing a substrate that supports a mix of xerophytic and mesophytic vegetation. The absence of livestock grazing allows for a relatively undisturbed plant community. The plant community consists of a variety of species, including Acanthophyllum pungens, Achnatherum splendens, Agropyrum desertorum, Alhagi pseudalhagi, Artemisia gurganica, Artemisia lercheana, Atraphaxis replicata, Caragana grandiflora, Centaurea adpressa Ledeb., Crataegus ambigua, Ephedra distachya, Lagochilus acutilobus, Medicago sativa, Melica taurica, Mentha longifolia, Nepeta cataria, Phragmites communis, Plantago salsa, Poa bulbosa, Polygonum convolvulus, Rhamnus sintenesii, Rubus caesius, Stellaria media, Stipa caspia, Tanacetum santolina, Teucrium polium, Verbascum blattaria, Veronica anagalloides, and Ziziphora tenuior. The overall vegetation cover is 30%, indicating moderate density, with species adapted to semi-arid conditions. The soils exhibit low humus content (0.74%), moderate carbonate levels (6.1%), and low water-soluble salt levels (0.18%), suggesting a nutrient-poor but well-drained substrate. This ecosystem, shaped by the topography, soil composition, and moisture availability, supports a diverse range of xerophytic, mesophytic, and ruderal plant species, contributing to the overall biodiversity of the Tubkaragan Peninsula.
Population 5: The Akmysh gorge in Western Karatau is characterized by a hawthorn–buckthorn–herbaceous community (Crataegus ambigua C.A.Mey. ex A.K.Becker–Rhamnus sintenesii–Herba xerophytica) comprising 58 species. The gorge spans approximately 1300 × 70 m, with steep slopes and rocky cliffs dominating the landscape. A seasonal stream flows through the valley but dries up during summer, influencing the distribution and composition of the vegetation. The soils consist of gravelly and rocky substrates with clayey patches, creating a heterogeneous environment that supports a mix of xerophytic and mesophytic species. Livestock grazing is present in the area, potentially affecting species’ composition and regeneration. The plant community consists of a variety of species, including Achnatherum splendens, Agropyron fragile, Alhagi pseudalhagi, Atraphaxis replicata, Atraphaxis spinosa, Caragana grandiflora, Centaurea squarossa, Crataegus ambigua, Cynanchum acutum L., Ephedra distachya, Elaeagnus oxycarpa, Inula britannica, Lagochilus acutilobus, Marrubium vulgare, Mentha longifolia, Nepeta cataria, Peganum harmala, Phragmites communis, Poa bulbosa, Polygonum convolvulus, Prangos odontalgica, Rhamnus sintenesii, Rosa laxa, Rubus caesius, Stellaria media, Stipa caspia, Tanacetum santolina, Teucrium polium, Verbascum songaricum, Veronica anagalloides, and Ziziphora tenuior. The overall vegetation cover is 65%, indicating a moderate to high density, with species being well adapted to semi-arid conditions. The soils exhibit moderate humus content (0.52%), carbonate levels of 6.4%, and low water-soluble salt levels (0.21%), suggesting a well-drained but nutrient-poor substrate. This ecosystem, shaped by the topography, soil composition, and seasonal water availability, supports a diverse range of xerophytic, mesophytic, and ruderal species, contributing to the overall biodiversity of the Western Karatau region.
Population 6: The Samal gorge in Western Karatau is characterized by a hawthorn–herbaceous community (Crataegus ambigua C.A.Mey. ex A.K.Becker–Herba xerophytica) comprising 55 species. The gorge extends 2500 × 100 m, with moderate to steep slopes shaping the landscape. A freshwater stream runs through the valley, providing an essential moisture source in this semi-arid environment. The soils consist of brown, clayey, and rocky substrates, creating a diverse ecological gradient that supports a variety of xerophytic and mesophytic plant species. Livestock grazing is present in the area, potentially affecting vegetation composition and regeneration. The plant community consists of a variety of species, including Acanthophyllum pungens, Agropyron fragile, Alhagi pseudalhagi, Alyssum dasycarpum, Artemisia austriaca, Artemisia gurganica, Atraphaxis replicata, Atraphaxis spinosa, Caragana grandiflora, Crataegus ambigua, Echinops ritro, Elaeagnus oxycarpa, Ephedra distachya, Galium aparine, Lagochilus acutilobus, Malus sieversii, Marrubium vulgare, Mentha longifolia, Nepeta cataria, Phragmites communis, Poa bulbosa, Polygonum aviculare, Rhamnus sintenesii, Rubus caesius, Salix alba, Stellaria media, Stipa caspia, Stipa caucasica, Taraxacum androssovii, Teucrium polium, Trachomitum scabrum, Ulmus pumila, Veronica amoena, and Ziziphora tenuior. The overall vegetation cover is 50%, indicating a moderate density, with species well-adapted to semi-arid conditions. The soils exhibit low humus content (0.39%), moderate carbonate levels (7.3%), and low water-soluble salt levels (0.12%), suggesting a nutrient-poor but well-drained substrate. This ecosystem, shaped by the topography, soil composition, and water availability, supports a rich blend of xerophytic, mesophytic, and ruderal species, contributing to the overall biodiversity of the Western Karatau region.
Population 7: The Zhemsem-Say gorge in Western Karatau is characterized by a hawthorn–buckthorn–herbaceous community (Crataegus ambigua C.A.Mey. ex A.K.Becker–Rhamnus sintenesii–Herba xerophytica) comprising 63 species. The gorge spans approximately 800 × 100 m, with steep, rocky slopes that shape the local vegetation structure. Shallow groundwater significantly sustains plant diversity, offering an additional moisture source in this semi-arid environment. The soils are brown and loamy, supporting a range of xerophytic and mesophytic species. Livestock grazing is present in the area, potentially impacting species’ composition and regeneration. The plant community consists of a variety of species, including Achnatherum caragana, Agropyron fragile, Alhagi pseudalhagi, Alyssum dasycarpum, Alyssum turkestanicum, Amaranthus blitoides, Anabasis aphylla, Artemisia austriaca, Artemisia gurganica, Atraphaxis replicata, Caragana grandiflora, Crataegus ambigua, Cynodon dactylon, Echinops ritro, Ephedra distachya, Fumaria parviflora, Inula britannica, Lagochilus acutilobus, Marrubium vulgare, Medicago sativa, Mentha longifolia, Nepeta cataria, Peganum harmala, Plantago lanceolata, Poa bulbosa, Polygonum convolvulus, Potentilla pedata, Rhamnus sintenesii, Rosa laxa, Salix alba, Stellaria media, Stipa caspia, Stipa caucasica, Teucrium polium, Verbascum songaricum, Veronica anagalloides, and Ziziphora tenuior. The overall vegetation cover is 54%, indicating a moderate density, with species well-adapted to semi-arid conditions. The soils exhibit moderate humus content (0.56%), high carbonate levels (8.6%), and low water-soluble salt levels (0.23%), suggesting a nutrient-poor but well-drained substrate. This ecosystem, shaped by the topography, soil composition, and groundwater presence, supports a diverse mix of xerophytic, mesophytic, and ruderal species, contributing to the overall biodiversity of the Western Karatau region.
Population 8: The Sultan Epe Canyon in the Tubkaragan Peninsula is characterized by a hawthorn–mulberry–herbaceous community (Crataegus ambigua C.A.Mey. ex A.K.Becker–Morus alba–Herba xerophytica) comprising 43 species. This coastal canyon extends approximately 500 m, with steep rocky walls and clayey soils interspersed with frequent bedrock exposures. The soil composition is brown and loamy, providing a stable yet nutrient-poor substrate for vegetation. The absence of livestock grazing has allowed for the relatively undisturbed growth of plant species. The plant community consists of a variety of species, including Agropyron fragile, Alhagi pseudalhagi, Artemisia gurganica, Atraphaxis spinosa, Caragana grandiflora, Centaurea squarossa, Crataegus ambigua, Echinops ritro, Ephedra aurantiaca, Ephedra distachya, Galium aparine, Lactuca undulata, Marrubium vulgare, Medicago romanica, Mentha longifolia, Nepeta cataria, Onosma staminea, Phragmites communis, Plantago lanceolata, Poa bulbosa, Polygonum aviculare, Rhamnus sintenesii, Rubus caesius, Stellaria media, Stipa caspia, Stipa caucasica, Tanacetum santolina, Teucrium polium, Verbascum songaricum, Xanthium strumarium, and Ziziphora tenuior. The overall vegetation cover is 36%, indicating a sparse density, with species well-adapted to coastal and arid conditions. The soils exhibit very low humus content (0.23%), moderate carbonate levels (7.5%), and low water-soluble salt levels (0.17%), suggesting a dry and well-drained environment. This ecosystem, shaped by the topography, soil composition, and coastal influences, supports a specialized assemblage of xerophytic and mesophytic plant species, contributing to the overall biodiversity of the Tubkaragan Peninsula.
Population 9: The Karakosayim gorge on the Tubkaragan Peninsula is characterized by an herbaceous–hawthorn community (Herba xerophytica–Crataegus ambigua) comprising 41 species. The gorge features highly eroded slopes with limestone-based, clayey, and gravelly soils, creating a rugged terrain. The soil composition is calcareous loamy, which influences plant distribution and supports a variety of xerophytic species. Livestock grazing is present in the area, likely affecting species composition and regeneration dynamics. The plant community consists of a variety of species, including Acanthophyllum pungens, Agropyron fragile, Alhagi pseudalhagi, Anisantha tectorum, Artemisia gurganica, Artemisia lessingiana, Atraphaxis replicata, Caragana grandiflora, Crataegus ambigua, Echinops ritro, Eremopyrum triticeum, Gallium humifusum, Ixiliorion tataricum, Marrubium vulgare, Medicago romanica, Mentha longifolia, Nepeta cataria, Phragmites communis, Plantago major, Poa bulbosa, Polygonum aviculare, Rhamnus sintenesii, Rubus caesius, Stipa caspia, Stipa caucasica, Tanacetum santolina, Teucrium polium, Verbascum songaricum, Veronica amoena, and Ziziphora tenuior. The overall vegetation cover is 47%, indicating a moderate density, with species well-adapted to semi-arid conditions. The soils exhibit very low humus content (0.22%), high carbonate levels (12.2%), and low water-soluble salt levels (0.4%), suggesting a nutrient-poor but well-drained substrate. This ecosystem, shaped by the topography, soil composition, and grazing pressure, supports a specialized assemblage of xerophytic, mesophytic, and ruderal plant species, contributing to the overall biodiversity of the Tubkaragan Peninsula.
Population 10: The Kesim gorge on the Tubkaragan Peninsula are characterized by a hawthorn–herbaceous community (Crataegus ambigua C.A.Mey. ex A.K.Becker–Morus alba–Herba xerophytica) comprising 48 species. The landscape consists of gentle slopes with sandstone and gravelly scree, creating a unique ecological setting. The soil composition is brown and sandy, providing a well-drained but nutrient-poor substrate for plant growth. The absence of livestock grazing in the area allows for relatively undisturbed vegetation dynamics. The plant community consists of a variety of species, including Achnatherum caragana, Agropyron fragile, Alhagi pseudalhagi, Anisantha tectorum, Artemisia austriaca, Artemisia lessingiana, Caragana grandiflora, Crataegus ambigua, Echinops ritro, Ephedra distachya, Epilobium tetragonum, Eremopyrum triticeum, Fumaria parviflora, Inula britannica, Lactuca undulata, Marrubium vulgare, Medicago sativa, Mentha longifolia, Nepeta cataria, Phragmites communis, Poa bulbosa, Polygonum aviculare, Prangos odontalgica, Rhamnus sintenesii, Rubus caesius, Stellaria media, Stipa caspia, Stipa caucasica, Tanacetum santolina, Teucrium polium, Verbascum songaricum, and Ziziphora tenuior. The overall vegetation cover is 35%, indicating a sparse density, with species well-adapted to semi-arid and coastal conditions. The soils exhibit low humus content (0.35%), moderate carbonate levels (8.1%), and low water-soluble salt levels (0.21%), suggesting a dry, well-drained environment. This ecosystem, shaped by the topography, soil composition, and coastal influences, supports a specialized mix of xerophytic and mesophytic plant species, contributing to the overall biodiversity of the Tubkaragan Peninsula.
Population 11: The Kogez gorge in Western Karatau is characterized by a caragana–wormwood community with hawthorn (Caragana grandiflora–Artemisia spp.–Crataegus ambigua) comprising 56 species. The gorge extends 2000 × 50–100 m, with moderate slopes and gravelly brown soils that shape the local vegetation structure. The soil composition is brown and stony, providing a well-drained but nutrient-poor environment. The absence of livestock grazing has allowed for relatively undisturbed vegetation, promoting natural species composition and regeneration. The plant community consists of a variety of species, including Acanthophyllum pungens, Achnatherum splendens, Agropyron fragile, Alhagi pseudalhagi, Artemisia austriaca, Artemisia gurganica, Atraphaxis replicata, Caragana grandiflora, Crataegus ambigua, Echinops ritro, Elaeagnus oxycarpa, Ephedra distachya, Equisetum ramosissimum, Marrubium vulgare, Medicago romanica, Mentha longifolia, Nepeta cataria, Phragmites communis, Plantago lanceolata, Poa bulbosa, Prangos odontalgica, Rhamnus sintenesii, Rosa iliensis, Rosa laxa, Rubus caesius, Salix alba, Setaria verticillata, Stipa caucasica, Tamarix ramosissima, Teucrium polium, Ulmus pumila, Veronica anagalis-aquatica, and Xanthium strumarium. The overall vegetation cover is 55%, indicating a moderate density, with species well-adapted to semi-arid conditions. The soils exhibit moderate humus content (0.47%), moderate carbonate levels (7.9%), and low water-soluble salt levels (0.18%), suggesting a dry but stable ecosystem. This ecosystem, shaped by the topography, soil composition, and water availability, supports a diverse mix of xerophytic, mesophytic, and ruderal plant species, contributing to the overall biodiversity of the Western Karatau region.
Population 12: The Botakan gorge in Western Karatau is characterized by an herbaceous–hawthorn community (Herba xerophytica–Crataegus ambigua) comprising 39 species. The gorge features variable slopes ranging from 50 to 150 m in height, with rocky and clayey soils dominating the terrain. The soil composition is brown and loamy, providing a stable but nutrient-poor substrate for plant growth. The absence of livestock grazing in the area has allowed for relatively undisturbed vegetation dynamics, preserving natural species diversity. The plant community consists of a variety of species, including Agropyron fragile, Alhagi pseudalhagi, Alyssum turkestanicum, Artemisia gurganica, Artemisia lercheana, Atraphaxis replicata, Caragana grandiflora, Centaurea squarossa, Crataegus ambigua, Cynodon dactylon, Descurainia sophia, Echinops ritro, Ephedra aurantiaca, Gallium humifusum, Lactuca undulata, Lepidium ruderale, Marrubium vulgare, Medicago sativa, Mentha longifolia, Nepeta cataria, Onosma staminea, Phragmites communis, Plantago lanceolata, Poa bulbosa, Polygonum aviculare, Prangos odontalgica, Rubus caesius, Stellaria media, Stipa caspia, Stipa caucasica, Tamarix laxa, Teucrium polium, Verbascum songaricum, and Ziziphora tenuior. The overall vegetation cover is 63%, indicating a moderate to high density, with species well-adapted to semi-arid conditions. The soils exhibit very low humus content (0.13%), moderate carbonate levels (8.3%), and low water-soluble salt levels (0.14%), suggesting a dry, well-drained, but mineral-rich environment. This ecosystem, shaped by the topography, soil composition, and the absence of grazing pressure, supports a specialized mix of xerophytic and mesophytic plant species, contributing to the overall biodiversity of the Western Karatau region. The studied gorges exhibit distinct plant communities shaped by the topography, soil composition, water availability, and anthropogenic factors such as grazing. The dominant presence of xerophytic and mesophytic species highlights the vegetation’s adaptation to arid and semi-arid environments, contributing to the overall biodiversity of the Western Karatau and Tubkaragan Peninsula regions.
3.2. Analysis of Population Biological Diversity
This paper analyzed the species diversity of 12 plant populations using modern ecological indices. The results reflect the features of the community structure, allow for the identification of the most valuable areas in terms of biological diversity, and provide an opportunity to substantiate recommendations for the conservation and rational use of plant resources in the studied areas. Detailed indicators are presented in Table 2.
Table 2.
Leading indicators of biological alpha diversity indices for the study areas.
The highest species richness is found in the populations Pop_4 (63 species) and Pop_7 (62 species), and the lowest in Pop_12 (39 species) and Pop_9 (41 species). Dominance indices (Dominance_D, Berger–Parker) are highest in Pop_12 and Pop_9, indicating a strong predominance of these individual species, and lowest in Pop_4 and Pop_7, where dominance is minimal and the species are represented more evenly. The Simpson and Shannon diversity indices confirm that Pop_4 and Pop_7 are the communities with the most diverse species composition (Simpson_1-D reaches 0.9841 and 0.9839, respectively; ShannonH_log2 reaches 5.977 and 5.954). In contrast, the lowest diversity, calculated using these indices, is observed in Pop_12 (Simpson_1-D = 0.9744; ShannonH_log2 = 5.285) and Pop_9 (Simpson_1-D = 0.9756; ShannonH_log2 = 5.358). The Evenness index shows that despite the lower total number of species, Pop_12 and Pop_9 are more evenly represented. In comparison, Pop_4 and Pop_7 have a high diversity due to having a higher number of species and a less even distribution. The Menhinik and Margalef indices also confirm the high significance of Pop_4 and Pop_7 in terms of species richness and diversity, while Pop_12 and Pop_9 remain the least diverse. The predicted Chao 1 index confirms this trend, suggesting the highest potential for species richness in Pop_4 and Pop_7 and the lowest in Pop_12 and Pop_9. Thus, from the point of view of biological diversity, Pop_4 and Pop_7 should be recognized as the most valuable and ecologically sustainable, which require priority attention when implementing measures to monitor and protect biodiversity. At the same time, less diverse populations (Pop_12 and Pop_9) may be more vulnerable. Therefore, they require separate studies of the causes of diversity decline and the development of measures for their conservation and restoration (Figure 2).
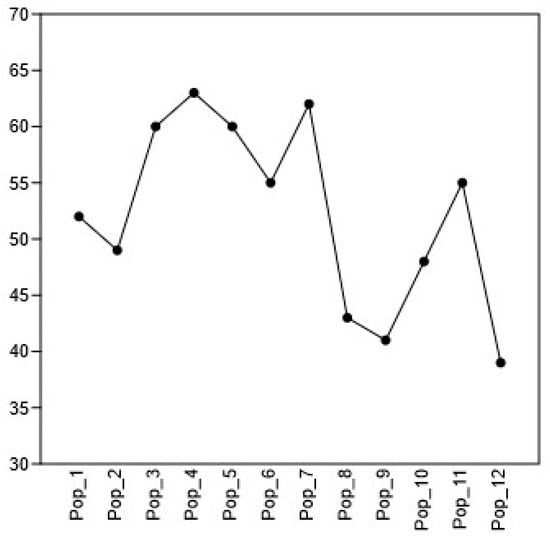
Figure 2.
Changes in the number of taxa in different populations of C. ambigua (Pop_1 Karasay, Pop_2 Kendirli, Pop_3 Emdikorgan, Pop_4 Tulkili sai, Pop_5 Akmysh, Pop_6 Samal, Pop_7 Zhemsemsay, Pop_8 Sultan_Epe, Pop_9 Karakosayim, Pop_10 Kesim, Pop_11 Kogez, and Pop_12 Botakan).
This graph reflects the distribution of species richness (S is the number of species) in the 12 studied populations (Pop_1–Pop_12). It clearly illustrates a trend towards changes in the number of species between populations, with designated confidence intervals reflecting the variability of the data. The highest species richness is observed in populations Pop_4 and Pop_7, reaching peak values of more than 60 species. The S values for these populations are significantly higher than those for the others. Pop_3, Pop_5, and Pop_6 populations also demonstrate relatively high values (about 55–60 species). The smallest number of species are observed in Pop_12, Pop_9, and Pop_8, where the numbers of species do not exceed 45, and in the case of Pop_12, the number is minimal (about 39 species). These populations are characterized by a noticeable decrease in species richness compared to the others. Thus, the graph visually confirms the conclusions about the most and least diverse populations, emphasizing the need for a priority study of the reasons for the decline in the diversity of Pop_12, Pop_9, and Pop_8 and the possible measures to increase and preserve it. The results of the species richness assessment are presented below. The observed number of species (Observed S) is 138 in Table 3.
Table 3.
Assessment of species richness.
The following different methods present estimates of potential species richness (adjusted for possible unaccounted species): Chao 2, Jackknife 1 and Jackknife 2, and Bootstrap. According to the original data, the Chao 2 index gives an estimated species richness of 144.7 (standard deviation 4.22), and Jackknife 1 gives an estimate of 156.3 (standard deviation 5.95), Jackknife 2 of 154.1, and the Bootstrap method of 148.7. The obtained estimates exceed the observed species richness (138 species), which indicates the presence of unidentified species and suggests a possible increase in the total number of species with additional research. Based on Bootstrap replications, the mean values are somewhat lower: Chao 2—136.1 (±10.00), Jackknife 1—143.8 (±9.66), Jackknife 2—143.6 (±15.49), and Bootstrap—130.7 (±7.30). This confirms that the accurate estimates of potential species richness are likely in the range of approximately 131 to 157 species. The data reflect the values of global beta diversity according to different methods and indices (Table 4). The Whittaker index demonstrates an extremely high value (1,647,611.00), which is usually not typical for this index and may indicate an incorrect record or a computational error.
Table 4.
Global beta diversities.
The presented data reflect the values of global beta diversity according to different methods and indices (Table 4): The Whittaker index demonstrates an extremely high value (1,647,611.00), which is usually not typical for this index and may indicate an incorrect record or a computational error.
The Harrison index (0.1492) and Harrison 2 (0.10823) demonstrate relatively low values, indicating moderate differences between communities in terms of species composition. The Cody (257.5) and especially the Wilson–Shmida (2,696,313.00) indices show high values. The Wilson–Shmida index value also looks unrealistically high and requires rechecking, since this index rarely reaches such large values. The Routledge (0.31555), Mourelle (0.44802), and Williams (0.54348) indices provide moderate and more realistic values. In particular, the Williams index indicates an average degree of difference between communities in terms of species composition. Thus, based on more realistic indices (Harrison, Routledge, Mourelle, Williams), it can be concluded that the studied communities demonstrate a moderate degree of differences (beta diversity). The high values of Whittaker and Wilson–Shmida are probably the result of an error and require the rechecking of the calculations. Analysis of the pairwise distance matrix allowed us to identify the degree of similarity and the differences in species composition between the 12 populations studied (Table 5).
Table 5.
Analysis of the pairwise distance matrix.
The highest species similarity (the lowest distance values) was found between Pop_8 and Pop_12 (0.2439), Pop_6 and Pop_11 (0.30909), Pop_8 and Pop_6 (0.32653), Pop_1 and Pop_2 (0.32673), and Pop_3 and Pop_4 (0.33333). Similar growing conditions characterize these pairs, with identical species compositions in communities. The most significant differences were noted between the populations Pop_2 and Pop_11 (0.65385), Pop_1 and Pop_11 (0.64486), Pop_1 and Pop_12 (0.62637), Pop_2 and Pop_7 (0.62162), Pop_2 and Pop_6 (0.61538), and Pop_1 and Pop_7 (0.61404). The high values of the distances between these populations indicate significant differences in species composition, and differences in environmental conditions, which anthropogenic influences or the historical development of communities can explain. In general, the data confirm the high level of beta diversity of the studied communities and allow us to identify individual groups of populations similar in species composition, as well as the populations that differ most significantly from the rest, which is essential to consider when planning conservation measures and biodiversity monitoring strategies.
The graph in Figure 3 shows the species accumulation curve, which shows the dependence of the number of identified species on the number of analyzed samples (sites or populations). As the number of samples (horizontal axis) increases, the total number of identified species (vertical axis) gradually increases, but the rate of increase slows down, demonstrating gradual saturation.
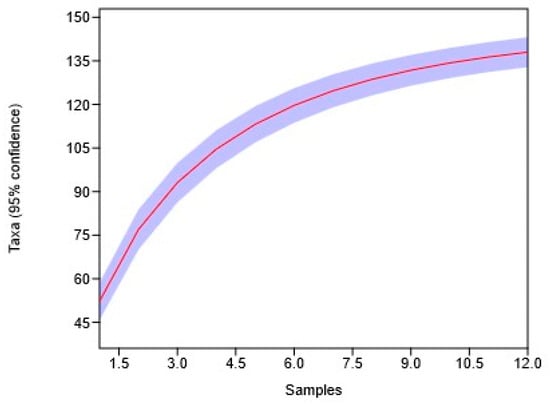
Figure 3.
Graph showing the dynamics of the number of species in the Crataegus ambigua population across 12 sampling locations (Pop_1 Karasay, Pop_2 Kendirli, Pop_3 Emdikorgan, Pop_4 Tulkili Sai, Pop_5 Akmysh, Pop_6 Samal, Pop_7 Zhemsem-Say, Pop_8 Sultan_Epe, Pop_9 Karakosayim, Pop_10 Kesim, Pop_11 Kogez, and Pop_12 Botakan). The red line represents the species accumulation curve, while the purple shaded area indicates the 95% confidence interval.
The curve is close to a plateau, indicating that most species have already been identified in the current analysis of experimental samples (12 samples). Further increases in the number of samples will likely lead to only a slight increase in the total number of species. Thus, the saturation curve ensures that the completed sample volume is sufficient to represent the bulk of the species diversity of the communities studied, but also indicates the possibility of identifying a small number of additional species with an increase in the number of samples (Figure 4).
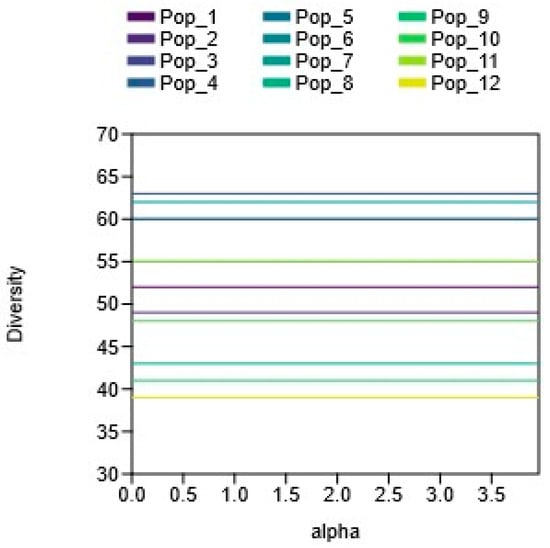
Figure 4.
Alpha diversity of the C. ambigua population (Pop_1 Karasay, Pop_2 Kendirli, Pop_3 Emdikorgan, Pop_4 Tulkili-Sai, Pop_5 Akmysh, Pop_6 Samal, Pop_7 Zhemsem-Say, Pop_8 Sultan_Epe, Pop_9 Karakosayim, Pop_10 Kesim, Pop_11 Kogez, and Pop_12 Botakan).
The graph presented in Figure 4 illustrates the alpha diversity (number of species) for the 12 studied populations (Pop_1–Pop_12). Pop_4, Pop_7, Pop_3, and Pop_5 stand out as having the highest species diversity, with the number of species exceeding 60. An average level of diversity is observed in Pop_1, Pop_2, Pop_6, Pop_10, and Pop_11, with the number of species varying from approximately 48 to 56. The lowest species richness is recorded in Pop_8, Pop_9, and Pop_12 (less than 45 species). These data confirm the presence of pronounced differences between populations in terms of species richness, emphasizing the importance of individual populations, especially the most and least diverse, when developing measures to conserve biodiversity.
Thus, the analysis shows significant differences in the alpha and beta diversity of the studied populations. Pop_4 and Pop_7 represent those with the most remarkable species richness and, accordingly, the most significant ecological value, while the lowest values are recorded in Pop_8, Pop_9, and Pop_12. The differences identified may be related to the peculiarities of the growing conditions, anthropogenic impacts, or other ecological factors. The obtained results should be considered when planning measures for monitoring and protecting biodiversity and in further studies of the region’s ecosystems.
3.3. Anatomical Study of a Leaf and an Annual Shoot of C. ambigua
The young shoots of C. ambigua exhibit a primary anatomical structure in cross-section (Figure 5). Externally, the stem is covered with a single-layered epidermis measuring 19–23 µm in thickness. The epidermal cells are rounded and rectangular and are covered by a thick cuticle layer. This structure is also characteristic of other hawthorn species [59,60]. Beneath the epidermis lies a three-layered lamellar collenchyma, stained dark in color and measuring 83–98 µm in thickness. The zone between the endodermis and the cortical layer is filled with loosely arranged parenchymal cells arranged in 5–6 rows, with a thickness ranging from 148 to 240 µm. The endodermis is single-layered, with its cells being tangentially thickened.
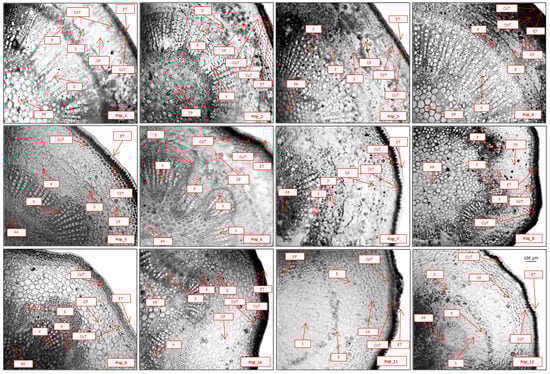
Figure 5.
The anatomical structure of an annual shoot of the populations of C. ambigua (Pop_1 Karasay, Pop_2 Kendirli, Pop_3 Emdikorgan, Pop_4 Tulkili-Sai, Pop_5 Akmysh, Pop_6 Samal, Pop_7 Zhemsem-Say, Pop_8 Sultan_Epe, Pop_9 Karakosayim, Pop_10 Kesim, Pop_11 Kogez, and Pop_12 Botakan). Cross-section (fragment): epidermal thickness (ET), cuticle thickness (CuT), collenchyma thickness (CoT), cortical parenchyma (CP), sclerenchyma (S), phloem (P), xylem (X), and pith parenchyma (PP).
Vascular bundles and pith structure in C. ambigua: The numerous vascular bundles represent a transition between the primary and secondary anatomical structures. The bundles are collateral and of an open type, with an area of 360–530 × 10−3 mm2, and with 16–18 vascular bundles observed. The primary xylem is arranged in straight columns, while the secondary xylem appears in uneven sections with smaller lumens. Small phloem cells are outside the xylem, and the “cap-like” regions of the sclerenchyma are positioned above them. The central part of the shoot is filled with loosely arranged, rounded cells of pith parenchyma with a diameter of 56–61 µm. Leaf anatomy of C. ambigua: The leaves of C. ambigua are flat, with a dorsiventral structure of a mesophytic type. In cross-sections (Figure 6), the upper and lower epidermal cells are distinctly visible. These cells are thin-walled and covered externally with a thin layer of cutin. The thickness of the upper epidermis is 23–25 µm, while the lower epidermis measures 18–20 µm.
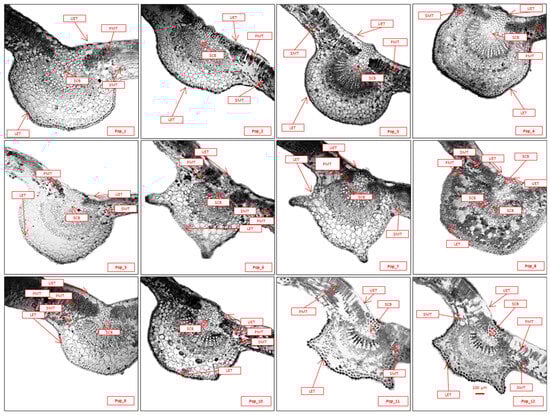
Figure 6.
Anatomical structures of the middle sections of the leaves from the populations of C. ambigua (Pop_1 Karasay, Pop_2 Kendirli, Pop_3 Emdikorgan, Pop_4 Tulkili-Sai, Pop_5 Akmysh, Pop_6 Samal, Pop_7 Zhemsem_Say, Pop_8 Sultan_Epe, Pop_9 Karakosayim, Pop_10 Kesim, Pop_11 Kogez, and Pop_12 Botakan). Cross-section (fragment): upper epidermal thickness (UET), lower epidermal thickness (LET), palisade mesophyll thickness (PMT), spongy mesophyll thickness (SMT), and square of conductive bundle (SCB).
The upper epidermal cells have slightly undulating walls with distinctly thickened bead-like patterns. Their dimensions range from 0.46 to 0.70 µm in length and 0.30 to 0.35 µm in width. Sparse, simple, single-celled trichomes are scattered across the surface, measuring approximately 4 µm long and with a base thickness of 0.38–0.42 µm.
The lower epidermal cells are more elongated, with strongly undulating walls, measuring 0.47–0.59 µm in length and 0.19–0.30 µm in width. Their walls are thinner, and the cuticle layer covers the surface. Stomata of the anomocytic type are present on the lower surface, measuring 0.40–0.47 µm in length and 0.16–0.22 µm in width, with a density of 9–10 stomata/mm2. Trichomes are absent. Thus, the leaf of C. ambigua is of a hypostomatic type.
The mesophyll is differentiated into palisade and spongy tissues. The palisade mesophyll cells are arranged in 1–2 layers, with a 45–51 µm thickness, and lacking intercellular spaces. The transition to the spongy mesophyll is distinct, with intercellular spaces of the aerenchyma type. The spongy mesophyll measures 78–90 µm in thickness.
The vascular bundles are collateral and closed (cambium absent), forming only along the veins. They consist of 10–15 rows of xylem and 5–8 rows of phloem. The phloem side of the vascular bundle is enclosed by 2–3 layers of sclerenchyma, resembling a cap. The area of the vascular bundles is 405–453 × 10−3 mm2.
Hawthorns exhibit variability in the shape of the lower part of the central vein. Some leaves have a rounded shape in the cross-section, while others display outgrowths resembling “ears”.
3.4. Statistical Data Processing
The following morphometric parameters of stems and leaves were used for statistical analysis. The stem parameters included epidermal thickness (ET, μm), which reflected the thickness of the outer protective layer of the stem; collenchyma thickness (CT, μm), characterizing the thickness of mechanical tissue that provided strength and elasticity to the stem; primary cortex thickness (PCT, μm), measuring the thickness of the parenchymal tissue located between the epidermis and vascular bundles; the area of the conducting bundle (CBA, ×10−3 mm2), indicating the size of the vascular–fibrous bundles responsible for water and nutrient transport; and the core parenchyma diameter (CPD, μm), which defined the size of the central part of the stem containing reserve nutrients. The leaf parameters included the upper epidermal thickness (UET, μm), measuring the thickness of the outer cell layer on the upper leaf surface that served a protective function; lower epidermal thickness (LET, μm), reflecting the thickness of the covering layer on the lower leaf surface where the stomata are often located; palisade mesophyll thickness (PMT, μm), which determined the thickness of the layer of densely arranged columnar cells responsible for photosynthesis; spongy mesophyll thickness (SMT, μm), measuring the thickness of the loosely arranged cells involved in gas exchange; and the area of the conducting bundle (SCB, ×10−3 mm2), characterizing the size of the vascular tissues in the leaves responsible for water and photosynthate transport. These parameters were used to analyze the influence of the altitudinal gradient on the anatomical features of the stems and leaves of the studied plants—Table 6 and Table 7 present the results of the descriptive statistics and a description of the main anatomical parameters.
Table 6.
Descriptive statistics of the anatomical structure of stems (M ± m/Cv %).
Table 7.
Descriptive statistics of the anatomical structure of leaves (M ± m/Cv %).
The results showed that the thickness of the epidermis in the stems of C. ambigua populations from different locations ranged from 14 to 22 µm. The most significant values were observed in the annual shoots collected from the Samal and Kesim gorges, while the smallest were found in the Botakan gorge. Collenchyma thickness ranged from 61 to 99 µm, with maximum values recorded in the Samal population and minimum values in the Kogez population. More significant variation was noted in the primary cortex’s thickness, ranging from 113 to 368 µm across the gorges. The largest dimensions were found in the Kogez gorge, while the smallest were in the Botakan population. An even more significant difference was observed in the vascular bundles, ranging from 286 to 528 × 10−3 mm2. The most miniature bundles were noted in the annual shoots from the Emdikorgan population, while the largest were recorded in plants from the Samal population. No significant differences were found in the diameters of the pith parenchyma cells among the annual shoots from different geographical origins. The dimensions ranged from 50 to 66 µm, with the most considerable thickness observed in shoots from the Kogez and Botakan populations and the smallest in the Sultan Epe population. The coefficients of variation for all traits were low, ranging from 0.31% to 6.31%, indicating the stability of the microscopic parameters. In the leaf structure, differences in anatomical parameters were also noted depending on the location. Minor variations were characteristic of epidermal thickness. In all samples, the thickness of the lower epidermis was 1.2–1.4 times smaller than the upper epidermis. The thickness of the upper epidermis ranged from 18 to 33 µm, while the lower epidermis ranged from 15 to 23 µm. The thinnest upper and lower epidermis was found in the Kogez and Botakan population plants, while the maximum epidermal thickness was observed in the TulkiliSai gorge. A difference between the thickness of the barrier and the spongy mesophyll was also noted. The palisade layer was 1.2–1.4 times thinner than the spongy layer. Palisade parenchyma thickness varied from 46 to 66 µm, with two rows consistently present in all samples. The thickest palisade mesophyll was observed in the leaves from the Kendirli population, while the thinnest was recorded in the leaves from the Kogez population. The thickness of the spongy mesophyll ranged from 50 to 89 µm, with 4–6 rows present. The minimum spongy mesophyll thickness was noted in the Kogez population, while the maximum was found in the Samal population. Significant variability was observed in the vascular bundles in the leaves, which ranged from 313 to 500 × 10−3 mm2. The largest bundle area was recorded in the TulkiliSai population, while the smallest was noted in the Kogez and Botakan populations. The box plot results for the various anatomical parameters of the C. ambigua populations allow for several conclusions to be drawn (Figure 7).
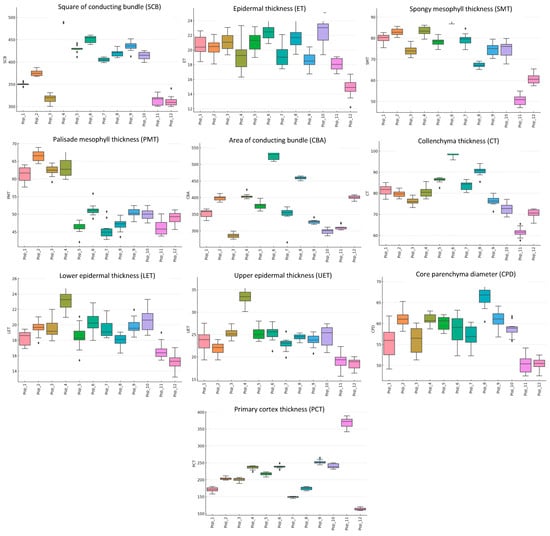
Figure 7.
Box plot analysis of the anatomical traits of C. ambigua across 12 populations in the Mangystau Region: area of conducting bundle (SCB), epidermal thickness (ET), spongy mesophyll thickness (SMT), palisade mesophyll thickness (PMT), area of conducting bundle (CBA), collenchyma thickness (CT), lower epidermal thickness (LET), upper epidermal thickness (UET), core parenchyma diameter (CPD), and primary cortex thickness (PCT).
Significant variation in epidermal thickness was observed across most populations. However, some populations exhibited narrower ranges of values, indicating better stability in their morphological traits. Differences in collenchyma thickness were also pronounced. Populations with more marked differences may have developed adaptations related to their external environmental conditions, such as mechanical stress on tissues. Comparative data on primary cortex thickness revealed distinct differences among populations. These variations may have reflected adaptations to environmental factors, such as temperature and humidity. The area of the vascular bundles varied significantly, indicating differences in water and nutrient transport across populations, which the ecological characteristics of each habitat could influence. The diameter of the pith parenchyma showed a wide range of values across populations, potentially reflecting differences in photosynthetic activity and other physiological processes. Variations in leaf epidermal thickness could be attributed to adaptations to different light levels and water stresses in various populations. For example, thicker epidermis layers may be characteristic of populations growing in environments with higher temperatures or limited water availability. The leaf mesophyll (palisade and spongy tissues) also exhibited variation among populations. This could be linked to differences in photosynthetic capacity and adaptations to specific environmental conditions. The area of the vascular bundles in leaves highlighted differences in water and nutrient conductivity among populations, which could be an important indicator of plant adaptation to arid conditions. The results demonstrated substantial differences in the anatomical traits of leaves and stems among various populations of C. ambigua. These differences suggested that populations were adapted to diverse ecological conditions. In particular, variations in tissue thickness, vascular bundle area, and other parameters may have been associated with differences in water and temperature stress, which are crucial for understanding plant resilience to climate change and extreme environmental conditions.
A multivariate correlation analysis (Pearson correlation) was conducted to measure the linear relationships between variables (Figure 8). The correlation analysis of the anatomical traits in C. ambigua leaves identified several significant relationships. The weather map shows the Pearson coefficients between the anatomical leaves and stems of C. ambigua in 12 populations from the Mangystau Region.
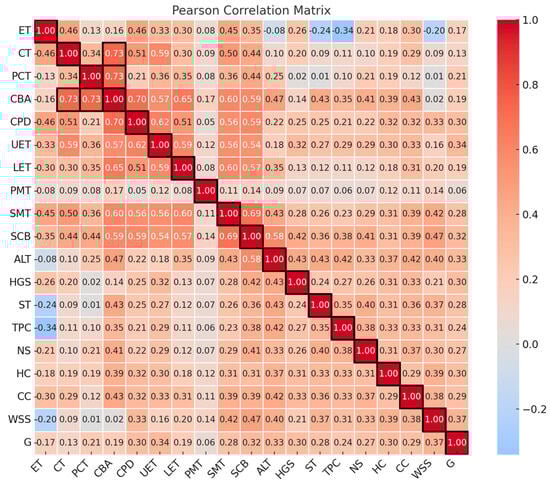
Figure 8.
Pearson correlation coefficients based on the combined data of anatomical traits in the leaves and stems of C. ambigua across 12 populations in the Mangystau Region. The color scale ranges from −1 (strong negative correlation, shown in blue) to 1 (strong positive correlation, shown in red). The intensity of the color indicates the strength of the correlation between variables, with darker shades reflecting stronger relationships. The matrix includes the following variables: epidermal thickness (ET), collenchyma thickness (CT), primary cortex thickness (PCT), conducting bundle area (CBA), core parenchyma diameter (CPD), upper epidermal thickness (UET), lower epidermal thickness (LET), palisade mesophyll thickness (PMT), spongy mesophyll thickness (SMT), square of conductive bundle (SCB), altitude above sea level (ALT), height of gorge slopes (HGS), soil type (ST), total projective cover (TPC), number of species in the community (NS), humus content (HC), carbonate content (CC), amount of water-soluble salts (WSS), and grazing livestock (G).
A strong positive correlation was observed between the thickness of the upper and lower leaf epidermis (r = 0.71), indicating a coordinated development of these tissues. The area of the vascular bundle in leaves was positively associated with the altitude above sea level (r = 0.62), which may reflect the adaptation of the vascular system to the altitude gradient. The stem collenchyma’s thickness correlated with the spongy leaf parenchyma (r = 0.61), indicating the interrelated mechanisms of support tissue formation. The total projective cover was positively correlated with the number of species in the community (r = 0.68), confirming the relationship between the density of the vegetation cover and biodiversity. A high correlation between the soil’s humus content and carbonates (r = 0.95) indicated their close relationship in soil processes. A moderate positive correlation was found between the diameter of the medullary parenchyma and the vascular bundle area (r = 0.63), reflecting the vascular tissue’s influence on the central part of the stem. The height of the gorge slopes moderately correlated with the general altitude of the area (r = 0.46), which was logical from a geomorphological point of view. The palisade and spongy parenchyma of the leaves changed synchronously (r = 0.37), indicating the mesophyll’s interrelated development. Some variables demonstrated weak or no correlation. Thus, the amount of water-soluble salts in the soil did not depend on the altitude above sea level (r = −0.02), which may have indicated a local distribution of salts. The total projective cover and the epidermal thickness had a weak negative correlation (r = −0.34), which may have indicated their independence. A strong negative correlation was found between the projective cover and the diameter of the pith parenchyma (r = −0.46), which may have reflected competitive processes in the conditions of dense vegetation cover. In places with a higher altitude above sea level, a decrease in projective cover was observed (r = −0.44), possibly due to arid conditions. An increase in the content of carbonates in the soil was associated with a decrease in species diversity (r = −0.47), which may have been due to the deterioration in the conditions for plant growth. Correlation analysis confirmed the relationship between the anatomical characteristics of leaves and stems and the influence of environmental factors (soil, altitude, plant community) on anatomical traits. Strong positive correlations between the upper and lower epidermis and spongy parenchyma (LET, UET, SMT) indicated the coordinated development of leaf tissues. Environmental parameters such as humus and carbonate content (HC, CC) were key in forming plant communities and their anatomical features. The projective cover (TPC) influenced the anatomical characteristics, especially the core parenchyma and conductive elements. Altitude above sea level (ALT) was associated with changes in the structure of conductive tissues, which may have indicated the mechanisms of adaptation to the altitude gradient. A principal component analysis (PCA) was also conducted, with the results in Figure 9. The graph shows a two-dimensional principal component analysis (PCA) of the anatomical traits of 12 populations of C. ambigua.
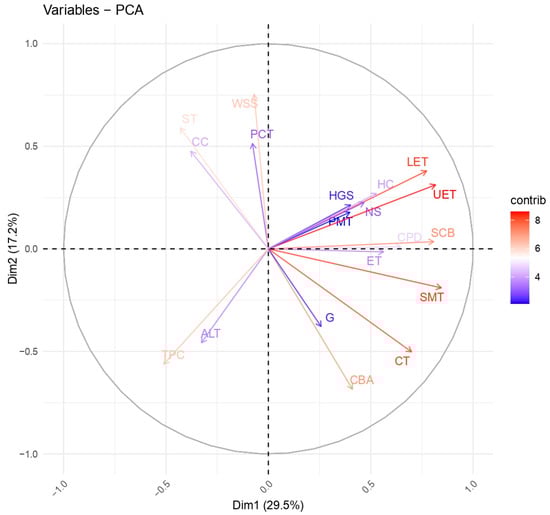
Figure 9.
A two-dimensional principal component analysis (PCA) plot based on the anatomical traits of C. ambigua across 12 populations: epidermal thickness (escape) (ET); collenchyma thickness (escape) (CT); primary cortex thickness (escape) (PCT); conducting bundle area (escape) (CBA); core parenchyma diameter (escape) (CPD); upper epidermal thickness (leaves) (UET); lower epidermal thickness (leaves) (LET); palisade mesophyll thickness (leaves) (PMT); spongy mesophyll thickness (leaves) (SMT); areaof conductive bundle (leaves) (SCB); altitude above sea level, m (ALT); height of gorge slopes, m (HGS); soil type (ST); total projective cover, % (TPC); number of species in the community, pcs. (NS); humus content, % (HC); carbonate content, % (CC); amount of water-soluble salts, % (WSS); and grazing livestock (G).
The first principal component (Dim1) explains 29.5% of the data variation, and the second (Dim2) explains 17.2%, accounting for 46.7% of the total variation. The longer the vector, the more significant the contribution of the variable to the corresponding principal component. Vectors pointing in the same direction are correlated, while variables perpendicular to each other are weakly related. Oppositely directed vectors indicate a negative correlation. The variables located on the right side of the graph (UET, LET, SMT, SCB, PCT) are positively correlated with the first principal component and probably reflect adaptive changes in leaf anatomy under certain conditions. At the same time, the gorge slope altitude (HGS), the number of species in the community (NS), the humus content (HC), and the grazing load (G) are opposite to these traits, indicating the influence of environmental factors on their variability. Along the Dim2 axis, the amount of water-soluble salts (WSS), carbonate content (CC), altitude (ALT), and soil type (ST) have a significant effect. The main findings indicate that populations with a high humus content and a more diverse plant community (HC, NS) tend to have anatomical differences compared to populations located at an altitude with high levels of water-soluble salts (WSS) and an intense grazing load (G). The anatomical characteristics of leaves, such as the thickness of the upper and lower epidermis (LET, UET) and the spongy parenchyma (SMT), are closely related and may be adapted to different environmental conditions. Environmental factors, including altitude, soil type, and carbonate content, significantly affect the variability of anatomical traits. This analysis allows us to identify the key factors that determine the anatomical structure of C. ambigua and provides insight into the mechanisms by which the species adapts to different environmental conditions.
A canonical analysis of environmental factors and anatomical parameters (Figure 10) of C. ambigua populations revealed significant relationships between ecological conditions and structural characteristics. These findings highlight the influence of environmental variables, such as soil type, water availability, and altitude, on the anatomical traits of populations, emphasizing the adaptive responses of C. ambigua to varying ecological conditions.
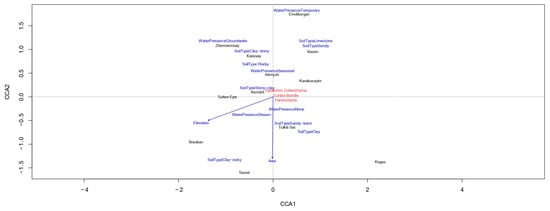
Figure 10.
Canonical Correspondence Analysis (CCA).
The first canonical axis (CCA1) explains most of the variation. It reflects the influence of environmental factors such as soil type, water availability, and anatomical traits, including epidermal thickness and conducting bundle area. The second axis (CCA2) highlights additional soil type and elevation differences. Populations such as Karasay and Samal are strongly associated with permanent water flows and clayey soils, indicating their adaptation to wetter conditions. In contrast, populations like Kendirli and Kogez are linked to seasonal water streams and rocky soils, suggesting their resilience to arid conditions. Populations on sandy and rocky soils, such as Botakan and Sultan Epe, exhibit weaker associations with anatomical parameters, likely due to the limited resource availability in these environments. Environmental factors such as range area and elevation moderately influence the distribution of anatomical traits. At the same time, soil type and water availability play a key role in the adaptive strategies of populations. These results emphasize the importance of ecological conditions in shaping the anatomical features of C. ambigua, providing insights into their adaptation to diverse habitats.
4. Discussion
The anatomical investigation of C. ambigua revealed substantial variations in leaf and shoot structures influenced by ecological growth conditions. These differences reflected the species’ adaptive mechanisms to local stress factors such as drought, high solar radiation, and limited water availability. Understanding these traits provides deeper insights into plant resilience under extreme arid zone conditions. The anatomical investigation of C. ambigua across 12 populations in the arid Mangystau Region revealed significant structural variations in the leaves and shoots, demonstrating clear adaptive responses to diverse environmental conditions. These modifications are critical for maintaining physiological stability under extreme abiotic stressors such as drought, high solar radiation, and fluctuating water availability. The results align with previous studies on xerophytes, highlighting that plant species in arid zones develop specialized anatomical features to enhance water retention and structural reinforcement [61].
Epidermal thickness varied from 14.85 µm (Botakan) to 22.51 µm (Samal), highlighting its crucial role in reducing water loss through transpiration. The thicker epidermis observed in the Samal population can be attributed to the higher temperatures and intense solar radiation in this area, consistent with Esau [62], who noted that increased cuticle and epidermal thickness are typical adaptations to xerophytic conditions. Collenchyma thickness ranged from 61.52 µm (Kogez) to 99.07 µm (Samal) and is essential for mechanical tissue support, which is particularly important in mountainous regions with strong winds. Fahn [63] highlighted similar adaptations, emphasizing the relationship between mechanical tissues and plant stress resistance.
Primary cortex thickness ranged from 113.66 µm (Botakan) to 368.22 µm (Kogez). The enlargement of this zone may be related to the need for water and nutrient storage, which is critical in environments with limited water access. These findings support the hypothesis that plants in arid zones use their tissues as water reservoirs. The area of the vascular bundles ranged from 286.06 × 10⁻³ mm2 (Emdikorgan) to 528.51 × 10⁻³ mm2 (Samal), emphasizing the role of vascular tissues in water transport. The larger vascular bundles in the Samal population may be associated with better hydrothermal conditions, supporting intense metabolism. Canonical Correspondence Analysis (CCA) indicated that environmental factors such as soil type, permanent water flows, and elevation significantly influenced anatomical traits. For instance, populations like Karasay and Samal, associated with clayey soils and permanent water sources, exhibited more developed vascular tissues and larger mesophyll areas. This aligns with Larcher [64], who noted the role of water availability in regulating plant morpho-anatomical traits. In contrast, populations from arid sites, such as Botakan and Kogez, were characterized by increased epidermal thickness and reduced vascular bundle area, reflecting adaptations to water scarcity. These changes are consistent with Stebbins [65], who observed that limiting transpiration is a key survival factor for plants in arid zones. Correlation analysis revealed strong relationships between collenchyma thickness and vascular bundle area (r = 0.73, p < 0.05), highlighting their interdependence in mechanical support and water transport. Additionally, spongy mesophyll thickness positively correlated with these parameters (r = 0.70, p < 0.05), underscoring their importance in gas exchange and water balance. Similar correlations have been described by Ter Braak and Šmilauer [66] in xerophyte studies.
Principal component analysis (PCA) demonstrated that the first two components explained 60.4% of the data variance. The primary contributors to Dim1 were primary cortex thickness, collenchyma thickness, and vascular bundle area, while Dim2 highlighted differences related to epidermal thickness. These findings indicate that tissue structural changes play a crucial role in adapting C. ambigua to varying ecological conditions, aligning with Dickison [67], who emphasized the importance of multifactorial approaches in studying plant adaptive mechanisms. The results underscore the high plasticity of the anatomical structure of C. ambigua, confirming its ability to adapt to changing climates. These findings can inform conservation strategies for rare species, particularly under increasing arid stress. Incorporating anatomical traits into monitoring programs could enhance the assessment of population health and the prediction of their dynamics. One of the most prominent adaptations observed in C. ambigua was the variation in epidermal thickness, ranging from 14.85 µm (Botakan) to 22.51 µm (Samal). A thicker epidermis in populations exposed to intense solar radiation and elevated temperatures (e.g., Samal) suggests a mechanism for reducing transpiration and protecting internal tissues from excessive desiccation. This trend is well documented in xerophytes, where an increase in epidermal thickness and cuticle reinforcement is a primary defense against water loss. In contrast, populations from less extreme environments exhibited thinner epidermal layers, indicating a lower requirement for water conservation.
Variations in collenchyma thickness, ranging from 61.52 µm (Kogez) to 99.07 µm (Samal), underscore differences in mechanical support among populations. The thickest collenchyma observed in Samal likely provides structural stability against mechanical stressors such as strong winds and frequent temperature fluctuations. Fahn emphasized that collenchyma is crucial in enhancing plant rigidity, particularly in environments subject to dynamic climatic conditions. Similarly, studies on other Rosaceae species confirmed that collenchyma thickening is a common strategy for withstanding mechanical stress [68]. The primary cortex thickness also varied significantly, ranging from 113.66 µm (Botakan) to 368.22 µm (Kogez). This enlargement in arid populations suggests an adaptation for enhanced water and nutrient storage, crucial for surviving prolonged dry periods. Similar trends have been observed in desert shrubs, where increased cortical tissue serves as a water reservoir. The development of large cortical zones in C. ambigua aligns with the findings in other drought-adapted species, such as Ziziphus spina-christi and Tamarix ramosissima, where similar storage strategies facilitate resilience in extreme conditions [69]. The vascular bundle area, a key determinant of water transport efficiency, showed substantial variability across populations, ranging from 286.06 × 10⁻³ mm2 (Emdikorgan) to 528.51 × 10⁻³ mm2 (Samal). The larger vascular bundles in Samal suggest an adaptation to increased transpiration demands, allowing for more efficient water movement and nutrient distribution under relatively favorable hydrothermal conditions. This observation is supported by research on Mediterranean drought-resistant plants, where vascular tissue expansion enhanced hydraulic conductivity and optimized water uptake under high-temperature stress [70].
Conversely, populations from drier habitats, such as Botakan and Kogez, exhibited reduced vascular bundle areas, reflecting a strategy to minimize excessive water loss. Similar trade-offs between hydraulic efficiency and drought resistance have been reported in Quercus ilex and Populus euphratica, where more minor xylem elements contributed to embolism resistance in water-scarce environments [71]. Canonical Correspondence Analysis (CCA) demonstrated strong correlations between environmental parameters (e.g., soil composition, proximity to water sources, altitude) and anatomical trait expression. Populations in moist habitats (e.g., Karasay and Samal) exhibited well-developed vascular tissues, suggesting a reliance on efficient water transport mechanisms. In contrast, populations in arid locations (e.g., Botakan and Kogez) displayed thicker epidermal layers and reduced vascular tissue, reinforcing the hypothesis that transpiration limitation is a primary adaptive strategy in drought-prone areas. These findings align with studies on xerophytic plants, where water availability is the key driver of anatomical plasticity [72].
Pearson’s correlation analysis further supported these trends by revealing the strong relationships between the following key anatomical parameters: collenchyma thickness and vascular bundle area (r = 0.73, p < 0.05), indicating their combined role in mechanical reinforcement and water transport; and spongy mesophyll thickness and vascular bundle area (r = 0.70, p < 0.05), suggesting an interdependence between photosynthetic efficiency and hydraulic conductivity. These relationships were consistent with prior studies on Rosmarinus officinalis and Pinus halepensis, where mesophyll development and vascular efficiency were tightly linked to drought adaptation. Principal component analysis (PCA) demonstrated that the first two principal components accounted for 60.4% of the total variance. Dim1 was primarily influenced by primary cortex thickness, collenchyma thickness, and vascular bundle area, while Dim2 reflected differences in epidermal thickness. These findings emphasize the multifunctionality of tissue modifications in facilitating drought tolerance, a conclusion that echoes previous research on the adaptive mechanisms in desert flora. The results highlight the remarkable anatomical plasticity of C. ambigua, reinforcing its ability to persist under varying climatic conditions. This has significant implications for conservation, particularly in the context of increasing aridity in Central Asia. Future conservation strategies should focus on preserving high-diversity populations (e.g., Pop_4 and Pop_7) as genetic and ecological resilience reservoirs; monitoring vulnerable populations (e.g., Pop_12 and Pop_9) to assess potential declines in adaptive capacity; and incorporating anatomical trait analysis into long-term biodiversity assessment programs to improve the accuracy of climate impact predictions and explore the molecular underpinnings of these adaptations through transcriptomic and genomic studies, which could provide deeper insights into the genetic basis of drought resistance. This study provides a comprehensive assessment of the anatomical adaptations of C. ambigua across ecologically diverse habitats. The observed variations in the epidermis, collenchyma, cortex, and vascular tissues underscore the species’ capacity to optimize water-use efficiency and mechanical stability under extreme environmental pressures. Statistical analyses confirmed a strong environmental influence on anatomical traits, reinforcing the necessity of an integrative research approach that combines morpho-anatomical, physiological, and ecological data. These findings contribute to a broader understanding of plant resilience in arid ecosystems and provide a valuable foundation for conservation initiatives to protect rare and endemic species in Central Asia. The anatomical analysis of C. ambigua conducted in this study allows for conclusions to be drawn regarding the species’ pronounced adaptation to drought conditions, high solar radiation, and limited water availability. However, for a deeper understanding of these adaptations, it is essential to explore the molecular mechanisms underlying the observed anatomical changes.
One of the key molecular mechanisms contributing to drought adaptation is the activity of genes responsible for water stress tolerance. For example, genes belonging to the DREB (Dehydration Responsive Element-Binding) group play a crucial role in regulating the expression of other genes that protect cells from osmotic stress [72]. The proteins encoded by these genes activate the synthesis of protective molecules, such as late embryogenesis abundant (LEA) proteins, which help plant cells to maintain their structure and function under water deficit conditions [73]. Additionally, molecules such as anthocyanins and other phenolic compounds are known for their antioxidant properties, protecting plants from damage caused by high levels of ultraviolet radiation [74]. Genetic studies could confirm the increased synthesis of these compounds in C. ambigua populations growing in more sun-exposed areas.
At the molecular level, it is also important to highlight the role of hormones such as abscisic acid (ABA) in the adaptation to stress. This hormone regulates stomatal closure, reducing water loss through transpiration, and activates cell protection mechanisms [75,76]. The presence of such molecular adaptations in C. ambigua can explain the observed anatomical changes, such as the increased epidermal thickness and vascular bundle area, which aid in efficient water transport and minimize water loss. Further molecular-level studies, including a gene expression analysis to determine the genes responsible for these mechanisms, could significantly deepen our understanding of plant adaptation processes in arid conditions.
The anatomical investigation of C. ambigua revealed substantial variations in leaf and shoot structures influenced by ecological growth conditions. These differences likely reflected the species’ structural plasticity in response to local stress factors such as drought, high solar radiation, and limited water availability. However, these observed changes should not be automatically classified as adaptive without experimental validation. Instead, they represent phenotypic responses that may or may not confer an adaptive advantage under specific conditions. For instance, epidermal thickness varied from 14.85 µm (Botakan) to 22.51 µm (Samal), potentially influencing transpiration rates and UV protection. However, without further physiological or fitness-based assessments, this variation alone does not confirm an adaptive function. Likewise, the enlargement of the primary cortex (113.66 µm in Botakan to 368.22 µm in Kogez) could be related to water storage capacity. However, without experimental controls, it remains unclear whether this change provides a survival advantage or results from differences in water availability. Similarly, variations in vascular bundle size, ranging from 286.06 × 10⁻³ mm2 (Emdikorgan) to 528.51 × 10⁻³ mm2 (Samal), suggest differences in hydraulic conductivity, but their direct role in adaptation remains speculative. The observed correlations between anatomical traits and environmental factors highlight potential functional relationships rather than definitive adaptive mechanisms. Canonical Correspondence Analysis (CCA) demonstrated that the environmental parameters (e.g., soil composition, proximity to water sources, and altitude) influenced anatomical trait expression. However, these correlations did not establish causality or confirm adaptation in an evolutionary sense. The observed structural differences may reflect the inherent plasticity of C. ambigua rather than selective pressures shaping adaptive traits.
5. Conclusions
The anatomical analysis of C. ambigua populations in the arid conditions of the Mangystau Region revealed significant structural variability associated with environmental factors. The most pronounced differences were found in the thickness of the epidermis, collenchyma, primary cortex, and vascular bundle area, indicating adaptive mechanisms to reduce transpiration and enhance water transport efficiency. In particular, epidermal thickness varied from 14.85 µm (Pop_12 Botakan) to 22.51 µm (Pop_6 Samal), demonstrating pronounced xeromorphic adaptations. The vascular bundle area ranged from 286.06 × 10⁻³ mm2 (Pop_3 Emdikorgan) to 528.51 × 10⁻³ mm2 (Samal), reflecting differences in the efficiency of water-conducting elements between populations. Despite this anatomical variability, the coefficients of variation (0.31%–6.31%) remained low, confirming the structural stability of the morphophysiological parameters and highlighting the species’ high adaptability to arid environments. However, the correlation analysis revealed weak or inconsistent relationships between most anatomical traits and environmental variables. These findings suggest that additional factors—such as genetic differentiation, microclimatic variation, or complex non-linear interactions—may significantly shape anatomical adaptations. This points to the need for further integrative studies combining anatomical, ecological, physiological, and molecular data to clarify the mechanisms of adaptation and resilience. Canonical Correlation Analysis (CCA) demonstrated that the most influential environmental factors affecting anatomical characteristics were soil type, elevation, and water availability. Floristic analysis revealed the considerable differences in species richness among populations: the highest floristic diversity was recorded in Pop_4 and Pop_7; at the same time, the lowest was observed in Pop_12 and Pop_9, indicating the potential vulnerability of these communities. Overall, the results emphasize the ecological significance of C. ambigua as a keystone species in desert forests and highlight its critical role in stabilizing arid ecosystems. The identified anatomical traits can serve as valuable indicators for assessing population resilience under climate change and may act as selection markers in afforestation and biodiversity conservation programs. Long-term monitoring and expanded research are recommended to support adaptive conservation strategies for C. ambigua and similar xerophytic species.
Author Contributions
Conceptualization, A.I. and M.I.; methodology, A.I. and N.D.; software, M.S. and A.O.; validation, A.I., M.I. and N.D.; formal analysis, A.O.; investigation, M.S. and A.T.; resources, N.D. and M.S.; data curation, A.O.; writing—original draft preparation, A.O.; writing—review and editing, A.I. and M.I.; visualization, A.O.; supervision, A.I.; project administration, A.I.; funding acquisition, A.I. All authors have read and agreed to the published version of the manuscript.
Funding
This research was funded by the Science Committee of the Ministry of Science and Higher Education of the Republic of Kazakhstan program No. BR21882166: Scientific and practical basis of reproduction, conservation, use of fruit-berry plants of natural flora of Western, Eastern, Central, and Northern Kazakhstan to ensure food security.
Data Availability Statement
The original contributions presented in this study are included in the article. Further inquiries can be directed to the corresponding author.
Conflicts of Interest
The authors declare no conflicts of interest.
References
- Duguma, H.T. Wild edible plant nutritional contribution and consumer perception in Ethiopia. Int. J. Food Sci. 2020, 2020, 2958623. [Google Scholar] [CrossRef] [PubMed]
- Garcia-Oliveira, P.; Fraga-Corral, M.; Pereira, A.G.; Lourenco-Lopez, C.; Jimenez-Lopez, C.; Prieto, M.A.; Simal-Gandara, J. Scientific basis for the industrialization of traditionally used plants of the Rosaceae family. Food Chem. 2020, 330, 1043127197. [Google Scholar]
- Mixitdinov, S.M.; Hasanov, Z.D.; Maydanov, M.J.; Neymanov, F.F. Medical significance of Rosaceae representatives. Sci. Innov. 2022, 1, 179–184. [Google Scholar] [CrossRef]
- Kang, C.; Yao, J.-L.; Liu, Z.; Han, Y. Editorial: Rosaceae fruit development and quality. Front. Plant Sci. 2022, 12, 837300. [Google Scholar] [CrossRef]
- Li, M.; Xiao, Y.; Mount, S.; Liu, Z. An atlas of genomic resources for studying Rosaceae fruits and ornamentals. Front. Plant Sci. 2021, 12, 644881. [Google Scholar] [CrossRef]
- Sores, S.S.; Bekbolatova, E.; Cotrin, M.D.; Sakipova, Z.; Ibragimova, L.; Kukula-Koch, W.; Sardell Giorno, T.h.B.; Fernandes, P.D.; Fonseca, D.A.; Bpylan, F. Chemistry and pharmacolofy of the Kazakh Crataegus almaatensis Pojark: An Asian herbal medicine. Antioxidants 2019, 8, 300. [Google Scholar] [CrossRef]
- Kumar, D.; Arya, V.; Ali Bhat, Z.; Ahmad Khan, N.; Prasad, D.N. The genus Crataegus: Chemical and pharmacological perspectives. Rev. Brasil. Farmacogn. 2012, 22, 1187–1200. [Google Scholar]
- Han, J.; Tan, D.; Liu, G. Hawthorn—A health food. Appl. Mech. Mater. 2012, 140, 350–354. [Google Scholar]
- Antonio, B.T.J.; Margarita, C.R.; Daniel, M.I. Biological Properties and Antioxidant Activity of Hawthorn Crataegus mexicana. J. Pharmacogenomics Pharmacoproteomics 2015, 6, 153. [Google Scholar] [CrossRef]
- Sagaradze, V.A.; Babaeva, E.Y. Resources and use of Crataegus species (Rosaceae) of the Asian part of Russia. Plant Resour. 2022, 58, 5–19. [Google Scholar]
- Gundogdu, M.; Ozrenk, K.; Ercisli, S.; Kan, T.; Kodad, O.; Hegedus, A. Organic acids, sugars, vitamin C content and some pomological characteristics of eleven hawthorn species (Crataegus ssp.) from Turkey. Biol. Res. 2014, 47, 21. [Google Scholar] [CrossRef] [PubMed]
- Edwards, J.E.; Brown, P.; Talent, N.; Dickinson, T.A.; Shipley, P.R. A review of the chemistry of the genus Crataegus. Phytochemistry 2012, 79, 5–26. [Google Scholar] [CrossRef] [PubMed]
- Flora of Kazakhstan; Science: Almaty, Kazakhstan, 1961; Volume 4, pp. 406–411.
- Baytenov, M.S. Flora of Kazakhstan; Family Composition of the Flora; Gylym: Almaty, Kazakhstan, 2001; Volume 2, p. 113. [Google Scholar]
- Abdulina, S.A. Spisok Sosudistykn Rastenii Kazakhstana: 1–187; Academy of Sciences: Almaty, Kazakhstan, 1999. [Google Scholar]
- Aralbay, N.K.; Kudabaeva, G.M.; Imanbaeva, A.A.; Veselova, P.V.; Danilov, M.P.; Kurmantaeva, A.A.; Shadrina, N.V.; Kasenova, B.T. State Cadastre of Plants of the Mangistau Region. Synopsis of Higher Vascular Plants; Printing House LLP “Classics”: Aktau, Kazakhstan, 2006; 229p. (In Russian) [Google Scholar]
- Safronova, I.N. Vegetation of Mangyshlak Deserts. Proc. Bot. Inst. RAS 1996, 18, 211. [Google Scholar]
- Kew Royal Botanic Gardens. Plants of the World Online (POWO). Crataegus ambigua C.A. Mey. ex A.K. Becker. Available online: https://powo.science.kew.org/results?q=Crataegus%20ambigua (accessed on 30 December 2024).
- Global Biodiversity Information Facility (GBIF). Crataegus ambigua. Available online: https://www.gbif.org/search?q=Crataegus%20ambigua (accessed on 30 December 2024).
- World Flora Online (WFO). Crataegus ambigua C.A. Mey. Available online: https://wfoplantlist.org/taxon/wfo-0001011563-2024-12?page=1 (accessed on 30 December 2024).
- Oregon State University, College of Agricultural Sciences, Department of Horticulture. Landscape Plants. Available online: https://landscapeplants.oregonstate.edu/plants/crataegus-ambigua (accessed on 30 December 2024).
- Plant Select. Available online: https://plantselect.org/plant/crataegus-ambigua/ (accessed on 30 December 2024).
- Convention on Biological Biodiversity; 1992. Available online: https://www.cbd.int/convention (accessed on 30 December 2024).
- Red Book of Kazakhstan; Plants. Available online: https://ile-balkhash.kz/en/red-list (accessed on 30 December 2024).
- Aralbay, N.K.; Kudabaeva, G.M.; Imanbayeva, A.A. Catalog of Rare and Endangered Plant Species of the Mangystau Region; Science: Aktau, Kazakhstan, 2006; 32p. [Google Scholar]
- International Union for Conservation of Nature. The IUCN Red List of Threatened Species. Available online: https://www.iucnredlist.org/species/63506/12683423 (accessed on 30 December 2024).
- Imanbayeva, A.; Duisenova, N.; Orazov, A.; Sagyndykova, M.; Belozerov, I.; Tuyakova, A. Study of the Floristic, Morphological, and Genetic (atpF–atpH, Internal Transcribed Spacer (ITS), matK, psbK–psbI, rbcL, and trnH–psbA) Differences in Crataegus ambigua Populations in Mangystau (Kazakhstan). Plants 2024, 13, 1591. [Google Scholar]
- Dikareva, T.V. Ecological and cenotic analysis of plant species in the Red Book of Kazakhstan. Ecosyst. Ecol. Dyn. 2017, 1, 132–145. [Google Scholar]
- Imanbayeva, A.A.; Duisenova, N.I.; Ishmuratova, M.Y.; Kopbaeva, G.B. Phytocenotic characteristics of communities with Crataegus ambigua in the Akmysh and Botakan gorges (Western Kazakhstan). Bull. KazNU Biol. Ser. 2017, 3, 6–13. [Google Scholar]
- Duysenova, N.I.; Imanbaeva, A.A.; Ishmuratova, M.Y. The study of the state and structure of populations of rare plant of Mangyshlak Crataegus ambigua C.A. Mey ex A. Beck. Ecol. Environ. Conserv. 2016, 22, 523–529. [Google Scholar]
- Tuyakova, A.T.; Imanbaeva, A.A.; Duysenova, N.I.; Ishmuratova, M.Y. Anatomical structure study of aerial organs of Crataegus ambigua C.A. Mey. Biosci. Biotechnol. Res. Asia 2016, 13, 1303–1309. [Google Scholar]
- Tuyakova, A.T.; Imanbayeva, A.A.; Ishmuratova, M.Y.; Zhumakhan, D.M.; Orazova, S.B. Anatomical features of aboveground organs of Crataegus ambigua C.A. Mey in the Western Karatau gorges. Bull. KazNU Biol. Ser. 2016, 2, 25–31. [Google Scholar]
- Tyulkova, E.G. Anatomical structure features of tree leaves as an indicator of adaptation to growing conditions. Izv. Gomel State Univ. 2019, 3, 63–69. [Google Scholar]
- Tyukavina, O.N.; Neverov, N.A.; Klevtsov, D.N. Influence of growing comditionds on morphological and anatomical characteristics of pine needles in the northern taiga. J. For. Sci. 2019, 65, 33–39. [Google Scholar] [CrossRef]
- Terleyskaya, N.; Kurmanbayeva, M. Change in leaf anatomical parameters of seedlings of different wheat species under conditions of drought and salt stress. Pak. J. Bot. 2017, 49, 857–865. [Google Scholar]
- Childibayeva, A.; Ametov, A.; Kurbatova, N.V.; Akhmetova, A.; Tynybekov, B.M.; Mukanova, G.A. Structural characteristics of Rosa iliensis Chrshan. Under conditions of the floodplains of the river Ili and Sharyn. J. Ecol. Eng. 2022, 23, 296–304. [Google Scholar] [CrossRef]
- Barykina, R.P.; Veselova, T.D.; Devyatov, A.G.; Jalilova, K.K.; Ilyina, G.M.; Chubatova, N.V. Handbook of Botanical Microtechnique: Basics and Methods; Moscow State University: Moscow, Russia, 2004; 322p. [Google Scholar]
- Koshim, A.G.; Sergeyeva, A.M.; Bexeitova, R.T.; Aktymbayeva, A.S. Landscape of the Mangystau region in Kazakhstan as a geomorphotourism destination: A geographical review. Geo J. Tour. Geosites 2020, 29, 385–397. [Google Scholar]
- Sukachev, V.N.; Zonn, S.V.; Motovilov, G.P. Methodical Instructions for Studying Forest Types; Publishing House of the USSR Academy of Sciences: Moscow, Russia, 1957. [Google Scholar]
- Sukachev, V.N. Forest Biogeocenology as a Theoretical Basis for Forestry and Forest Management; Issues of Forest Science and Forestry; Publishing House of the USSR Academy of Sciences: Moscow, Russia, 1960. [Google Scholar]
- Pott, R. Phytosociology: A modern geobotanical method. Plant Biosyst. Int. J. Deal. All Asp. Plant Biol. 2011, 145 (Suppl. S1), 9–18. [Google Scholar]
- Kafle, G. Diagnostic Horizons of Soils in the World; Academia Letters: San Francisco, CA, USA, 2022. [Google Scholar]
- POWO. Plants of the World Online. Facilitated by the Royal Botanic Gardens, Kew. 2024. Available online: http://www.plantsoftheworldonline.org (accessed on 1 September 2024).
- Muradov, S.V.; Devyatova, E.A.; Golovina, T.P. Laboratory Practicum on Microtechnique; Publishing House “Sreda”: Cheboksary, Russia, 2019; 84p. [Google Scholar]
- Vinogradova, G.N.; Zakharov, V.V. Basics of Microscopy. Part 1; ITMO: St. Petersburg, Russia, 2018; 135p. [Google Scholar]
- Evert, R.F. Plant Anatomy by Esau: Meristems, Cells, and Tissues of the Plant Body: Structure, Functions, and Development; BINOM: Moscow, Russia, 2015; 600p. [Google Scholar]
- Crang, R.; Lyons-Sobaski, S.; Wise, R. Plant Anatomy. A Concept-Based Approach to the Structure of Sed Plants; Textbook; Springer: Berlin/Heidelberg, Germany, 2018. [Google Scholar] [CrossRef]
- Aidosova, S.S.; Akhtaeva, N.Z.; Tuleuova, G.K.H.; Ahmetova, A.B.; Tazhibay, A.M.; Shaushekov, Z.K.; Shurupova, M.N.; Adekenov, S.M. Compara tive morphological and anatomical characteristics of Saussurea amara (L.) DC. and S. salsa Pall. Spreng. Pak. J. Bot. 2018, 51, 213–219. [Google Scholar]
- Lotova, L.I. Morphology and Anatomy of Higher Plants; Editorial URSS: Moscow, Russia, 2001; 528p. [Google Scholar]
- Volkova, N.A.; Kurkin, V.A.; Pravdivtseva, O.E.; Andreev, A.A.; Kurkina, A.V.; Pervushkin, S.V.; Agapov, A.I. Morphological and anatomical study of Crataegus submollis Sarg. Shoots. Aspir. Vestn. Povolzhiya 2023, 23, 31–35. [Google Scholar] [CrossRef]
- Aslam, M.; Ullah, M.I. Practicing R for Statistical Computing; Springer: Berlin/Heidelberg, Germany, 2023. [Google Scholar]
- Zar, J.H. Biostatistical Analysis; Pearson Education India: Upper Saddle River, NJ, USA, 1999. [Google Scholar]
- Koblanova, S.; Mukhtubayeva, S.; Kakimzhanova, A.; Orazov, A.; Dyussembekova, D.; Abileva, G. Diversity of birch and alder forests in the Kostanay region of Kazakhstan. Forests 2024, 15, 1680. [Google Scholar] [CrossRef]
- Sokal, R.R.; Rohlf, F.J. Biometry: The Principles and Practice of Statistics in Biological Research, 3rd ed.; W.H. Freeman and Company: New York, NY, USA, 1995; pp. 451–554. [Google Scholar]
- Tukey, J.W. Exploratory Data Analysis; Addison-Wesley: Reading, MA, USA, 1977. [Google Scholar]
- Pearson, K. On Lines and Planes of Closest Fit to Systems of Points in Space. Philos. Mag. 1901, 2, 559–572. [Google Scholar]
- Jolliffe, I.T.; Cadima, J. Principal component analysis: A review and recent developments. Philos. Trans. R. Soc. A Math. Phys. Eng. Sci. 2016, 374, 20150202. [Google Scholar]
- Ter Braak, C.J.F.; Smilauer, P. CANOCO Reference Manual and User’s Guide to Canoco for Windows: Software for Canonical Community Ordination, Version 4.5; Microcomputer Power: Ithaca, NY, USA, 2002. [Google Scholar]
- Evert, R.F. Esau’s Plant Anatomy Consists of the Meristems, Cells, and Tissues of the Plant Body, as Well as Their Structure, Function, and Development; John Wiley & Sons: Hoboken, NJ, USA, 2006. [Google Scholar]
- Fahn, A. Plant Anatomy; Pergamon Press: Oxford, UK, 1990. [Google Scholar]
- Kherraze, M.E.; Belhamra, M.; Grigore, M.N. Aspects of ecological anatomy of Traganum nudatum Del. (Amaranthaceae) from the Northeast of the Algerian Sahara. Acta Biol. Szeged. 2018, 62, 25–36. [Google Scholar]
- Esau, K.; Cheadle, V.I. Anatomy of the secondary phloem in Winteraceae. IAWA J. 1984, 5, 13–43. [Google Scholar]
- Eidelberg, D.; Moeller, J.R.; Dhawan, V.; Sidtis, J.J.; Ginos, J.Z.; Strother, S.C.; Cedarbaum, J.; Greene, P.; Fahn, S.; Rottenberg, D.A. The metabolic anatomy of Parkinson’s disease: Complementary [18F] fluorodeoxyglucose and [18F] fluorodopa positron emission tomographic studies. Mov. Disord. Off. J. Mov. Disord. Soc. 1990, 5, 203–213. [Google Scholar]
- Izquierdo, J.V.; Canaveze, Y.; Machado, S.R.; Amorim, F.W. Anatomical, histochemical, and developmental approaches reveal the long-term functioning of the floral nectary in Tocoyena formosa (Rubiaceae). Sci. Nat. 2024, 111, 25. [Google Scholar]
- Cloudsley-Thompson, J.L. Biotic Interactions in Arid Lands; Springer Science & Business Media: Berlin/Heidelberg, Germany, 2012. [Google Scholar]
- Wang, W.; Wang, Y.; Hoch, G.; Wang, Z.; Gu, J. Linkage of root morphology to anatomy with increasing nitrogen availability in six temperate tree species. Plant Soil 2018, 425, 189–200. [Google Scholar]
- Barlow, C.J. Changes in Aquatic Plant Community Structure and Species Distribution at Caddo Lake; Stephen, F., Ed.; Austin State University: Nacogdoches, TX, USA, 2006. [Google Scholar]
- Mengistie, E.; McDonald, A.G. Effect of cell wall compositions on lodging resistance of cereal crops. J. Agric. Sci. 2023, 161, 794–807. [Google Scholar]
- Martínez-Vilalta, J.; Lloret, F. Drought-induced vegetation shifts in terrestrial ecosystems: The key role of regeneration dynamics. Glob. Planet. Change 2016, 144, 94–108. [Google Scholar]
- Venturas, M.D.; Sperry, J.S.; Hacke, U.G. Plant xylem hydraulics: What we understand, current research, and future challenges. J. Integr. Plant Biol. 2017, 59, 356–389. [Google Scholar]
- Wilkening, J.V.; Skelton, R.P.; Feng, X.; Dawson, T.E.; Thompson, S.E. Exploring within-plant hydraulic trait variation: A test of the vulnerability segmentation hypothesis. Plant Cell Environ. 2023, 46, 2726–2746. [Google Scholar]
- Flexas, J.; Clemente-Moreno, M.J.; Bota, J.; Brodribb, T.J.; Gago, J.; Mizokami, Y.; Nadal, M.; Perera-Castro, A.V.; Roig-Oliver, M.; Sugiura, D.; et al. Cell wall thickness and composition are involved in photosynthetic limitation. J. Exp. Bot. 2021, 72, 3971–3986. [Google Scholar]
- Salmurzauly, R.; Myrzagaliyeva, A.; Irsaliyev, S.; Samarkhanov, T.; Orazov, A.; Nurtazin, S.; Altynbek, M.; Sagynysh, B. Fraxinus sogdiana Bunge forests in Charyn Canyon, Kazakhstan. Casp. J. Environ. Sci. 2024, 22, 1117–1131. [Google Scholar]
- Battaglia, M.; Oliviero, M. LEA proteins and the mechanisms of water stress tolerance in plants. Plant Cell Environ. 2008, 31, 163–174. [Google Scholar] [CrossRef]
- Munné-Bosch, S.; Alegre, L. Antioxidant content and oxidative stress in plants. In Antioxidants in Higher Plants; Springer: Berlin/Heidelberg, Germany, 2004; pp. 175–206. [Google Scholar]
- Akzhunis, I.; Dinara, Z.; Nurzhaugan, D.; Aidyn, O.; Nazerke, T.; Gulmira, T. Unravelling the Chloroplast Genome of the Kazakh Apricot (Prunus armeniaca L.) Through MinION Long-Read Sequencing. Plants 2025, 14, 638. [Google Scholar] [CrossRef] [PubMed]
Disclaimer/Publisher’s Note: The statements, opinions and data contained in all publications are solely those of the individual author(s) and contributor(s) and not of MDPI and/or the editor(s). MDPI and/or the editor(s) disclaim responsibility for any injury to people or property resulting from any ideas, methods, instructions or products referred to in the content. |
© 2025 by the authors. Licensee MDPI, Basel, Switzerland. This article is an open access article distributed under the terms and conditions of the Creative Commons Attribution (CC BY) license (https://creativecommons.org/licenses/by/4.0/).