Abstract
Revegetation in arid and semi-arid regions is a pivotal strategy for mitigating desertification and controlling soil erosion by enhancing carbon storage in woody biomass and mitigating wind-induced erosion. Despite its recognized importance, a critical gap remains in understanding how biomass carbon is distributed across different plant compartments (leaves, stems, litter, and roots) and how this distribution influences soil carbon dynamics. In this study, we examined carbon allocation between aboveground (shoot and litterfall) and belowground (coarse and fine roots) components, as well as the composition and vertical distribution of soil carbon in three 20-year-old shrub plantations—Salix psammophila, Corethrodendron fruticosum, and Artemisia desertorum—in northwest China. Total biomass and litter carbon storage were highest in the S. psammophila plantation (3689.29 g m−2), followed by C. fruticosum (1462.83 g m−2) and A. desertorum (761.61 g m−2). In contrast, soil carbon storage at a 1 m depth was greatest in A. desertorum (12,831.18 g m−2), followed by C. fruticosum (7349.24 g m−2) and S. psammophila (5375.80 g m−2). Notably, A. desertorum also exhibited the highest proportions of stable soil organic carbon (heavy-fraction) and soil inorganic carbon, while S. psammophila had the lowest. Across all plantations, belowground biomass carbon and light-fraction soil organic carbon displayed distinct vertical distributions, while heavy-fraction soil organic carbon and soil inorganic carbon did not show significant spatial patterns. A strong correlation was found between soil carbon fractions and microbial biomass carbon and nitrogen, suggesting that microbial communities were key drivers of soil carbon stabilization and turnover. These findings underscore the importance of litter composition, root traits, and microbial activity in determining soil carbon accumulation following shrub revegetation. The study highlights the need to investigate species-specific mechanisms, such as rhizodeposition dynamics and microbial necromass stabilization, to elucidate carbon redistribution pathways in semi-arid ecosystems.
1. Introduction
Drylands, which cover approximately 45% of the Earth’s terrestrial surface (around 66.7 million km2), are experiencing an increasing expansion due to global climate change and land-use modifications [1]. Semi-arid regions, in particular, face severe human impacts, making them key target areas for afforestation and restoration efforts [2]. These regions are not only vital for combating land degradation but also serve as important barriers against further ecological decline [3]. Despite having lower biomass density compared to more mesic ecosystems, semi-arid drylands play a significant role in the global land-based carbon (C) sink due to their high carbon turnover rates and substantial carbon storage capacity [4,5]. Afforestation in semi-arid regions is projected to achieve approximately 32.3 Gt of net cumulative carbon sequestration over the next 80 years, offering a promising strategy for mitigating climate change [6]. However, current research has primarily focused on aboveground carbon storage, while the dynamics of root biomass carbon and soil microbial activity—key components of carbon sequestration in arid environments—are often underexplored [7,8]. Understanding how carbon is allocated across different plant compartments and how soil microbial communities regulate organic carbon stabilization and turnover are critical for optimizing carbon sequestration strategies and improving the resilience of dryland ecosystems in the face of climate change.
Recent studies have increasingly focused on both aboveground and belowground C sequestration in dryland afforestation, particularly in semi-arid environments where plant adaptation strategies are crucial for optimizing resource utilization [9]. There remains a contentious debate regarding whether plants allocate more C to aboveground biomass or belowground structures in these ecosystems. Some studies indicate that in arid and semi-arid environments, plants tend to allocate a larger proportion of C to their root systems. This strategy enhances the acquisition of limited water and nutrients, thereby increasing belowground C storage [7,10]. This allocation pattern is consistent with the resource utilization strategies of xerophytic plants, which optimize survival by investing in extensive root networks. For example, coarse roots, due to their slower turnover rates, contribute significantly to belowground C storage, representing up to 70% of total plant biomass [11]. Conversely, under extreme drought conditions, other studies have reported substantial C allocation to aboveground parts, where rapid aboveground growth and litter decomposition contribute to soil C accumulation [12,13]. This dual allocation strategy reflects the adaptive flexibility of dryland plants in managing resource scarcity by distributing C both above- and belowground to optimize growth and survival. These contrasting patterns of C allocation in drylands highlight the complexity of plant strategies in managing resource scarcity and the dynamic nature of C cycling under stress. Recent field evidence further reveals that drought conditions can dynamically alter C allocation patterns [10]. These findings highlight the complexity and variability of C allocation in dryland ecosystems, emphasizing the need for a comprehensive understanding of these dynamics to inform effective dryland management practices aimed at maximizing C sequestration and enhancing ecosystem resilience in the face of climate change.
Soils, constituting the largest and most stable C reservoirs on Earth, store approximately four times more C than terrestrial vegetation, with around 2047 petagrams (Pg) of soil organic carbon (SOC) and 1558 Pg of soil inorganic carbon (SIC) [14]. Drylands, which encompass roughly 45% of the global land area, account for approximately 52% of these soil C reserves, including 32% of the world’s SOC and a substantial 80% of total SIC [1,4]. The plant–soil continuum is pivotal to the C cycle in dryland ecosystems, encompassing processes such as biomass turnover (including stems, leaves, roots, and reproductive structures), root exudation, and the transformation of organic matter into mycorrhizal biomass [15,16]. Furthermore, mechanisms like rhizodeposition, mycorrhizal symbiosis, root respiration, and exudation significantly influence soil C sequestration by enhancing the input and stabilization of organic compounds within the soil matrix [13]. Long-term C storage in dryland ecosystems is predominantly governed by the partitioning of biomass C between aboveground and belowground components and its subsequent sequestration in soil pools [5,17]. Root systems contribute directly to belowground carbon, while plant–microbial interactions drive the formation and stabilization of SOC fractions by converting labile organic matter into more recalcitrant forms [16,18]. The composition and dynamics of these soil C fractions are intricately linked to the structure and function of microbial communities, which regulate SOC stability through their interactions with various organic substrates [19]. Despite the general understanding of these processes, there remains a significant gap in knowledge regarding the specific contributions of different plant species and microbial activities to soil C dynamics in semi-arid environments. Recent studies highlight the need for a nuanced understanding of how different C sources—such as root biomass, rhizodeposition, and microbial residues—contribute to soil C dynamics and how these contributions are modulated by environmental stressors typical of dryland ecosystems.
Shrubs dominate the Mu Us Desert and have been extensively used to mitigate desertification and to enhance C sequestration [20,21]. Afforestation with drought-tolerant shrub species not only stabilizes soil but also promotes C accumulation over time. Despite the potential of afforestation to significantly increase C storage in this semi-arid ecosystem, the specific mechanisms driving C partitioning between plant biomass and soil C fractions remain inadequately understood. In this study, we investigated biomass C storage across different plant compartments (leaves, stems, litters, and roots) in three shrub plantations—Salix psammophila, Corethrodendron fruticosum, and Artemisia desertorum—revegetated in the southeastern Mu Us Desert. Additionally, we measured the vertical distribution and composition of soil C and its fractions. We hypothesized that: (1) biomass C partitioning patterns and soil C storage differ significantly among shrub species, and (2) the allocation of biomass C in different shrub species significantly influences the accumulation and stability of soil C. By examining the contributions of various C sources and the interactions between plant biomass and soil microbial communities, this study aimed to elucidate the mechanisms underpinning soil C dynamics in revegetated shrublands. The findings will provide critical insights into the effects of afforestation on ecosystem C cycling, offering valuable guidance for optimizing revegetation strategies and enhancing C sequestration potential in semi-arid ecosystems.
2. Materials and Methods
2.1. Study Site Description
Field sampling was conducted at the Hongshixia Sandy Botanical Garden (37°26′ N, 109°12′ E; elevation 1100 m a.s.l) in the northern Shaanxi Province, northwest China. The site is characterized by a warm temperate continental monsoon climate, with a mean annual temperature of 9.1 °C and annual precipitation averaging approximately 386 mm. The soil in this region is predominantly sandy, exhibiting a bulk density of ca. 1.50 g cm−3, which reflects the region’s fragile ecosystem prone to desertification. In 2020, fifteen sampling plots (10 m × 10 m each) were established to investigate the carbon allocation strategies of three representative species: S. psammophila, C. fruticosum, and A. desertorum. The distance between the sampling plots ranges from 100 to 1000 m, ensuring spatial variability while maintaining consistency in environmental conditions. According to the vegetation restoration records of the garden, these species were initially planted in 2000 as part of long-term ecological restoration efforts aimed at mitigating desertification. To minimize disturbances from livestock and wildlife, protective fencing was installed around the experimental area. Detailed descriptions of the three representative plots are provided in Table 1.

Table 1.
Characteristics of the sampling plots and soil physical properties (mean ± S.D., n = 5).
2.2. Biomass C Sampling and Analysis
In August 2020, biomass sampling was conducted at the Hongshixia Sandy Botanical Garden by randomly selecting three subplots (2 m × 2 m) within each of the fifteen plots. Referring to the plant sampling method of Guillemot et al. [22], aboveground plant biomass and surface litter, including dead branches, twigs, and leaves, were collected separately. Each plant was severed at ground level, and live and dead specimens were distinctly separated. Biomass samples from the three subplots within each plot were pooled to form a single composite sample for each sampling location. Surface litter and soil samples (0–1 cm depth) were collected, labeled, and placed in paper bags for subsequent laboratory analysis. To isolate small litter particles, soil samples were mixed with tap water and thoroughly agitated. Leaf samples were collected from all plants within each subplot. All plant and litter samples were oven-dried at 70 °C for 72 h, and their dry weights were measured to the nearest 0.01 g. The C content of each sample was then determined using the potassium dichromate oxidation method, following standardized protocols.
Belowground biomass was collected from the same subplots designated for aboveground biomass sampling. Each subplot was excavated to a depth of 100 cm using a combination of manual labor and mechanical equipment. The excavated soil was sequentially sieved through metal sieves with mesh sizes of 0.5 mm, 1 mm, and 2 mm to recover all roots regardless of diameter. The vertical distribution of root systems was categorized into five soil depth layers: 0–20 cm, 20–40 cm, 40–60 cm, 60–80 cm, and 80–100 cm. Root samples from each depth layer within the three subplots were combined to form a single composite sample per sampling location. These composite samples were then labeled, placed in bags, and transported to a field laboratory for further analysis. In the laboratory, root samples were separated into coarse (>2 mm) and fine (≤2 mm) fractions. All samples were dried to a constant weight at 70 °C and weighed to the nearest 0.01 g. Subsequently, the dried roots were pulverized for C content analysis using the potassium dichromate oxidation method.
2.3. Chemical Composition of Litterfall and Fine Root
Dried litterfall and fine roots were ground using a mortar and pestle for subsequent chemical analysis. The C, nitrogen, and phosphorus content were measured using dry combustion, the Kjeldahl, and molybdenum–antimony colorimetric methods, respectively. Cellulose and hemicellulose contents were determined using the Van Soest method, while soluble sugars and starch concentrations were quantified using the enzymatic method and iodine–starch reaction methods, respectively.
2.4. Soil Sampling and Analysis
Soil samples were collected to evaluate various soil traits across the study sites. Approximately 2000 g of soil were extracted at five depth intervals (0–20 cm, 20–40 cm, 40–60 cm, 60–80 cm, and 80–100 cm) using a sterilized soil auger with a diameter of 4.5 cm. Sampling was conducted in three shrub plots and one bare land plot (control) in the Hongshixia Sandy Botanical Garden. From each plot, five soil cores were randomly collected from different locations within the plot to account for spatial variability and then homogenized. This resulted in a total of 100 soil samples, with 5 replicates per plot, including three shrub species and one control, across five soil depth intervals. Soil bulk density for each depth interval was measured using 100 cm3 soil cores.
Microbial biomass carbon (MBC) and nitrogen (MBN) were quantified using the chloroform fumigation extraction method on fresh soil samples. The remaining soil was air-dried at room temperature, sieved through a 2 mm mesh, and ground in a laboratory mill for further analysis. Total soil carbon (TC) was determined using a TOC analyzer (Shimadzu TOC-VCSH, Kyoto, KYT, Japan). Soil inorganic carbon (SIC) was removed by treatment with 1 mol/L HCl, and soil organic carbon (SOC) was subsequently measured using the dichromate oxidation method. Heavy- and light-fraction SOCs (HF-SOC and LF-SOC) were separated following the protocol of Hu et al. [23]. Total nitrogen (TN), ammonium nitrogen (AN), and nitrate nitrogen (NN) were determined using the Kjeldahl method, a colorimetric method based on cadmium reduction, and the sodium bicarbonate extraction method, respectively. Total phosphorus (TPh) and available phosphorus (APh) were quantified using the molybdenum–antimony colorimetric method and the sodium bicarbonate extraction method, respectively. Total potassium (TPo) and available potassium (APo) were measured using modified ammonium acetate extraction methods. Soil pH was assessed in a 1:1.5 (w/v) suspension of soil and distilled water using a pH meter.
2.5. Statistical Analysis
All statistical analyses and visualizations were conducted using R software (version 4.0.0; https://www.r-project.org/, accessed on 1 April 2020). All statistical tests were two-tailed, and significance was established at p-values below 0.05. Data preprocessing involved testing for normality and homoscedasticity using the Shapiro–Wilk test and Levene’s test (from the ‘car’ package), respectively. For datasets that did not meet normality assumptions, appropriate transformations, such as log or square root transformations, were applied to normalize the data distribution. If transformations did not sufficiently address the assumptions, non-parametric alternatives were considered. To assess differences between groups, a one-way Analysis of Variance (ANOVA) was conducted. Significant ANOVA results were followed by post-hoc comparisons using Tukey’s Honestly Significant Difference (HSD) test, with p-values adjusted for multiple comparisons using the Bonferroni correction to control the false discovery rate (FDR; p < 0.05). Effect sizes, specifically η2, were calculated to evaluate the magnitude of differences observed. To compare the soil carbon storage across different shrubland types and soil layers, sensitivity analysis was conducted using the sensitivity package. All measured traits were standardized using Z-scores via the MuMin package to facilitate comparison across variables. Pearson’s correlation coefficients were computed to explore relationships between soil carbon-related properties and other soil characteristics, utilizing the cor and corrplot packages for correlation matrix generation and visualization, respectively.
Additionally, structural equation modeling (SEM) was employed to elucidate the direct and indirect relationships between biomass carbon storage, soil traits, microbial activity, and soil carbon fractions. The lavaan package was used to construct and evaluate the SEM, allowing for the integration of multiple dependent relationships within a single comprehensive model. Model fit was assessed using indicators such as the Comparative Fit Index (CFI), root mean square error of approximation (RMSEA), and the standardized root mean square residual (SRMR). Path coefficients were estimated to determine the strength and significance of the hypothesized relationships, providing insights into the underlying mechanisms driving soil carbon dynamics in revegetated shrublands.
3. Results
3.1. Biomass C Storage
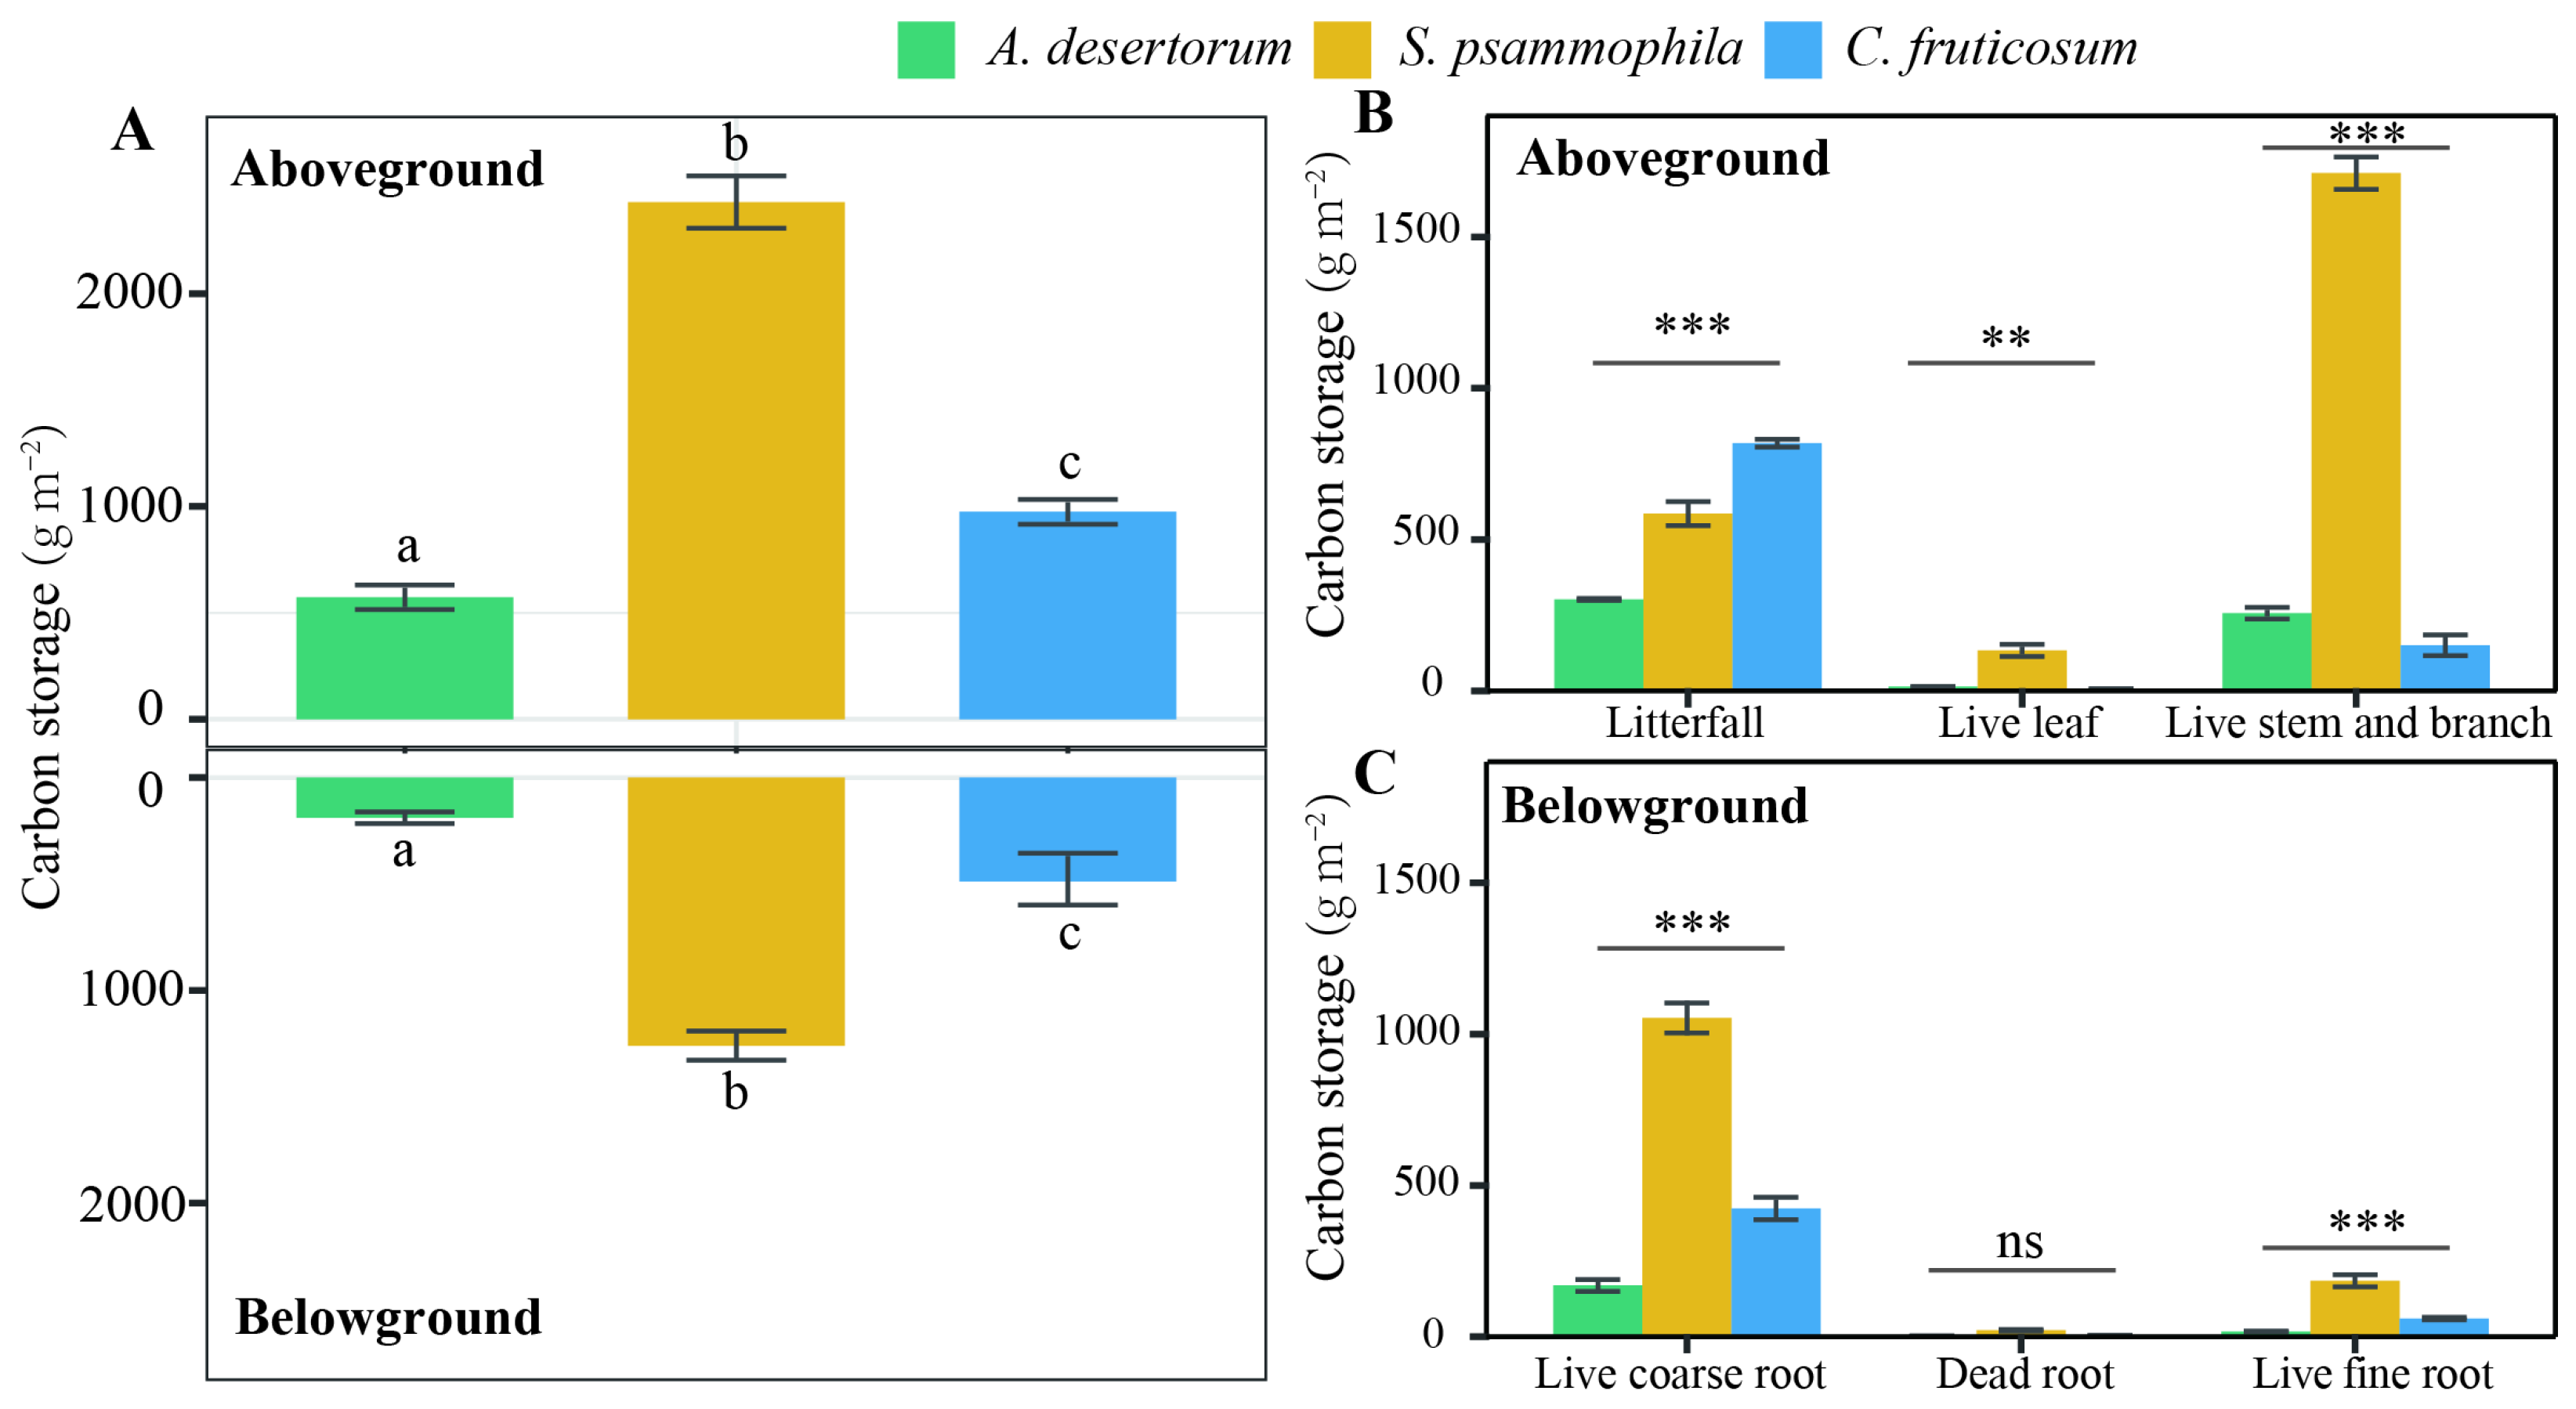
Aboveground C storage varied significantly across the three shrub species, ranging between 572.52 ± 12.91 g m−2 in A. desertorum, 974.40 ± 35.71 g m−2 in C. fruticosum, and 2429.54 ± 132.99 g m−2 in S. psammophila (Figure 1). Among the live aboveground C pools—comprising stems, branches, and leaves—S. psammophila contained the most C (1844.29 ± 122.60 g m−2), followed by A. desertorum (270.14 ± 10.68 g m−2), and C. fruticosum (156.12 ± 11.63 g m−2) (p < 0.05). Meanwhile, C. fruticosum (818.27 ± 29.43 g m−2) litter contained the most aboveground C, followed by S. psammophila (585.26 ± 22.33 g m−2) and A. desertorum (302.38.14 ± 29.43 g m−2). Annual foliage production in S. psammophila (133.70 ± 11.65 g m−2) was greater than that of A. desertorum (13.59 ± 1.24 g m−2) and C. fruticosum (5.73 ± 0.75 g m−2) (p < 0.001). Ratios of dead to total biomass ranged from 24.13% to 83.98% (C. fruticosum > A. desertorum > S. psammophila).
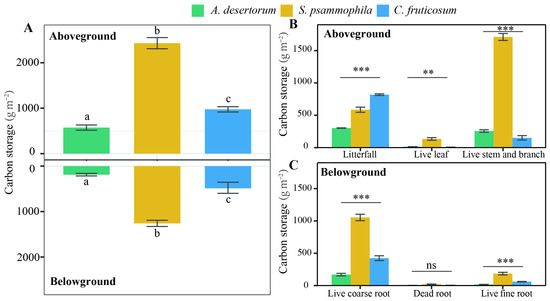
Figure 1.
Ecosystem biomass C partitioning among three shrub species (A. desertorum, S. psammophila, C. fruticosum). Bars represent the standard error of the mean. (A) Aboveground and belowground biomass C storage among three shrub species, with different lowercase letters indicating significant differences. (B) Variation in fractions of aboveground biomass C storage among the three shrub species. ** p < 0.01; *** p < 0.001. (C) Variation in fractions of belowground biomass C storage among the three shrub species. *** p < 0.001; ns, not significant.
Root C storage varied significantly between the three shrub species (Figure 1; p < 0.05). Total root C storage was 1259.75 ± 57.58 g m−2 for S. psammophila, 488.42 ± 12.35 g m−2 for C. fruticosum, and 189.05 ± 13.38 g m−2 for A. desertorum. Fine and dead roots from each species contributed 31.01%, 25.53%, and 19.40% of the total root C, respectively. Total root C decreased with depth in all three shrublands (Figure 2). The distribution of root C (both coarse and fine roots) was higher in the upper soil layer compared to deep layers (Figure 2). A substantial proportion of coarse root C was concentrated in the upper 40 cm of the 100 cm profiles, accounting for 70.93% for S. psammophila, 75.84% for A. desertorum, and 55.06% for C. fruticosum. Within this layer, fine root C accounted for 69.62% of the total for S. psammophila, 86.84% for A. desertorum, and 77.71% for C. fruticosum.
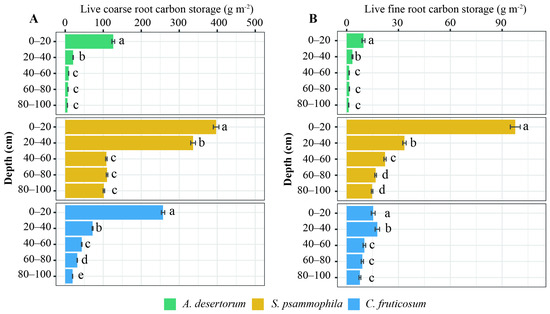
Figure 2.
Vertical distribution of coarse (A) and fine (B) root C storage among three shrublands (A. desertorum, S. psammophila, C. fruticosum). Different lowercase letters indicate significant differences between soil layers within the same shrub species.
3.2. Soil C Storage and Distribution of Three Revegetated Shrubs
Belowground C storage, comprising both root biomass and soil C, was highest in S. psammophila (3913.50 ± 179.77 g m−2), followed by A. desertorum (3586.36.83 ± 113.31 g m−2) and C. fruticosum (2907.83 ± 275.88 g m−2), representing approximately 67.71%, 86.23%, and 74.91% of total C storage in each plot, respectively (Figure 1 and Figure 2). Notably, soil C accounted for the largest proportion of total C storage in the A. desertorum plots, comprising 77.20% of overall C storage, while it contributed 22.33% and 49.86% in the S. psammophila and C. fruticosum plots, respectively.
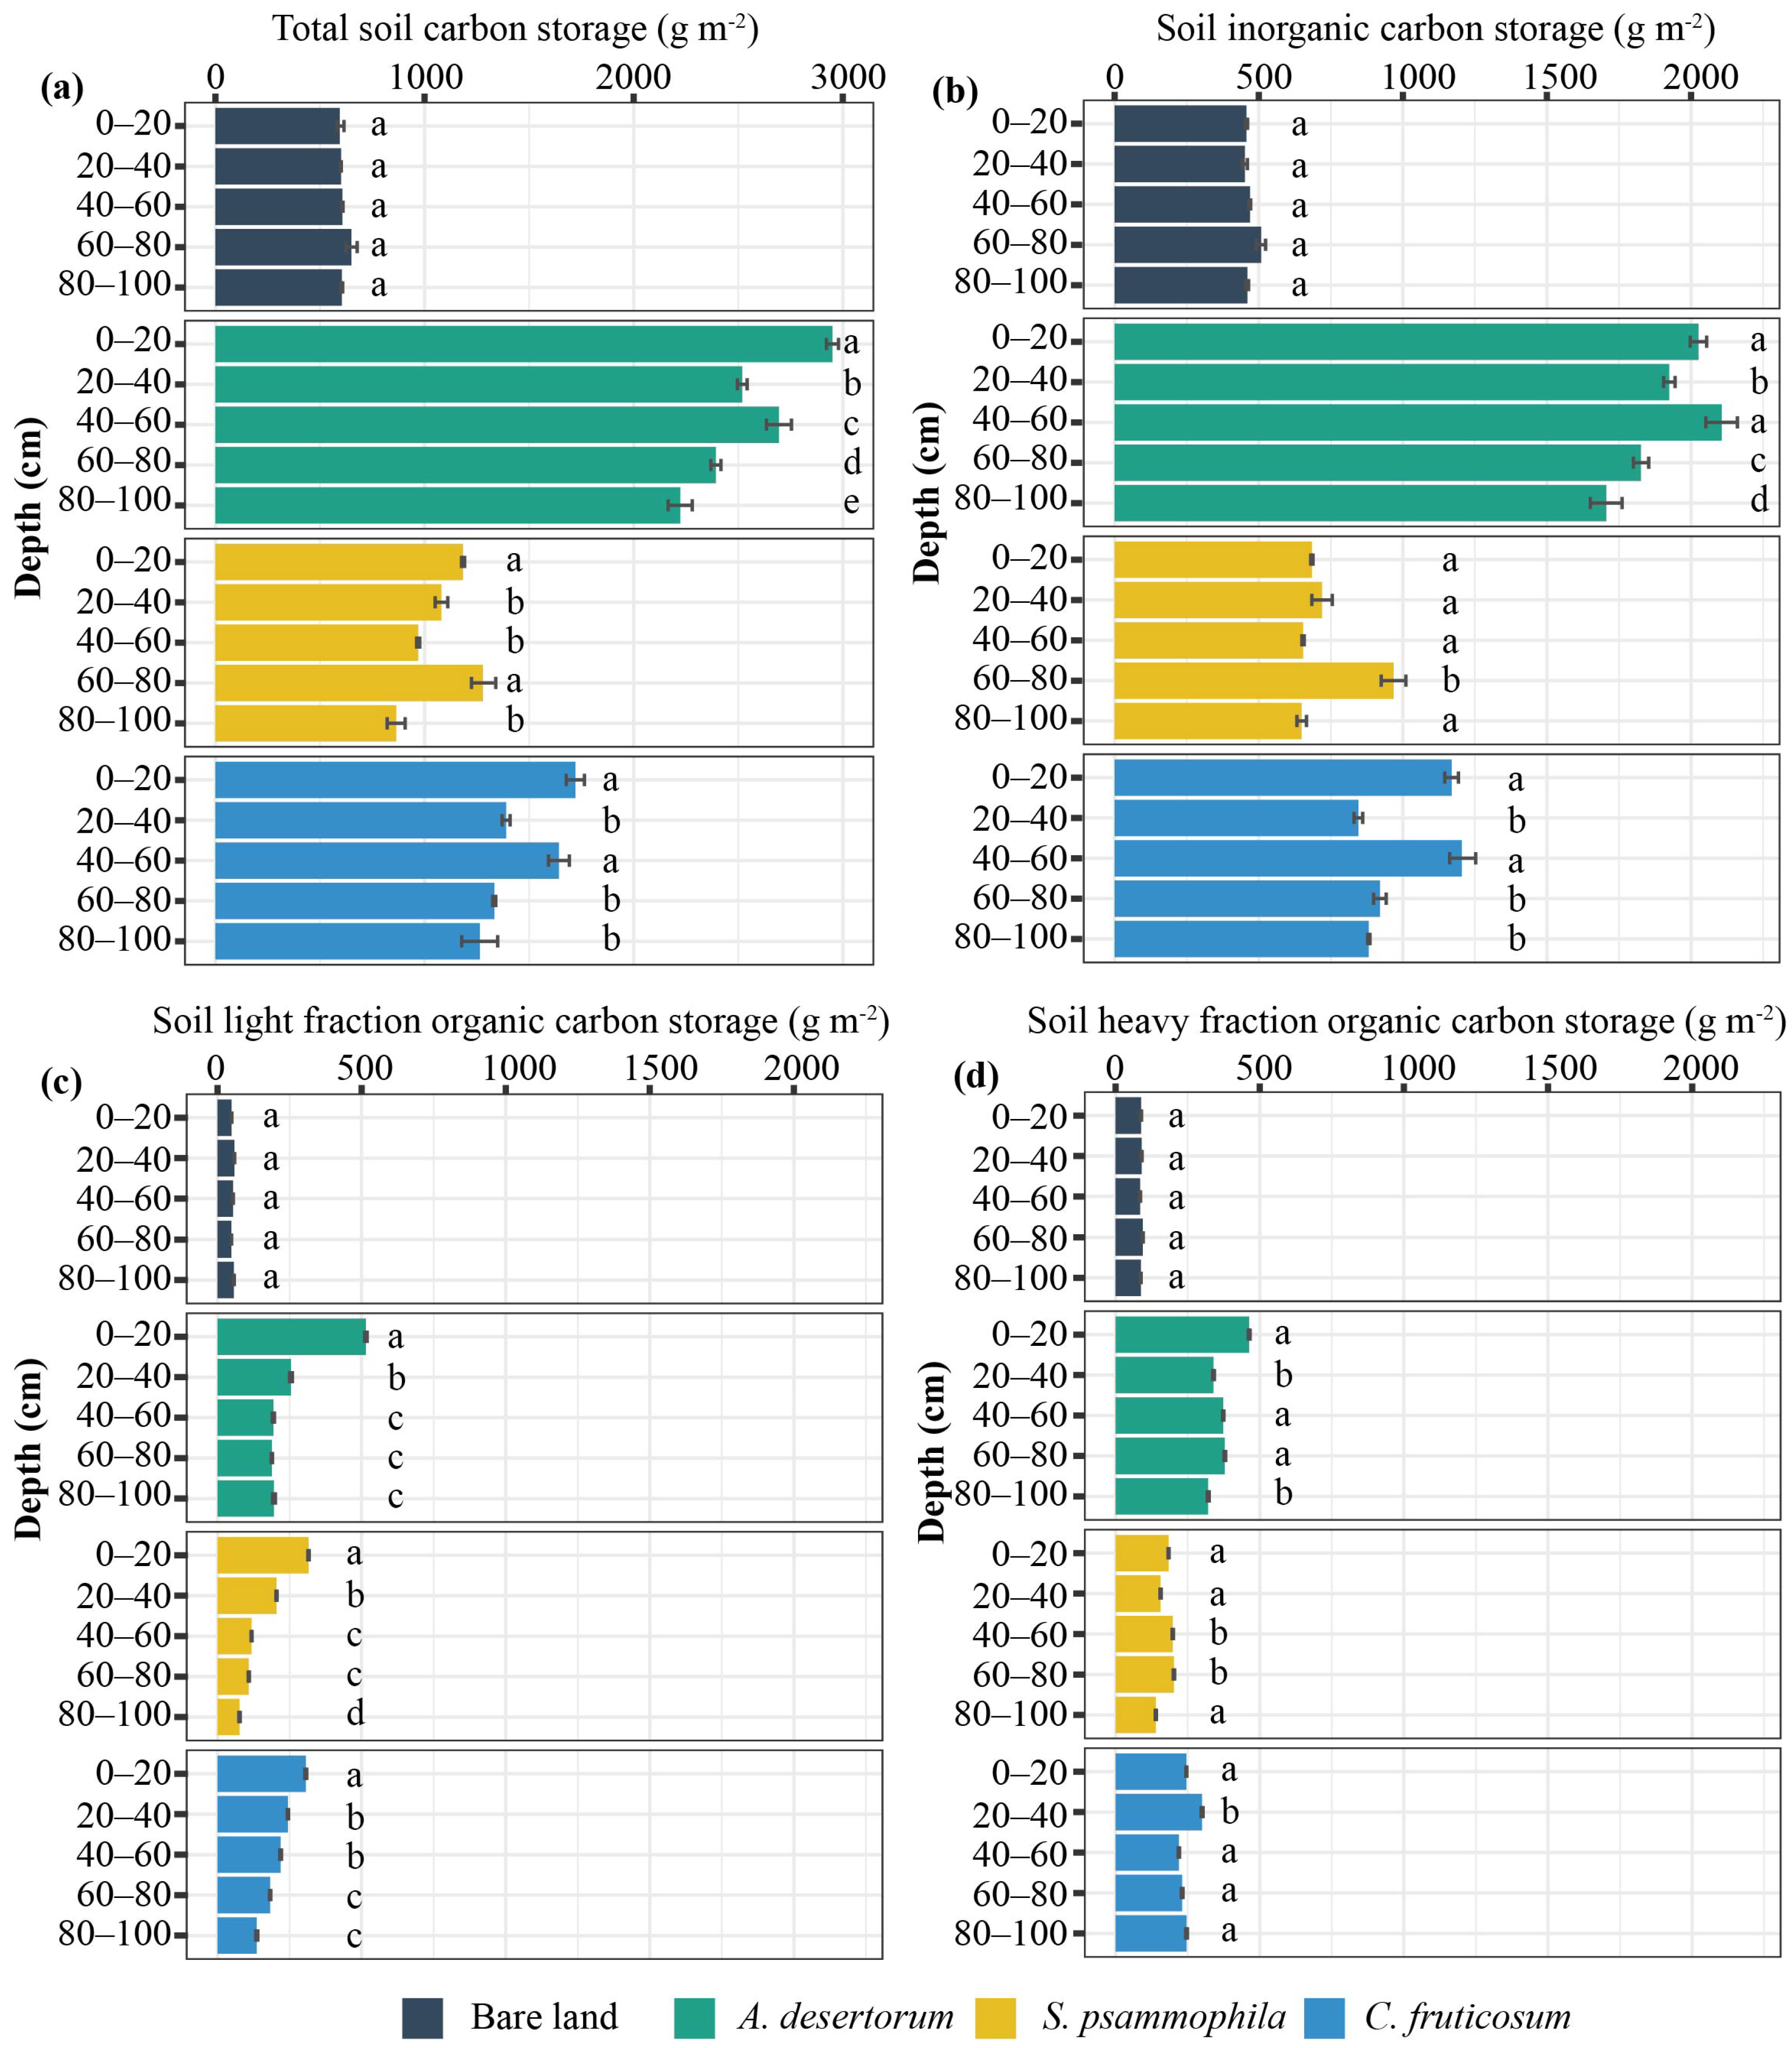
Total soil C stocks were highest in A. desertorum plots, followed by C. fruticosum and then S. psammophila, with soil C fractions—namely LF-SOC, HF-SOC, and SIC—showing the same vertical trend (Figure 3). In all three shrubland plots, total soil C was significantly higher compared to the control (bare sandy land), with increases of 425.46%, 216.76%, and 131.64% for A. desertorum, C. fruticosum, and S. psammophila, respectively (Figure 3a). LF-SOC was significantly higher in the topsoil layer (0−40 soil layer) than in the deep soil across three shrublands (p < 0.05), and it decreased with depth (Figure 3). However, except for SIC in the A. desertorum plot, the proportions of soil C, represented by HF-SOC and SIC, varied significantly with depth without displaying distinct spatial patterns (Figure 3b–d). In the topsoil layer, LF-SOC accounted for 57.13% of total LF-SOC in the A. desertorum plot, 50.64% in the C. fruticosum plot, and 63.25% in the S. psammophila plot. Across all three shrubland plots, approximately 40% of SIC was located in the topsoil layer, while 42.82%, 43.93%, and 38.64% of HF-SOC were contained in this layer in A. desertorum, C. fruticosum, and S. psammophila, respectively.
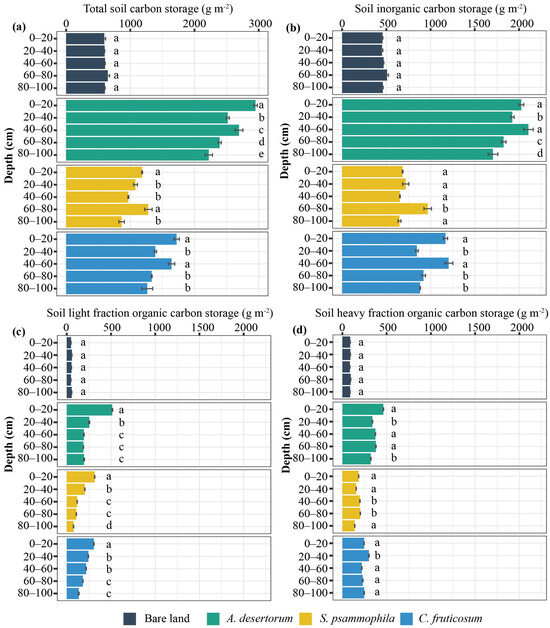
Figure 3.
Vertical distribution of soil total C storage (a) and its fractions ((b) SIC, (c) LF-SOC, (d) HF-SOC) among three shrublands (A. desertorum, S. psammophila, C. fruticosum) and bare land. Different lowercase letters indicate significant differences between soil layers within the same sampling plot.
3.3. Correlation Between Carbon Storage and Soil Properties
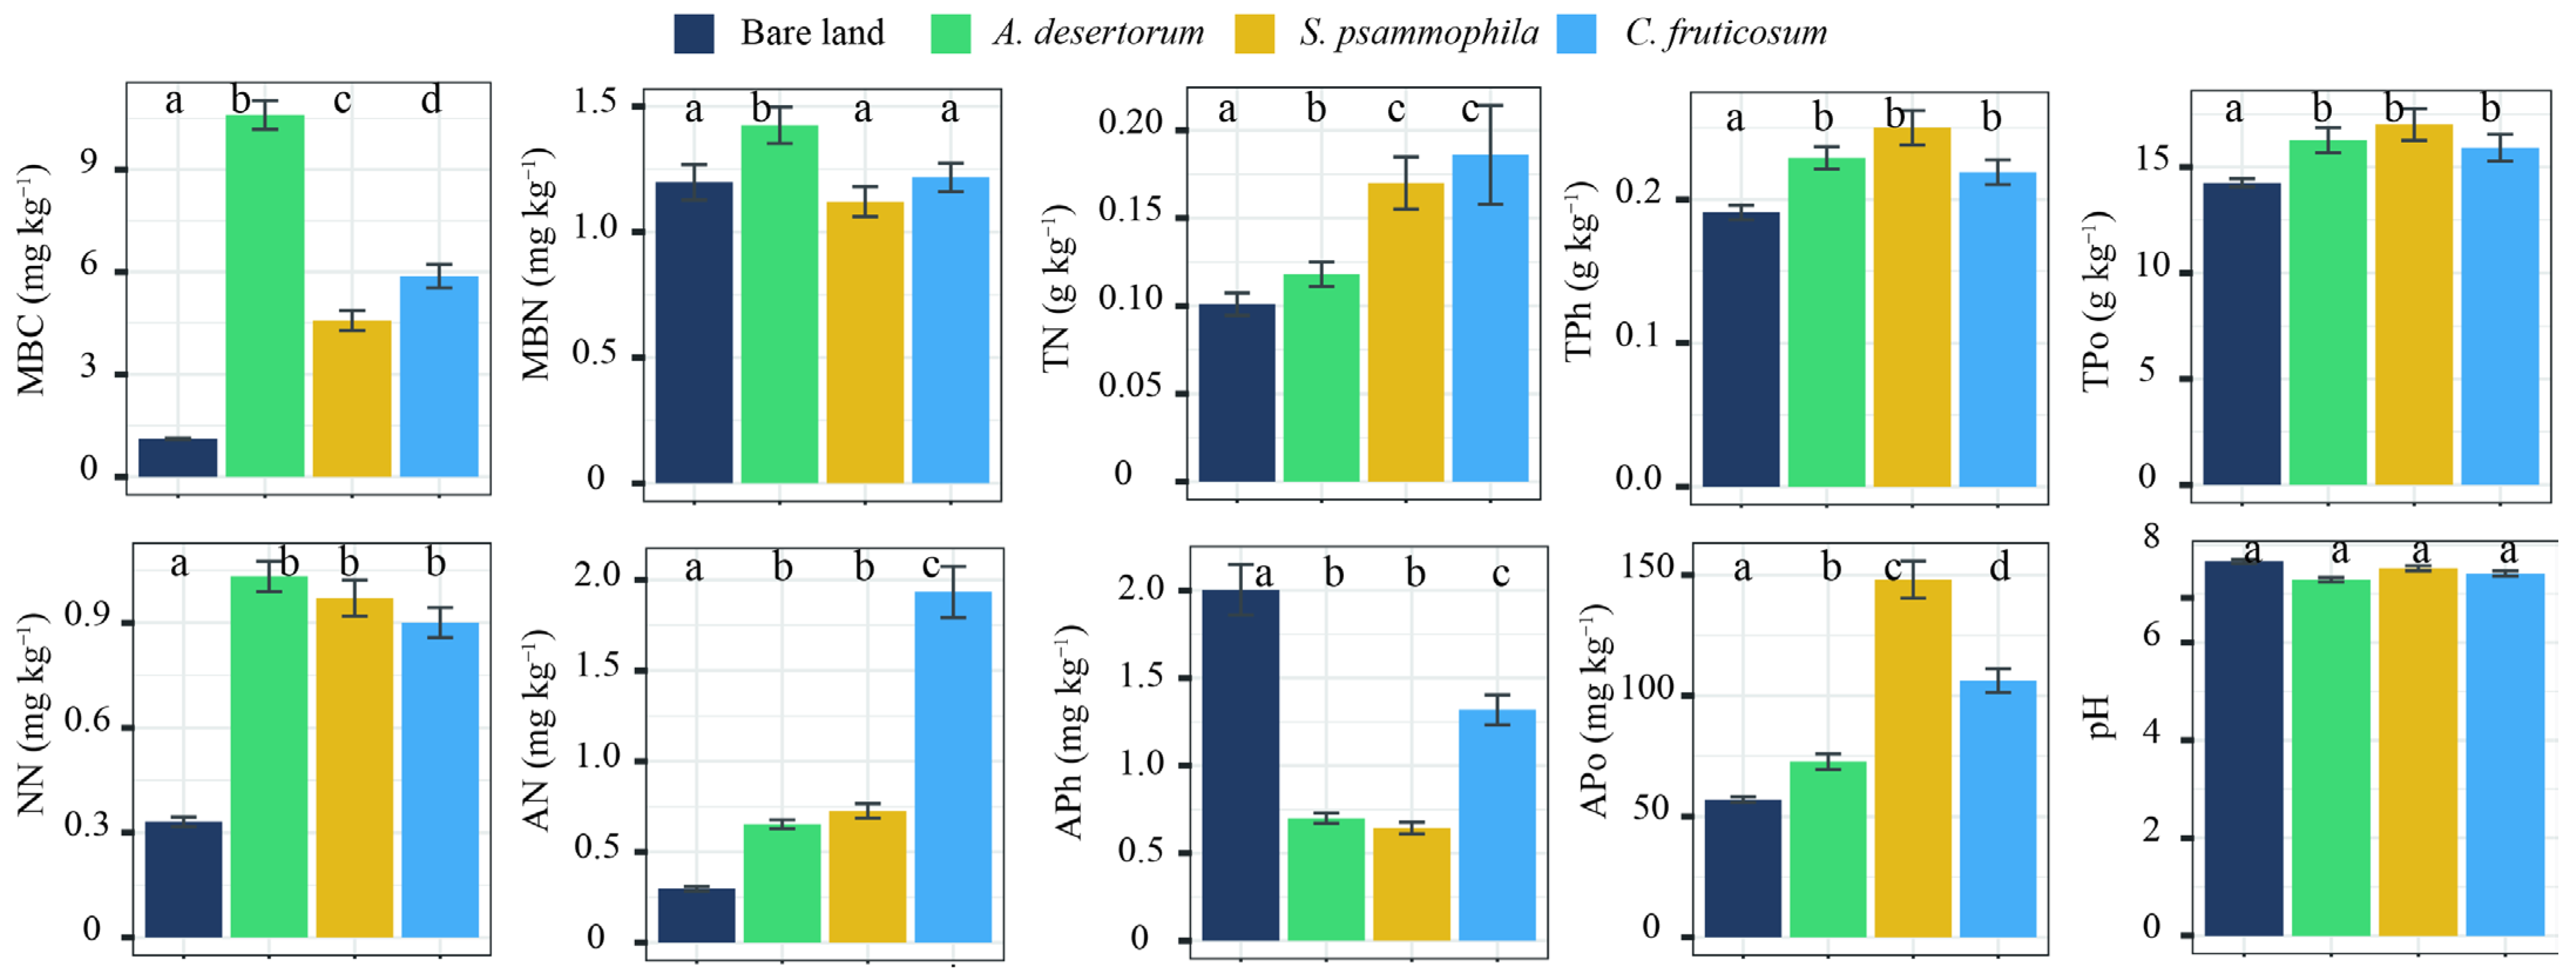
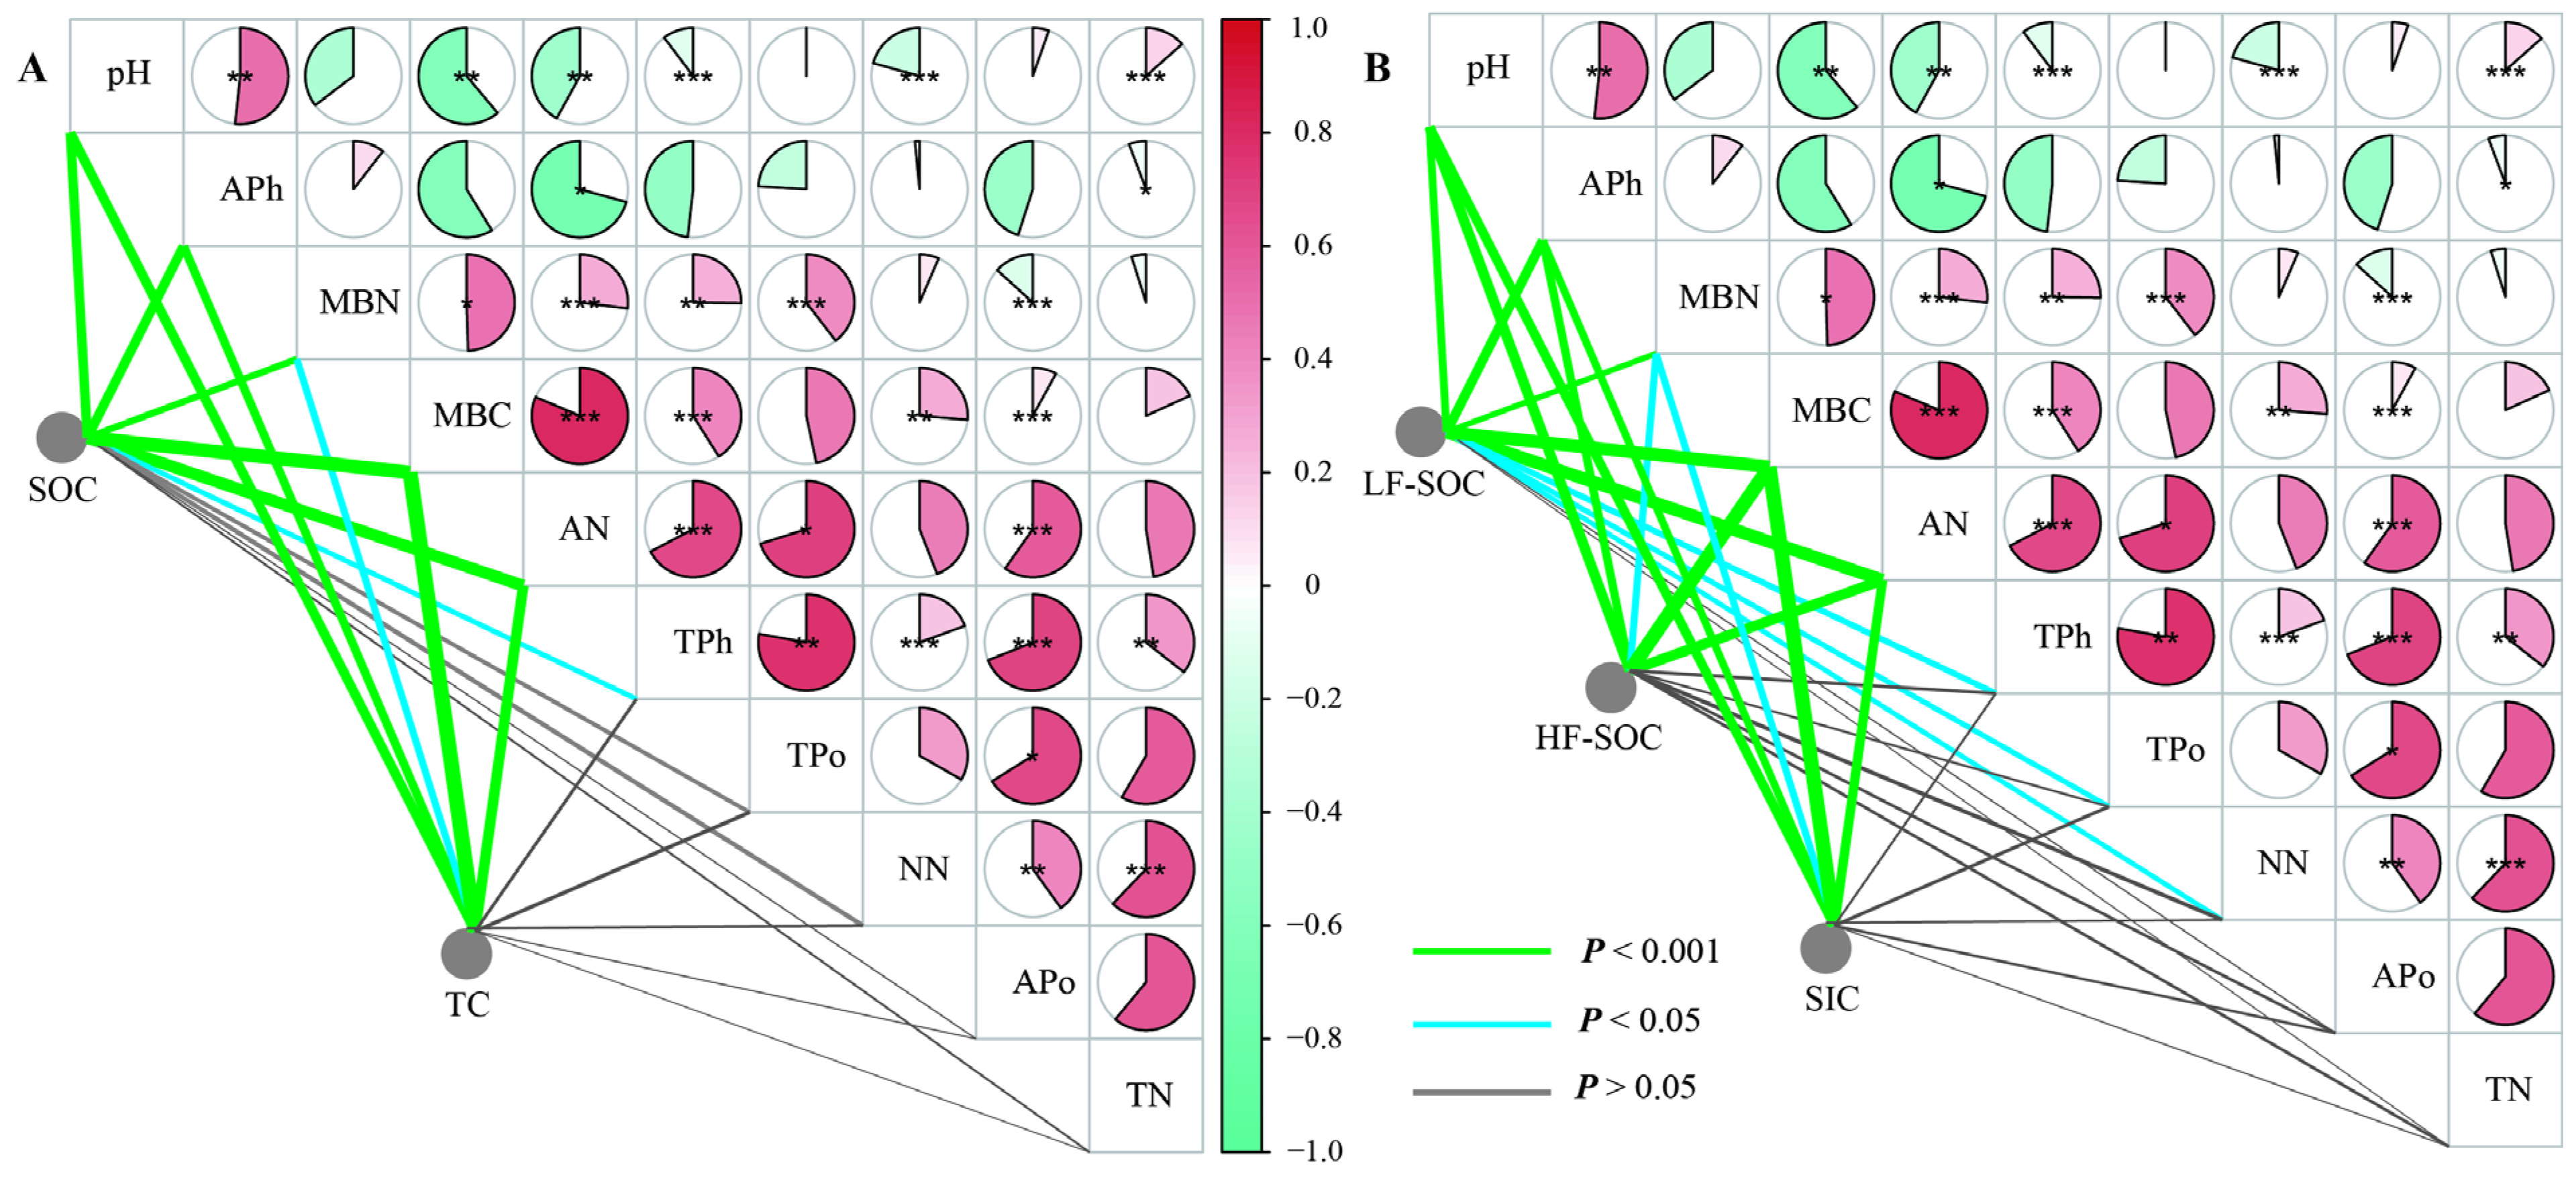
Physicochemical properties showed significant differences relative to bare land in all three shrubland types (p < 0.05), except for pH (p > 0.05) (Figure 4). Among the shrub species, S. psammophila exhibited the highest APo, while C. fruticosum had the highest TN and AN concentration. A. desertorum contained the highest MBC and MBN levels. TC, SOC, SIC, and HF-SOC storage were significantly correlated with MBC, MBN, AN, APh, and pH. Additionally, LF-SOC was influenced by TPh, TPo, and NN (Figure 5). MBC emerged as a key factor influencing soil C storage and the partitioning of carbon into its different fractions.

Figure 4.
Soil properties of three shrublands (A. desertorum, S. psammophila, C. fruticosum) and bare land. Different lowercase letters indicate significant differences. MBC: microbial biomass C; MBN: microbial biomass nitrogen; TN: total nitrogen ammonium; TPh: total phosphorus; TPo: total potassium; NN: nitrate nitrogen; AN: ammonium nitrogen; APh: available phosphorus; Apo: available potassium.
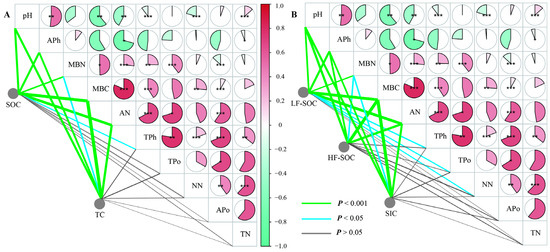
Figure 5.
Correlation analysis among soil C fractions ((A) TC and SOC; (B) SIC, HF-SOC, and LF-SOC) and soil properties. MBC: microbial biomass C; MBN: microbial biomass nitrogen; TN: total nitrogen ammonium; TPh: total phosphorus; TPo: total potassium; NN: nitrate nitrogen; AN: ammonium nitrogen; APh: available phosphorus; Apo: available potassium. Significance levels: * p < 0.05, ** p < 0.01, *** p < 0.001.
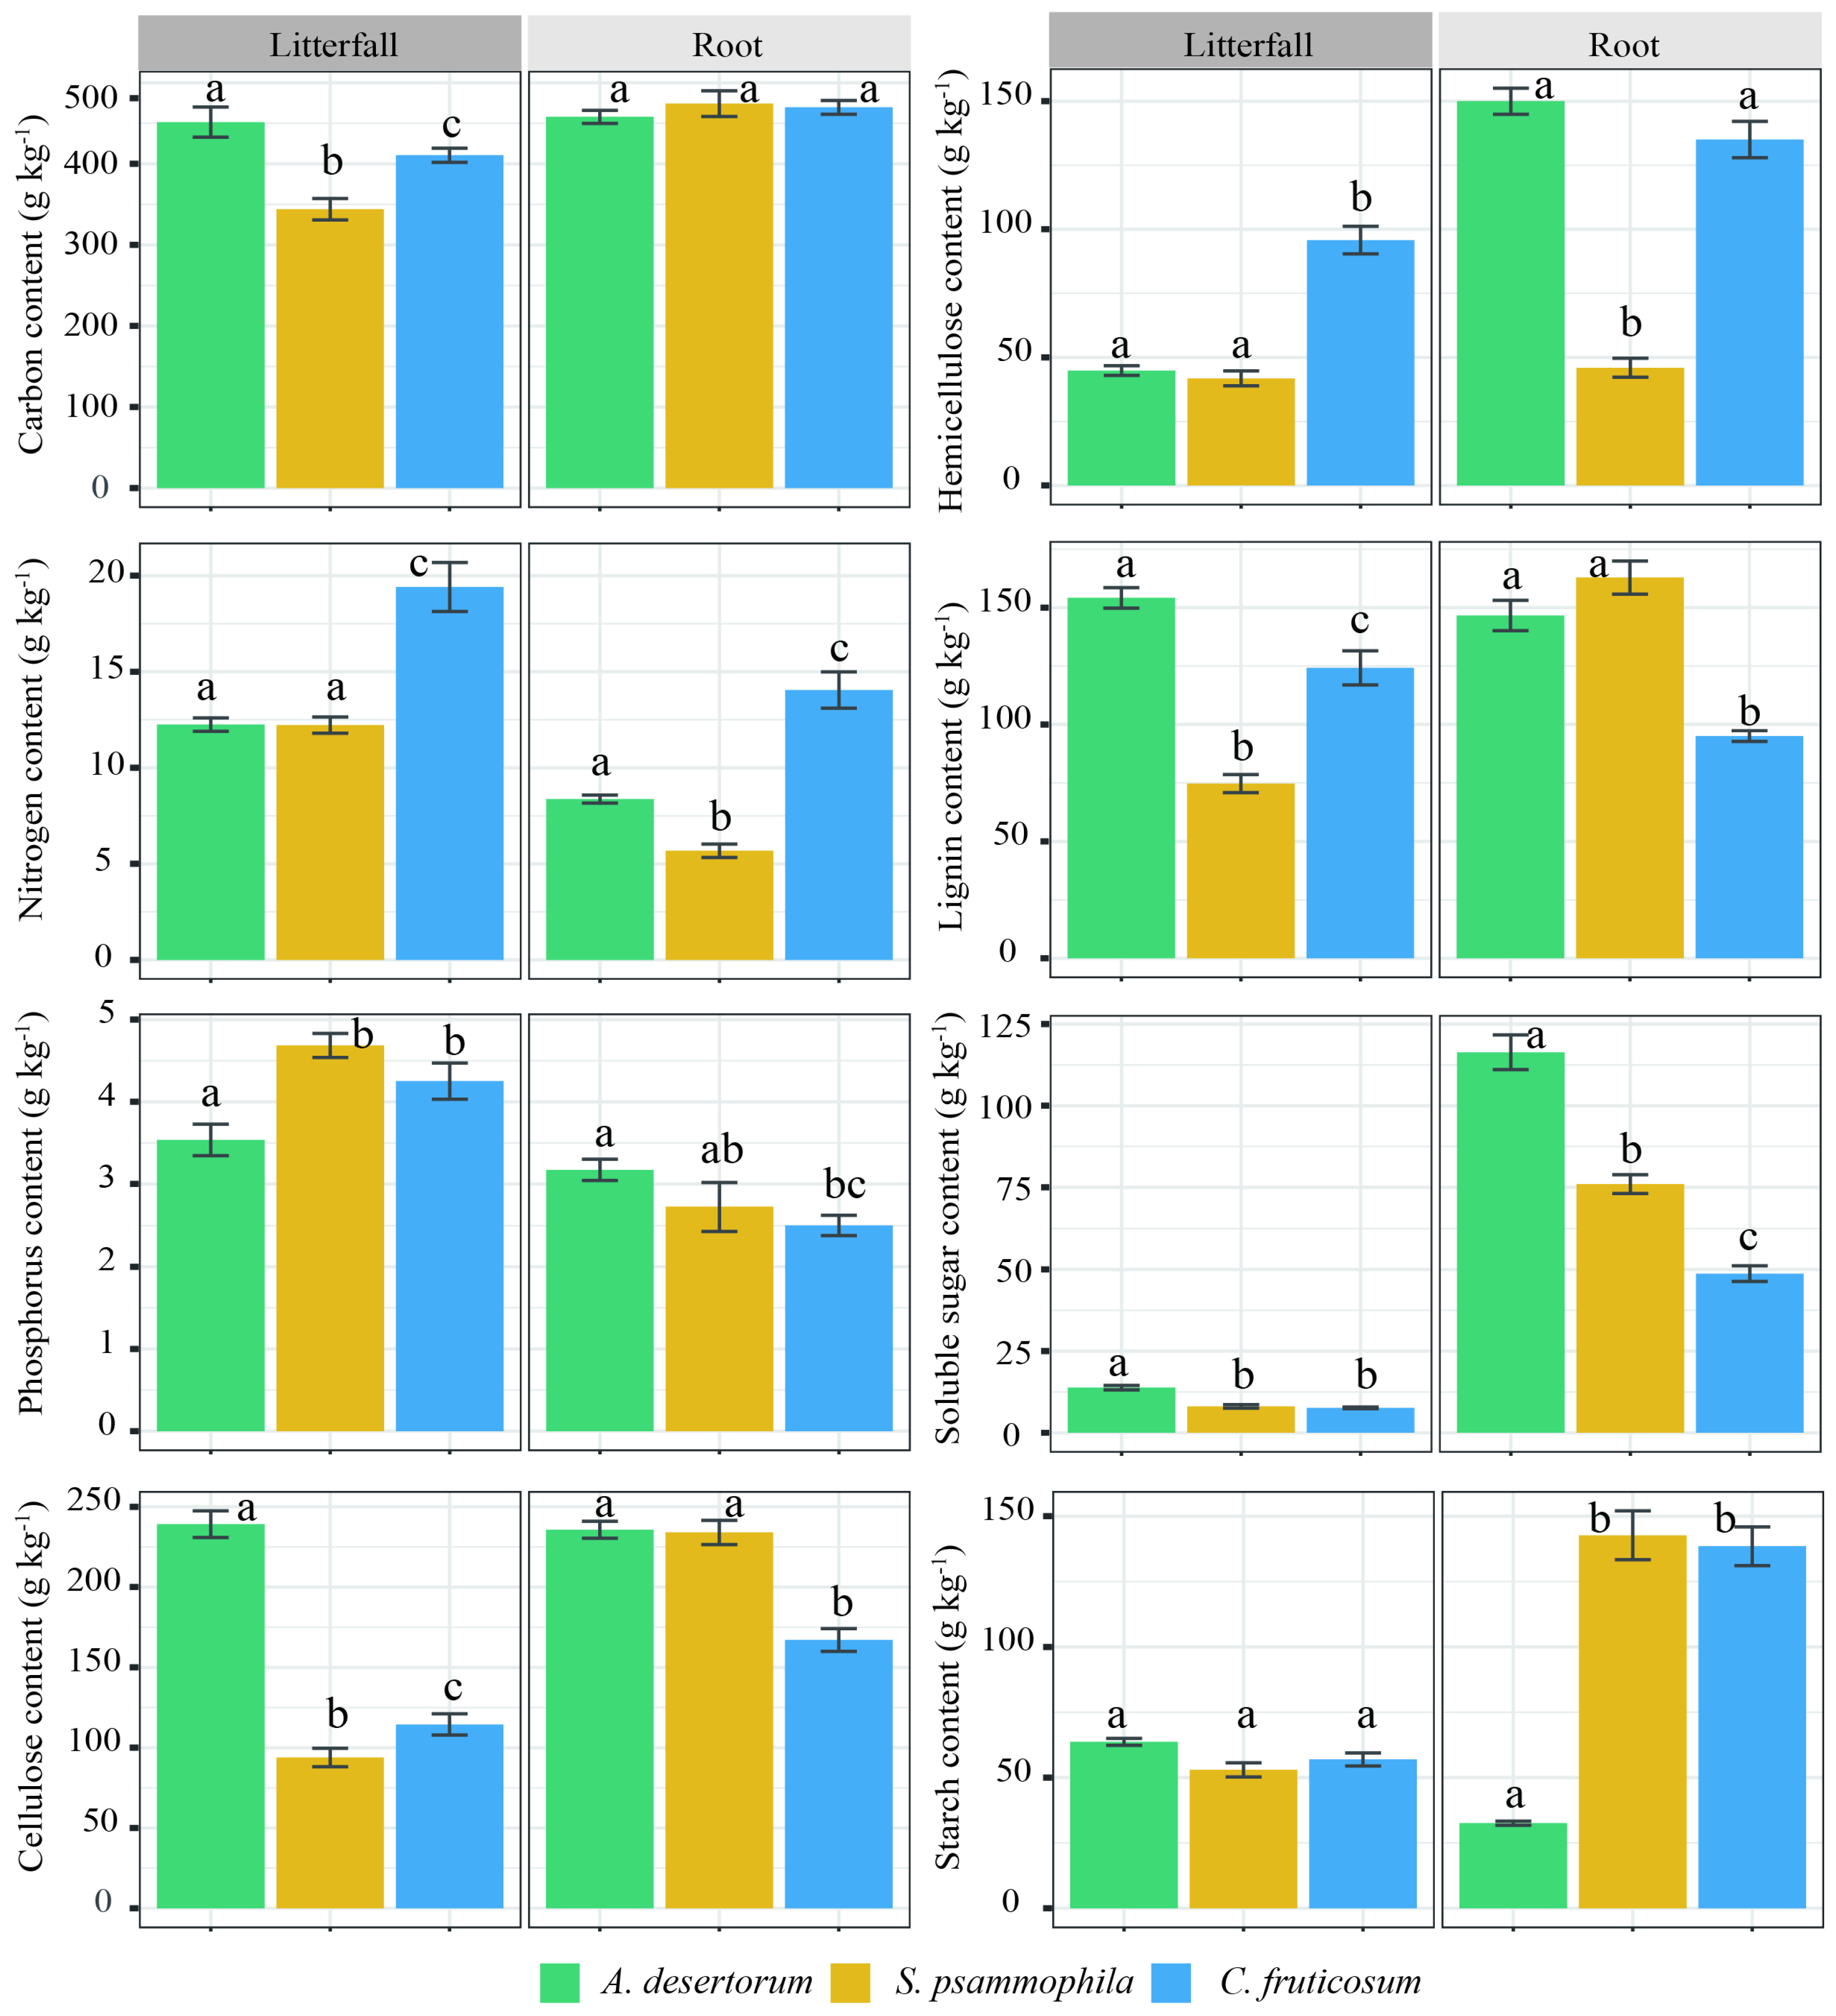
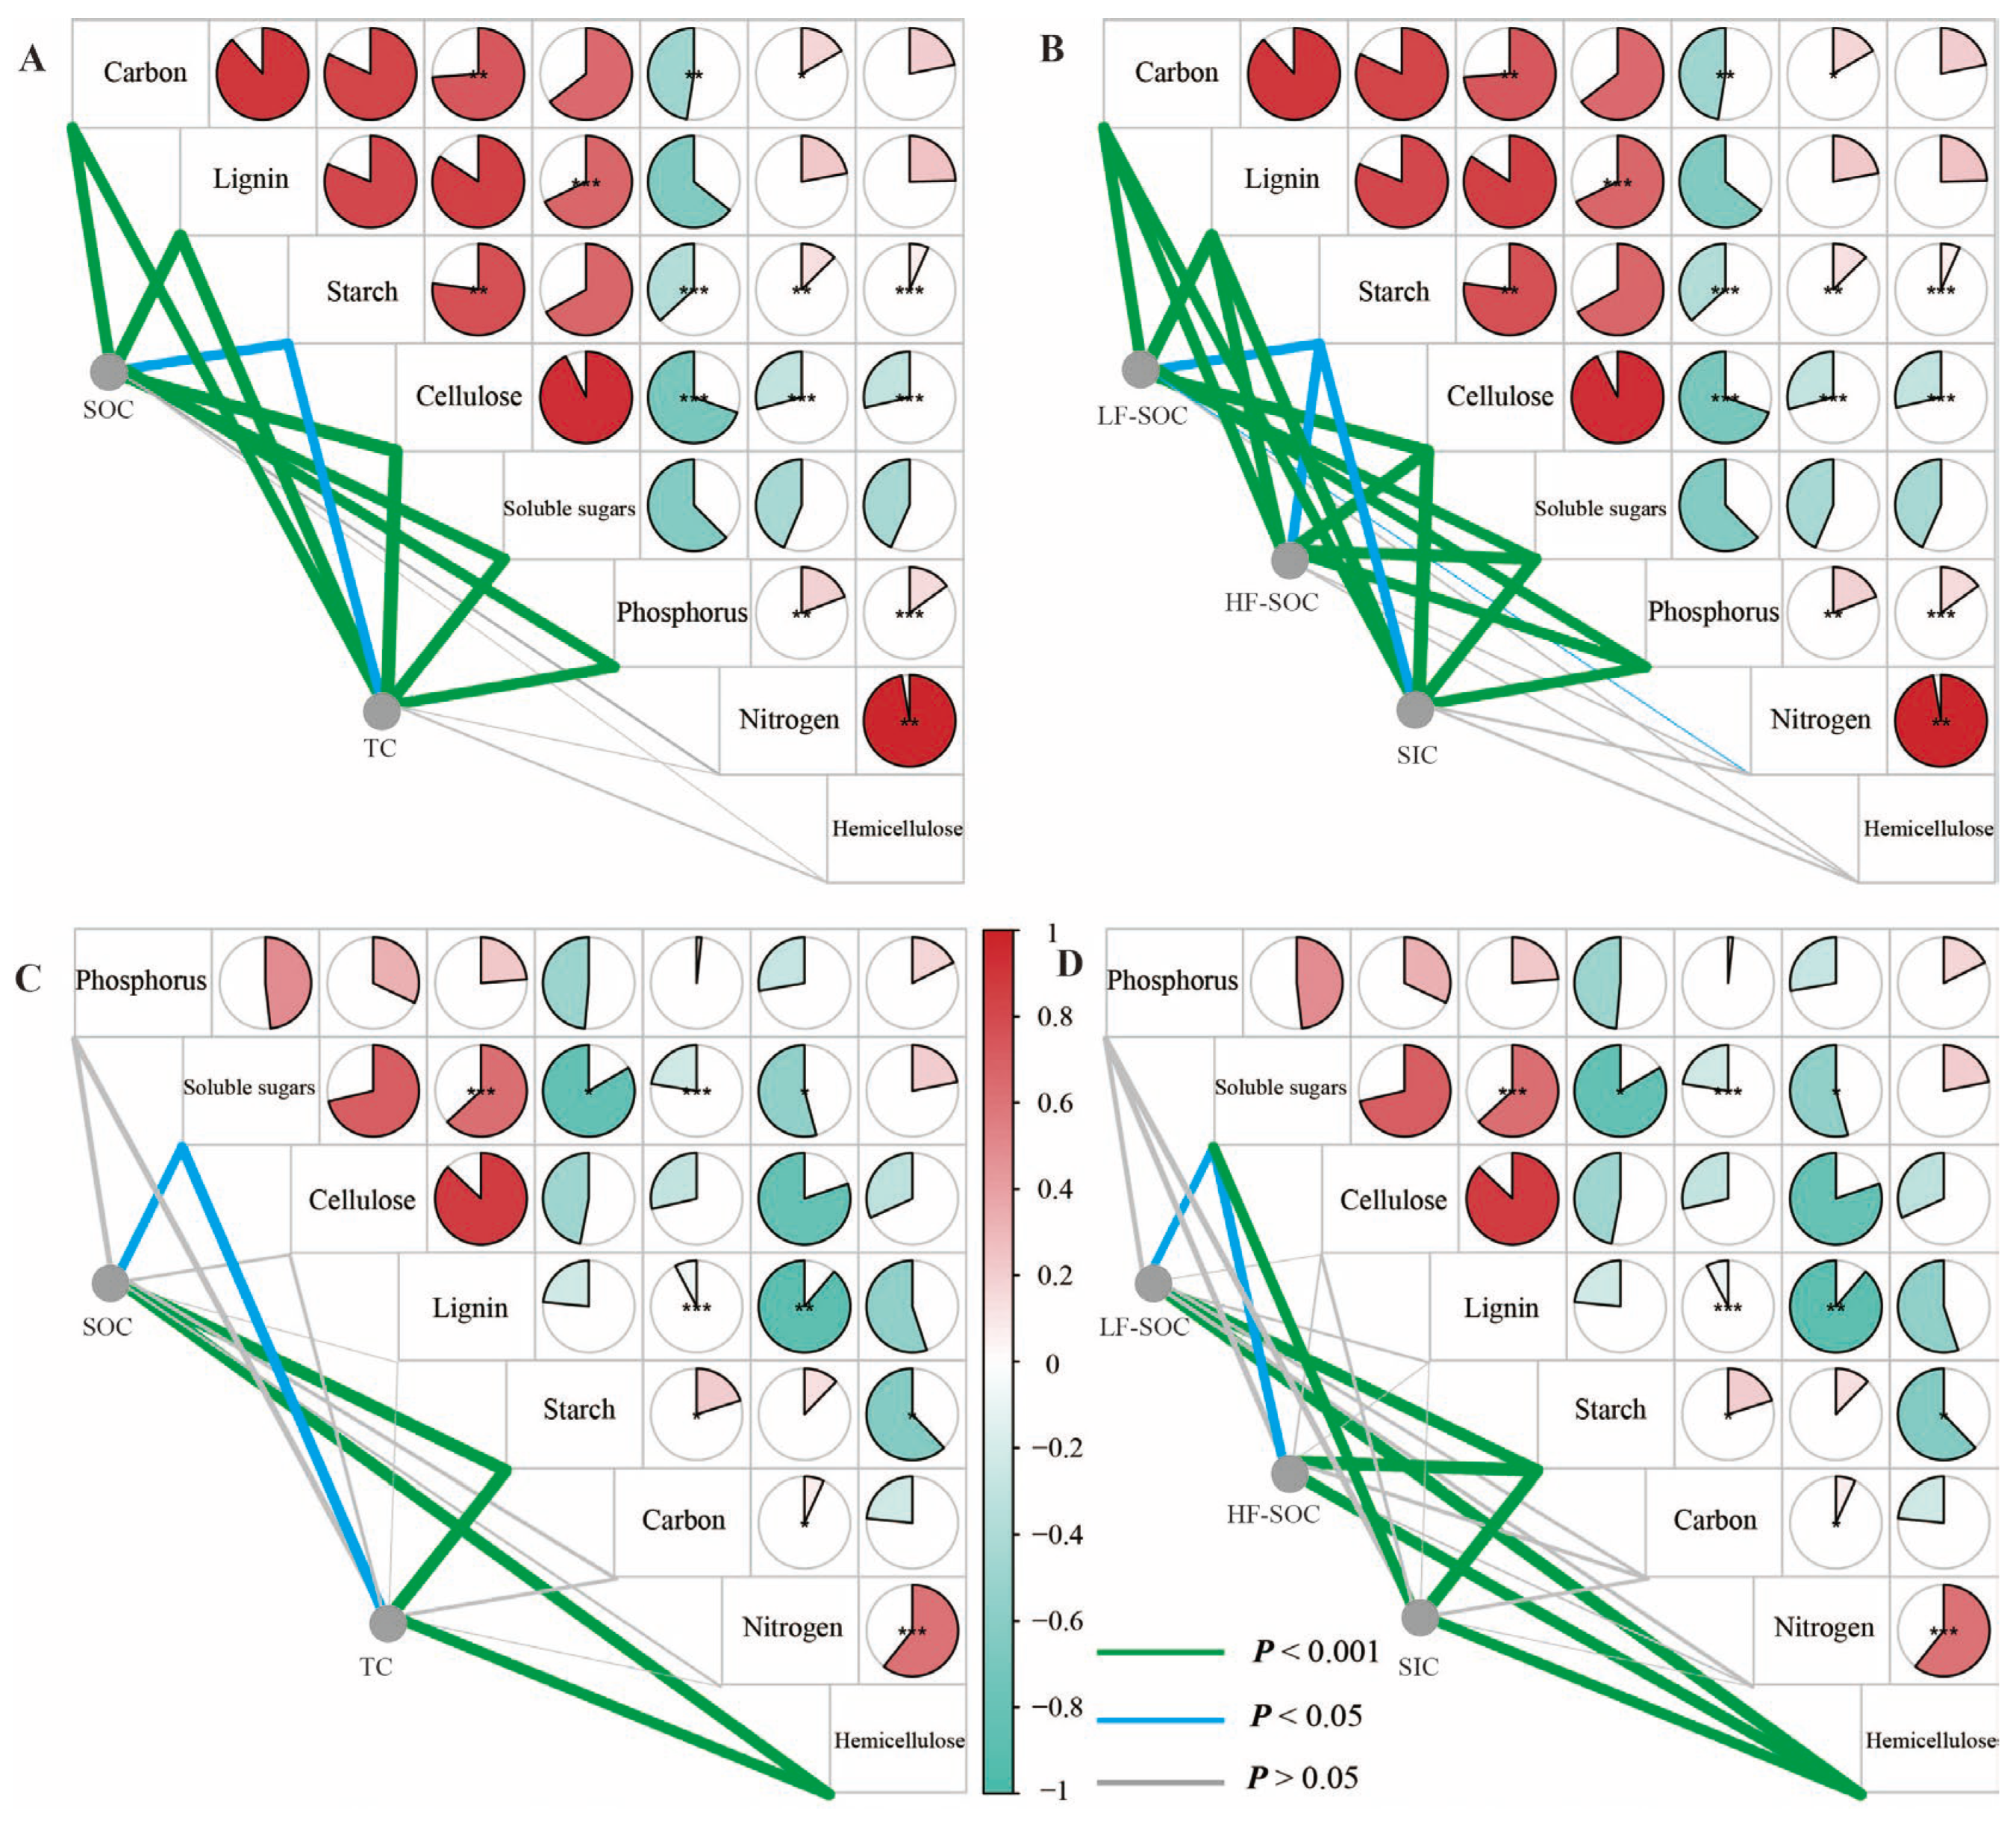
Litterfall and fine root tissues, except fine root C content and litterfall starch content, also showed significant differences among the three shrublands (p < 0.05; Figure 6). A. desertorum litter exhibited the highest levels of C, cellulose, lignin, and soluble sugar content, as well as the highest nitrogen and hemicellulose content. Among fine roots, A. desertorum also had the highest phosphorus and soluble sugar content, whereas C. fruticosum showed the lowest levels of phosphorus, cellulose, lignin, and soluble sugars. TC, SIC, and SOC and its fractions were significantly correlated with litterfall C, phosphorus, lignin, cellulose, soluble sugar, and starch content (p < 0.05; Figure 7A,B). Moreover, significant correlations were observed between these C storages and fine root hemicellulose, soluble sugar, and starch content (p < 0.05; Figure 7C,D).

Figure 6.
Chemical properties (carbon, nitrogen, phosphorus, lignin, hemicellulose, starch, cellulose, and soluble sugar) of litterfall and roots among three shrublands (A. desertorum, S. psammophila, C. fruticosum). Different lowercase letters indicate significant differences.
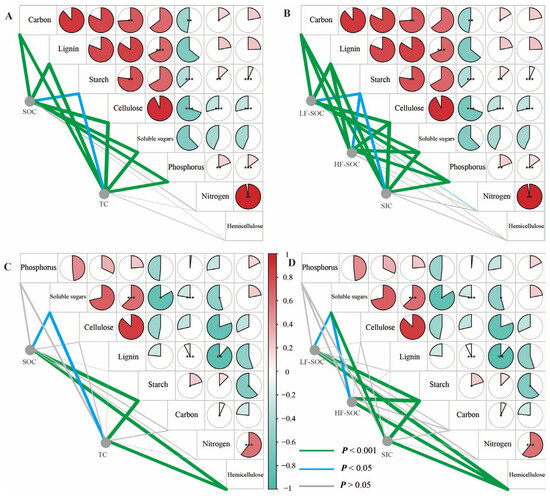
Figure 7.
Correlation analysis among soil C fractions ((A,C): TC and SOC; (B,D): SIC, HF-SOC, and LF-SOC) and chemical properties (carbon, nitrogen, phosphorus, lignin, hemicellulose, starch, cellulose, and soluble sugar) of litterfall (A,B) and roots (C,D). Significance levels: * p < 0.05, ** p < 0.01, *** p < 0.001.
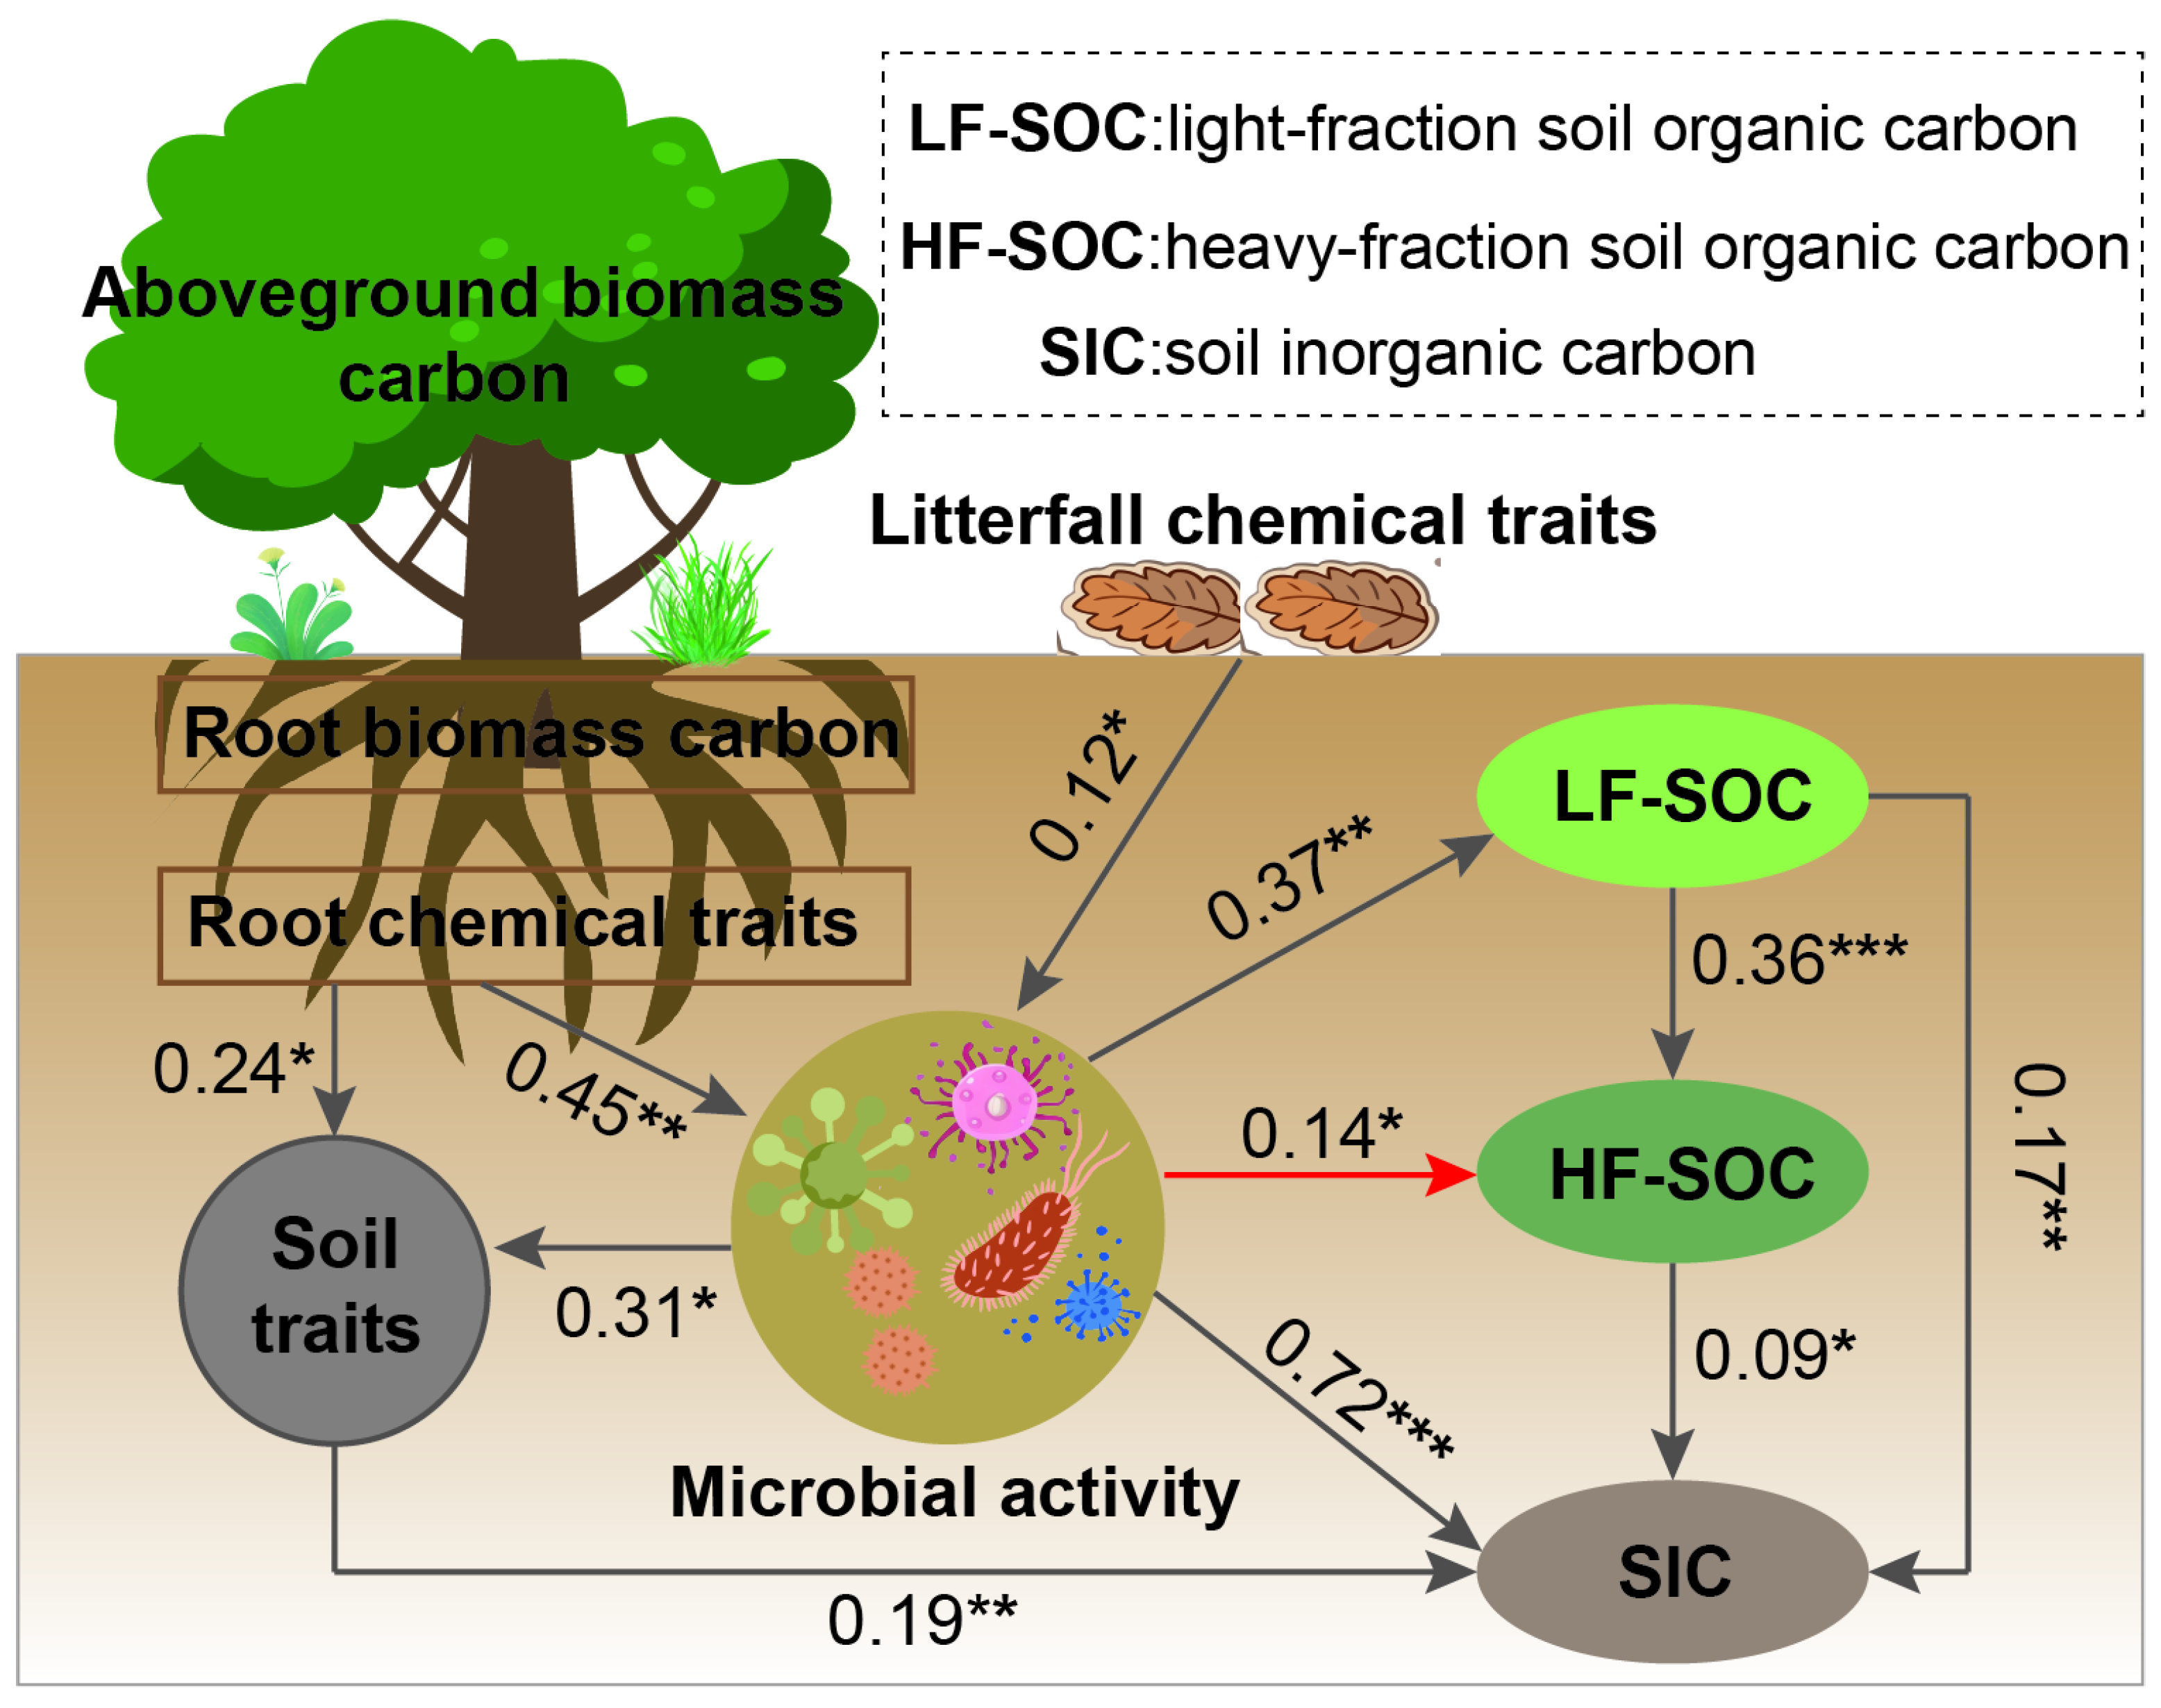
SEM analysis further revealed that biomass carbon was not a reliable predictor of soil carbon storage (Figure 8). Instead, the chemical properties of roots and litterfall directly influenced microbial activity, which, in turn, regulated soil physicochemical properties and soil carbon sequestration. Our analysis indicates that both LF-SOC and HF-SOC affected SIC through microbial mediation. Notably, increased microbial activity was associated with a reduction in the heavy fraction of organic carbon.
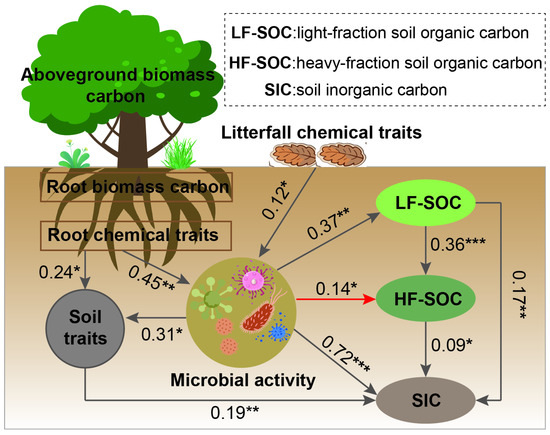
Figure 8.
Structural equation modeling (SEM) describing the biomass carbon storage, soil, and microbial factors in affecting the soil carbon and its fractions. Multiple-layer rectangles represent the first component from the principal component analysis (PCA) conducted for the chemical traits (carbon, nitrogen, phosphorus, lignin, hemicellulose, starch, cellulose, and soluble sugar) of plant tissues and soil properties. Gray and red arrows represent positive and negative correlations, respectively. Significance levels: * p < 0.05, ** p < 0.01, *** p < 0.001. The goodness-of-fit statistics of model: χ2/df = 1.276; p = 0.293; RMSEA = 0.001; GFI = 0.994; CFI = 0.995; NFI = 0.996; TLI = 0.963; SRMR = 0.22.
4. Discussion
4.1. Biomass and Soil C Storage in Revegetated Shrublands
Aboveground living biomass C exceeded belowground C storage in all three shrublands except C. fruticosum (shoot-to-root ratio = 0.32); in the other shrublands, the shoot-to-root ratio was approximately 1.44 (Figure 1A). This suggests a trend toward greater aboveground C accumulation, which aligns with the estimated global average shrubland shoot-to-root ratio of 1.13 [13]. C. fruticosum exhibits an extensive root system and primarily relies on vegetative reproduction, forming numerous adventitious rhizome buds [24]. These unique characteristics underscore the importance of species-specific traits to understanding shrubland C allocation dynamics. Aboveground dead biomass C storage was substantially greater than belowground storage across all shrublands, with C. fruticosum having the highest litterfall C storage (Figure 1B,C). Previous studies have highlighted that patterns of biomass C allocation differ significantly across shrub species [25,26,27]; these patterns reflect differences in adaptive strategies related to resource acquisition and environmental stress tolerance in arid environments. In response to fluctuating environmental conditions, plants in arid ecosystems dynamically adjust C allocation patterns, often allocating more C to belowground components under drought stress [28,29]. One key adaptive strategy for dryland plants facing drought is the rapid senescence of aboveground stems and branches under drought conditions [30,31], an observation that is consistent with our findings of increased litterfall. This plasticity in C distribution is vital for resource optimization, growth maintenance, and resilience to environmental stressors in dryland ecosystems. Furthermore, some evidence suggests that herbaceous plant invasion in arid shrublands can alter C allocation patterns [32], indicating an important avenue for further research on how C allocation responds to changes in the aboveground vegetation composition as ecological succession progresses.
Our study also revealed additional patterns of C allocation across the three shrublands (Figure 1 and Figure 2). The S. psammophila shrubland had the highest plant C storage but the lowest soil C storage, whereas A. desertorum had the lowest plant C storage yet the highest soil C storage (Figure 1). This contrasting pattern highlights species-specific differences in C storage between plant biomass and soil C storage, likely driven by differential C allocation strategies, tissue turnover rates, and adaptations to dryland environments [33,34]. Variation in turnover rate between plant tissue types—such as stems, leaves, and roots—exerts a strong influence on both standing plant C pools and the input of C into soil [35,36]. Additionally, species differences in the proportional allocation of C to specific plant organs, particularly roots, can significantly affect both C distribution and the stability of C storage.
Revegetation significantly increased both biomass C storage (ranging from 761.61 to 3689.29 g m−2) and soil C storage (ranging from 464.17 to 1955.24 g m−2) (Figure 1, Figure 2 and Figure 3), highlighting the effectiveness of xerophytic shrub revegetation for C sequestration and soil quality enhancement. These findings are consistent with those of previous studies [3,37] that emphasize the dual benefits of revegetation in combating desertification while improving ecosystem resilience. However, large-scale sampling studies have shown that afforestation in drylands does not necessarily increase SOC density across all soil profiles; rather, it can lead to a decrease in SOC density in deeper, typically C-rich, soil layers [38]. In this study, SOC storage across the three shrublands ranged from 1.08 g m−2 to 2.57 g m−2, which is significantly lower than the reported average of 8.36 g m−2 for shrublands in China [39] and 8.90 g m−2 globally [40]. This discrepancy highlights regional variation in soil C storage and the need for localized assessments to better understand soil C dynamics in different shrub ecosystems. Another possible explanation for these lower values is that the shrublands in our study were artificially planted rather than naturally regenerated. Therefore, shrub plantation soil has the potential to sequester additional atmospheric C, positioning these systems as significant net C sinks for anthropogenic CO2 emissions [37].
Interestingly, we did not observe depth-dependent patterns in the distribution of soil C fractions, except for LF-SOC (Figure 3). This contrasts with previous findings in dry grasslands and other shrubland ecosystems, which have reported more pronounced vertical gradients in soil C distribution [41,42]. In our study, surface SOC accounted for 47.06–50.54% of total SOC stocks within the top 1 m of soil (Figure 3c,d), consistent with values reported for other Chinese shrublands [39]. This may be attributed to the proximity of surface soil to plant litter, with our observations of a higher concentration of root litter in the upper soil layers further supporting this interpretation (Figure 2). Furthermore, long-term revegetation also led to a significant increase in SIC (Figure 3b). Several studies have suggested that the introduction of xerophytic shrubs could enhance SIC sequestration [43,44]. The increase in SIC is particularly important, as inorganic carbon contributes to the overall stability and resilience of soil C stocks in dryland ecosystems. However, some studies have shown that the short-term conversion of shifting sand lands to shrublands either reduces or does not alter SIC storage significantly [17,45]. This may be due to the rapid input of plant-derived C after afforestation, which activates microbial communities and accelerates the decomposition of stable soil C (i.e., soil priming) [37,46]. Clearly, the accumulation and variation of LF-SOC, HF-SOC, and SIC during long-term revegetation highlight a dynamic interplay among soil C fractions. Understanding these interactions is crucial for elucidating the mechanisms governing C sequestration in drylands. This work emphasizes the need for further research to explore the long-term impacts of vegetation restoration on soil C stability and soil quality. In addition, it should be noted that the potassium dichromate oxidation method, although widely employed, tends to underestimate recalcitrant organic carbon while overestimating labile carbon fractions, potentially introducing systematic biases in soil carbon quantification.
4.2. Factors Influencing Soil C in Revegetated Shrublands
Vegetation restoration significantly reduces soil wind erosion, which, in turn, promotes greater accumulation of carbon in the soil compared to bare land [7]. Our findings aligned with this concept, showing that soil carbon storage in shrub plantations was substantially greater than in bare land (Figure 3). However, we observed that total biomass C storage was a weak predictor of total soil C density (Figure 1 and Figure 3). Specifically, high aboveground and belowground biomass C did not correspond to increased soil C, regardless of the size of C fractions. This finding is supported by previous reports indicating that biomass C storage is not correlated to SOC storage at any soil depth in shrublands [47,48]. This suggested that factors other than biomass, such as soil properties and microbial activity, may play a more significant role in determining soil carbon levels. Our analysis revealed that root distribution was more strongly correlated with soil C storage, particularly LF-SOC content (Figure 2 and Figure 3). This supports Ge et al.’s [49] assertion that root biomass C storage is likely more influential in SOC accumulation than carbon stored in aboveground parts. Additionally, other studies have emphasized that organic C accumulation is predominantly influenced by fine root dynamics [20]. Fine roots, characterized by high turnover rates, play a crucial role in carbon cycling by directly interacting with soil minerals, microbes, and aggregates. These interactions promote the formation of stable organic carbon. Our findings underscore the pivotal role of belowground plant structures, particularly fine roots, in regulating SOC sequestration. The plant–microbe–soil interactions emerging from these dynamics are crucial for enhancing SOC storage in revegetated shrublands.
At broader spatial scales, climatic factors such as precipitation and temperature are key drivers of both SOC and SIC storage in desert shrublands [50,51]. These climatic variables strongly influence the biological and physical processes that govern the accumulation and turnover of soil C [52]. Specifically, LF-SOC storage is primarily regulated by climatic factors, while HF-SOC storage and SIC are more strongly influenced by soil physicochemical properties [41,53]. Recent studies have further demonstrated that soil nitrogen, soil moisture, and pH are the critical drivers of soil C accumulation in shrublands [17,43,50]. In this study, correlation analysis revealed that MBC, MBN, AN, APh, and pH were significant contributors to the variation in different soil carbon fractions, with MBC and MBN emerging as the most important determinants (Figure 5). This suggests that microbial activity is the primary factor explaining variation in labile and recalcitrant soil C across the three shrublands. Microbial communities and their activity are widely recognized as key regulators of soil carbon dynamics and stability [54,55]. A recent metagenomic study in the Mu Us Desert also confirmed that microbial communities involved in C cycling vary among different revegetated shrublands [21]. These microbial communities regulate the decomposition of litter and organic carbon, as well as carbon mineralization, ultimately influencing soil carbon dynamics. Our observations provide further confirmation that plant litter traits of the three shrub species differed significantly (Figure 6). Aboveground litter C content, along with levels of cellulose, soluble sugars, hemicellulose, starch, and soluble sugars in fine roots, were significantly correlated with both SOC and SIC densities (Figure 7 and Figure 8). After revegetation, plant litter—the primary source of new C inputs—substantially influenced microbial communities and their composition [37]. These findings suggest that the form of plant C inputs can regulate soil microbial activity, which in turn impacts soil C storage following vegetation restoration [15]. Although existing studies have explored the impact of microbial activity on soil carbon following vegetation restoration in drylands, few long-term monitoring experiments have examined how different types of plant-derived carbon regulate microbial dynamics and soil carbon processes over time. Our study highlighted the need for further research to better understand the long-term interactions between plant C inputs, microbial activity, and soil carbon dynamics, particularly in dryland ecosystems undergoing revegetation.
While our study emphasized the roles of root biomass and microbial activity in regulating soil carbon storage, other factors also exert important influence on soil carbon stabilization and turnover. For instance, establishing shrub vegetation on sandy soils alters the soil microenvironment and increases ecosystem faunal diversity, both of which can further modify soil carbon dynamics [56]. Future research should integrate detailed assessments of soil invertebrates (especially insects) to provide a more balanced and comprehensive understanding of the mechanisms governing carbon sequestration in revegetated dryland ecosystems. In addition, a limitation of this study arises from the space–time substitution method; future studies should prioritize long-term monitoring to rigorously validate soil carbon dynamics.
5. Conclusions
This study provides valuable insights into the ecosystem biomass carbon allocation and soil carbon fraction storage in three revegetated shrublands. Aboveground carbon storage varied significantly between species, with S. psammophila exhibiting the highest values. C. fruticosum demonstrated greater dead carbon storage than S. psammophila and A. desertorum. Root C storage also differed significantly, with substantial contributions from fine and dead roots, and a marked decrease in carbon storage with increasing soil depth. Biomass carbon storage was highest in S. psammophila, followed by A. desertorum and then C. fruticosum. A. desertorum exhibited the highest soil carbon accumulation, followed by C. fruticosum and S. psammophila. The pronounced distribution of soil carbon fractions in A. desertorum further emphasized its potential for soil carbon sequestration. After revegetation, plant-derived carbon inputs substantially enhanced soil carbon sequestration. Notably, although some soil physicochemical properties were significantly correlated with soil carbon and its fractions, microbial biomass carbon and nitrogen were the key regulators of labile and recalcitrant soil carbon fractions. This suggested that microbial activity played a pivotal role in regulating soil carbon stabilization and turnover. These findings underscore the importance of species selection for revegetation, as it influences not only aboveground biomass but also microbial processes, which are crucial for optimizing carbon sequestration and mitigating climate change in dryland ecosystems.
Author Contributions
Z.L. (Zongrui Lai) and A.J.: methodology, data curation, investigation, funding acquisition, writing—original draft, writing—review and editing; W.F. and W.S.: methodology, investigation, visualization; T.L.: methodology, data curation, writing—review and editing; Z.L. (Zhonghua Liu): writing—review and editing, funding acquisition. All authors have read and agreed to the published version of the manuscript.
Funding
This research was funded by Fundamental Research Funds for the Central Universities (No. BLX2015-18), the National Natural Science Foundation of China (No. 31800611, 32201629, and 32101367), the Yuyang District Forestry Bureau Project of Yulin City in Shaanxi Province of China (No. 2024HXFW059).
Data Availability Statement
Data are contained within the article.
Acknowledgments
We would like to thank Miss Jiayi Yan for her cooperation and assistance in the experimental design and field sampling, as well as the staff of Beijing Academy of Agriculture and Forestry Science for their support in laboratory work. We also thank Unruh Micah Leigh at the University of Kansas for his assistance with the English language and grammatical editing of the manuscript.
Conflicts of Interest
Author Aliang Jin was employed by the company Department of Natural Resources and Environment, Guangdong Hydropower Planning & Design Institute Co., Ltd. The authors declare that the research was conducted in the absence of any commercial or financial relationships that could be construed as a potential conflict of interest.
References
- Lal, R. Carbon cycling in global drylands. Curr. Clim. Change Rep. 2019, 5, 221–232. [Google Scholar] [CrossRef]
- Lee, H.; Calvin, K.; Dasgupta, D.; Krinner, G.; Mukherji, A.; Thorne, P.; Trisos, C.; Romero, J.; Aldunce, P.; Barret, K.; et al. IPCC, 2023: Climate Change 2023: Synthesis Report, Summary for Policymakers. Contribution of Working Groups I, II and III to the Sixth Assessment Report of the Intergovernmental Panel on Climate Change; Lee, H., Romero, J., Eds.; Core Writing Team, IPCC: Geneva, Switzerland, 2023. [Google Scholar]
- Liang, S.; Liang, L.; Wang, D.; Zeng, Z. Dryland forestation: Uncovering the carbon sequestration potential. Innov. Geosci. 2024, 2, 100058. [Google Scholar] [CrossRef]
- Ren, Z.; Li, C.; Fu, B.; Wang, S.; Stringer, L.C. Effects of aridification on soil total carbon pools in China’s drylands. Glob. Change Biol. 2023, 30, e17091. [Google Scholar] [CrossRef]
- Vojdani, A.; Baur, L.E.; Rudgers, J.A.; Collins, S.L. Sensitivity of root production to long-term aridity under environmental perturbations in Chihuahuan Desert ecosystems. J. Ecol. 2024, 112, 1487–1500. [Google Scholar] [CrossRef]
- Rohatyn, S.; Yakir, D.; Rotenberg, E.; Carmel, Y. Limited climate change mitigation potential through forestation of the vast dryland regions. Science 2022, 377, 1436–1439. [Google Scholar] [CrossRef]
- Song, J.; Wan, S.; Zhang, K.; Hong, S.; Xia, J.; Piao, S.; Wang, Y.-P.; Chen, J.; Hui, D.; Luo, Y.; et al. Ecological restoration enhances dryland carbon stock by reducing surface soil carbon loss due to wind erosion. Proc. Natl. Acad. Sci. USA 2024, 121, e2416281121. [Google Scholar] [CrossRef]
- Yao, L.; Liu, T.; Qin, J.; Jiang, H.; Yang, L.; Smith, P.; Chen, X.; Zhou, C.; Piao, S. Carbon sequestration potential of tree planting in China. Nat. Commun. 2024, 15, 8398. [Google Scholar] [CrossRef]
- Hartmann, H.; Bahn, M.; Carbone, M.; Richardson, A.D. Plant carbon allocation in a changing world–challenges and progress: Introduction to a Virtual Issue on carbon allocation. New Phytol. 2020, 227, 981–988. [Google Scholar] [CrossRef] [PubMed]
- Rog, I.; Hilman, B.; Fox, H.; Yalin, D.; Qubaja, R.; Klein, T. Increased belowground tree carbon allocation in a mature mixed forest in a dry versus a wet year. Glob. Change Biol. 2024, 30, e17172. [Google Scholar] [CrossRef]
- Freschet, G.T.; Roumet, C.; Comas, L.H.; Weemstra, M.; Bengough, A.G.; Rewald, B.; Bardgett, R.D.; De Deyn, G.B.; Johnson, D.; Klimešová, J.; et al. Root traits as drivers of plant and ecosystem functioning: Current understanding, pitfalls and future research needs. New Phytol. 2021, 232, 1123–1158. [Google Scholar] [CrossRef]
- Gessler, A.; Zweifel, R. Beyond source and sink control–toward an integrated approach to understand the carbon balance in plants. New Phytol. 2024, 242, 858–869. [Google Scholar] [CrossRef]
- Ma, H.; Mo, L.; Crowther, T.W.; Maynard, D.S.; Hoogen, J.V.D.; Stocker, B.D.; Terrer, C.; Zohner, C.M. The global distribution and environmental drivers of aboveground versus belowground plant biomass. Nat. Ecol. Evol. 2021, 5, 1110–1122. [Google Scholar] [CrossRef]
- Plaza, C.; Zaccone, C.; Sawicka, K.; Méndez, A.M.; Tarquis, A.; Gascó, G.; Heuvelink, G.B.M.; Schuur, E.A.G.; Maestre, F.T. Soil resources and element stocks in drylands to face global issues. Sci. Rep. 2018, 8, 13788. [Google Scholar] [CrossRef] [PubMed]
- Feng, J.; He, K.; Zhang, Q.; Han, M.; Zhu, B. Changes in plant inputs alter soil carbon and microbial communities in forest ecosystems. Glob. Change Biol. 2022, 28, 3426–3440. [Google Scholar] [CrossRef]
- Ridgeway, J.R.; Morrissey, E.M.; Brzostek, E.R. Plant litter traits control microbial decomposition and drive soil carbon stabilization. Soil Biol. Biochem. 2022, 175, 108857. [Google Scholar] [CrossRef]
- Bai, L.; Zhang, H.; Zhang, J.; Li, X.; Wang, B.; Miao, H.; Sial, T.A.; Dong, Q.; Fu, G.; Li, L. Long-term vegetation restoration increases carbon sequestration of different soil particles in a semi-arid desert. Ecosphere 2021, 12, e03848. [Google Scholar] [CrossRef]
- Wu, M.-H.; Chen, S.-Y.; Chen, J.-W.; Xue, K.; Chen, S.-L.; Wang, X.-M.; Chen, T.; Kang, S.-C.; Rui, J.-P.; Thies, J.E.; et al. Reduced microbial stability in the active layer is associated with carbon loss under alpine permafrost degradation. Proc. Natl. Acad. Sci. USA 2021, 118, e2025321118. [Google Scholar] [CrossRef] [PubMed]
- Ramírez, P.B.; Fuentes-Alburquenque, S.; Díez, B.; Vargas, I.; Bonilla, C.A. Soil microbial community responses to labile organic carbon fractions in relation to soil type and land use along a climate gradient. Soil Biol. Biochem. 2020, 141, 107692. [Google Scholar] [CrossRef]
- Lai, Z.R.; Zhang, Y.Q.; Liu, J.B.; Wu, B.; Qin, S.G.; Fa, K.Y. Fine-root distribution, production, decomposition, and effect on soil organic carbon of three revegetation shrub species in northwest China. For. Ecol. Manag. 2016, 359, 381–388. [Google Scholar] [CrossRef]
- Sun, Y.; Liu, Z.; Zhang, Y.; Lai, Z.; She, W.; Bai, Y.; Feng, W.; Qin, S. Microbial communities and their genetic repertoire mediate the decomposition of soil organic carbon pools in revegetation shrublands in a desert in northern China. Eur. J. Soil Sci. 2020, 71, 93–105. [Google Scholar] [CrossRef]
- Guillemot, J.; Kunz, M.; Schnabel, F.; Fichtner, A.; Madsen, C.P.; Gebauer, T.; Härdtle, W.; von Oheimb, G.; Potvin, C. Neighbourhood-mediated shifts in tree biomass allocation drive overyielding in tropical species mixtures. New Phytol. 2020, 228, 1256–1268. [Google Scholar] [CrossRef] [PubMed]
- Hu, Q.; Thomas, B.W.; Powlson, D.; Hu, Y.; Zhang, Y.; Jun, X.; Shi, X.; Zhang, Y. Soil organic carbon fractions in response to soil, environmental and agronomic factors under cover cropping systems: A global meta-analysis. Agric. Ecosyst. Environ. 2023, 355, 108591. [Google Scholar] [CrossRef]
- Huang, L.; Gao, Y.; Wang, D.; Cui, X.; Zhang, H.; Yuan, J.; Gao, M. Natural grassland restoration exhibits enhanced carbon sequestration and soil improvement potential in northern sandy grasslands of China: An empirical study. Catena 2024, 246, 108396. [Google Scholar] [CrossRef]
- Chai, Y.; Zhong, J.; Zhao, J.; Guo, J.; Yue, M.; Guo, Y.; Wang, M.; Wan, P. Environment and plant traits explain shrub biomass allocation and species composition across ecoregions in North China. J. Veg. Sci. 2021, 32, e13080. [Google Scholar] [CrossRef]
- Garcia-Franco, N.; Wiesmeier, M.; Goberna, M.; Martínez-Mena, M.; Albaladejo, J. Carbon dynamics after afforestation of semiarid shrublands: Implications of site preparation techniques. For. Ecol. Manag. 2014, 319, 107–115. [Google Scholar] [CrossRef]
- Li, Q.; Jia, Z.; Feng, L.; He, L.; Yang, K. Dynamics of biomass and carbon sequestration across a chronosequence of Caragana intermedia plantations on alpine sandy land. Sci. Rep. 2018, 8, 12432. [Google Scholar] [CrossRef]
- Asefa, M.; Worthy, S.J.; Cao, M.; Song, X.; Lozano, Y.M.; Yang, J. Above-and below-ground plant traits are not consistent in response to drought and competition treatments. Ann. Bot. 2022, 130, 939–950. [Google Scholar] [CrossRef]
- Franco, A.L.C.; Gherardi, L.A.; de Tomasel, C.M.; Andriuzzi, W.S.; Ankrom, K.E.; Bach, E.M.; Guan, P.; Sala, O.E.; Wall, D.H. Root herbivory controls the effects of water availability on the partitioning between above-and below-ground grass biomass. Funct. Ecol. 2020, 34, 2403–2410. [Google Scholar] [CrossRef]
- Rytter, R.M. The effect of limited availability of N or water on C allocation to fine roots and annual fine root turnover in Alnus incana and Salix viminalis. Tree Physiol. 2013, 33, 924–939. [Google Scholar] [CrossRef]
- Roach, D.A.; Smith, E.F. Life-history trade-offs and senescence in plants. Funct. Ecol. 2020, 34, 17–25. [Google Scholar] [CrossRef]
- Mahood, A.L.; Jones, R.O.; Board, D.I.; Balch, J.K.; Chambers, J.C. Interannual climate variability mediates changes in carbon and nitrogen pools caused by annual grass invasion in a semiarid shrubland. Glob. Change Biol. 2022, 28, 267–284. [Google Scholar] [CrossRef]
- Wang, L.; Jiao, W.; MacBean, N.; Rulli, M.C.; Manzoni, S.; Vico, G.; D’odorico, P. Dryland productivity under a changing climate. Nat. Clim. Change 2022, 12, 981–994. [Google Scholar] [CrossRef]
- Li, Y.; Zhang, X.; Wang, B.; Wu, X.; Wang, Z.; Liu, L.; Yang, H. Revegetation promotes soil mineral-associated organic carbon sequestration and soil carbon stability in the Tengger Desert, northern China. Soil Biol. Biochem. 2023, 185, 109155. [Google Scholar] [CrossRef]
- Maschler, J.; Bialic-Murphy, L.; Wan, J.; Andresen, L.C.; Zohner, C.M.; Reich, P.B.; Lüscher, A.; Schneider, M.K.; Müller, C.; Moser, G.; et al. Links across ecological scales: Plant biomass responses to elevated CO2. Glob. Change Biol. 2022, 28, 6115–6134. [Google Scholar] [CrossRef]
- Carmona, C.P.; Bueno, C.G.; Toussaint, A.; Träger, S.; Díaz, S.; Moora, M.; Munson, A.D.; Pärtel, M.; Zobel, M.; Tamme, R. Fine-root traits in the global spectrum of plant form and function. Nature 2021, 597, 683–687. [Google Scholar] [CrossRef] [PubMed]
- Li, X.; Li, Y.; Xie, T.; Chang, Z.; Li, X. Recovery of soil carbon and nitrogen stocks following afforestation with xerophytic shrubs in the Tengger Desert, North China. Catena 2022, 214, 106277. [Google Scholar] [CrossRef]
- Hong, S.; Yin, G.; Piao, S.; Dybzinski, R.; Cong, N.; Li, X.; Wang, K.; Peñuelas, J.; Zeng, H.; Chen, A. Divergent responses of soil organic carbon to afforestation. Nat. Sustain. 2020, 3, 694–700. [Google Scholar] [CrossRef]
- Ge, J.; Xu, W.; Liu, Q.; Tang, Z.; Xie, Z. Patterns and environmental controls of soil organic carbon density in Chinese shrublands. Geoderma 2020, 363, 114161. [Google Scholar] [CrossRef]
- Jobbágy, E.G.; Jackson, R.B. The vertical distribution of soil organic carbon and its relation to climate and vegetation. Ecol. Appl. 2000, 10, 423–436. [Google Scholar] [CrossRef]
- Dong, L.; Sun, Y.; Ran, J.; Hu, W.; Ji, M.; Du, Q.; Xiong, J.; Gong, H.; Yao, S.; Akram, M.A.; et al. Ecosystem organic carbon storage and their drivers across the drylands of China. Catena 2022, 214, 106280. [Google Scholar] [CrossRef]
- Wang, Z.; Huang, L.; Shao, M. Spatial variations and influencing factors of soil organic carbon under different land use types in the alpine region of Qinghai-Tibet Plateau. Catena 2023, 220, 106706. [Google Scholar] [CrossRef]
- Li, J.; Awasthi, M.K.; Zhu, Q.; Chen, X.; Wu, F.; Wu, F.; Tong, X. Modified soil physicochemical properties promoted sequestration of organic and inorganic carbon synergistically during revegetation in desertified land. J. Environ. Chem. Eng. 2021, 9, 106331. [Google Scholar] [CrossRef]
- Liu, J.; Zhang, P.; Gao, Y. Effects of vegetation rehabilitation on soil inorganic carbon in deserts: A meta-analysis. Catena 2023, 231, 107290. [Google Scholar] [CrossRef]
- Zhang, K.; Su, Y.; Wang, T.; Liu, T. Soil properties and herbaceous characteristics in an age sequence of Haloxylon ammodendron plantations in an oasis-desert ecotone of northwestern China. J. Arid Land 2016, 8, 960–972. [Google Scholar] [CrossRef]
- Tao, X.; Yang, Z.; Feng, J.; Jian, S.; Yang, Y.; Bates, C.T.; Wang, G.; Guo, X.; Ning, D.; Kempher, M.L.; et al. Experimental warming accelerates positive soil priming in a temperate grassland ecosystem. Nat. Commun. 2024, 15, 1178. [Google Scholar] [CrossRef] [PubMed]
- Deng, L.; Kim, D.G.; Peng, C.; Shangguan, Z. Controls of soil and aggregate-associated organic carbon variations following natural vegetation restoration on the Loess Plateau in China. Land Degrad. Dev. 2018, 29, 3974–3984. [Google Scholar] [CrossRef]
- Wade, A.M.; Richter, D.D.; Medjibe, V.P.; Bacon, A.R.; Heine, P.R.; White, L.J.; Poulsen, J.R. Estimates and determinants of stocks of deep soil carbon in Gabon, Central Africa. Geoderma 2019, 341, 236–248. [Google Scholar] [CrossRef]
- Ge, J.; Xu, W.; Xiong, G.; Zhao, C.; Li, J.; Liu, Q.; Tang, Z.; Xie, Z. Depth-dependent controls over soil organic carbon stock across Chinese shrublands. Ecosystems 2023, 26, 277–289. [Google Scholar] [CrossRef]
- Liu, H.; Sun, Z.; Dong, Y.; Yang, H.; He, P.; Yu, B.; Ye, H.; Li, S.; Zhou, L. Precipitation drives the accumulation of soil organic carbon in the sandy desert of the Junggar Basin, Northwest China. Ecol. Indic. 2022, 142, 109224. [Google Scholar] [CrossRef]
- Smith, K.R.; Waring, B.G. Broad-scale patterns of soil carbon (C) pools and fluxes across semiarid ecosystems are linked to climate and soil texture. Ecosystems 2019, 22, 742–753. [Google Scholar] [CrossRef]
- Yu, T.; Fu, Y.; Hou, Q.; Xia, X.; Yan, B.; Yang, Z. Soil organic carbon increase in semi-arid regions of China from 1980s to 2010s. Appl. Geochem. 2020, 116, 104575. [Google Scholar] [CrossRef]
- Li, X.; Yang, T.; Hicks, L.C.; Hu, B.; Liu, X.; Wei, D.; Wang, Z.; Bao, W. Latitudinal patterns of light and heavy organic matter fractions in arid and semi-arid soils. Catena 2022, 215, 106293. [Google Scholar] [CrossRef]
- Kong, W.; Wei, X.; Wu, Y.; Shao, M.; Zhang, Q.; Sadowsky, M.J.; Ishii, S.; Reich, P.B.; Wei, G.; Jiao, S.; et al. Afforestation can lower microbial diversity and functionality in deep soil layers in a semiarid region. Glob. Change Biol. 2022, 28, 6086–6101. [Google Scholar] [CrossRef] [PubMed]
- Qin, S.; Zhang, D.; Wei, B.; Yang, Y. Dual roles of microbes in mediating soil carbon dynamics in response to warming. Nat. Commun. 2024, 15, 6439. [Google Scholar] [CrossRef]
- Wu, D.; Du, E.; Eisenhauer, N.; Mathieu, J.; Chu, C. Global engineering effects of soil invertebrates on ecosystem functions. Nature 2025, 1–10. [Google Scholar] [CrossRef]

Disclaimer/Publisher’s Note: The statements, opinions and data contained in all publications are solely those of the individual author(s) and contributor(s) and not of MDPI and/or the editor(s). MDPI and/or the editor(s) disclaim responsibility for any injury to people or property resulting from any ideas, methods, instructions or products referred to in the content. |
© 2025 by the authors. Licensee MDPI, Basel, Switzerland. This article is an open access article distributed under the terms and conditions of the Creative Commons Attribution (CC BY) license (https://creativecommons.org/licenses/by/4.0/).