Abstract
Accurate forest monitoring and resource assessment are crucial for sustainable forest management, with tree diameter at breast height (DBH) serving as a key metric for tree growth assessment and carbon storage estimation. In this study, we developed a comprehensive mobile-LiDAR-based point cloud processing pipeline to segment individual trees and estimate the DBH of trees. We first conducted terrain extraction using a resolution-passing method combined with a cloth simulation filter. Then, by leveraging the vertical structural characteristics of trees and changes in point cloud density, we achieved high-performance tree trunk segmentation. On this basis, we deployed the Randomized Hough Transform algorithm to estimate the DBH of the trees. Finally, a large-scale experiment was conducted in a forest (Olympic Forest Park, Beijing, China) and we provided experimental results comparing our trunk segmentation and DBH estimation to ground-truth measurements recorded manually. Eventually, our results showed that 97.4% of the trees were accurately segmented, and the DBH estimation error was reduced to 3.2 cm, which shows that the proposed pipeline is able to achieve high-accuracy trunk segmentation and high-precision DBH estimation. Further, this research demonstrates that integrating MLS with SLAM technology can enhance the efficiency and accuracy of forest surveys, providing a valuable tool for future forest management strategies.
1. Introduction
Forests constitute a vital material resource indispensable for human sustenance. Throughout history, human production and livelihood activities have been inextricably linked with forest ecosystems. As a pivotal element of the Earth’s broader ecological system, forests perform essential ecological services including carbon sequestration, water retention, climate regularization, and the provision of habitats for wildlife [1]. The diameter at breast height (DBH) refers to the diameter of a tree measured at 1.3 m above the ground level. DBH is one of the primary data parameters in forest resource surveys. It is not only the most frequently measured and applied metric but also an important parameter for evaluating the growth status of trees. Additionally, it serves as fundamental data required for calculating carbon storage and developing tree growth models [2,3].
In recent years, satellite remote sensing and image analysis technologies have provided effective alternatives for large-scale forest resource surveys [4,5,6]. However, these technologies face significant limitations [7,8]. Remote sensing techniques are highly sensitive to occlusion and lighting conditions. Dense canopy cover can obstruct the satellite’s ability to capture precise data on tree trunks, while the relatively low resolution of satellite imagery often fails to meet the requirements for high-precision DBH estimation. Similarly, image analysis technologies such as Structure-from-Motion (SfM) [9] are prone to challenges including occlusion, sparse surface textures, poor lighting conditions, and image noise. These factors can lead to feature tracking failures, resulting in SfM reconstruction drift and further compromising the accuracy of forest inventory assessments [10]. On the contrary, light detection and ranging (LiDAR) technology employs laser scanning to precisely measure the surfaces of objects. It requires minimal external illumination and generates three-dimensional point clouds that capture detailed geometric information and reduce the need to consider occlusions as an active optical technology. These point clouds serve as the foundation for accurately estimating tree biometric parameters. LiDAR systems can be mounted on various platforms and are classified into different types based on their deployment platforms [11]: airborne laser scanning (ALS), terrestrial laser scanning (TLS), and mobile laser scanning (MLS). ALS provides a better top-down view to estimate tree height, but it can not offer complete point cloud data of trunks due to the obstruction of the forest canopy layer [12]. It is more suitable for scenarios with particularly complex and dangerous terrain. On the contrary, TLS and MLS provide enough point cloud data of trunks, helping us to precisely estimate the DBH of the tree. And compared with MLS, TLS generates high-quality point clouds with higher density and lower measurement error. Since the scanner remains stationary during data acquisition, TLS ensures the consistency and thoroughness of the scan, reducing gaps or distortions in the data. However, it results in longer processing time [13], and the point cloud data generated by TLS are easy to be effected by occlusion, which makes TLS require multiple scans to generate complete point cloud data of the environment. MLS, on the other hand, by fixing the LiDAR on a moving platform [14], makes it possible to generate sufficient point cloud data over a large-scale forest with less requirement of occlusion. It generates 3D point cloud data via the simultaneous localization and mapping (SLAM) algorithm by integrating raw measurements from LiDAR, IMU, and GNSS to accurately estimate positions and precisely output 3D point cloud maps [15,16]. The MLS is easier and more convenient without requiring a fixed position of measuring and enables us to collect data by moving through the forest, despite having limitations in collecting tree canopy data due to the occlusion of the subcanopy layer [17]. And it generates noisier measurement of distance data of the target, leading to lower quality point clouds. For tree geometry analysis, the consistency and distortion-free nature of each tree’s point cloud are of vital importance. Therefore, the SLAM algorithm must meet the dual requirements of high local accuracy and global consistency.
Before tree segmentation, precise terrain removal is quite important because most studies use it to figure out the accurate tree base which is essential for the analysis of the geometric parameters of trees [18,19], since many key tree parameters such as DBH and height are determined based on the distance between the specific part of the tree and its base. Zhang et al. [20] proposed a method called cloth simulation filter (CSF) to extract terrain points by simulating the effect of gravity on a cloth covering an upside-down point cloud, which has been widely applied in different scenes [21]. Cheng et al. [22] estimate the normal vectors of the point cloud based on principal component analysis, constructs a Kd-tree to calculate the angle between the normal vectors of the nearest neighbor points for classification, and classifies the largest number of points as terrain points. Trochta et al. [18] adopt the idea of resolution transfer to voxelize the original point cloud according to different resolutions. The voxel cubes with the lowest z-value are retrieved from the point clouds with different roughness levels. Finally, the octree search is used in the relatively rough point cloud to search for refined terrain points.
Due to so many features provided by LiDAR, there has been growing attention from academia on individual tree segmentation using 3D point clouds. Trochta et al. [18] presented an application named 3D Forest that clustered the original point cloud into smaller clusters using fixed-distance horizontal slices. Within each cluster, adjacent clusters were connected into a complete tree point cloud by searching based on fixed distances and directions. However, this algorithm assumes minimal overlap between the canopy of adjacent trees, limiting its applicability in complex forest scenes. Wilkes et al. [23] achieved individual tree segmentation by extracting the vertical structural geometric features of tree trunks. Based on vertical structures, regions with cylindrical shapes or vertical extensions were identified as tree trunks. Zhou et al. [24] and Proudman et al. [25] performed individual tree segmentation using Euclidean clustering after removing terrain point clouds, and completed DBH estimation on the segments using the Random Sample Consensus (RANSAC) algorithm. Lindberg et al. [26] proposed a point cloud segmentation method based on random forests, trained using MLS point cloud features. By combining traditional geometric features with machine-learning algorithms, this method achieved high segmentation accuracy in sparse point clouds. The software for automated three-dimensional forest inventories called 3DFin, developed by Diego et al. [27], effectively separated branches and trunks by calculating the verticality of point clouds in the range above the terrain.
Most researchers estimated DBH by fitting the tree trunk point cloud into a cylinder [28,29] or fitting the point cloud slice 1.3 m above classified terrain into a circle [25,30,31]. Common algorithms, including RANSAC fitting [25], Hough transform fitting [18], and least squares fitting [32], which assume that the tree trunk has a specific shape [33], are used to calculate the DBH of the tree. However, the accuracy of MLS point clouds is often compromised by several factors, including the inherent limitations of scanning equipment, the dynamic nature of the mobile platform, and the roughness of tree bark [14,33]. These factors introduce significant noise and variability into the point cloud data, thereby reducing the confidence in DBH estimation when relying solely on trunk samples at the standard height of 1.3 m [34,35]. To mitigate these challenges and enhance the robustness of our DBH estimation, this study deploys a multi-layer sampling approach coupled with robust outlier detection algorithms.
Through this study, we aim to demonstrate that the integration of Mobile Laser Scanning (MLS) with SLAM technology can enhance the efficiency of forest resource surveys while minimizing any sacrifice in precision, thereby providing a scientific basis for future forest management strategies. In this paper, we present a point cloud processing toolchain based on 3D LiDAR, which is able to extract terrain, segment individual trees, and estimate the DBH of each tree. The contributions of this work are as follows.
- A comprehensive mobile data acquisition hardware system;
- An efficient algorithm for tree trunk extraction and segmentation;
- A high-precision process for estimating tree DBH.
The remainder of this paper is organized as follows: Section 2 elaborates on the materials used and the designed hardware system employed in our research; Section 3 depicts module blocks serving for DBH estimation; the experiments and results analysis are presented in Section 4; finally, conclusions are drawn and the practical implications for forest resource surveys are discussed in Section 5.
2. Materials
2.1. Study Area
The experiments were conducted using data collected in the Olympic Forest Park in Beijing, China (Figure 1). The selected area spans approximately 82 m × 53 m and features relatively flat terrain with a gentle slope. A total of 231 trees were inventoried within this area, with the distance between each tree and its nearest neighbor ranging approximately from 2.3 m to 4.5 m. The DBH of these trees was measured using a caliper at a height of 1.3 m along two perpendicular directions. The average DBH was 28.6 cm, with a minimum value of 13.9 cm and a maximum of 45.7 cm.
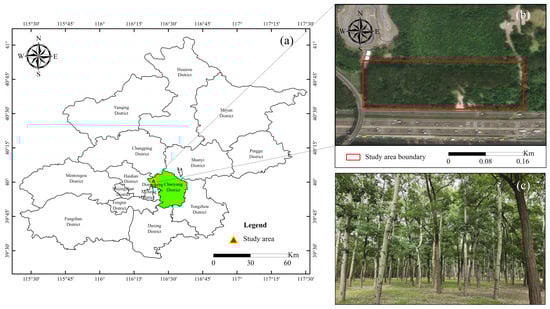
Figure 1.
Illustration of the study area for DBH estimation using MLS: (a) location of study area; (b) satellite view of study area and its boundary. (c) The environment of target trees in the study area.
In addition, a portion of the mentioned study area is characterized by notably higher canopy density compared to the rest of the region. This section, which contains 99 trees, has been delineated as a complex experimental site to emphasize its distinctive high canopy density within the overall research area. This specific area was selected to evaluate the performance of the proposed algorithm for segmentation under conditions of dense canopy coverage. The aim is to rigorously test the algorithm’s effectiveness in scenarios where canopy density is significantly high, thereby providing a stringent assessment of its capabilities.
2.2. Hardware System Design
As depicted in Figure 2, our sensor perception system is composed of a Velodyne VLP-16 laser scanning sensor, a WHEELTEC N200 inertial measurement unit (IMU), and a MECHREVO S700 microcomputer. This integrated system fuses advanced perception data to ensure efficient and precise data acquisition, thereby providing robust support for subsequent data processing.
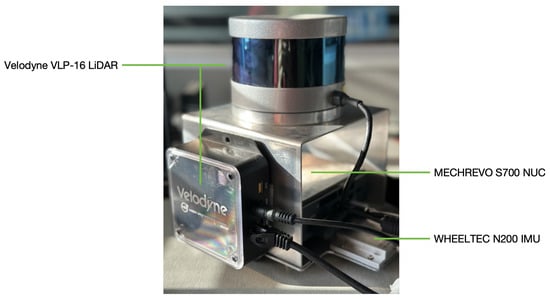
Figure 2.
Core hardware system composition: a Velodyne VLP-16 LiDAR (Ouster Inc. in San Francisco, CA, USA), a WHEELTEC N200 IMU (WHEELTEC Inc. in Dongguan, China), and a MECHREVO S700 microcomputer (MECHREVO Inc. in Beijing, China).
The LiDAR is capable of capturing up to 300,000 points per second, providing dense and detailed geometric information of the target environment. It offers 16-channel scanning capability, with a maximum measurement range of 100 m, a 360° horizontal field of view, and a ±15° vertical field of view. Although it does not provide complete vertical coverage, the 30° vertical angle range within 20 m of the sensor is sufficient to capture the required trunk data. To ensure the accuracy of the measurement data, we retain only the points within a 20 m horizontal distance from the sensor during the current scanning. In parallel to the running LiDAR, the IMU operates at an ultra-high observation frequency of 400 Hz, providing real-time measurements of the system’s triaxial gyroscope and triaxial accelerometer. Additionally, the system incorporates a wireless router, which, although not connected to the Internet, establishes a private local area network around the sensor system. This wireless router functions as a bridge, connecting the sensor system with mobile terminals, thereby facilitating remote control and online monitoring of the system’s operation. The proposed system was implemented in C++, and automation was achieved through organization via a bash script.
This design of the system capitalizes on the functional attributes of each component to ensure the accuracy of the reconstructed map data and the stability of system operation, thereby providing robust technical support for tree segmentation and DBH estimation. Following specialized design, the sensor devices, wireless router, and power supply are integrated into a handheld device in a relatively fixed manner, enhancing the convenience of forest operations.
3. Methods
The proposed framework, as depicted in Figure 3, outlines the operational workflow of the system. The hardware system comprises a LiDAR sensor, an inertial navigation unit, and a microcomputer. The LiDAR and IMU acquire motion information and environmental observations, which are fed as raw data to the SLAM algorithm running on the microcomputer to reconstruct the three-dimensional point cloud map of the forest (Stage I). The vegetation point cloud is then distinguished from the ground points through terrain extraction and undergoes elevation normalization subsequently. Following this, a tree trunk segmentation algorithm is applied to the vegetation point cloud to isolate individual trunk point clouds. Each segmentation result is individually validated to ensure accuracy, yielding optimized trunk segmentation outcomes (Stage II in Figure 3). Finally, point cloud slices at a height of 1.3 m are extracted from each trunk, and circles are fitted using the Randomized Hough Transform (RHT) based on the points in these slices. After outlier filtering, the final DBH estimation results are obtained (Stage III).
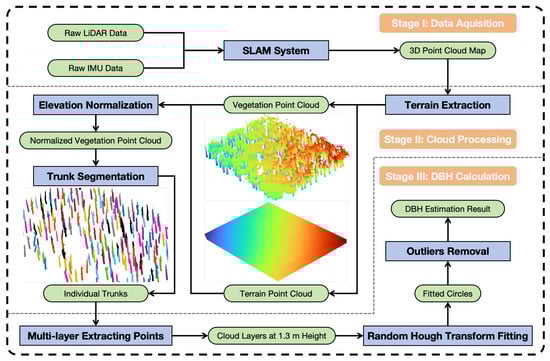
Figure 3.
An overview of pipeline for DBH estimation. Three stages—data acquisition, point cloud process, and DBH computing—are needed here to extract DBH of trees. In this pipeline, the green color denotes the different types of data, while the blue color indicates the data processing steps.
3.1. Data Acquisition
The raw point cloud data were acquired by traversing the forest with the designed handheld mobile LiDAR system. During the scanning process, efforts were made to maintain the LiDAR’s z-axis as perpendicular to the terrain as possible to ensure data quality.
In this study, we utilized an enhanced version of FAST-LIO2 to implement SLAM functionality, thereby accomplishing the task of 3D forest map reconstruction. FAST-LIO2 is a fast, robust, and universal LiDAR-inertial odometry framework [36]. This algorithm employs a tightly coupled framework and integrates IMU and LiDAR observations in real-time using an efficient iterative Kalman filter, allowing for rapid and robust estimation of precise pose transformations, facilitating accurate point cloud matching and high-precision reconstruction of the environment. However, over a long time period of running, the algorithm exhibits cumulative drift of pose estimation, which compromises global consistency [37,38]. In large-scale forest scenes, when the mobile scanning device traverses a path and returns to a previously visited location, the newly generated submap overlaps with the existing submap. If these overlapping areas are not properly aligned, the submap stitching results in noticeable ghosting and deformation, as illustrated in Figure 4a. This erroneous point cloud registration is a manifestation of cumulative error on specific objects. Consequently, when cumulative error persists without correction, the long-term pose transformation estimation results become unreliable, and the geometric information contained in the tree point clouds is also compromised.
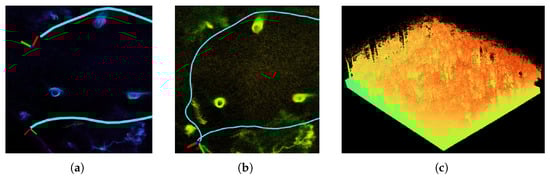
Figure 4.
SLAM with loop closure detection deployed to generate 3D point cloud map. (a) Deformation of tree point clouds due to cumulative drift. (b) Tree point cloud optimized with loop closure detection. (c) 3D point cloud map generated.
To address the impact of cumulative drift, the scan context descriptor [39] was adopted in our study to detect potential loop closures and correct the accumulated shift error in location estimation. It is a global point cloud feature descriptor based on circular partitioning which divides LiDAR data into polar coordinate form [40]. Its effective scene representation enhances data processing and retrieval efficiency, which allows for fast searching of the most likely loop candidates in historical key frames even in large-scale environments. The loop closure detection results are updated into the pose of the current frame and further update the submap, thereby obtaining a forest map and tree geometric structure with better global consistency (Figure 4b). The eventual point cloud reconstruction result is shown in Figure 4c.
3.2. Terrain Extraction
This step aims to remove ground points regarded as unnecessary points, preparing vegetation points for trunk segmentation. In this study, we deployed the CSF algorithm [20] to extract terrain point cloud from the environmental point cloud data, following the approach outlined by Jan Trochta [18]. It has been widely applied because of its high reliability in terrain point cloud separation. Due to the simulated gravity effect, the algorithm may misclassify some trunk points as terrain points, leading to a loss of trunk information and then exacerbating errors in tree localization. By integrating the strengths of both methods, this study ensures the integrity of tree trunk information while maintaining the accuracy of ground extraction.
To enhance the accuracy of ground point cloud extraction, we integrate the concept of resolution transfer into our process. Initially, we apply Statistical Outlier Removal (SOR) in the original 3D point cloud map to eliminate noise with resolution to reduce the impact of noise on subsequent data analysis. Then, utilizing the PCL library [41], the denoised point cloud is downsampled, using a voxel filter with voxel size to reduce the radial density variation in the point cloud and improve the computational speed of single trunk segmentation, as demonstrated in [42]. Subsequently, the CSF algorithm is used to extract rough terrain point cloud and fine terrain point cloud with resolutions of 10 and , respectively. Points in the fine one are used as the search points, and an octree is used here for a fine search with resolution in another. Eventually, take the lowest voxel as the result as the final extracted terrain point cloud (Figure 5a), while the remaining point clouds are regarded as vegetation point clouds (Figure 5b).
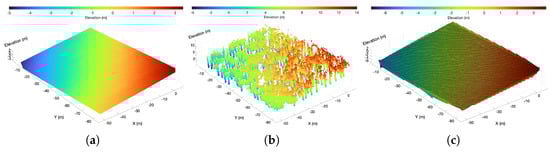
Figure 5.
Output of terrain extraction. (a) Terrain point cloud. (b) Vegetation point cloud. (c) Digital elevation model.
In the generated 3D point cloud map, tree bases are not necessarily aligned on a single horizontal plane, as illustrated in Figure 5a where the terrain includes slopes. This discrepancy can result in anomalies in the subsequent tree trunk segmentation, such as missing trunks or the erroneous inclusion of canopy point clouds. To address this, we utilize the extracted ground point cloud to generate a digital elevation model (DEM) using Amidror’s natural neighbor interpolation algorithm [43], as depicted in Figure 5c. Following elevation normalization, each point in the vegetation point cloud obtained from the previous step is transformed into its normalized coordinates , which is calculated as follows:
where is the z-value of the nearest pixel to point P in the DEM. The result of the vegetation point cloud after elevation normalization is shown in Figure 6. The normalized vegetation point cloud will also optimize the algorithm output in the following tree trunk segmentation step.
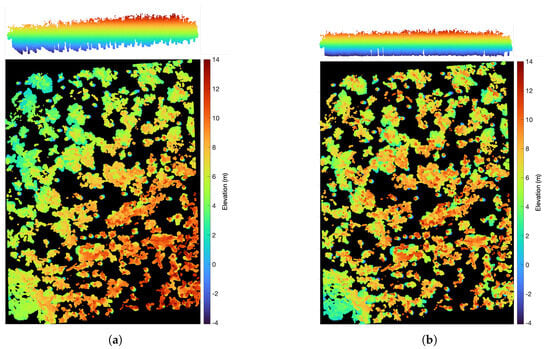
Figure 6.
Elevation normalization for vegetation point cloud. (a) Horizontal perspective and overhead perspective of primitive vegetation point cloud. (b) Horizontal perspective and overhead perspective of normalized vegetation point cloud.
3.3. Trunk Segmentation
In this study, we initially compress the point cloud in the vertical direction utilizing the cylindrical structure of tree trunks and the characteristics of LiDAR scanning to enhance the density characteristics of the trunk point cloud and subsequently extract the trunk point cloud based on these enhanced characteristics. Following this, the density-based spatial clustering of applications with noise (DBSCAN) clustering algorithm [44] is deployed. Finally, inspired by the box and whisker plot concept in Exploratory Data Analysis (EDA) [45], we implement a filtering process to remove canopy point clouds that have been erroneously identified as trunks. This enhances the accuracy of the final segmentation results.
We projected the point cloud of each tree onto the horizontal plane. Therefore, as depicted in Figure 7a, points that correspond to the trunk were concentrated into a dense circle, while the points of the canopy were scattered and sparser.
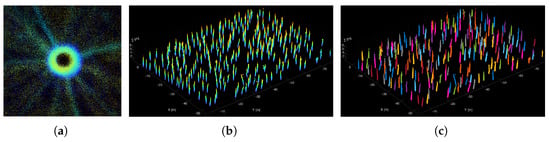
Figure 7.
Trunk segmentation. (a) Projected points of the trunk is denser than those of the canopy in a tree. (b) Point cloud extracted including all trunks before segmentation. (c) Point clouds of all individual trunks.
Based on the above characteristics, this study extracts the trunk part from the vegetation point cloud. First, the vegetation point cloud is projected onto the xOy plane, and then a kd-tree is carried out to perform nearest neighbor searches with different radii of and for each point. Since the distribution of points in the projected point cloud is uneven, with the trunk region being dense and the canopy region sparse, the projected points corresponding to the trunk, , must satisfy inequality (2).
where denotes the number of points around within , denotes the number of points around within , and represent the areas corresponding to the different radii. Based on these definitions, we identify points satisfying inequality (3) as trunk points.
where is a coefficient representing the classification intensity and . If the value of is too large, it will result in more canopy point clouds in the trunk extraction results. If it is too small, it will lead to the loss of some surface point clouds of the trunk. The extracted trunk point clouds are shown in Figure 7b. After the trunk point clouds are extracted, the fast DBSCAN clustering algorithm is applied to further segment the extracted trunk point clouds into individual trunk point clouds.
In the situation with high local branch and leaf density within the canopy, the projection of certain canopy point clouds onto the horizontal plane may exhibit a density surpassing that of the surrounding canopy points. This increased density can result in the misclassification of these canopy points as trunk points during the extraction process. Consequently, this may introduce non-trunk point cloud clusters into the segmentation outcomes. To address this, the segmentation results need to be filtered to remove these outliers. We construct a dataset D from the height values of the lowest points of each point cloud cluster in the vertical direction, denoted as D and . Here, n is the number of point cloud clusters in the segmentation result and represents the height value in the vertical direction of the lowest point in i-th point cloud cluster in the segmentation result. Based on the original interquartile range (IQR), the upper limit threshold for valid values is established according to the median position of the data D, as calculated in Equation (4). If the height value of the lowest point of a point cloud cluster exceeds the threshold, the cluster is identified as a canopy point cloud. This approach enables the identification of outliers in the segmentation results with minimal prior information, thereby corresponding to canopy point cloud clusters.
where denotes the upper limit for valid values, is the upper quartile of D, is the median of D, is the lower quartile of D, and is the strictness coefficient. A smaller indicates stricter criteria: if is too small, it may result in incomplete tree trunks in the final results, whereas if is too large, it may fail to detect outliers. The IQR is calculated as . The eventual output of the tree trunk segmentation algorithm is depicted in Figure 7c.
3.4. DBH Estimation
During the segmentation process, the projection areas of certain canopy point clouds overlap with those of the trunk point clouds, resulting in residual canopy point clouds within each segmentation outcome. Given the irregular distribution of canopy point clouds, this overlap can distort the directional features of the overall point cloud. To mitigate this interference on DBH estimation, we extract the main section of the trunk (spanning approximately 0–3 m). Trees with significant tilt display elliptical projections on the horizontal plane. Therefore, we project the extracted point clouds onto a plane whose normal vector is parallel to the trunk’s principal axis. The direction of this principal axis is determined using the RANSAC algorithm. As depicted in Figure 8a, we conduct multi-layer sampling at heights near 1.3 m above the tree base. To preserve the correlation between sampling point clouds of adjacent layers and ensure the continuity of estimation results, we employ overlapping equidistant sampling. The specific sampling height intervals are [1.10–1.20], [1.15–1.25], [1.20–1.30], [1.25–1.35], [1.30–1.40], [1.35–1.45], and [1.40–1.50]. Subsequently, we apply the RHT algorithm to fit circles within each layer of point clouds, thereby accomplishing DBH estimation, as illustrated in Figure 8b.
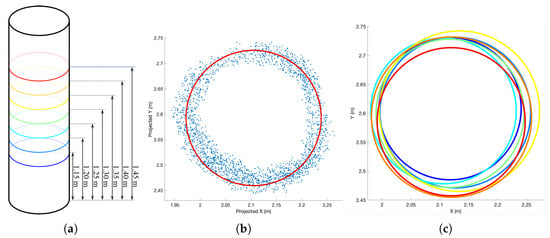
Figure 8.
Illustration of the DBH calculation process. (a) Equidistant sampling of tree trunk point clouds at different height intervals, with each interval being 10 m in length, and the heights of the centers of each interval are given. (b) Projection of the point cloud within a layer onto the base plane of the tree along the main axis of the tree, followed by circle fitting. (c) Summary of the fitted circles.
The results of multi-layer fitting are depicted in Figure 8c. However, given the significant noise inherent in MLS point clouds and the potential influence of bark roughness on measurement accuracy, the multi-layer fitting results at the height of 1.3 m may exhibit considerable fluctuation. To address this, the current study eliminates outliers from the multi-layer DBH estimation results and adopts the mean of the valid values as the final estimation result. For the estimation result of a specific layer , if , then is deemed a valid estimation result for that layer’s point cloud. Here, represents the mean of the set of all estimation results, while denotes the standard deviation of this set.
3.5. Metrics for Segmentation
In this study, we adopt precision, recall, and the F1-score as evaluation metrics for assessing the performance of the tree segmentation module. Precision is defined as the proportion of points labeled as trees that are truly trees within the segmentation results; recall is the ratio of correctly segmented tree point clouds to the total number of actual tree point clouds. The F1-score is the harmonic mean of precision and recall, providing a composite measure that evaluates the overall performance of the algorithm.
To clarify these terms, they are defined as follows:
- TP (True Positive) represents the number of point clouds correctly identified as trees, referring to correct segmentation results;
- FN (False Negative) represents the number of point clouds that are actually trees but are not correctly identified as such, referring to missed trees;
- FP (False Positive) represents the number of point clouds incorrectly labeled as trees, referring to segments wrongly classified as trees.
Using these definitions, the calculation formulas are as follows:
3.6. Metrics for DBH Estimation
In this study, we use the segmentation algorithm adopted in this study and use the segmentation results as the research object for DBH estimation and utilize the root mean square error (RMSE) and mean absolute percentage error (MAPE) as evaluation metrics for the DBH estimation algorithm. The RMSE assesses the average magnitude of the absolute errors between the predicted values and the actual values, characterizing the prediction accuracy of the model. The MAPE evaluates the average relative error between the predicted values and the actual values. The formulas for these metrics are provided below:
where n denotes the number of trees for which the DBH is estimated. represents the true DBH value of the i-th tree, while represents the estimated DBH value of the i-th tree. Generally, lower RMSE and MAPE values signify superior performance. Additionally, this study employs the residuals between true and estimated values to fit a normal distribution, thereby assessing algorithm performance. A more concentrated residual distribution around zero indicates better predictive unbiasedness of the model, which is characterized by the mathematic expectation () of the normal distribution. And in the context of normal distribution, reduced variance () indicates lower volatility in the system’s predictive outcomes, thereby enhancing the consistency and reliability of its forecasting performance.
4. Results
The parameters used in our pipeline were carefully selected to minimize trunk point cloud loss during terrain extraction, enhance efficiency of trunk segmentation, and improve the accuracy and robustness of DBH estimation, with these parameters detailed in Table 1.

Table 1.
Values of the parameters used in the experiments.
4.1. Trunk Segmentation
To validate the effectiveness of the presented system for trunk segmentation, we compare it with 3DFin [27]. Additionally, an ablation experiment was conducted on the outlier detection module to assess its efficacy in which the outlier detection module was deactivated. The results of three experiments are shown in Table 2. There are 231 trees total in the dataset manually counted in the research area. In the result of the segmentation process in 3DFin, 203 trunks were correctly extracted, 28 trunks were missed, and 2 segments were wrongly classified as trunks, resulting in a recall of 87.9%, precision of 99.0%, and F1-score of 93.1%. In the result of the proposed pipeline, 225 trunks were extracted, 6 trunks were missed, and 5 segments were wrongly classified as trunks, resulting in the recall of 97.4%, precision of 97.8%, and F1-score of 97.6%. Through a comparative analysis of the respective metrics, it was observed that the proposed algorithm in this paper exhibits a pronounced superiority in terms of recall rate, albeit with some room for enhancement in precision. However, when evaluating the overall segmentation performance using the F1-score, the proposed algorithm demonstrates a notable enhancement in performance. Additionally, the result of the ablation experiment indicated that a substantial number of canopy point cloud fragments were erroneously classified as trunk point clouds. This finding underscores the module’s effectiveness in filtering out canopy point cloud fragments from the preliminary segmentation results, thereby markedly improving the accuracy of the final tree trunk recognition results.
Table 2.
Trunk segmentation results of 3DFin, proposed algorithm, and ablation experiment.
The experimental results for the three systems in the scenarios with high canopy density are shown in Table 3. It was discerned that dense canopy point clouds tend to induce a reduction in accuracy. This phenomenon is attributable to the relatively high numerical proportion of canopy point cloud fragments in the preliminary segmentation results, which in turn diminishes their abnormality. Consequently, the median within the outlier detection module experiences an upward shift, rendering the lowest point of the tree trunk more susceptible to being identified as a valid value.
Table 3.
Trunk segmentation results of 3DFin, proposed algorithm and ablation experiment in denser tree canopy scenarios.
4.2. DBH Estimation
To validate the effectiveness of the DBH estimation algorithm, we compare it with Trochta’s 3D Forest [18]. The RMSE and MAPE metrics for both algorithms are computed and presented in Table 4. The results of 3D Forest are depicted in Figure 9, while those of our designed system are shown in Figure 10. The comparison in the table reveals that our study achieves notable improvements in RMSE and MAPE, thereby significantly enhancing the precision and confidence of tree DBH estimation. From the comparison of residual distribution curves of the two results, our designed algorithm indicated reasonable performance of the system but some room for improvement. Specifically, while our algorithm achieves a lower RMSE compared to the 3D Forest system as Table 4 depicted, it exhibits a slightly larger negative systematic bias ( = −1.59 vs. = −1.19) in residual analysis that accounts for both positive and negative deviations. The bias is primarily attributed to the loss of the outermost points during trunk extraction, which arises from the density-based method employed. However, our algorithm demonstrates greater stability and consistency in terms of the standard deviation of the residual distribution ( = 2.79 vs. = 3.75) and the number of outliers in boxplot analysis.
Table 4.
DBH estimation metrics calculated of 3D Forest software and proposed system.
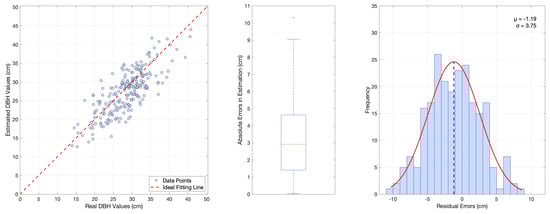
Figure 9.
Estimation of DBH using the 3D Forest system (using the mobile LiDAR scanning data). Left: Plot of the 231 measured trees vs. estimated values as extrapolated from the package. Middle: Boxplot of the errors between the estimated and measured values, RMSE = 3.92 cm and MAPE = 11.40%, including 1 outlier. Right: Residual distribution plot and its normal fitting curve.
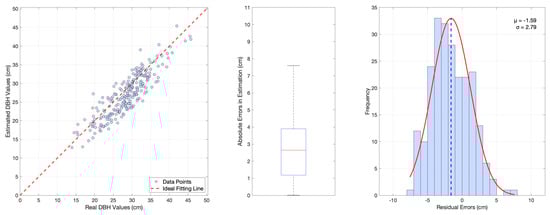
Figure 10.
Estimation of DBH using our designed system. Left: Plot of 231 measured trees vs. estimated values, 1 tree was not segmented. Middle: Boxplot of the errors between the estimated and measured values, RMSE = 3.20 cm and MAPE = 9.72%. Right: Residual distribution plot and its normal fitting curve.
In addition, to verify the positive impact of the loop detection module on the accuracy of breast diameter estimation, we conducted ablation verification experiments, specifically evaluating the role of this module. High-precision SLAM algorithms typically provide more accurate estimates of trunk diameter because these algorithms can generate more detailed and precise 3D point cloud data, thereby better reflecting the true shape and size of the trunk. This comparative experiment conducted an analysis of three SLAM algorithms with varying precision levels: LOAM [46], FAST-LIO2 [36], and our optimized FAST-LIO2 integrated with loop closure. The algorithms were here to reconstruct 3D point cloud maps of forest and were evaluated for their effects on eventual DBH estimation, demonstrating how algorithmic precision improvements in SLAM directly influence the reliability of DBH estimation. The experimental results (Table 5) show that the higher-precision FAST-LIO2 can provide accurate data sources for the breast diameter estimation pipeline, thereby reducing errors. Moreover, the FAST-LIO2 upgraded with loop closure detection function improves the consistency and accuracy of the point cloud data, thus achieving higher breast diameter estimation accuracy. Specifically, the point cloud data generated by FAST-LIO2 with loop closure are not only rich in detail but also has less distortion, significantly reducing the error in breast diameter estimation, verifying the effectiveness of the loop detection algorithm in improving breast diameter estimation accuracy.
Table 5.
Results of DBH estimation under different SLAM algorithms: LOAM, FAST-LIO2, and our optimized FAST-LIO2 integrated with loop closure.
5. Discussion
The development of LiDAR technology has provided technical support for the three-dimensional reconstruction of forest environments. Due to occlusion, a single terrestrial LiDAR is unable to complete the three-dimensional reconstruction of the entire complex forest environment. Terrain laser scanning, when scanning dense vegetation, usually requires setting up multiple stations at different locations to scan from multiple directions of the target, which is time-consuming and extremely expensive in data processing, although the accuracy is high. In contrast, although the backpack-mounted mobile laser scanning can complete the scanning and reconstruction of forest scenes while moving, the scanning device is higher than the operator, making it prone to being snagged by low-hanging branches and leaves, thus reducing the durability of the sensor and causing the accuracy of the reconstructed 3D point cloud map to decrease. Compared with terrain laser scanning and backpack laser scanning, handheld mobile LiDAR can scan more complex forest structures. It is small in size, light in weight, easy to operate, and can be directly deployed on robots or robotic dogs in the future to help humans achieve unmanned exploration of forests.
During the 3D point cloud reconstruction process in forest environments, the perception device operated by the operator will return to or pass through areas that have already been scanned closely. As a result, the trees in this area will be scanned again after a certain period of time. However, in the running SLAM algorithm, the pose estimation process will continuously accumulate errors, leading to the failure of scans matching and the deformation of the point cloud reconstruction result for the inevitably repeatedly scanned trees. This paper proposes the use of loop closure detection based on scan context to reduce cumulative drift, enhance the accuracy of the generated point cloud, and thus improve the reliability of vegetation data analysis.
In the process of individual tree segmentation, closely connected canopies cause the trees to be unable to be completely separated, resulting in adjacent trees being identified as a single tree, which has not been effectively solved in previous research. This paper cleverly uses the special columnar structure of trees and the characteristics of LiDAR scanning to enhance the density feature of the trunk point cloud within a tree by compressing the point cloud in the vertical dimension. This relatively weakens the density feature of the canopy, thereby improving the recognition accuracy of the trunk by the DBSCAN algorithm. The results of the segmentation are then filtered effectively using the thinking of outlier detection in box plots, removing the canopy point clouds from the segmentation results in the previous step. Ultimately, the accuracy and recall rates of trunk extraction are significantly improved. As shown in Table 2, although our segmentation model has a slightly lower precision compared to 3DFin (0.978 vs. 0.990), it achieves higher recall (0.974 vs. 0.879) and F1-score (0.976 vs. 0.931), indicating superior performance in practical applications. Observing the results in Table 3, there is a slight but acceptable decrease in precision under conditions of high-density canopy layers. Nevertheless, even under these circumstances, our model manages to more completely separate more individual trees, which is of better significance. This success is attributed to leveraging the unique columnar structure of trees and optimizing point cloud processing, which leads to better separation between adjacent trees. Looking ahead, we aim to refine filtering techniques further and explore additional features to improve the precision and robustness of the segmentation process.
During the process of DBH estimation, point cloud slices may exhibit an elliptical shape, leading to overestimated results when directly applying RHT to fit the horizontal slices of tree trunk point clouds. Additionally, using single-layer point cloud slices can introduce randomness and increase fluctuations in the estimation results. To address these issues, we project multi-layer sampled point clouds onto the tree base plane and enhance the confidence of the final estimation by averaging after removing outlier predictions. According to the data in Table 4, our model achieves higher accuracy (RMSE 3.20 cm vs. 3.79 cm, MAPE 9.72% vs. 11.40%). Furthermore, comparing Figure 9 and Figure 10, our model demonstrates a clear advantage over 3D Forest in terms of the number of outliers and the concentration of residual distribution, indicating better stability and robustness. However, our prediction model shows slightly poorer performance in terms of bias, exhibiting a larger negative bias. This performance degradation is due to point cloud loss from the tree trunk surface caused by density-based segmentation, resulting in estimated values being lower than the true values. We plan to reduce this loss by optimizing segmentation parameters and thresholds.
Overall, this study utilized handheld LiDAR equipment for the 3D reconstruction of forests and employed loop detection to obtain tree point cloud data with less distortion. By selecting appropriate resolution parameters, the system accomplished terrain extraction with extremely low loss of tree trunk point cloud, trunk segmentation with high accuracy and reliable performance, and tree DBH estimation with high precision and few outliers. The results were compared with measured values, demonstrating reliable performance and high accuracy, which proved the effectiveness of handheld mobile LiDAR in measuring the geometric data of trees in forests.
Looking ahead, we aim to expand research to include richer geometric indicators that describe the growth conditions of trees, particularly those related to the canopy. We plan to integrate camera data to reconstruct pixel-level 3D forest maps and obtain more semantic information about trees. The fusion of different types of perception sensor data will enable us to extract more comprehensive and high-quality quantitative indicators, not only about tree growth but also about observation of forest ecosystems for forest resource inventory. At the same time, future plans involve deploying perception devices on unmanned mobile platforms, such as robotic dog, to achieve automation and continuous monitoring, enabling autonomous navigation and long-term task execution in large areas of forests without human intervention.
6. Conclusions
In this study, we developed a high-performance mobile system for a forest inventory survey using handheld LiDAR. The system achieves the estimation of the DBH of trees in the forest by integrating key technologies such as 3D reconstruction, terrain extraction, trunk extraction, and diameter at breast height estimation, and performing corresponding optimization. Moreover, the system has undergone rigorous experiments and achieved remarkable performance, with a recall rate of 97.4% and an F1-score of 97.6% in trunk segmentation. Additionally, the DBH estimation achieved an RMSE of 3.20 cm and a MAPE of 9.72%.
Author Contributions
Conceptualization, A.S. and J.L.; data curation, A.S. and R.S.; formal analysis, A.S. and J.M.; investigation, J.L.; methodology, A.S.; project administration, J.L.; resources, A.S. and R.S.; software, A.S.; supervision, J.L.; validation, A.S. and J.M.; visualization, A.S.; writing—original draft, A.S.; writing—review and editing, J.L. All authors have read and agreed to the published version of the manuscript.
Funding
This research received no external funding.
Data Availability Statement
The data that support the findings of this study are available from the corresponding author upon reasonable request.
Acknowledgments
The authors would like to thank Zhe Xu, Yuting Wang for their support in hardware construction, data collection, and field deployment.
Conflicts of Interest
The author declares that the research was conducted without any possible commercial or financial relationships that could lead to a conflict of interest.
References
- Raumonen, P.; Kaasalainen, M.; Åkerblom, M.; Kaasalainen, S.; Kaartinen, H.; Vastaranta, M.; Holopainen, M.; Disney, M.; Lewis, P. Fast Automatic Precision Tree Models from Terrestrial Laser Scanner Data. Remote Sens. 2013, 5, 491–520. [Google Scholar] [CrossRef]
- Calders, K.; Newnham, G.; Burt, A.; Murphy, S.; Raumonen, P.; Herold, M.; Culvenor, D.; Avitabile, V.; Disney, M.; Armston, J.; et al. Nondestructive estimates of above-ground biomass using terrestrial laser scanning. Methods Ecol. Evol. 2015, 6, 198–208. [Google Scholar]
- de Tanago, J.G.; Lau, A.; Bartholomeus, H.; Herold, M.; Avitabile, V.; Raumonen, P.; Martius, C.; Goodman, R.C.; Disney, M.; Manuri, S.; et al. Estimation of above-ground biomass of large tropical trees with terrestrial LiDAR. Methods Ecol. Evol. 2018, 9, 223–234. [Google Scholar]
- Reddy, C.S.; Satish, K.V. Assessment of Tree Density, Tree Cover, Species Diversity and Biomass in Semi-arid Human Dominated Landscape Using Large Area Inventory and Remote Sensing Data. Anthr. Sci. 2023, 2, 197–211. [Google Scholar]
- Gao, Q.; Kan, J. Automatic Forest DBH Measurement Based on Structure from Motion Photogrammetry. Remote Sens. 2022, 14, 2064. [Google Scholar] [CrossRef]
- Tinkham, W.T.; Swayze, N.C.; Hoffman, C.M.; Lad, L.E.; Battaglia, M.A. Modeling the Missing DBHs: Influence of Model Form on UAV DBH Characterization. Forests 2022, 13, 2077. [Google Scholar] [CrossRef]
- Ye, X.; Pan, J.; Shao, F.; Liu, G.; Lin, J.; Xu, D.; Liu, J. Exploring the potential of visual tracking and counting for trees infected with pine wilt disease based on improved YOLOv5 and StrongSORT algorithm. Comput. Electron. Agric. 2024, 218, 108671. [Google Scholar]
- Anagnostis, A.; Tagarakis, A.C.; Asiminari, G.; Papageorgiou, E.; Kateris, D.; Moshou, D.; Bochtis, D. A deep learning approach for anthracnose infected trees classification in walnut orchards. Comput. Electron. Agric. 2021, 182, 105998. [Google Scholar]
- Schönberger, J.L.; Frahm, J.-M. Structure-from-Motion Revisited. In Proceedings of the 2016 IEEE Conference on Computer Vision and Pattern Recognition (CVPR), Las Vegas, NV, USA, 27–30 June 2016; pp. 4104–4113. [Google Scholar]
- Zhang, G.; Liu, H.; Dong, Z.; Jia, J.; Wong, T.; Bao, H. Efficient Non-Consecutive Feature Tracking for Robust Structure-From-Motion. IEEE Trans. Image Process. 2016, 25, 5957–5970. [Google Scholar]
- Cheng, L.; Chen, S.; Liu, X.; Xu, H.; Wu, Y.; Li, M.; Chen, Y. Registration of Laser Scanning Point Clouds: A Review. Sensors 2018, 18, 1641. [Google Scholar] [CrossRef]
- Chen, J.; Zhao, D.; Zheng, Z.; Xu, C.; Pang, Y.; Zeng, Y. A clustering-based automatic registration of UAV and terrestrial LiDAR forest point clouds. Comput. Electron. Agric. 2024, 217, 108648. [Google Scholar]
- Bauwens, S.; Bartholomeus, H.; Calders, K.; Lejeune, P. Forest inventory with terrestrial LiDAR: A comparison of static and handheld mobile laser scanning. Forests 2016, 7, 127. [Google Scholar] [CrossRef]
- Tsuchiya, B.; Mochizuki, H.; Hoshikawa, T.; Suzuki, S. Error estimation of trunk diameter and tree height measured with a backpack LiDAR system in Japanese plantation forests. Landsc. Ecol. Eng. 2023, 19, 169–177. [Google Scholar]
- Su, J.; Fan, Y.; Mannan, A.; Wang, S.; Long, L.; Feng, Z. Real-Time Estimation of Tree Position, Tree Height, and Tree Diameter at Breast Height Point, Using Smartphones Based on Monocular SLAM. Forests 2024, 15, 939. [Google Scholar] [CrossRef]
- Shao, J.; Zhang, W.; Mellado, N.; Wang, N.; Jin, S.; Cai, S.; Luo, L.; Lejemble, T.; Yan, G. SLAM-aided forest plot mapping combining terrestrial and mobile laser scanning. Isprs J. Photogramm. Remote. Sens. 2020, 163, 214–230. [Google Scholar]
- Chiappini, S.; Pierdicca, R.; Malra, F.; Tonelli, E.; Malinverni, E.S.; Urbinati, C.; Vitali, A. Comparing Mobile Laser Scanner and manual measurements for dendrometric variables estimation in a black pine (Pinus nigra Arn.) plantation. Comput. Electron. Agric. 2022, 198, 107069. [Google Scholar]
- Trochta, J.; Krůček, M.; Vrška, T.; Král, K. 3D forest: An application for descriptions of three-dimensional forest structures using terrestrial LiDAR. PLoS ONE 2017, 12, e0176871. [Google Scholar]
- Proudman, A.; Ramezani, M.; Digumarti, S.T.; Chebrolu, N.; Fallon, M. Towards real-time forest inventory using handheld LiDAR. Robot. Auton. Syst. 2022, 157, 104240. [Google Scholar]
- Zhang, W.; Qi, J.; Wan, P.; Wang, H.; Xie, D.; Wang, X.; Yan, G. An Easy-to-Use Airborne LiDAR Data Filtering Method Based on Cloth Simulation. Remote Sens. 2016, 8, 501. [Google Scholar] [CrossRef]
- Cai, S.; Zhang, W.; Qi, J.; Wan, P.; Shao, J.; Shen, A. Applicability analysis of cloth simulation filtering algorithm for mobile lidar point cloud. Isprs—Int. Arch. Photogramm. Remote. Sens. Spat. Inf. Sci. 2018, XLII-3, 107–111. [Google Scholar]
- Cheng, D.; Zhao, D.; Zhang, J.; Wei, C.; Tian, D. PCA-Based Denoising Algorithm for Outdoor Lidar Point Cloud Data. Sensors 2021, 21, 3703. [Google Scholar] [CrossRef] [PubMed]
- Wilkes, P.; Disney, M.; Armston, J.; Bartholomeus, H.; Bentley, L.; Brede, B.; Burt, A.; Calders, K.; Chavana-Bryant, C.; Clewley, D.; et al. TLS2trees: A scalable tree segmentation pipeline for TLS data. Methods Ecol. Evol. 2023, 14, 3083–3099. [Google Scholar]
- Zhou, S.; Kang, F.; Li, W.; Kan, J.; Zheng, Y.; He, G. Extracting diameter at breast height with a handheld mobile LiDAR system in an outdoor environment. Sensors 2019, 19, 3212. [Google Scholar] [CrossRef]
- Proudman, A.; Ramezani, M.; Fallon, M. Online estimation of diameter at breast height (DBH) of forest trees using a handheld LiDAR. In Proceedings of the 2021 European Conference on Mobile Robots (ECMR), Bonn, Germany, 31 August–3 September 2021; IEEE: Piscataway, NJ, USA, 2021; pp. 1–7. [Google Scholar]
- Lindberg, E.; Holmgren, J.; Olsson, H. Random forest-based segmentation of MLS point clouds in forest environments. Int. J. Appl. Earth Obs. Geoinf. 2022, 105, 102634. [Google Scholar]
- Laino, D.; Cabo, C.; Prendes, C.; Janvier, R.; Ordonez, C.; Nikonovas, T.; Doerr, S.; Santin, C. 3DFin: A software for automated 3D forest inventories from terrestrial point clouds. For. Int. J. For. Res. 2024, 97, 479–496. [Google Scholar]
- Kelbe, D.; Aardt, J.V.; Romanczyk, P.; Leeuwen, M.V.; Cawse-Nicholson, K. Single-Scan Stem Reconstruction Using Low-Resolution Terrestrial Laser Scanner Data. IEEE J. Sel. Top. Appl. Earth Obs. Remote. Sens. 2015, 8, 1–14. [Google Scholar]
- Harikumar, A.; Bovolo, F.; Xinlian, L. An Effective Approach to 3D Stem Modeling and Branch-Knot Localization in Multiscan TLS Data. In Proceedings of the IGARSS 2019—2019 IEEE International Geoscience and Remote Sensing Symposium, Yokohama, Japan, 28 July–2 August 2019; pp. 6075–6078. [Google Scholar]
- Liu, C.; Xing, Y.; Duanmu, J.; Tian, X. Evaluating Different Methods for Estimating Diameter at Breast Height from Terrestrial Laser Scanning. Remote Sens. 2018, 10, 513. [Google Scholar] [CrossRef]
- Hui, Z.; Lin, L.; Jin, S.; Xia, Y.; Ziggah, Y.Y. A Reliable DBH Estimation Method Using Terrestrial LiDAR Points through Polar Coordinate Transformation and Progressive Outlier Removal. Forests 2024, 15, 1031. [Google Scholar] [CrossRef]
- Heo, H.K.; Lee, D.K.; Park, J.H.; Thorne, J.H. Estimating the heights and diameters at breast height of trees in an urban park and along a street using mobile LiDAR. Landsc. Ecol. Eng. 2019, 15, 253–263. [Google Scholar]
- Chau, W.Y.; Chow, J.K.; Tan, T.J.; Jimmy, W.U.; Leung, M.L.; Tan, P.S.; Chiu, S.W.; Hau, B.C.H.; Cheng, H.C.; Wang, Y. Towards automatic urban tree inventory: Enhancing tree instance segmentation via moving object removal and a chord length-based DBH estimation approach. Comput. Electron. Agric. 2024, 226, 109378. [Google Scholar]
- Eybek, M.; Vataslar, C. An automated approach for extracting forest inventory data from individual trees using a handheld mobile laser scanner. Croat. J. For. Eng. J. Theory Appl. For. Eng. 2021, 42, 515–528. [Google Scholar]
- Forsman, M.; Borlin, N.; Olofsson, K.; Reese, H.; Holmgren, J. Bias of cylinder diameter estimation from ground-based laser scanners with different beam widths: A simulation study. ISPRS J. Photogramm. Remote Sens. 2018, 135, 84–92. [Google Scholar]
- Xu, W.; Cai, Y.; He, D.; Lin, J.; Zhang, F. FAST-LIO2: Fast Direct LiDAR-Inertial Odometry. IEEE Trans. Robot. 2022, 38, 2053–2073. [Google Scholar]
- Li, L.; Kong, X.; Zhao, X.; Li, W.; Wen, F.; Zhang, H.; Liu, Y. SA-LOAM: Semantic-aided LiDAR SLAM with Loop Closure. In Proceedings of the 2021 IEEE International Conference on Robotics and Automation (ICRA), Xi’an, China, 30 May–5 June 2021; pp. 7627–7634. [Google Scholar]
- Ji, X.; Zuo, L.; Zhang, C.; Liu, Y. LLOAM: LiDAR Odometry and Mapping with Loop-closure Detection Based Correction. In Proceedings of the 2019 IEEE International Conference on Mechatronics and Automation (ICMA), Tianjin, China, 4–7 August 2019; pp. 2475–2480. [Google Scholar]
- Kim, G.; Kim, A. Scan Context: Egocentric Spatial Descriptor for Place Recognition Within 3D Point Cloud Map. In Proceedings of the 2018 IEEE/RSJ International Conference on Intelligent Robots and Systems (IROS), Madrid, Spain, 1–5 October 2018; pp. 4802–4809. [Google Scholar]
- Guo, M.; Zhang, L.; Liu, X.; Du, Z.; Song, J.; Liu, M. 3D Lidar SLAM Based on Ground Segmentation and Scan Context Loop Detection. In Proceedings of the 2021 IEEE 11th Annual International Conference on CYBER Technology in Automation, Control, and Intelligent Systems (CYBER), Jiaxing, China, 27–31 July 2021; pp. 692–697. [Google Scholar]
- Rusu, R.B.; Cousins, S. 3D Is Here: Point Cloud Library (PCL). In Proceedings of the IEEE International Conference on Robotics and Automation (ICRA), Shanghai, China, 9–13 May 2011; IEEE: Piscataway, NJ, USA, 2011. [Google Scholar]
- Burt, A.; Disney, M.; Calders, K. Extracting individual trees from lidar point clouds using treeseg. Methods Ecol. Evol. 2019, 10, 438–445. [Google Scholar]
- Isaac, A. Scattered data interpolation methods for electronic imaging systems: A survey. J. Electron. Imaging 2002, 11, 157–176. [Google Scholar]
- Ester, M.; Kriegel, H.-P.; Sander, J.; Xu, X. A density-based algorithm for discovering clusters in large spatial databases with noise (PDF). In Proceedings of the Second International Conference on Knowledge Discovery and Data Mining (KDD-96), Portland, OR, USA, 2–4 August 1996; Simoudis, E., Han, J., Fayyad, U.M., Eds.; AAAI Press: Washington, DC, USA, 1996; pp. 226–231. [Google Scholar]
- Rousseeuw, P.J.; Ruts, I.; Tukey, J.W. The Bagplot: A Bivariate Boxplot. Am. Stat. 1999, 53, 382–387. [Google Scholar]
- Shan, T.; Englot, B. LeGO-LOAM: Lightweight and Ground-Optimized Lidar Odometry and Mapping on Variable Terrain. In Proceedings of the 2018 IEEE/RSJ International Conference on Intelligent Robots and Systems (IROS), Madrid, Spain, 1–5 October 2018; pp. 4758–4765. [Google Scholar]
Disclaimer/Publisher’s Note: The statements, opinions and data contained in all publications are solely those of the individual author(s) and contributor(s) and not of MDPI and/or the editor(s). MDPI and/or the editor(s) disclaim responsibility for any injury to people or property resulting from any ideas, methods, instructions or products referred to in the content. |
© 2025 by the authors. Licensee MDPI, Basel, Switzerland. This article is an open access article distributed under the terms and conditions of the Creative Commons Attribution (CC BY) license (https://creativecommons.org/licenses/by/4.0/).