Article

Effect of Different Mixing Patterns on Carbon and Nitrogen Dynamics During the Decomposition of Deadwood in Subtropical Forest Ecosystems

by
Ying Sang
1,2,
Zhonglin Xu
1,2,3,4,
Weibin You
5,6,
Yan Cao
7,
Wenli Xing
1,2,* and
Dongjin He
6,8,9,*
1
College of Ecology and Environment, Xinjiang University, Urumqi 830017, China
2
Key Laboratory of Oasis Ecology, Ministry of Education (Xinjiang University), Urumqi 830017, China
3
Xinjiang Jinghe Observation and Research Station of Temperate Desert Ecosystem, Ministry of Education, Jinghe 833300, China
4
Technology Innovation Center for Ecological Monitoring and Restoration of Desert-Oasis, Ministry of Natural Resource, Urumqi 830002, China
5
College of JunCao Science and Ecology (College of Carbon Neutrality), Fujian Agriculture and Forestry University, Fuzhou 350002, China
6
Fujian Southern Forest Resources and Environmental Engineering Technology Research Center, Fuzhou 350002, China
7
College of Finance, Fujian Jiangxia University, Fuzhou 350108, China
8
Fujian Vocational College of Agriculture, Fuzhou 350119, China
9
College of Forestry, Fujian Agriculture and Forestry University, Fuzhou 350002, China
*
Authors to whom correspondence should be addressed.
Forests 2025, 16(4), 579; https://doi.org/10.3390/f16040579
Submission received: 28 February 2025 / Revised: 23 March 2025 / Accepted: 25 March 2025 / Published: 26 March 2025
(This article belongs to the Section Forest Ecology and Management)

Abstract

:
As global forest areas decline and face increased risk from extreme events, optimizing forest types for long-term stability becomes crucial. However, empirical evidence for the effects of mixing methods on carbon and nitrogen dynamics in forest ecosystems remains limited. This study investigates five forest types in Southern China: the Tsuga longibracteata W.C.Cheng pure forests, the Tsuga longibracteata–hardwood mixed forests, the Tsuga longibracteataPhyllostachys edulis (Carr.) J.Houz. mixed forests, the Tsuga longibracteataRhododendron simiarum Hance mixed forests, and the Tsuga longibracteata–hardwood–Rhododendron simiarum mixed forests (the tree species are all dominant community species). We examined one monoculture and four mixed forests, categorized into pure tree forests and tree–shrub mixed forests, and categorized by tree species richness levels of 1, 2, and 3. We measured carbon (C) and nitrogen (N) content, along with the C:N, of coarse woody debris (CWD) at various decay stages and in the adjacent topsoil (0–10 cm) to analyze decomposition rates and their effects on soil nutrients. Our results indicate that the C content and density of CWD differed significantly among forest types (p < 0.001). The Tsuga longibracteataPhyllostachys edulis mixed forest exhibited the highest C and N content in CWD, but the lowest in adjacent topsoil, alongside the fastest decomposition rate. Soil C content and the C:N ratio showed highly significant differences among forest types (p < 0.001), and N content showed a significant difference (p < 0.05). Optimal outcomes occurred at a species richness level of 2, as excessive or insufficient species richness can diminish decomposition rates. The ecological benefits of tree–shrub mixed forests surpassed pure tree forests. Overall, these findings suggest that mixed forests do not always provide greater ecological advantages than pure forests, and that improper mixing can deplete soil.

1. Introduction

In order to increase the total area of forests, afforestation with artificial forests has begun, but most of these are monoculture plantations. Large-scale monocultures have been shown to produce several ecological issues, including soil degradation, soil acidification, and diminished ecological service functions [1,2,3]. Furthermore, the simplistic structure of monocultures leads to low biodiversity and heightened susceptibility to pests and diseases. Mixed forests have been proven to enhance the ecological services provided by forests [4,5]. They offer a greater capacity to mitigate climate change, promote better plant adaptation to extreme climate events [6,7], prevent hydrogeological instability [8,9], enhance resistance to pest and pathogen outbreaks [10,11,12], promote the activity of decomposers [13], improve nutrient cycling and soil fertility [14,15], increase tree biomass compared to monocultures [16], and exhibit higher productivity [17]. They also show significant advantages in carbon storage, biodiversity conservation, and the provision of robust ecosystem services, thereby enhancing ecosystem resilience. Interactions among different tree species in mixed forests facilitate higher levels of biodiversity, contributing to more complex and stable ecosystems [18]. Additionally, mixed forests tend to have greater carbon fixation and storage potential. A higher diversity of tree species can notably boost soil carbon sequestration by increasing standing biomass and optimizing forest composition according to local conditions [19]. Furthermore, increased tree diversity enhances carbon storage by boosting plant productivity, tree biomass, litter biomass, root biomass, exudates, and microbial biomass in a subtropical forest [20]. Along with a greater responsiveness to nitrogen absorption, due to varying growth rates and ecological traits associated with species diversity, playing an essential role in climate change mitigation. However, improper mixing can sometimes lead to soil depletion, harming the ecosystem [21,22]. Species diversity in mixed forests alters wood decay rates, microbial activity, and nutrient release, directly modulating carbon and nitrogen storage and fluxes. Wood decay is a key process in nutrient cycling, with its rate and efficiency directly impacting carbon and nitrogen transfer. Furthermore, interactions among different species in mixed forests may also affect decay rates and nutrient release patterns. Although previous studies have explored the various benefits of mixed forests, few have empirically examined how specific species combinations and decay stages specifically affect C and N dynamics in CWD and the adjacent soil, particularly within subtropical ecosystems.
Tree species richness may enhance forest floor biomass by boosting the production of deadwood and litterfall [23]. Previous studies reported a positive effect of tree species richness on forest productivity [24,25,26]. The complementarity effect hypothesis is commonly employed to explain the positive correlation between species richness and productivity. According to this hypothesis, communities with higher species richness utilize available and limiting resources more effectively through mechanisms such as niche differentiation and canopy packing, which, in turn, results in increased productivity [27]. Additionally, the selection effect hypothesis suggests that the impact of tree species richness on productivity is driven by the functional traits of the dominant species within a community (i.e., functional identity) [28]. The increased probability of producing high-yielding or dominant species by increasing species richness enhances the ecosystem productivity [26]. Tree species richness may also accelerate forest floor decay rates by enhancing litterfall production and increasing litter species diversity, which can boost resource complementarity and create a more favorable microenvironment for decomposers (e.g., soil temperature, moisture, and pH) [29]. Increasing tree species richness may accelerate litter decomposition by enhancing litterfall production and promoting temporal asynchrony in litterfall [30]. Trees play a crucial role in nutrient cycling by storing carbon throughout their life cycles [31], which is vital for mitigating greenhouse gas concentrations. However, when a tree reaches the end of its life cycle and becomes coarse woody debris (CWD), decomposition releases the stored carbon back into the atmosphere, while also contributing some carbon to the surrounding environment, thereby enhancing the carbon content in the soil. The equilibrium and distribution of soil C and N are integral in maintaining soil quality and promoting biomass accumulation, directly impacting the stability and productivity of forest ecosystems [32]. And CWD absorbs nitrogen from the environment to facilitate its decomposition, thus forming an essential link in nutrient cycling. In addition to their critical role in maintaining ecosystem biodiversity and productivity, deadwood constitutes an important component of forest carbon storage [33]. It fulfills various ecological functions, including energy, nutrient, and water cycling, soil and water conservation, biodiversity conservation, forest regeneration, and providing habitats for flora, fauna, and microorganisms [34,35].
This study analyzes and compares variations in carbon and nitrogen content in CWD and the adjacent topsoil (0–10 cm) across different forest types and decay stages. It elucidates the rates and differences in carbon and nitrogen release during the trees decomposition under various mixing methods, as well as changes in soil carbon and nitrogen dynamics. Mixed forests typically exhibit higher biodiversity; studying the carbon–nitrogen cycling characteristics of mixed forests can help to understand the contributions of biodiversity to nutrient cycling in forests and further emphasize the importance of biodiversity conservation. We hypothesize the following: (1) different species combinations will lead to variations in decay rates and carbon–nitrogen cycling patterns due to their unique ecological characteristics and interactions; (2) mixed forests will demonstrate superior decomposition rates and material cycling compared to pure forests; and (3) higher species richness enhances biodiversity and microbial activity, improving the C and N cycles in forests and thus creating better ecological conditions. This study aims to identify the optimal forest types in the region and optimize forest mixing patterns, thereby providing essential guidance for local policies and reforestation protocols, such as species selection, the determination of species richness, and mixing pattern, to improve local ecological conditions, accelerate the decomposition of deadwood and litter, enhance soil nutrient availability, and ultimately strengthen material cycling within the forest ecosystem. Therefore, investigating the impact of different mixing strategies on carbon and nitrogen changes during tree decomposition is vital for understanding carbon cycling, guiding forest management, and shaping climate change policies. This study not only tests the complementarity and selection hypotheses in the context of decomposition, but also provides a framework for optimizing species mixtures based on their functional traits.

2. Materials and Methods
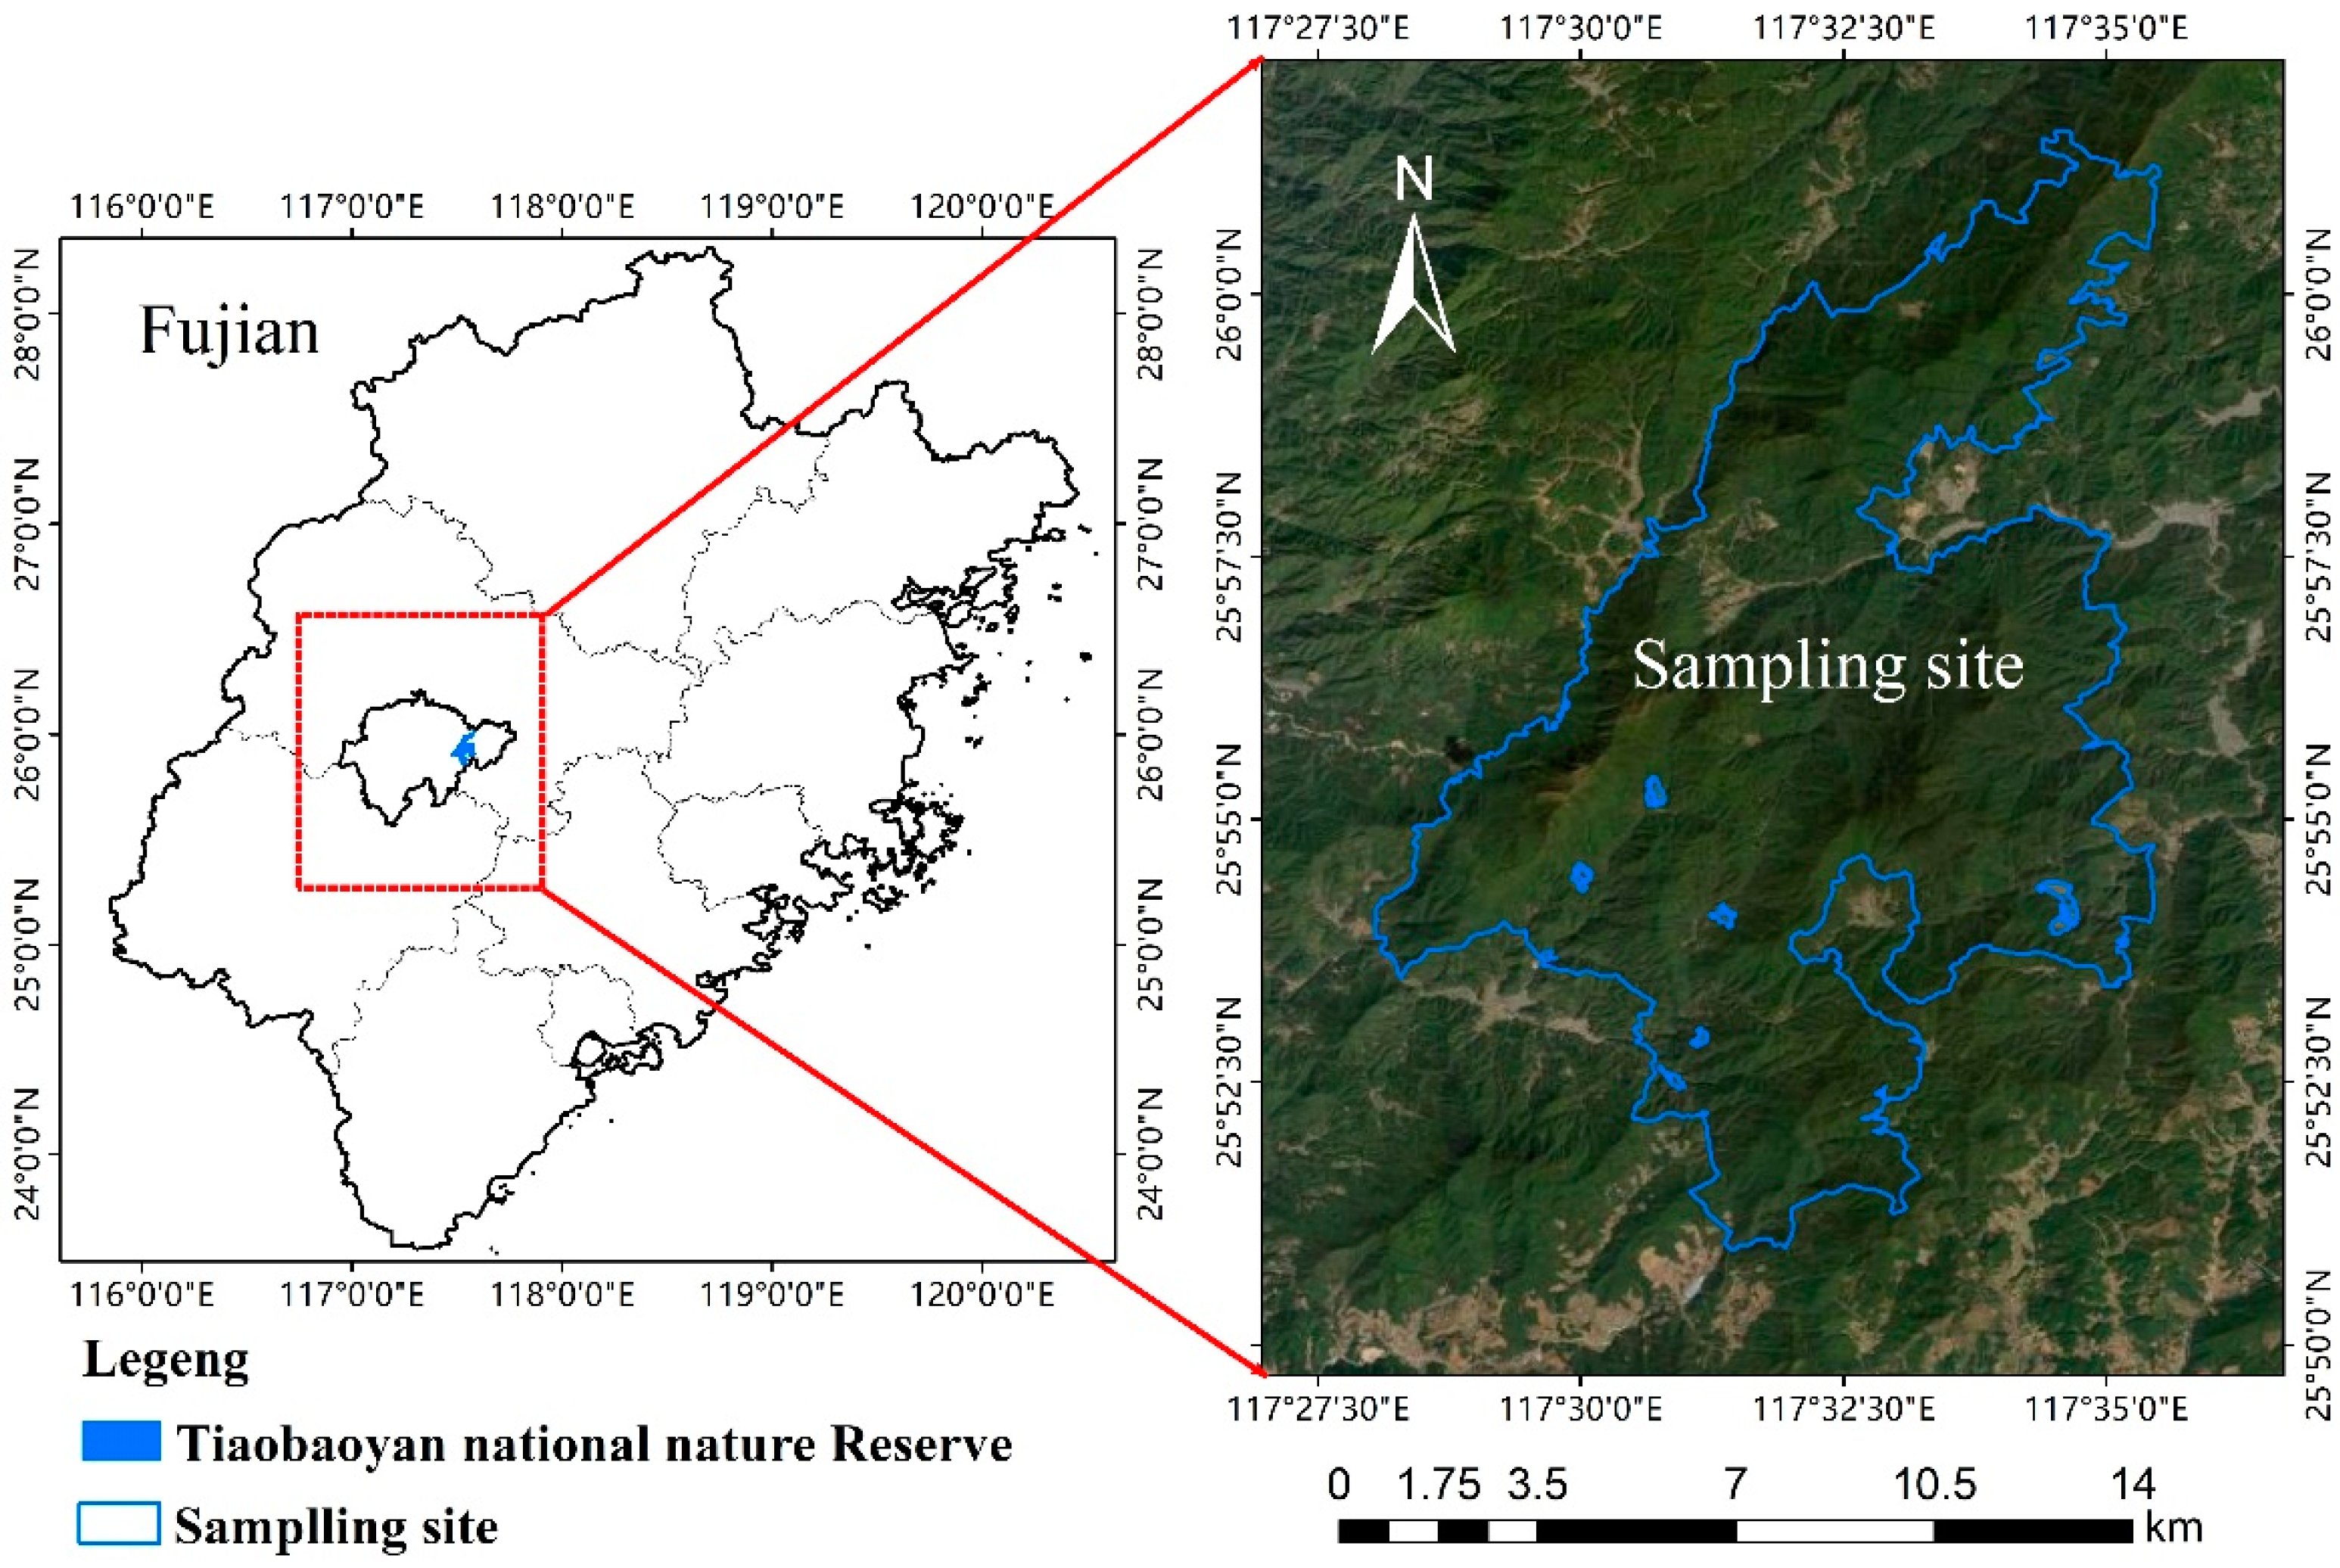
2.1. Study Area

The study area is situated in the central part of Fujian Province, specifically within the Tianbaoyan National Nature Reserve in Yong’an City (from 117°28′3″ E to 117°35′28″ E, and from 25°50′51″ N to 26°1′20″ N) (Figure 1), encompassing a total area of 11,015.38 hm2 [36]. This reserve lies in the transitional zone between the south subtropical and middle subtropical regions, positioned between the Wuyi and Daiyun Mountain ranges; the landscape is characterized by mid-to-low mountain topography. The reserve has a mid-subtropical maritime monsoon climate with an average temperature of 15 °C, yearly average precipitation of 2039 mm, and relative humidity of ≥80%. The reserve has distinct seasons, and the overall climate is warm and humid [37]. Elevations range from 580 m to 1604.8 m, with the highest peak, Tianbao Rock, at 1604.8 m above sea level. Below 800 m, the soil is mountainous red soil; between 800 and 1350 m, it is mountainous yellowish red soil; above 1350 m, it is mountainous yellow soil [36]. The area is rich in natural resources, making it one of the regions in China with high biodiversity; it also serves as a key water conservation forest in the Min River basin. The study area is rich in biodiversity, showing typical characteristics of a transitional zone from south subtropical to mid-subtropical. The zonal vegetation is subtropical evergreen broadleaf forest, with a clear vertical zonation of vegetation including evergreen broadleaf forest, evergreen coniferous forest, mixed evergreen broadleaf and coniferous forest, and montane moss dwarf forest distributed with increasing altitude [38]. The dominant tree species of reserve include Tsuga longibracteata, Quercus glauca Thunb., Pinus massoniana Lamb., and Phyllostachys edulis, while key shrub species consist of Rhododendron simiarum Hance and Eurya japonica Thunb. The predominant forest types are coniferous forests characterized by Tsuga longibracteata and Rhododendron simiarum Hance, along with montane mossy dwarf forests. These extensive primary forest communities are key conservation targets in Tianbaoyan National Nature Reserve. Notably, the distribution of the rare and endangered Tsuga longibracteata forest in the reserve covers 186.7 hm2, making it the largest pure forest of Tsuga longibracteata in the country, thus possessing substantial conservation and research value.

2.2. Experimental Design

Within the Tianbaoyan National Nature Reserve, experimental plots were established in the Tsuga longibracteata pure forests, the Tsuga longibracteata–hardwood mixed forests, the Tsuga longibracteataPhyllostachys edulis mixed forests, the Tsuga longibracteataRhododendron simiarum mixed forests, and the Tsuga longibracteata–hardwood–Rhododendron simiarum mixed forests, all situated on the same slope. While these plots were located on the same slope, potential environmental variations (e.g., soil moisture, microclimate differences) were accounted for by conducting preliminary soil and climate assessments. The tree species in the five forest types are all dominant community species in the sample plot. Moreover, the selected plots reflect the most typical structure of forests in the region, enhancing the applicability and representativeness of the research. To systematically collect data, we employed the fixed plot method; five plots measuring 20 m × 30 m were established for each forest type, recording the basic information of each plot, including land type, CWD decay stage, geographic coordinates, slope aspect, slope gradient, slope position, canopy cover, elevation, temperature, and humidity (Table S1).
We collected all coarse woody debris (CWD) in each plot, including all fallen trees, large dead branches, standing dead trees, and stumps, and conducted an individual investigation for each piece of wood. Each piece of CWD was placed in a bag, labeled with a sequential number and species, and recorded individually for its input method before being transported back to the laboratory. Additionally, soil samples were collected from the surface layer directly beneath each piece of CWD, specifically 0–10 cm in thickness, were collected for individual analysis. This upper soil layer represents the most biologically active component of the soil and contains the highest levels of soil organic carbon [39]. A fresh soil sample (approximately 50 g) and a soil core (volume 100 cm3) were collected, sealed in self-sealing bags, labeled, and taken back to the laboratory for analysis.

2.3. Classification of Coarse Woody Debris (CWD) Decay Levels

This study utilizes the classification system for CWD in forest ecosystems [40], along with the criteria established by Sollins et al. [41], to scientifically define decay levels. During the classification process, decay classification was determined based on the epiphytic growth, root penetration, and mechanical resistance of the CWD. The mechanical resistance was assessed using a standardized penetration test, with a blade inserted at a constant angle and pressure. The classification is as follows:
Levels I and II (Low Decay Level): Level I: Sound wood. The surface of the CWD has no vegetation or is covered with epiphytes. Level II: The sapwood is slightly decayed, while the heartwood is mostly intact. The surface of the CWD is partially covered with vegetation.
Level III (Middle Decay Level): The bark of the CWD has mostly naturally fallen off, the sapwood is partially decomposed, and the heartwood is mostly solid, capable of supporting its own weight. The surface of the CWD is either partially or completely covered with vegetation.
Levels IV and V (High Decay Level): Level IV: The heartwood is decayed, unable to support its own weight, with all wood decomposed into fibers or fragments, presenting a sponge-like texture. The surface of the CWD is completely covered with vegetation. Level V: All wood is severely decayed, with parts having turned into humus, sponge-like in texture. The surface of the CWD is completely covered with vegetation.

2.4. Sample Analysis

The fresh weight of the CWD and the adjacent topsoil was directly measured using a scale (kg, to two decimal places). The samples were then placed in an oven at 70 °C to 80 °C and dried for 24 to 48 h until reaching a constant weight (G) [42]. After drying, the samples were mechanically crushed and passed through a 0.149 mm sieve, then stored in self-sealing bags for preparation [43]. For carbon and nitrogen content analysis, a 5 g sample was weighed into a crucible and analyzed using a carbon and nitrogen analyzer (VARIO MAX, ELEMENTAR, Langenselbold, Germany) [44]. The Dumas combustion method was employed to determine the carbon and nitrogen content in larger sample quantities. The density of the CWD was measured using the following method: First, the dry mass of the wood disk was recorded (m, g). Next, the disk was submerged in a container with a known volume of water (v1, mL), and the new water volume after submerging the disk (v2, mL) was noted. Finally, the density of the wood can be calculated using the following formula: ρ = m/(v1 − v2) (ρ, g/cm3).

2.5. Statistical Analysis

We processed all data using SPSS 19.0 and created graphs using ArcGIS 10.2, Origin 2024, and GraphPad Prism 9.5.1. One-way analysis of variance (ANOVA) and least significant difference (LSD) multiple comparison tests were conducted to comprehensively compare the carbon and nitrogen content of CWD across different forest types and decay stages (Figure 2). The effect size in the one-way ANOVA was used to measure the actual strength of the relationship between variables in the study. The interpretation of effect size is based on Cohen’s (1988) criteria (small effect: η2 = 0.01, moderate effect: η2 = 0.06, large effect: η2 = 0.14) [45].
The Tsuga longibracteata pure forests served as the control group, while the other four mixed forests constituted the treatment groups. We calculated the average carbon (C) and nitrogen (N) content, as well as the C:N, for the five different forest types (pure and mixed) (Figure 3). Independent samples t-tests were performed on the C, N, and C:N values to analyze the differences in elemental content between pure and mixed forests, thereby facilitating a discussion on vegetation types and species richness. Before conducting the statistical analyses, data were tested for normality (Shapiro–Wilk test) and homogeneity of variance (Levene’s test). Post hoc comparisons were adjusted using Bonferroni’s correction.
The response ratios for each sample site were calculated as the relative response of the mixed forest soils (treatment group) compared to the pure forest soils (control group) (Figure 4). Response ratios were used to standardize the effect of different forest types on C and N content, allowing for a comparison across decay stages, regardless of initial nutrient levels. We calculated response ratios using the following equations [46,47]:
C response ratio = (CTreatment − CControl)/CControl
N response ratio = (NTreatment − NControl)/NControl
C:N response ratio = (C:NTreatment − C:NControl)/C:NControl
Here, CTreatment, NTreatment, and C:NTreatment represent each value in the treatment group, while CControl, NControl, and C:NControl denote the mean values for the control group. The response ratios for C, N, and C:N corresponding to the five decay levels in the mixed forests were computed relative to those in the pure forest.
Structural equation modeling (SEM) was applied to assess both direct and indirect effects of species richness and vegetation type on soil C and N dynamics, accounting for multicollinearity among variables (Figure 5).
Principal component analysis (PCA) was used to visualize the correlations among all variables in the CWD and soil. In the biplot, smaller angles between vectors indicate higher correlations between variables, while larger angles indicate lower correlations (Figure 6).

3. Results

3.1. Comparison of Carbon and Nitrogen Content in the CWD of Different Tsuga longibracteata Forests

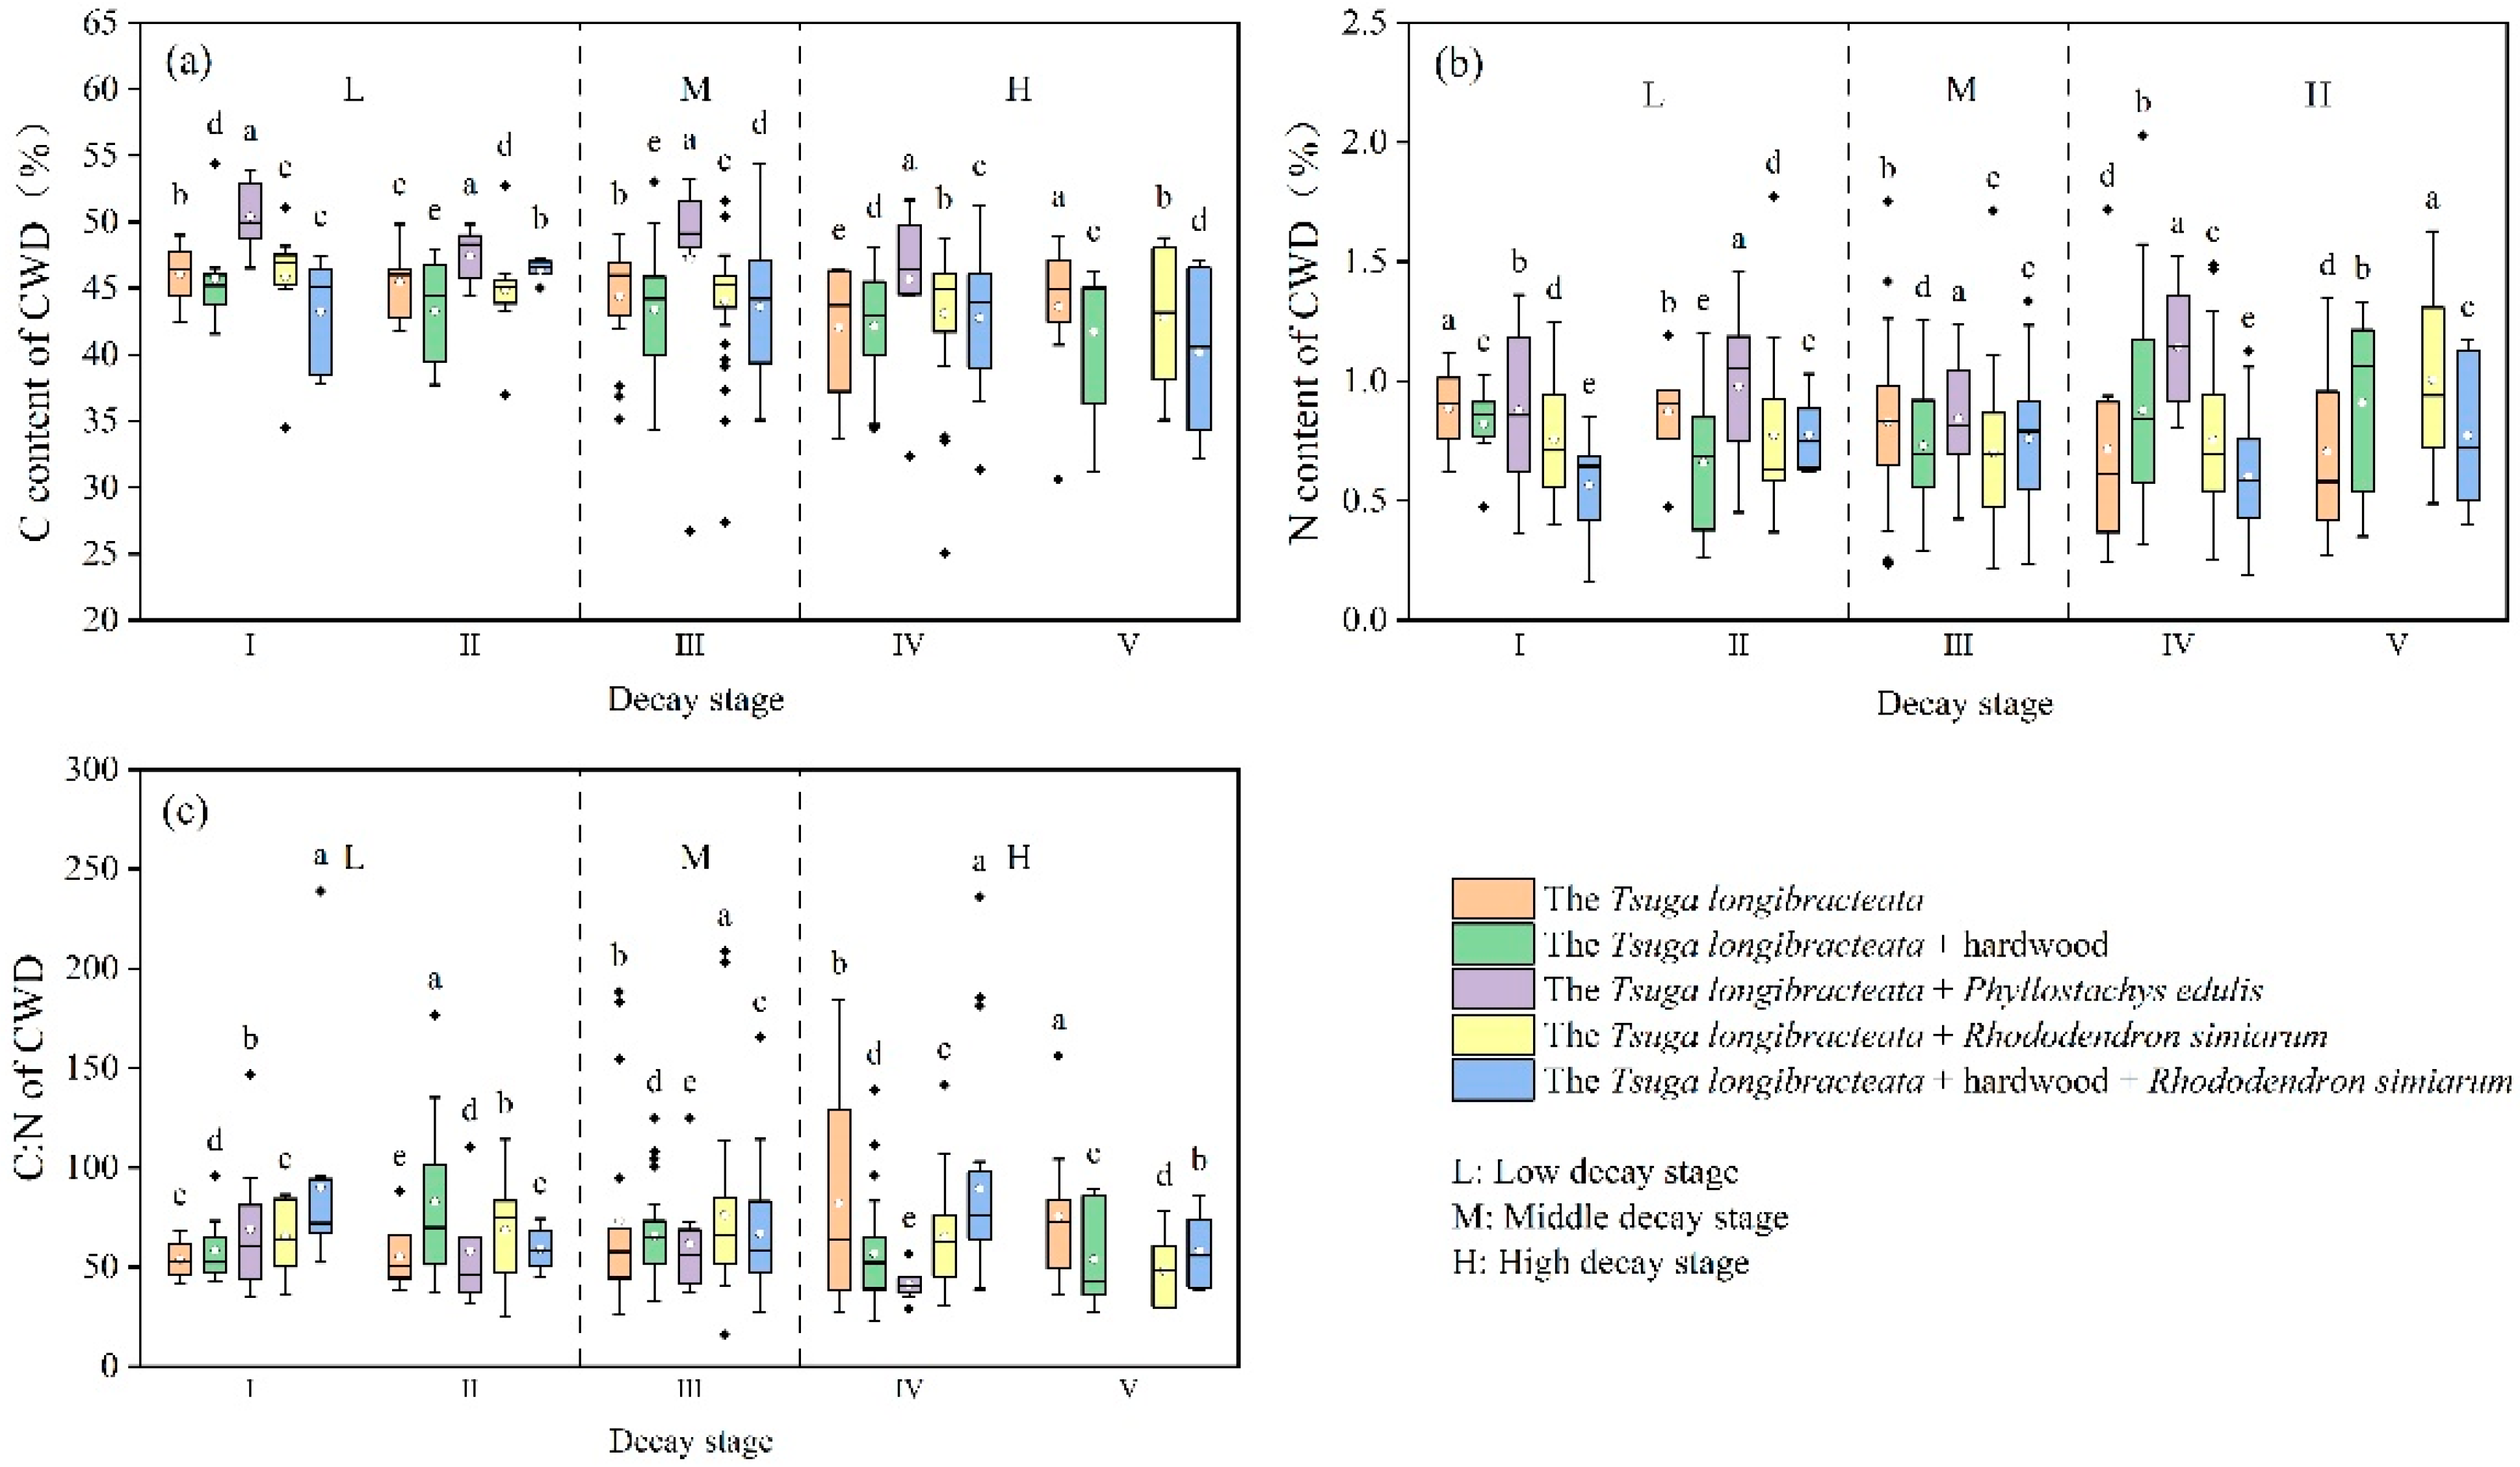
3.1.1. Comparison of Carbon and Nitrogen Content in CWD Across Different Decay Levels of Different Tsuga longibracteata Forests

The dynamic characteristics of carbon content among various forest types reveal that the Tsuga longibracteataPhyllostachys edulis mixed forest exhibits the highest carbon content (44.72%), while the Tsuga longibracteata–hardwood mixed forest shows the lowest (43.05%). The one-way ANOVA indicated significant differences in the carbon content of CWD across the five Tsuga longibracteata forest types within the nature reserve (p < 0.001). Multiple comparisons demonstrated that the Tsuga longibracteataPhyllostachys edulis mixed forest significantly differed from the other four forest types (Table 1). The nitrogen content of CWD in the five forest types, from highest to lowest, is as follows: the Tsuga longibracteataPhyllostachys edulis mixed forest (0.96%) > the Tsuga longibracteata–hardwood mixed forest (0.90%) > the pure Tsuga longibracteata forests (0.80%) > the Tsuga longibracteataRhododendron simiarum mixed forests (0.76%) > the Tsuga longibracteata–hardwood–Rhododendron simiarum mixed forests (0.68%). The ANOVA results (F = 2.169, df = 4, p = 0.072, η2 = 0.065) indicated no significant effect of forest type on CWD nitrogen content. The average C:N of CWD across the five forest types ranged from 57 to 77, ordered from lowest to highest as follows: the Tsuga longibracteataPhyllostachys edulis mixed forests (57.53), the Tsuga longibracteata–hardwood mixed forests (62.51), the Tsuga longibracteataRhododendron simiarum mixed forests (68.31), the pure Tsuga longibracteata forests (70.66), and the Tsuga longibracteata–hardwood–Rhododendron simiarum mixed forests (76.77). The one-way ANOVA indicated no significant differences among the five groups (F = 2.263, df = 4, p = 0.062, η2 = 0.068) (Table 1).
The density of CWD was highest in the Tsuga longibracteata–hardwood–Rhododendron simiarum mixed forests and lowest in the Tsuga longibracteata–hardwood mixed forests. The ANOVA results (F = 5.309, df = 3, p = 0.001, η2 = 0.114) indicate that forest type has a highly significant effect on CWD density. LSD showed significant differences between the Tsuga longibracteata–hardwood–Rhododendron simiarum mixed forests and both the Tsuga longibracteata–hardwood mixed forests and the Tsuga longibracteataRhododendron simiarum mixed forests (Table 1). The moisture content of CWD was highest in the Tsuga longibracteata–hardwood mixed forests and lowest in the Tsuga longibracteata–hardwood–Rhododendron simiarum mixed forests. No significant differences in CWD moisture content were observed among the different forest types (p > 0.05) (Table 1).
Overall, increased decay levels reduced the carbon content of CWD across all forest types (Figure 2). Compared to decay level I, C content declined by approximately 2.5% in pure forests, 4.0% in hardwood mixed forests, 4.7% in Phyllostachys edulis mixed forests, 3.1% in Rhododendron simiarum mixed forests, and 3.0% in hardwood–Rhododendron simiarum mixed forests. The most significant decrease in C content with increasing decay was observed in Tsuga longibracteataPhyllostachys edulis mixed forests, while the variation in Tsuga longibracteata pure forests was minimal. Analysis of variance showed no significant differences in CWD carbon content among the five decay levels (p > 0.05), indicating that, while mean C content varied, the differences were not statistically significant.
Nitrogen content in CWD showed significant variability across different forest types and decay stages, generally exhibiting an upward trend (Figure 2). The N content in Tsuga longibracteataPhyllostachys edulis mixed forests increased by 0.27%, the highest among the five forest types, while Tsuga longibracteata pure forests showed a decreasing trend with higher decay levels. Although the nitrogen content in mixed forests generally shows an increasing trend, the ANOVA results show that the differences in nitrogen content among the five decay levels across the five forest types are not significant (p > 0.05).
The C:N ratio of CWD varied significantly across different stages of decay, but generally trended downward (Figure 2). The C:N ratio for Phyllostachys edulis decreased from around 70 at level I to approximately 41 at level IV, a decline of 28, while the ratio for hardwood mixed forests changed insignificantly, dropping by only 4.5. The differences in C:N ratios among decay levels were not significant (p > 0.05). As decay progressed, CWD density generally decreased, while moisture content increased.
We treated the pure Tsuga longibracteata forests as the control group and the other four mixed forests as the treatment groups. The average C and N contents, along with the C:N ratios for both control and treatment group (pure and mixed forests) were calculated (Figure 3). Independent-sample t-tests were conducted for C, N, and C:N to analyze the differences in elemental contents between pure and mixed forests. The results reveal a highly significant difference in C content between Tsuga longibracteata pure forests and Tsuga longibracteataPhyllostachys edulis mixed forests (p < 0.01). Additionally, a significant difference was observed in N content between Tsuga longibracteata pure forests and Tsuga longibracteata–hardwood–Rhododendron simiarum mixed forests (p < 0.05).

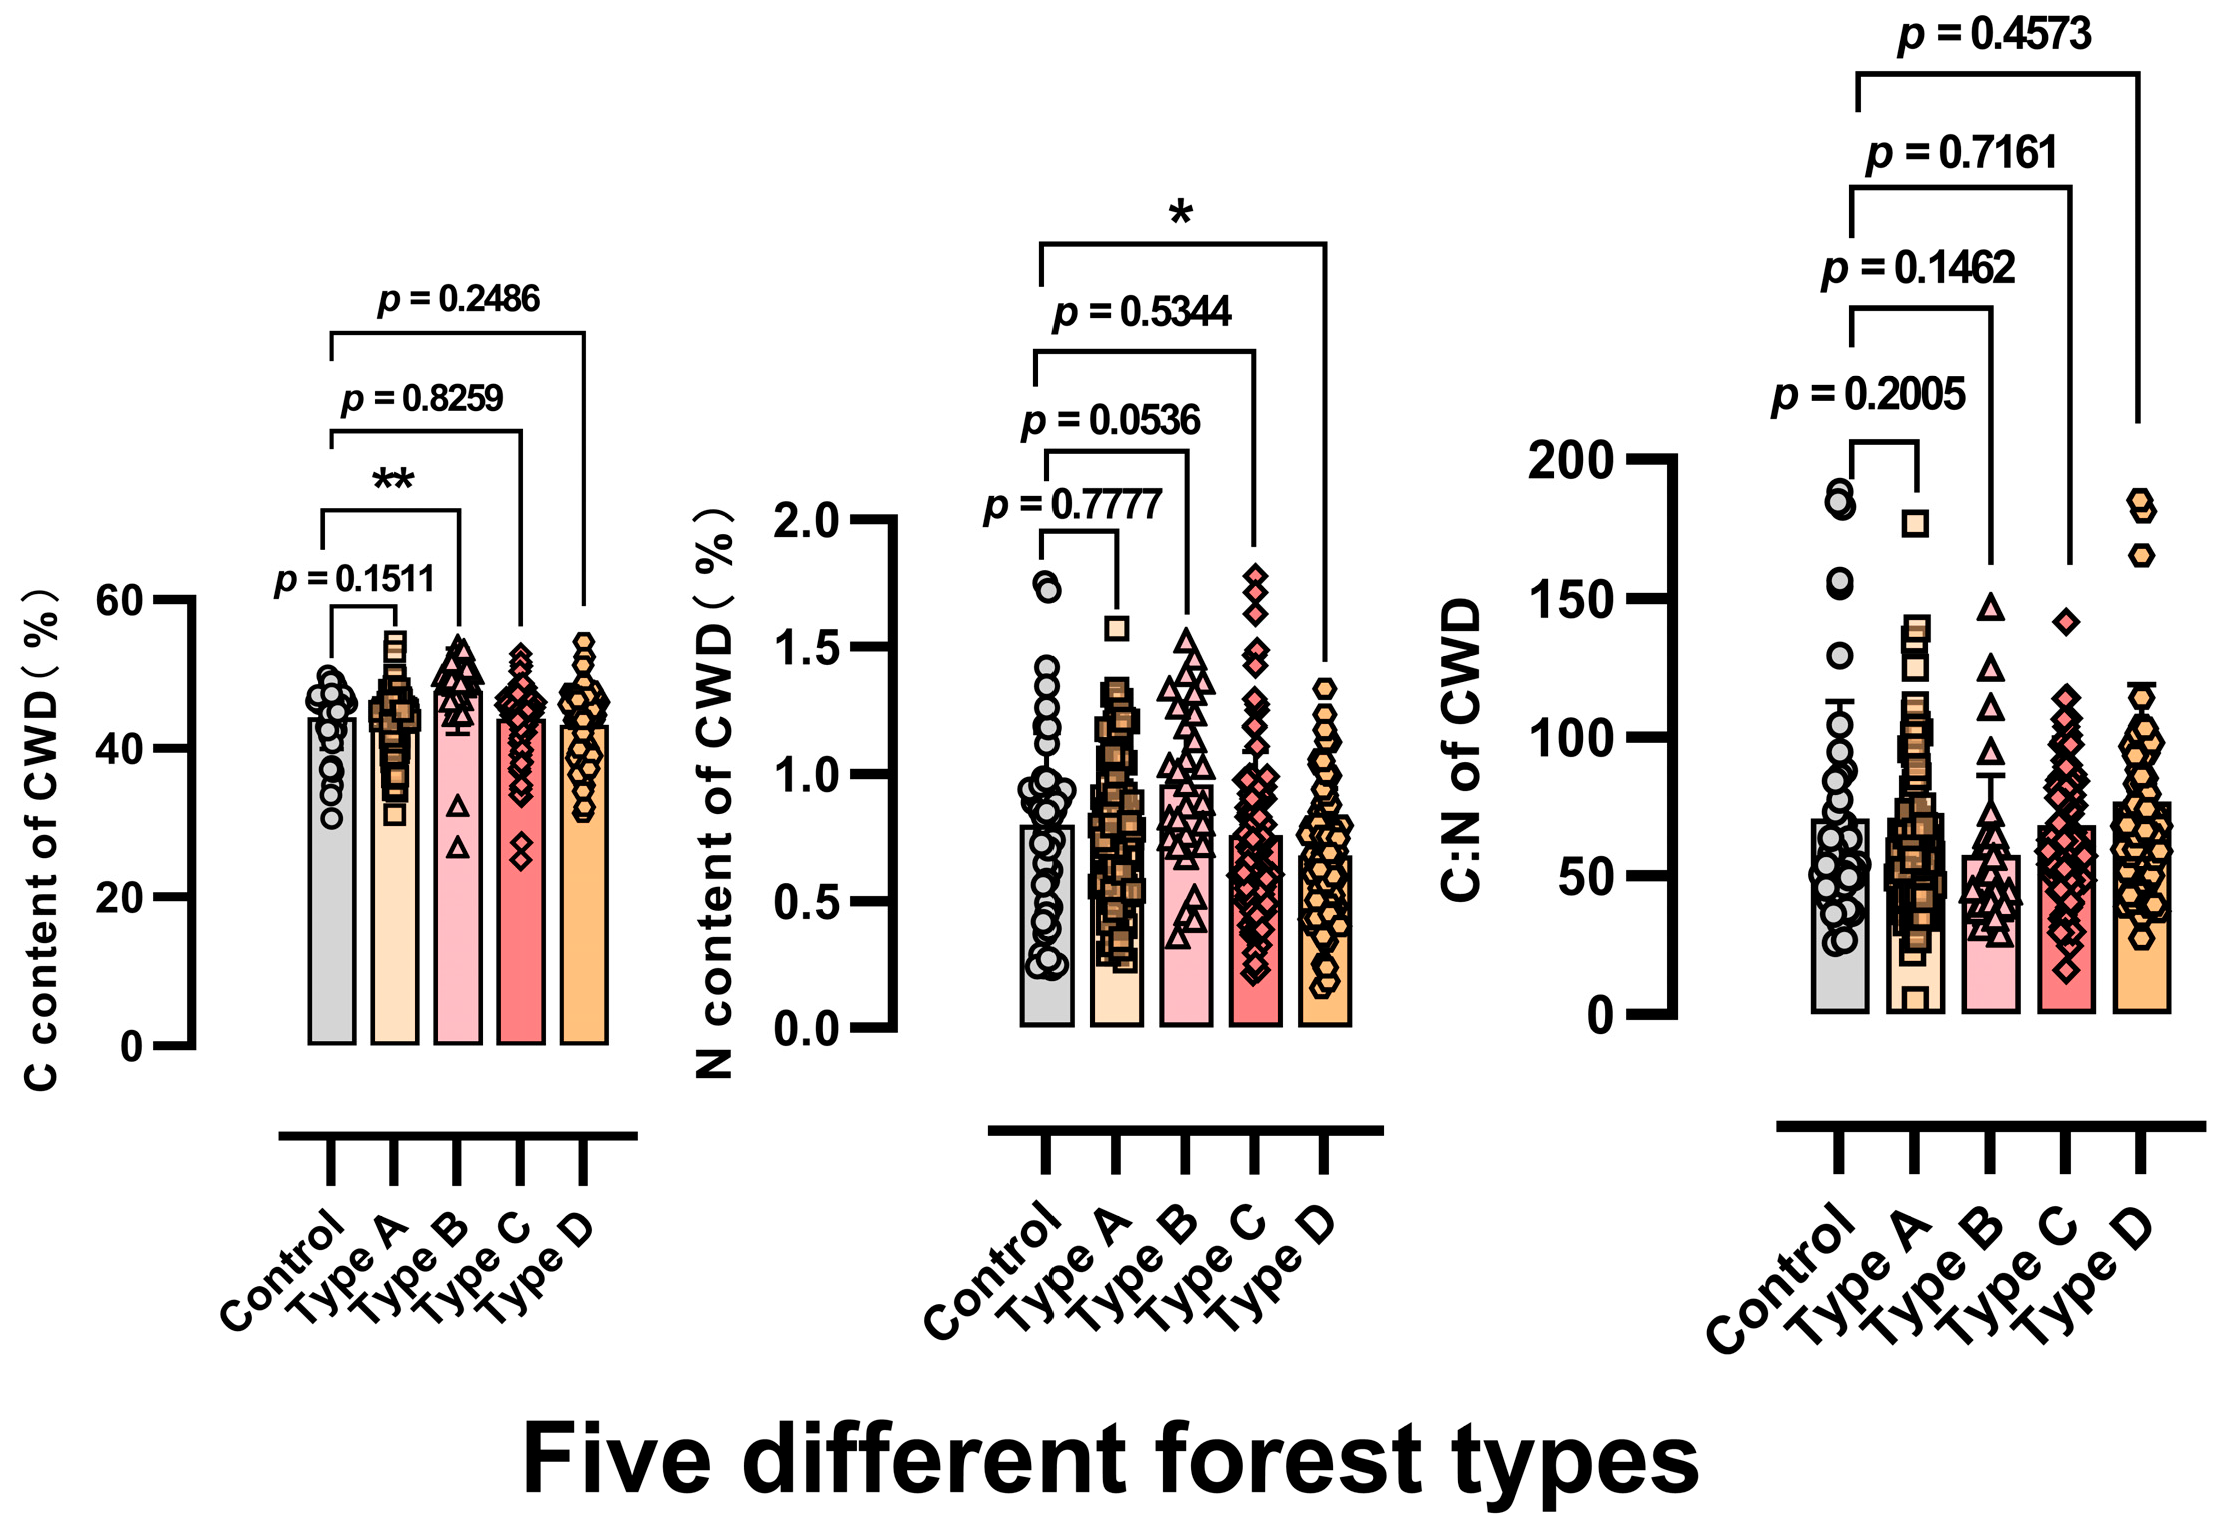
3.1.2. Effect of Tree Species Richness on the Carbon and Nitrogen Content of CWD in Tsuga longibracteata Forests

The carbon content of CWD decreases with increasing tree species richness (44.22% > 44.18% > 43.19%). The average carbon values for the three levels of species richness are very similar, and, according to the ANOVA results, there are no significant differences in carbon content among the three levels of richness (p > 0.05). The nitrogen content tends to increase and then decrease with increasing species richness (0.80%, 0.84%, 0.68%), although the differences are not substantial. According to the ANOVA results, there is no significant difference in nitrogen values among the three richness levels (p > 0.05). The C:N ratio is highest at a richness level of 1 (70.66) and lowest at level 2 (64.41). The C:N ratio shows no significant difference among the three richness levels (p > 0.05). The density of CWD increases in the order of richness levels 2, 1, and 3 (0.32 < 0.36 < 0.41), with significant differences in density observed between levels 2 and 3. There is little difference in moisture content across the three richness levels, with the lowest moisture content found at richness level 3 (0.39%) (Table 2). At richness level 2, carbon decreases the most rapidly, nitrogen increases fastest, and the C:N ratio shows the greatest decline. At richness level 1, carbon decreases more slowly, nitrogen also declines, and the C:N ratio increases (Figure S1).

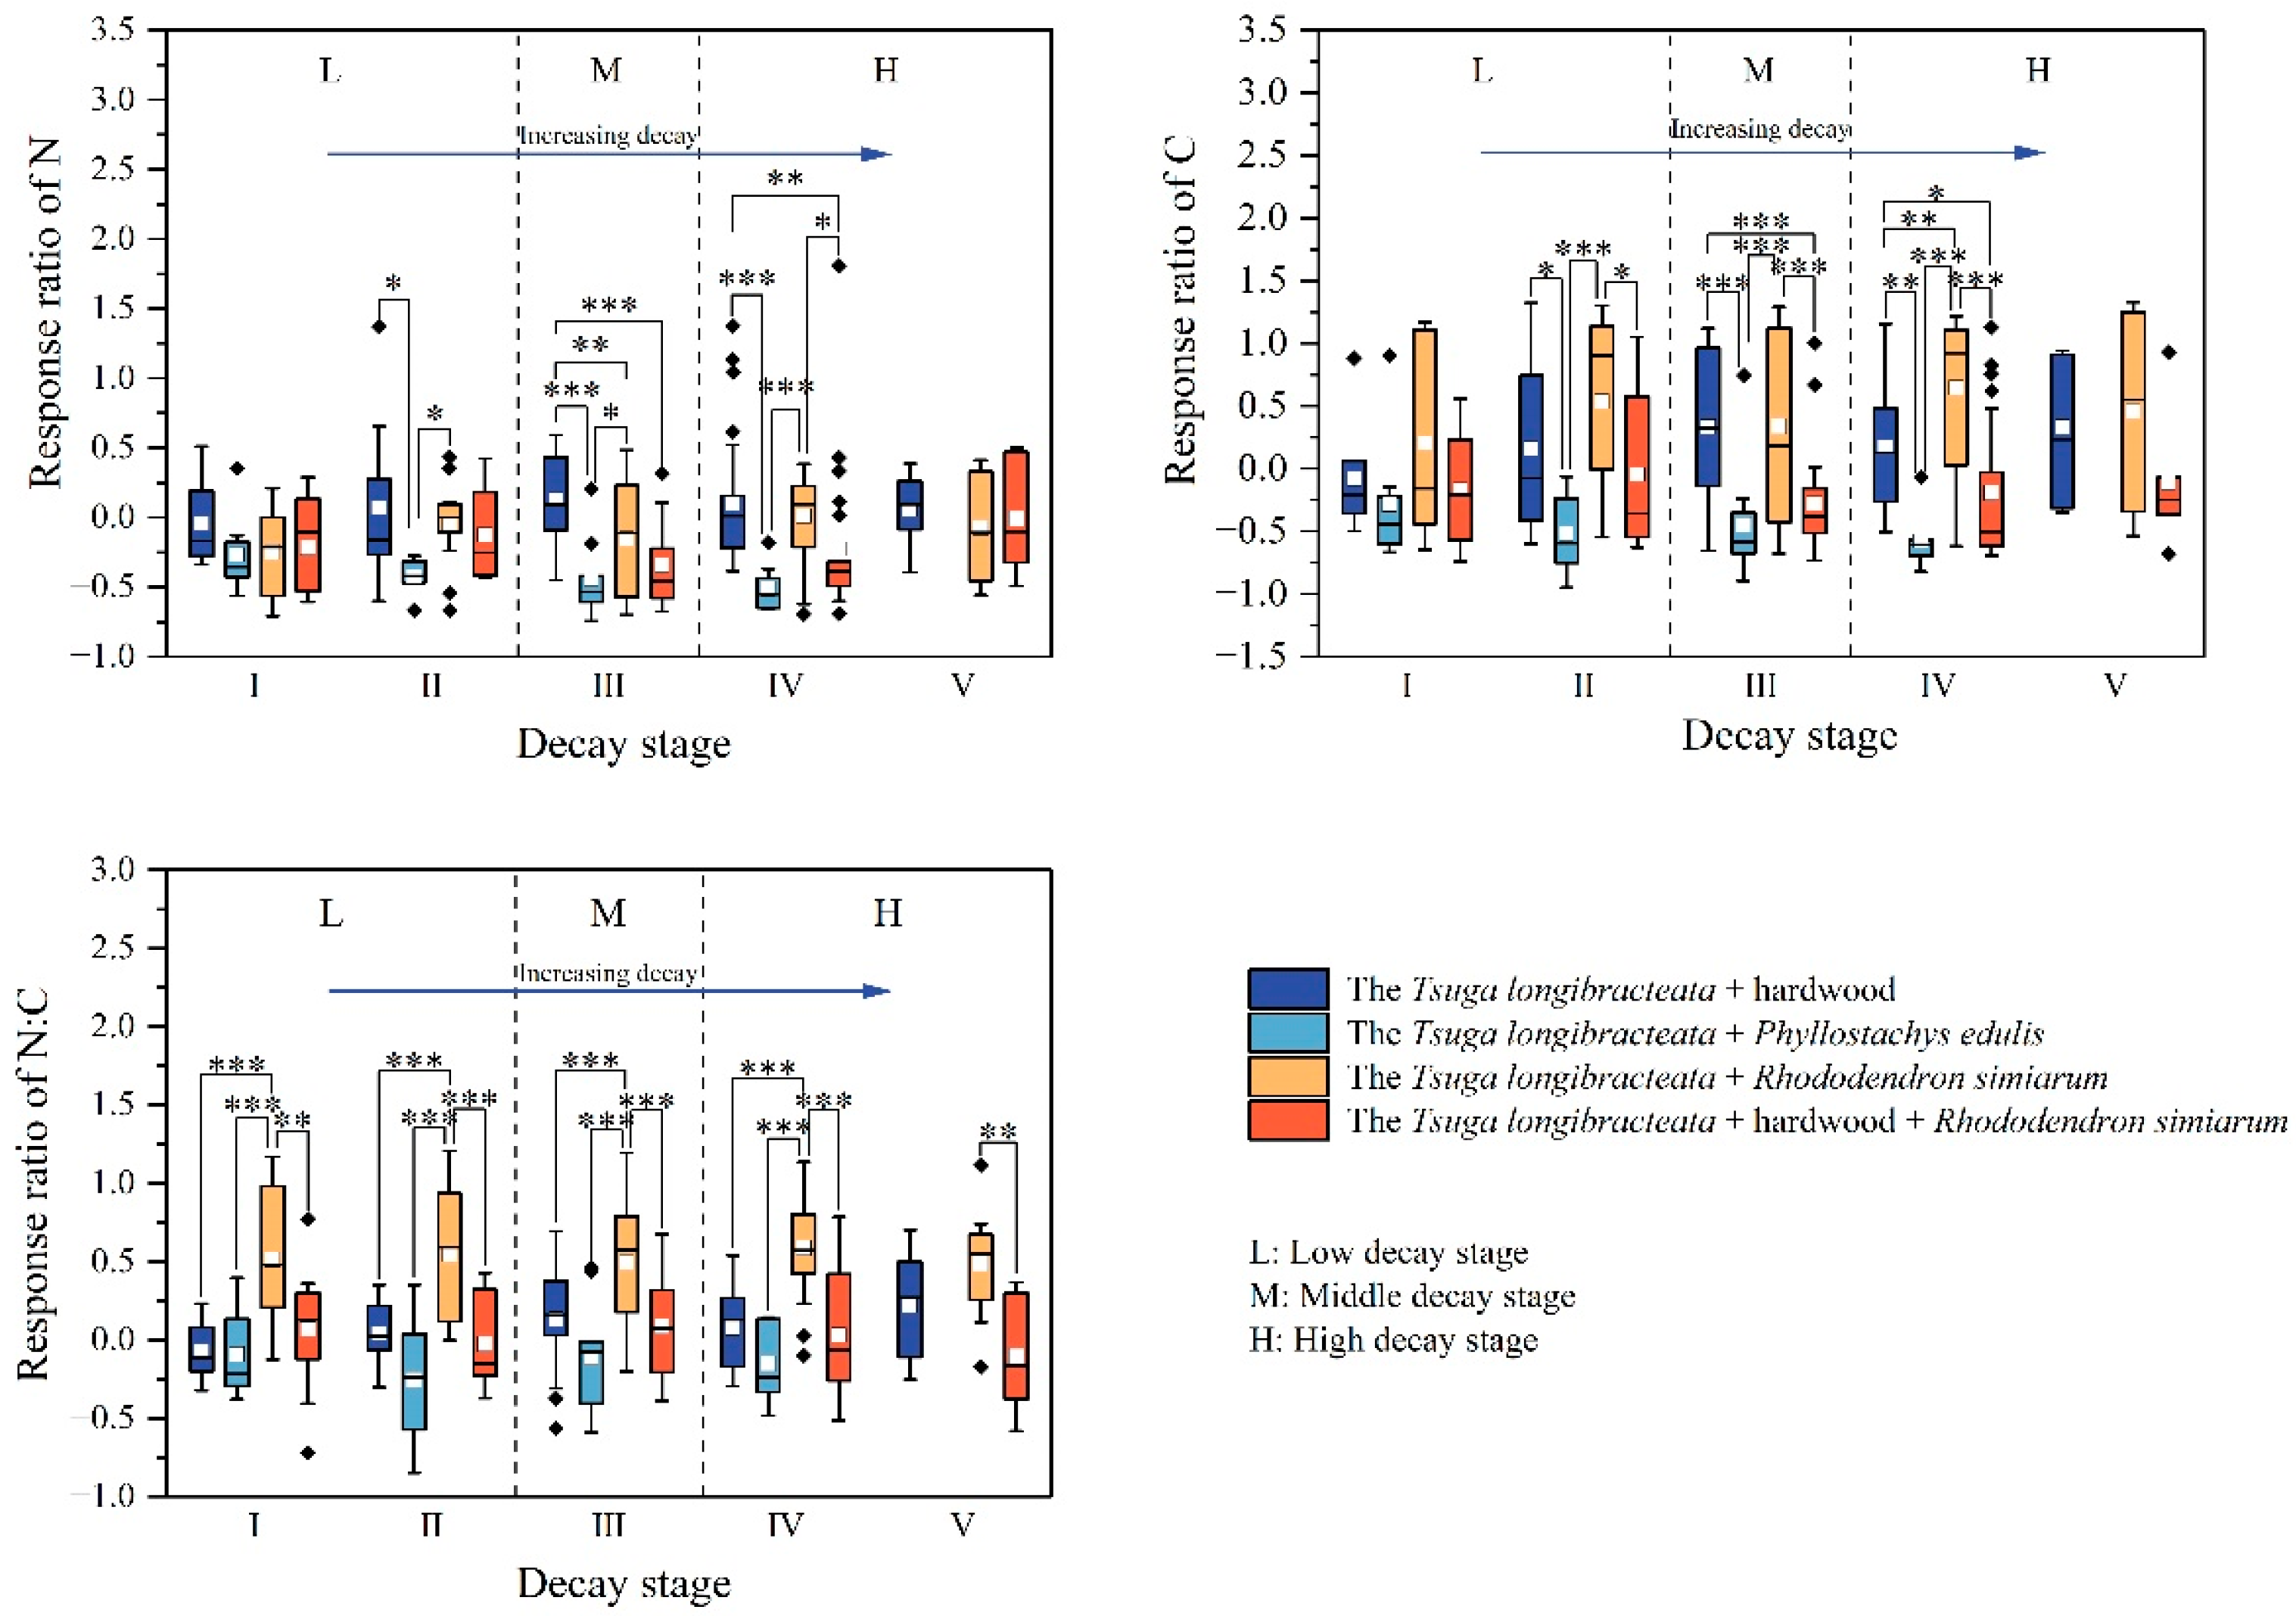
3.1.3. Effect of Vegetation Types on the Carbon and Nitrogen Content of CWD in Tsuga longibracteata Forests

The average carbon content in the CWD of tree forests (44.27%) is higher than in tree–shrub mixed forests (43.69%), with no significant difference between the two (p > 0.05). The nitrogen content in the CWD of tree forests (0.88%) is also higher than in tree–shrub mixed forests (0.73%), and there is a significant difference (p < 0.05). However, the C:N ratio in the CWD of tree forests (63.95) is lower than in tree–shrub mixed forests (71.86), with a significant difference (p < 0.05). The density of CWD in tree forests (0.32) is lower than in tree–shrub mixed forests (0.37), and the difference is significant (p < 0.05). The moisture content in the CWD of tree forests (0.44%) is higher than in tree–shrub mixed forests (0.41%), but the difference is not significant (p > 0.05) (Table 3). The overall slope for carbon in tree forests is steeper than in tree–shrub mixed forests. However, from the second decay stage onward, the carbon release rate in tree–shrub mixed forests is noticeably higher than in tree forests. Nitrogen content decreases in tree forests from decay stage I to V, while nitrogen content in tree–shrub mixed forests shows an increasing trend. The C:N ratio increases in tree forests, but decreases in tree–shrub mixed forests (Figure S2).

3.2. Comparison of Carbon and Nitrogen Content in the Adjacent Soil Layers Beneath the CWD of Different Tsuga longibracteata Forests

The carbon (11.02%) and nitrogen (0.93%) contents, as well as the C:N ratio (10.99), in the adjacent soil layers beneath the CWD in the Tsuga longibracteataPhyllostachys edulis mixed forests are the lowest among the five forest types. In contrast, the Tsuga longibracteataRhododendron simiarum mixed forests exhibit the highest carbon content (29.21%) and C:N ratio (19.62), while the Tsuga longibracteata–hardwood mixed forests show the highest nitrogen content (1.72%). Significant differences in carbon and nitrogen contents, as well as C:N ratios, were observed across the five forest types, with the C:N ratio showing the most pronounced differences (Table 4).
Take the pure Tsuga longibracteata forest as the control group and the other four mixed forests as the treatment groups. Calculate the relative response ratio of C, N, and C:N content in the soil of the mixed forests (treatment groups) at each decomposition level compared to the soil of the pure forest (control group).
In the case of the Tsuga longibracteataPhyllostachys edulis mixed forests, the response ratio for carbon in the soil at each decay level was the most negative among the five forest types. Moreover, the negative effect became more pronounced as the decay level increased. This indicates that, relative to the carbon content in the soil of the pure Tsuga longibracteata forests, the carbon content in the Tsuga longibracteataPhyllostachys edulis mixed forest soil was increasingly reduced by the mixed forest effects and other factors; conversely, the Tsuga longibracteataRhododendron simiarum mixed forests exhibited the largest positive response ratio across all five decay levels, with a trend of increasing positive effects as the decay level advanced. This suggests that the carbon content in the Tsuga longibracteataRhododendron simiarum mixed forests was enhanced by the mixed forest effects and other potential factors; the response ratio for the Tsuga longibracteata–hardwood–Rhododendron simiarum mixed forests was near zero, indicating that their carbon content was close to that of the pure Tsuga longibracteata forests. Nitrogen response ratios were generally within ±0.5, indicating no significant difference from pure forests. The average response ratios were mostly negative, suggesting a decrease in nitrogen content in the mixed forests compared to the pure forests. The Tsuga longibracteataPhyllostachys edulis mixed forest showed the most negative response, which became stronger with the increase in decay levels. The Tsuga longibracteata–hardwood mixed forests exhibited the largest positive response, with nitrogen content showing a slight increase at decay level V compared to level I. The Tsuga longibracteataRhododendron simiarum mixed forest exhibited the most positive response, while the Tsuga longibracteataPhyllostachys edulis mixed forest showed the largest negative response. The remaining two mixed forest types had response ratios close to zero. Moreover, the Tsuga longibracteataPhyllostachys edulis mixed forests have the lowest soil C:N response ratio, indicating that the high decomposition rates observed in Phyllostachys edulis mixed forests led to rapid N uptake by microbial communities, preventing long-term accumulation in the soil (Figure 4).
The differences in carbon content in the topsoil layer among the three richness levels are highly significant (p < 0.001), with the highest carbon content observed at a species richness of 2 (24.65%) and the lowest at 3 (16.94%). According to the lowercase letters in the table, there are significant differences between richness 2 and richness levels 1 and 3 (p < 0.05). The mean nitrogen values among the three species richness levels are very similar, indicating that variations in species richness do not significantly affect the average nitrogen content, as confirmed by the one-way ANOVA (p > 0.05). The C:N ratio shows highly significant differences among the three richness levels (p < 0.001), with the highest ratio at richness 2 (16.12) and the lowest at richness 1 (12.81). Significant differences were also found between richness 2 and richness levels 1 and 3 (p < 0.05) (Table S2).
The average carbon content in the soil of the pure tree forest (20.56%) is lower than that of the tree–shrub mixed forest (24.10%), with a significant difference between the two (p < 0.05). The nitrogen content in the pure tree forest (1.53%) is higher than that in the tree–shrub mixed forest (1.44%), but the difference is not significant (p > 0.05). Meanwhile, the C:N ratio in the pure tree forest (13.04) is lower than that in the tree–shrub mixed forest (16.93), with a highly significant difference between the two (p < 0.001), which is consistent with the difference in carbon content (Table S3).
Species richness exerted a negative impact on soil carbon content, whereas vegetation type had a positive effect, with the latter showing a stronger influence. In contrast, species richness had a positive effect on nitrogen, while vegetation type showed a negative impact on nitrogen. Notably, the absolute path coefficients for vegetation type were higher than those for species richness. Both species richness and vegetation type positively influenced the C:N ratio, but the effect of vegetation type was significantly stronger, which suggests that forest structure, rather than tree diversity alone, drives decomposition and nutrient retention. The interrelationships between carbon, nitrogen, and C:N ratio were largely consistent across the two graphs. Carbon had a highly significant positive effect on both nitrogen and the C:N ratio, with a particularly strong influence on the C:N ratio. Nitrogen, on the other hand, exerted a highly significant negative effect on the C:N ratio. In the species richness model, the effects of carbon and nitrogen on the C:N ratio were more pronounced, while in the vegetation type model, carbon’s effect on nitrogen was more dominant (Figure 5). The findings suggest that the mixed forest design should balance species richness and vegetation structure to optimize soil nutrient retention and decomposition rates.

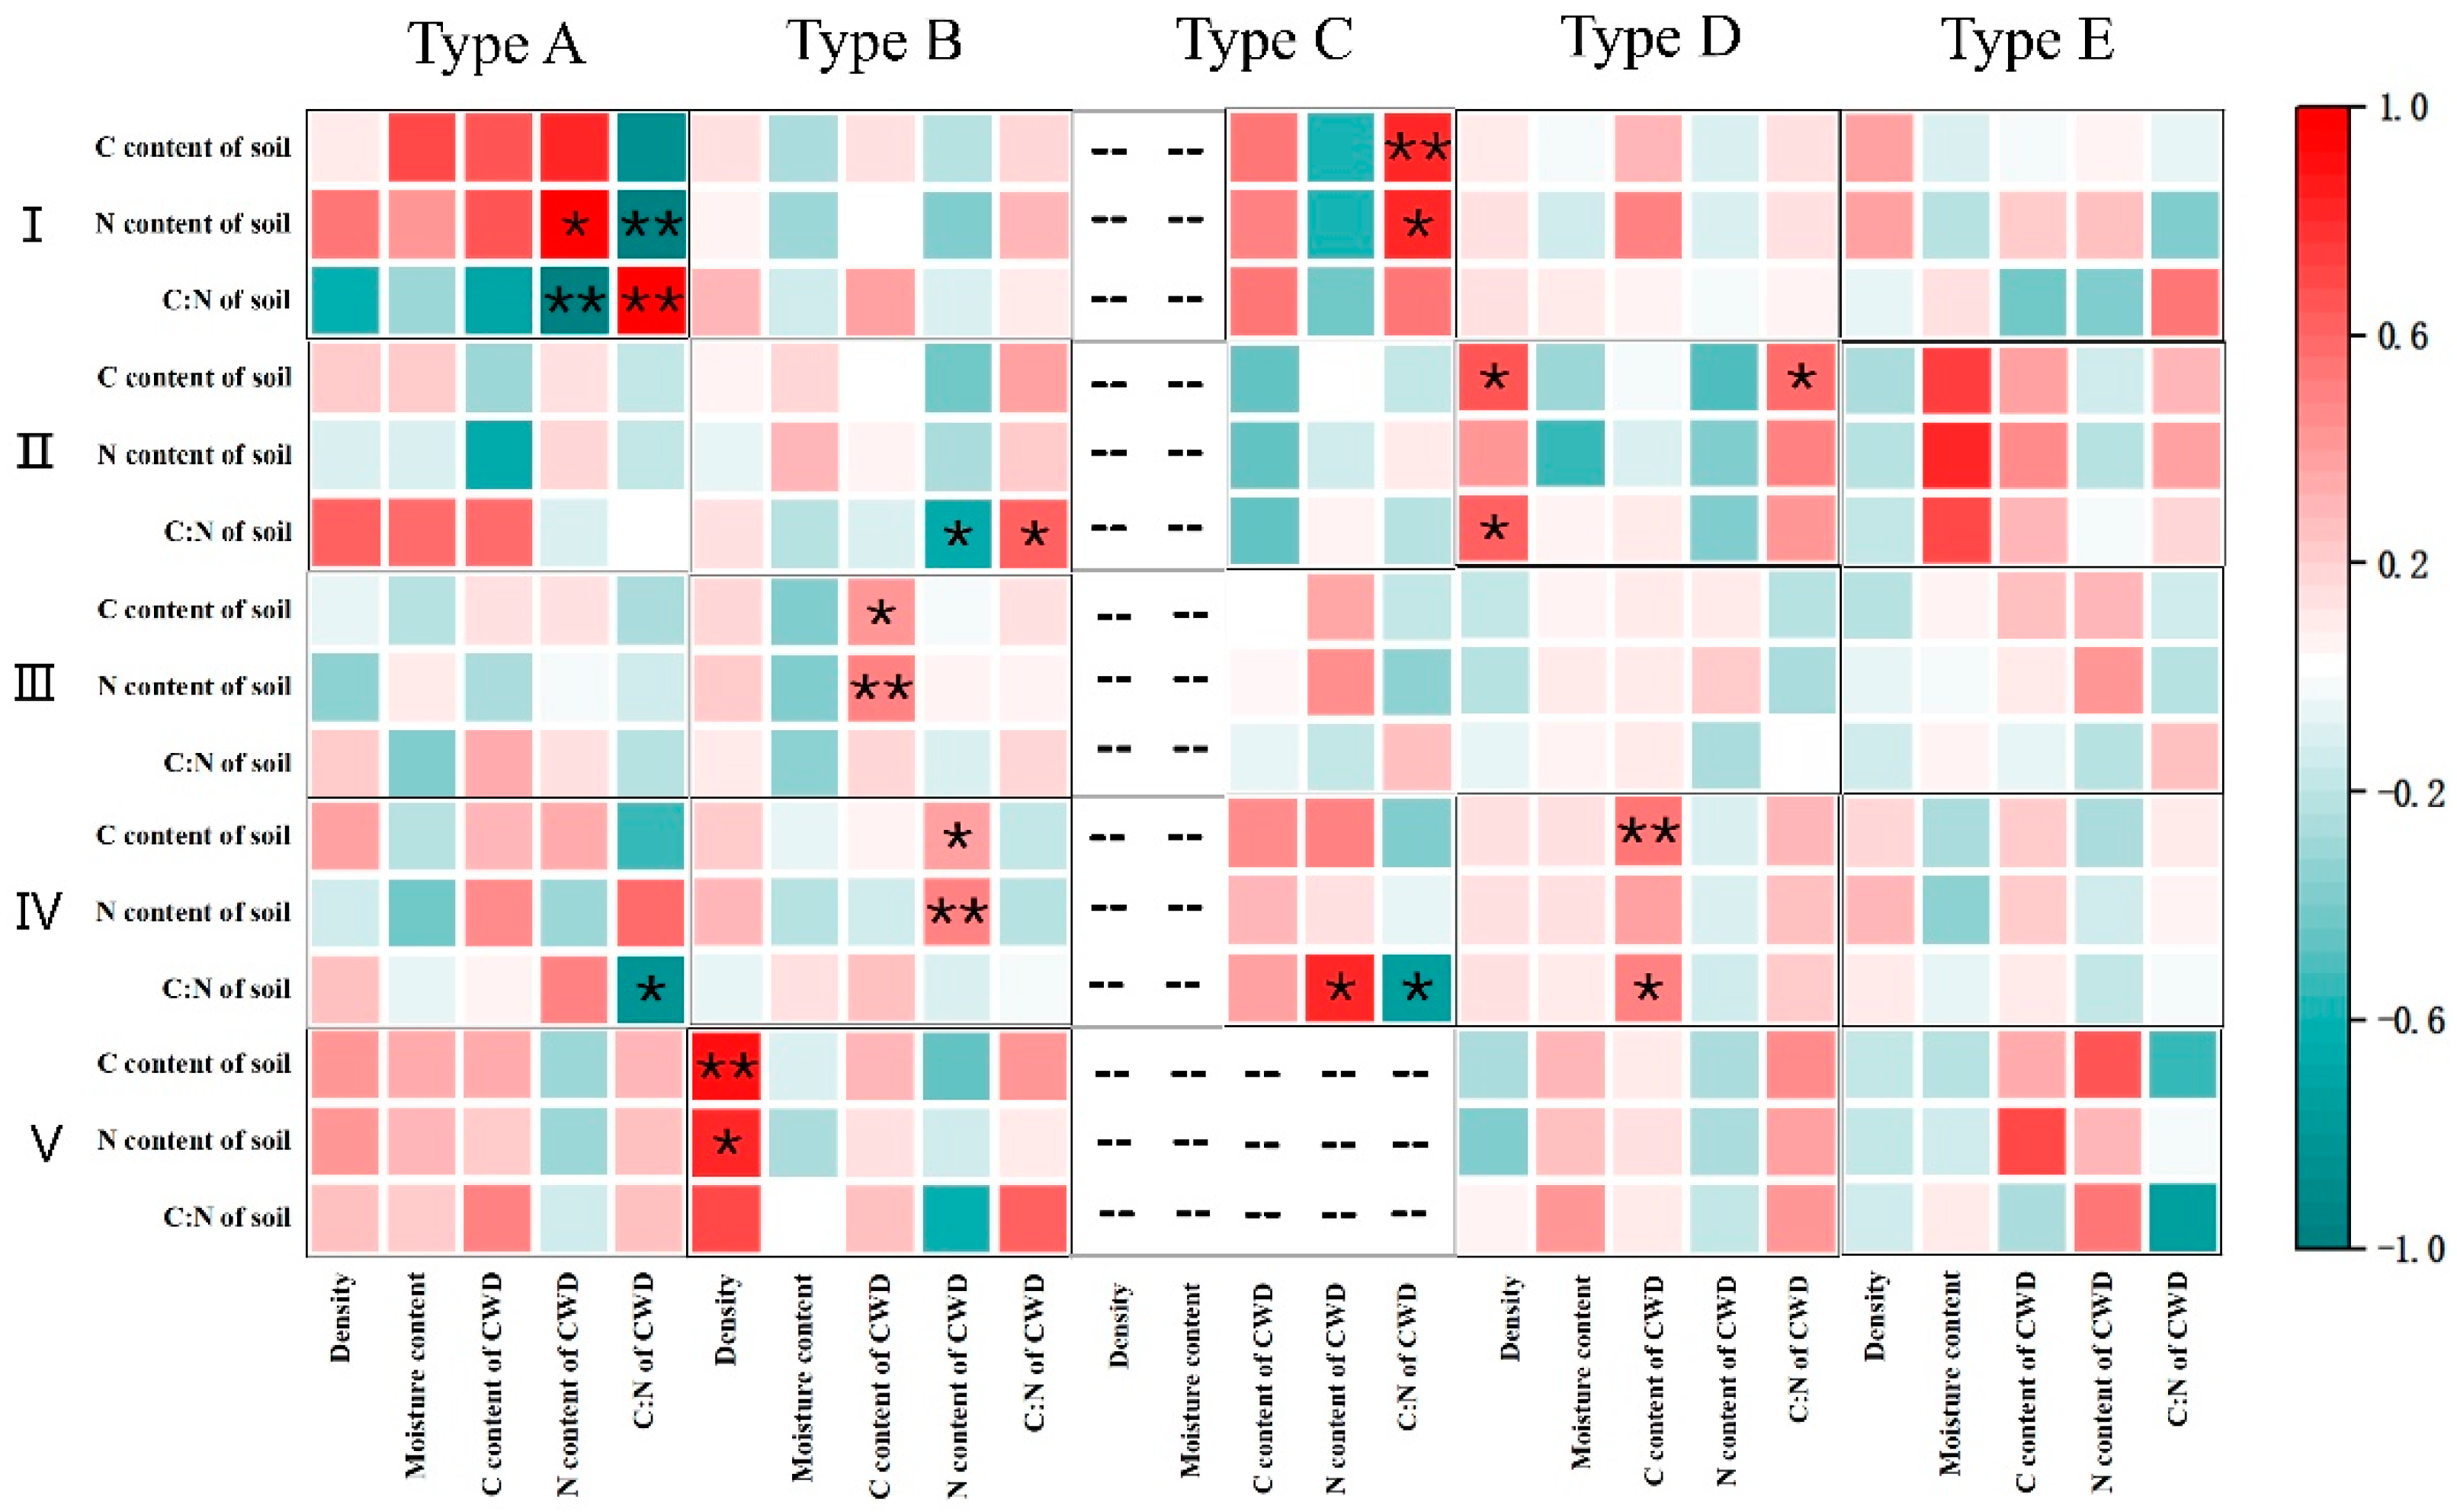
3.3. The Relationship Between C, N, and C:N Ratio in the Soil Layer Adjacent to CWD, and the Physicochemical Properties of CWD

According to the principal component analysis (PCA) results (Figure 6), the distribution of various variables in the CWD and the adjacent surface soil layer can be observed. The longer the arrow, the greater the influence of the variable on the principal components. The PCA plot Figure 6a shows that, in the pure tree forest, Axis 1 and Axis 2 explain 32.2% and 22.8% of the total variation, respectively. The direction of soil carbon content and soil C:N ratio overlaps with an angle of 0°, indicating a strong correlation between them. Soil nitrogen and CWD carbon also form small angles with these two variables, suggesting a strong correlation among all four variables. The nitrogen content and C:N ratio of CWD form an angle close to 180°, as does CWD moisture content with both CWD density and soil nitrogen content, indicating a strong negative correlation. From Figure 6b,d,e, it can be seen that, in the mixed forests, the angle between CWD density and moisture content is approximately 180°, and both variables form an angle of about 90° with the soil C:N ratio, indicating that CWD density and moisture content are essentially unrelated to the soil C:N ratio. Across all five figures, the angles among soil carbon, nitrogen, and the C:N ratio in the five forest types are consistently small, indicating a strong correlation among these three variables. Meanwhile, the nitrogen content and C:N ratio of CWD consistently form an angle close to 180°, suggesting a strong negative correlation between them.
The correlation heatmap indicates that, for all five forest types, the color intensity is darker at decay stages I, II, IV, and V, and lighter at stage III. This suggests that correlations between the CWD’s physicochemical properties and the soil’s physicochemical properties are stronger during the early and late stages of decomposition and weaker during the mid-stage. In other words, the correlation initially decreases and then increases as decomposition progresses. In the pure forest at decay stage I (early CWD decomposition), there is a significant positive correlation between CWD nitrogen and soil nitrogen (p < 0.05), as well as an extremely significant positive correlation between the C:N ratio of CWD and C:N ratio of soil (p < 0.01). Additionally, CWD nitrogen shows a significant negative correlation with soil C:N ratio, and the C:N ratio of CWD shows a significant negative correlation with soil nitrogen (p < 0.01). In the hardwood mixed forest, the correlation is strongest at decay stage V, where CWD density has a significant positive correlation with both soil carbon content (p < 0.01) and nitrogen content (p < 0.05). For the Phyllostachys edulis mixed forest, the strongest correlations occur at both the early stage (decay stage I) and the late stage (decay stage IV), while at decay stage III, the correlation approaches zero, indicating minimal interaction between CWD and soil variables at this stage. In the Rhododendron simiarum mixed forest, correlations are strongest at decay stages II and IV. Specifically, at stage II, CWD density shows a significant positive correlation with soil carbon content and CWD ratio (p < 0.05). In the hardwood–Rhododendron simiarum mixed forest, the most pronounced correlations are found at decay stages II and V (Figure 7).

4. Discussion

4.1. Analysis of the Variation in CWD Carbon and Nitrogen Content at Different Decomposition Stages in Different Forest Types

The above analysis indicates that the carbon release from CWD in Tsuga longibracteata mixed forests exhibits a consistent declining trend across different forest types (Figure 2). However, significant differences in CWD carbon content were observed between forest types (p < 0.001) (Table 1). Despite this, the decomposition stages of the five forest types did not significantly influence the carbon concentration in CWD, likely due to a combination of factors, including species-specific characteristics, stand features, forest management practices, and site conditions [48,49,50]. During CWD decomposition, processes such as fragmentation, respiration, and leaching from rainfall lead to its loosening and softening, resulting in a reduction in density. As CWD decomposes, its lignocellulose and organic matter are gradually broken down by fungi, bacteria, and other microorganisms. These microbes oxidize the organic matter into carbon dioxide and water, which increases the moisture content of CWD, while releasing energy to sustain their growth and metabolism. This process leads to the release of carbon atoms from CWD, with some carbon being emitted as CO2 gas into the atmosphere [51] and the rest being leached into the soil by rainwater. As a result, the carbon content of CWD decreases with advancing decomposition stages.
The nitrogen content of CWD in different forest types exhibits considerable fluctuation across various stages of decomposition, but overall it shows an increasing trend (Figure 2). No significant differences were found in the nitrogen content of CWD across different decomposition stages for any of the forest types. The significant variations in nitrogen concentrations of CWD among tree species in this study may be attributed to inherent differences in nitrogen absorption characteristics. Higher nitrogen concentrations in CWD tend to accelerate decomposition rates. Previous studies have shown that high nitrogen content can meet the nitrogen demands of microbial decomposition, facilitating the normal growth, metabolism, and reproduction of microorganisms, thereby accelerating the decomposition of coarse woody debris. Consequently, higher initial nitrogen concentrations result in faster CWD decomposition. The C:N ratio is also an important indicator of decomposability; a higher C:N ratio indicates that the plant material contains more resistant compounds, making it more difficult to decompose.
In this study, the carbon and nitrogen content in the CWD of the Tsuga longibracteataPhyllostachys edulis mixed forest was significantly higher than in the other four forest types (Table 1), while the carbon and nitrogen content in the adjacent soil layer of CWD was notably the lowest (Table 4). The differences in CWD carbon content could be attributed to variations in lignin concentrations among tree species, as the carbon concentration in CWD is positively correlated with lignin concentration [48]. Phyllostachys edulis, growing in a highly competitive environment, benefits from its high lignin concentration, which enhances structural strength and resistance to environmental stress. With a relatively short growth cycle, Phyllostachys edulis may accumulate high levels of lignin in a short period, especially during its rapid growth phase. This high lignin content helps Phyllostachys edulis maintain a competitive edge over Tsuga longibracteata. As a result, the decomposition of CWD requires higher nitrogen concentrations to offset the inhibitory effects of lignin, thus accelerating the overall decomposition rate. Microorganisms play a crucial role in decomposition and nutrient cycling. During the decomposition of CWD, nitrogen content increases. Higher microbial activity in the Tsuga longibracteataPhyllostachys edulis mixed forest has accelerated the decomposition of litter and nutrient turnover. Consequently, CWD in the Phyllostachys edulis mixed forest has the highest carbon and nitrogen content.
This study also reveals that the carbon and nitrogen content in the soil adjacent to CWD in the Phyllostachys edulis mixed forest is the poorest (Table 4). This could be due to the well-developed root system of Phyllostachys edulis, which competes for the soil’s carbon and nitrogen to support its growth. During decomposition, the plant absorbs large amounts of nitrogen from the soil to counterbalance the inhibitory effects of lignin, leading to a marked decrease in soil carbon and nitrogen content. However, long-term monitoring is still needed to assess whether the decline in soil carbon and nitrogen will reduce productivity. The carbon content and C:N ratio in the soil adjacent to CWD in the Phyllostachys edulis mixed forest exhibit the greatest variation from level I to level V (Figure 4), which can be attributed to the inherent properties of the CWD itself. As a softwood with relatively low density and loosely arranged lignin fibers, Phyllostachys edulis decomposes more quickly. Higher decomposition rates mean that microorganisms consume larger amounts of nitrogen to break down organic matter. If nitrogen availability in the soil is insufficient, more carbon may be released as CO2 rather than being stabilized as soil organic carbon. A decreasing C:N ratio in soil suggests increased microbial activity and nitrogen mineralization. This pattern was particularly evident in Phyllostachys edulis forests, indicating rapid nutrient cycling but potential long-term soil nitrogen depletion. As a result, the carbon and nitrogen content in the CWD is the highest, while the soil carbon and nitrogen content is the lowest. Therefore, it can be concluded that mixed forests do not always have ecological advantages over pure forests, and inappropriate mixing methods may result in soil depletion. Under certain conditions, the rapid growth of Phyllostachys edulis can effectively sequester carbon, contributing to climate change mitigation. However, the low soil carbon and nitrogen content may reduce soil fertility, impairing plant growth and the long-term stability of the ecosystem. Rapid decomposition of CWD may reduce long-term carbon storage. The accelerated decomposition of organic matter and nitrogen consumption may lead to nutrient loss, affecting subsequent vegetation growth. This pattern indicates that the rapid decomposition of Phyllostachys edulis CWD leads to high nutrient turnover, but it restricts the stabilization of soil carbon, potentially impacting long-term soil fertility. If Phyllostachys edulis becomes dominant in mixed forests, it may inhibit the growth of other species and reduce biodiversity. Additionally, its high growth requirements could result in excessive soil moisture consumption, which may disrupt the ecosystem’s water balance. Our findings suggest that species composition should be carefully managed to balance rapid decomposition with soil nutrient retention. Phyllostachys edulis dominance may require periodic soil amendments to prevent long-term nitrogen depletion.
The lignin content in hardwoods is the lowest among the four tree species, likely because hardwoods, as tall trees, exhibit strong environmental adaptability and have a relatively lower requirement for lignin. In contrast, the Tsuga longibracteata–hardwood mixed forests show lower CWD density, but higher nitrogen content and water retention capacity, leading to faster decomposition (Table 1). The increase in CWD nitrogen concentration may be attributed to the reduction in density and the accumulation of microorganisms and nitrogen [50]. Moreover, the growth mechanism of hardwoods is less complex compared to Phyllostachys edulis, allowing for more carbon from CWD to be transferred into the soil, resulting in higher carbon and nitrogen content in the soil compared to pure forests. This demonstrates a more favorable mixed-forest effect.
This study found that the carbon content in both the CWD and soil of the Tsuga longibracteata pure forests is moderate (Table 1 and Table 4). Meanwhile, the nitrogen content in CWD exhibits a slow decreasing trend (Figure 2), with a relatively high C:N ratio (Table 1), and the nitrogen content in the adjacent topsoil is also higher (Table 4). During the decomposition process, the change range from stage I to stage V is the smallest in the Tsuga longibracteata pure forests, with the slowest decomposition rate (Figure 2). This could be due to the relatively high C:N ratio of CWD, where microorganisms preferentially consume nitrogen to decompose the carbon sources, leading to a decrease in nitrogen content. At the same time, the consumption of nitrogen slows down the decomposition process. Additionally, the low biodiversity in the pure forest may result in lower microbial activity, restricting the decomposition process and causing slower nitrogen consumption. Furthermore, Tsuga longibracteata typically contains higher lignin content, which complicates and slows down the decomposition process. As a hardwood species with higher density, Tsuga longibracteata is also more resistant to decomposition. Our results support Hypothesis 1: decomposition rates and nutrient cycling vary among forest types, with the Phyllostachys edulis mixed forest showing the highest decomposition rate and CWD carbon and nitrogen content (Figure 2, Table 1). Hypothesis 2 is not supported; while mixed forests can enhance nutrient cycling, improper mixing (e.g., Phyllostachys edulis dominance) may lead to soil depletion.

4.2. The Impact of Tree Species Richness on CWD Decomposition Rates and Soil Carbon and Nitrogen Content

As the decomposition level increases, the rate of decline in carbon content in CWD is fastest at a tree species richness of 2, moderate at 3, and slowest at 1. In contrast, the rate of nitrogen increase in CWD is greatest at a richness of 2, while at a richness of 1, nitrogen content decreases. In forest types with a richness of 2, the nitrogen concentration in CWD is highest, and the C:N ratio is lowest, whereas the opposite is true for a richness of 1 (Figure S1). This indicates that at a richness of 2, CWD decomposition occurs the fastest, while at a richness of 1, decomposition is slowest. Additionally, the carbon content in the soil is highest at a richness of 2, with relatively high nitrogen content as well (Table S2). The observed slowdown at higher species richness levels may be attributed to competitive interactions reducing microbial efficiency or differences in litter quality leading to slower decomposition rates [52,53]. In plots with a richness of 3, differences in tree species characteristics also influence the abundance and activity of detritus. Although the effect size is small, the reduced species richness in the stand decreased the decomposition rate, which could be associated with slightly lower soil moisture in more species-rich plots and the presence of certain tree species. This might suggest a species complementarity or sampling effect. Despite the relatively small effect size, tree species richness can lower the decomposition rate of detritus in forests. Furthermore, at a richness of 3, the carbon and nitrogen content in the soil is at its lowest, even lower than that of pure forests (Table S2). This may be due to the competition among multiple tree species for water, nutrients, and light, leading to the poor growth of certain species, which, in turn, affects their root exudates and litter quality, thereby reducing the accumulation of soil organic matter. Some tree species might lead to nutrient loss in the soil, such as through deep root absorption or high biomass consumption, thus affecting the carbon and nitrogen content in the soil. In pure forests with lower biodiversity, microbial activity is also low, resulting in slower decomposition rates. Therefore, the findings of this study do not support Hypothesis 3, which predicted a linear increase in decomposition with species richness. This study suggests that a tree species richness of 2 is most suitable for promoting CWD decomposition and carbon–nitrogen cycling in the study area.

4.3. The Impact of Vegetation Types on CWD Decomposition Rates and Soil Carbon and Nitrogen Content

The carbon and nitrogen content of CWD in the pure tree forests is higher than that in the tree–shrub mixed forests, while the C:N ratio is slightly lower in the pure tree forests (Table 3). This may be due to the fact that trees generally have higher biomass and more complex growth structures than shrubs, which enable them to absorb and store larger amounts of carbon and nitrogen more effectively. Additionally, trees typically have deeper root systems, which help them absorb and store more nitrogen and carbon from the soil. In contrast, the shrubs in tree–shrub mixed forests usually have shallower root systems, which may contribute less to soil nutrient cycling.
The rate of carbon decline in CWD in tree–shrub mixed forests is faster than that in pure tree forests. Additionally, the nitrogen content in tree–shrub mixed forests increases more rapidly, and the C:N ratio decreases more quickly (Figure S2), indicating that decomposition proceeds more rapidly in tree–shrub mixed forests. This is likely due to the fact that shrubs typically have faster growth and decomposition rates compared to trees, shorter life cycles, and the ability to absorb and release nutrients more quickly. Furthermore, shrubs generally have thinner leaves, which contain higher amounts of easily decomposable substances (such as cellulose and sugars), and the decrease in the C:N ratio in tree–shrub mixed forests supports this. In the adjacent topsoil layers under CWD, the carbon content in tree–shrub mixed forests is higher than that in pure tree forests, while the nitrogen content is lower (Table S3). This is because shrub litter decomposes more easily, which increases carbon input, but leads to the release and consumption of nitrogen through rapid decomposition, resulting in higher carbon content, but lower nitrogen content in the soil.
The tree–shrub mixed forests in this study include two forest types: the Tsuga longibracteataRhododendron simiarum mixed forests and the Tsuga longibracteata–hardwood–Rhododendron simiarum mixed forests. From the comparison of species richness, it is evident that the ecological effects of forest types with a richness of 3 are weaker than those with a richness of 2. Furthermore, in the structural equation model (Figure 5), the absolute values of the path coefficients for the vegetation type’s effects on carbon, nitrogen, and the C:N ratio are all greater than those for species richness, indicating that vegetation type has a stronger influence on carbon, nitrogen, and the C:N ratio. Therefore, based on a comprehensive comparison, among the five forest types in this study, the Tsuga longibracteataRhododendron simiarum mixed forests exhibit the fastest CWD decomposition rate and the most favorable soil carbon and nitrogen content, making it the optimal forest type in the mixed forest category.

5. Conclusions

This study compares the decomposition rates of CWD in different forest types and examines the differences in carbon and nitrogen changes in CWD and the adjacent topsoil layer. It aims to explore the optimal forest type in the region and optimize the mixed forest model in the area, with the goal of promoting the development of forest management strategies based on biodiversity. The conclusions are as follows:
(1) The Tsuga longibracteataPhyllostachys edulis mixed forest had the highest CWD carbon and nitrogen content, while the adjacent surface soil had the lowest. Additionally, the decomposition rate in the Phyllostachys edulis mixed forest is the fastest. Bamboo absorbs large amounts of carbon for lignin production and high concentrations of nitrogen during decomposition to offset lignin’s inhibitory effect. Bamboo is a softwood with relatively low density, leading to a fast decomposition rate. However, high decomposition rates can lead to insufficient nitrogen, causing more carbon to convert to CO2 instead of stable soil organic carbon. Low soil carbon and nitrogen may reduce fertility, affecting plant growth and the long-term stability of the ecosystem.
(2) Both too high and too low species richness can lead to soil impoverishment. When species richness is 2, the mixed forest shows the best effect, optimal for CWD decomposition and carbon–nitrogen cycling in the region. Too many tree species can reduce the decomposition rate due to slightly lower soil moisture in species-rich plots and the intrinsic properties of certain tree species. However, pure forests have low biodiversity, lower microbial activity, and slower decomposition rates. To maximize nutrient cycling and maintain soil stability, forest management should promote moderate species diversity and avoid dominance by fast-decomposing species like Phyllostachys edulis.
(3) Tree–shrub mixed forests have better ecological effects than pure tree forests. The faster decomposition rates in tree–shrub mixed forests are due to the faster growth and decomposition of shrubs compared to trees, which absorb and release nutrients more rapidly. Additionally, shrub leaves are typically thinner and contain higher levels of decomposable substances, such as cellulose and sugars. Although CWD of shrub decomposes more easily and increases carbon input, rapid decomposition leads to the release and consumption of nitrogen, resulting in higher soil carbon content, but lower nitrogen content.
(4) A species richness of 2 is optimal, and tree–shrub mixed forests outperforming pure tree forests. Structural equation modeling shows that vegetation type has a stronger impact on soil carbon, nitrogen, and C:N ratio than species richness. Therefore, after comprehensive comparison, the Tsuga longibracteataRhododendron simiarum mixed forest, with the fastest CWD decomposition rate and better soil carbon–nitrogen content, is the most optimal forest type among the five mixed forests.
Overall, our findings confirm Hypothesis 1, showing that species composition differences affect decomposition rates and nutrient cycling. However, Hypothesis 2 is refuted, as mixed forests, especially those with Phyllostachys edulis, do not necessarily enhance decomposition or nutrient cycling due to soil impoverishment. Additionally, Hypothesis 3 is disproven, as our data show that excessive species richness reduces decomposition efficiency.

Supplementary Materials

The following supporting information can be downloaded at: https://www.mdpi.com/article/10.3390/f16040579/s1, Table S1. Geographic and environmental characteristics of sample plots for different forest types. Table S2. Analysis of differences in the average carbon and nitrogen content, C:N ratio in the adjacent soil layers beneath CWD across different levels of tree species richness (mean ± SD). Table S3. Independent sample t-test of the average carbon and nitrogen content, C:N ratio in the adjacent soil layers beneath CWD across different vegetation types (mean ± SD); Figure S1: The variation in C, N, and C:N rato of CWD across different levels of tree species richness and their corresponding fitting equations; Figure S2: The variation in C, N, and C:N ratio of CWD in different vegetation types and their corresponding fitting equations.

Author Contributions

Conceptualization, Y.S., Z.X., Y.C., W.X. and D.H.; methodology, Y.S., Z.X., W.Y. and D.H.; validation, Y.S., Z.X., W.Y., W.X. and D.H.; investigation, W.Y. and Y.C.; data curation, Y.S. and Y.C.; writing—original draft preparation, Y.S.; writing—review and editing, Z.X., W.Y., Y.C., W.X. and D.H.; supervision, Y.S., Z.X., W.Y., Y.C., W.X. and D.H.; resources, Y.S. All authors have read and agreed to the published version of the manuscript.

Funding

This research was funded by the Natural Science Foundation of Xinjiang Uygu Autonomous Region (No. 2022D01B234 and No. 2022E01052 and No. 20243122520).

Data Availability Statement

Data will be made available from the corresponding author on reasonable request.

Acknowledgments

I would like to express my sincere gratitude to my supervisors for their patient guidance and careful revision. I thank my fellow colleagues for their assistance in sample collection and experimental analysis. Special thanks to my alma mater, Fujian Agriculture and Forestry University, for providing the experimental platform and technical support.

Conflicts of Interest

The authors declare no conflicts of interest.

References

  1. Wen, L.; Lei, P.; Xiang, W.; Yan, W.; Liu, S. Soil Microbial Biomass Carbon and Nitrogen in Pure and Mixed Stands of Pinus massoniana and Cinnamomum camphora Differing in Stand Age. For. Ecol. Manag. 2014, 328, 150–158. [Google Scholar] [CrossRef]
  2. Deng, C.; Zhang, S.; Lu, Y.; Froese, R.E.; Xu, X.; Zeng, J.; Ming, A.; Liu, X.; Xie, Y.; Li, Q. Thinning Effects on Forest Evolution in Masson Pine (Pinus massoniana Lamb.) Conversion from Pure Plantations into Mixed Forests. For. Ecol. Manag. 2020, 477, 118503. [Google Scholar] [CrossRef]
  3. Li, W.-Q.; Huang, Y.-X.; Chen, F.-S.; Liu, Y.-Q.; Lin, X.-F.; Zong, Y.-Y.; Wu, G.-Y.; Yu, Z.-R.; Fang, X.-M. Mixing with Broad-Leaved Trees Shapes the Rhizosphere Soil Fungal Communities of Coniferous Tree Species in Subtropical Forests. For. Ecol. Manag. 2021, 480, 118664. [Google Scholar] [CrossRef]
  4. Li, W.-Q.; Wu, Z.-J.; Zong, Y.-Y.; Wang, G.G.; Chen, F.-S.; Liu, Y.-Q.; Li, J.-J.; Fang, X.-M. Tree Species Mixing Enhances Rhizosphere Soil Organic Carbon Mineralization of Conifers in Subtropical Plantations. For. Ecol. Manag. 2022, 516, 120238. [Google Scholar] [CrossRef]
  5. Guo, J.; Feng, H.; McNie, P.; Liu, Q.; Xu, X.; Pan, C.; Yan, K.; Feng, L.; Adehanom Goitom, E.; Yu, Y. Species Mixing Improves Soil Properties and Enzymatic Activities in Chinese Fir Plantations: A Meta-Analysis. Catena 2023, 220, 106723. [Google Scholar] [CrossRef]
  6. Hulvey, K.B.; Hobbs, R.J.; Standish, R.J.; Lindenmayer, D.B.; Lach, L.; Perring, M.P. Benefits of Tree Mixes in Carbon Plantings. Nat. Clim. Change 2013, 3, 869–874. [Google Scholar] [CrossRef]
  7. González de Andrés, E. Interactions between Climate and Nutrient Cycles on Forest Response to Global Change: The Role of Mixed Forests. Forests 2019, 10, 609. [Google Scholar] [CrossRef]
  8. Forrester, D.I.; Bauhus, J.; Cowie, A.L.; Vanclay, J.K. Mixed-Species Plantations of Eucalyptus with Nitrogen-Fixing Trees: A Review. For. Ecol. Manag. 2006, 233, 211–230. [Google Scholar] [CrossRef]
  9. Liu, C.L.C.; Kuchma, O.; Krutovsky, K.V. Mixed-Species versus Monocultures in Plantation Forestry: Development, Benefits, Ecosystem Services and Perspectives for the Future. Glob. Ecol. Conserv. 2018, 15, e00419. [Google Scholar] [CrossRef]
  10. Kelty, M.J. The Role of Species Mixtures in Plantation Forestry. For. Ecol. Manag. 2006, 233, 195–204. [Google Scholar] [CrossRef]
  11. Ratnadass, A.; Fernandes, P.; Avelino, J.; Habib, R. Plant Species Diversity for Sustainable Management of Crop Pests and Diseases in Agroecosystems: A Review. Agron. Sustain. Dev. 2012, 32, 273–303. [Google Scholar] [CrossRef]
  12. Isbell, F.; Adler, P.R.; Eisenhauer, N.; Fornara, D.; Kimmel, K.; Kremen, C.; Letourneau, D.K.; Liebman, M.; Polley, H.W.; Quijas, S.; et al. Benefits of Increasing Plant Diversity in Sustainable Agroecosystems. J. Ecol. 2017, 105, 871–879. [Google Scholar] [CrossRef]
  13. Eisenhauer, N.; Lanoue, A.; Strecker, T.; Scheu, S.; Steinauer, K.; Thakur, M.P.; Mommer, L. Root Biomass and Exudates Link Plant Diversity with Soil Bacterial and Fungal Biomass. Sci. Rep. 2017, 7, 44641. [Google Scholar] [CrossRef]
  14. Haghverdi, K.; Kooch, Y. Effects of Diversity of Tree Species on Nutrient Cycling and Soil-Related Processes. Catena 2019, 178, 335–344. [Google Scholar] [CrossRef]
  15. Huang, Y.; Chen, Y.; Castro-Izaguirre, N.; Baruffol, M.; Brezzi, M.; Lang, A.; Li, Y.; Härdtle, W.; Von Oheimb, G.; Yang, X.; et al. Impacts of Species Richness on Productivity in a Large-Scale Subtropical Forest Experiment. Science 2018, 362, 80–83. [Google Scholar] [CrossRef] [PubMed]
  16. Dietrich, P.; Ferlian, O.; Huang, Y.; Luo, S.; Quosh, J.; Eisenhauer, N. Tree Diversity Effects on Productivity Depend on Mycorrhizae and Life Strategies in a Temperate Forest Experiment. Ecology 2023, 104, e3896. [Google Scholar] [CrossRef]
  17. Feng, Y.; Schmid, B.; Loreau, M.; Forrester, D.I.; Fei, S.; Zhu, J.; Tang, Z.; Zhu, J.; Hong, P.; Ji, C.; et al. Multispecies Forest Plantations Outyield Monocultures across a Broad Range of Conditions. Science 2022, 376, 865–868. [Google Scholar] [CrossRef]
  18. Dai, E.; Zhu, J.; Wang, X.; Xi, W. Multiple Ecosystem Services of Monoculture and Mixed Plantations: A Case Study of the Huitong Experimental Forest of Southern China. Land Use Pol. 2018, 79, 717–724. [Google Scholar] [CrossRef]
  19. Augusto, L.; Boča, A. Tree Functional Traits, Forest Biomass, and Tree Species Diversity Interact with Site Properties to Drive Forest Soil Carbon. Nat. Commun. 2022, 13, 1097. [Google Scholar] [CrossRef]
  20. Beugnon, R.; Bu, W.; Bruelheide, H.; Davrinche, A.; Du, J.; Haider, S.; Kunz, M.; von Oheimb, G.; Perles-Garcia, M.D.; Saadani, M.; et al. Abiotic and Biotic Drivers of Tree Trait Effects on Soil Microbial Biomass and Soil Carbon Concentration. Ecol. Monogr. 2023, 93, e1563. [Google Scholar] [CrossRef]
  21. Lieberman, M.; Lieberman, D. Nearest-neighbor Tree Species Combinations in Tropical Forest: The Role of Chance, and Some Consequences of High Diversity. Oikos 2007, 116, 377–386. [Google Scholar] [CrossRef]
  22. Forrester, D.I. The Spatial and Temporal Dynamics of Species Interactions in Mixed-Species Forests: From Pattern to Process. For. Ecol. Manag. 2014, 312, 282–292. [Google Scholar] [CrossRef]
  23. Wan, X.; Joly, F.; Jia, H.; Zhu, M.; Fu, Y.; Huang, Z. Functional Identity Drives Tree Species Richness-induced Increases in Litterfall Production and Forest Floor Mass in Young Tree Communities. New Phytol. 2023, 240, 1003–1014. [Google Scholar] [CrossRef]
  24. Liang, J.; Crowther, T.W.; Picard, N.; Wiser, S.; Zhou, M.; Alberti, G.; Schulze, E.-D.; McGuire, A.D.; Bozzato, F.; Pretzsch, H.; et al. Positive Biodiversity-Productivity Relationship Predominant in Global Forests. Science 2016, 354, aaf8957. [Google Scholar] [CrossRef]
  25. Schnabel, F.; Liu, X.; Kunz, M.; Barry, K.E.; Bongers, F.J.; Bruelheide, H.; Fichtner, A.; Härdtle, W.; Li, S.; Pfaff, C.-T.; et al. Species Richness Stabilizes Productivity via Asynchrony and Drought-Tolerance Diversity in a Large-Scale Tree Biodiversity Experiment. Sci. Adv. 2021, 7, eabk1643. [Google Scholar] [CrossRef]
  26. Urgoiti, J.; Messier, C.; Keeton, W.S.; Reich, P.B.; Gravel, D.; Paquette, A. No Complementarity No Gain—Net Diversity Effects on Tree Productivity Occur Once Complementarity Emerges during Early Stand Development. Ecol. Lett. 2022, 25, 851–862. [Google Scholar] [CrossRef] [PubMed]
  27. Jucker, T.; Bouriaud, O.; Coomes, D.A. Crown Plasticity Enables Trees to Optimize Canopy Packing in Mixed-species Forests. Funct. Ecol. 2015, 29, 1078–1086. [Google Scholar] [CrossRef]
  28. Chiang, J.-M.; Spasojevic, M.J.; Muller-Landau, H.C.; Sun, I.-F.; Lin, Y.; Su, S.-H.; Chen, Z.-S.; Chen, C.-T.; Swenson, N.G.; McEwan, R.W. Functional Composition Drives Ecosystem Function through Multiple Mechanisms in a Broadleaved Subtropical Forest. Oecologia 2016, 182, 829–840. [Google Scholar] [CrossRef]
  29. Joly, F.; Milcu, A.; Scherer-Lorenzen, M.; Jean, L.; Bussotti, F.; Dawud, S.M.; Müller, S.; Pollastrini, M.; Raulund-Rasmussen, K.; Vesterdal, L.; et al. Tree Species Diversity Affects Decomposition through Modified Micro-environmental Conditions across European Forests. New Phytol. 2017, 214, 1281–1293. [Google Scholar] [CrossRef]
  30. Huang, Y.; Ma, Y.; Zhao, K.; Niklaus, P.A.; Schmid, B.; He, J.-S. Positive Effects of Tree Species Diversity on Litterfall Quantity and Quality along a Secondary Successional Chronosequence in a Subtropical Forest. J. Plant Ecol. 2017, 10, 28–35. [Google Scholar] [CrossRef]
  31. Falconí-López, A.; Grella, N.; Donoso, D.A.; Feldhaar, H.; Tremlett, C.J.; Müller, J. Patterns of Deadwood Amount and Deadwood Diversity along a Natural Forest Recovery Gradient from Agriculture to Old-Growth Lowland Tropical Forests. Eur. J. For. Res. 2024, 143, 1321–1332. [Google Scholar] [CrossRef]
  32. Yuan, Y.; Cao, C.; Feng, Y.; Miao, Y.; Zhou, Z.; Zhang, S. Influence of Long-Term Ecological Reclamation on Carbon and Nitrogen Cycling in Soil Aggregates: The Role of Bacterial Community Structure and Function. Sci. Total Environ. 2024, 954, 176729. [Google Scholar] [CrossRef] [PubMed]
  33. Petritan, I.C.; Mihăilă, V.-V.; Yuste, J.C.; Bouriaud, O.; Petritan, A.M. Deadwood Density, C Stocks and Their Controlling Factors in a Beech-Silver Fir Mixed Virgin European Forest. For. Ecol. Manag. 2023, 539, 121007. [Google Scholar] [CrossRef]
  34. Magnússon, R.Í.; Tietema, A.; Cornelissen, J.H.C.; Hefting, M.M.; Kalbitz, K. Tamm Review: Sequestration of Carbon from Coarse Woody Debris in Forest Soils. For. Ecol. Manag. 2016, 377, 1–15. [Google Scholar] [CrossRef]
  35. Přívětivý, T.; Janík, D.; Unar, P.; Adam, D.; Král, K.; Vrška, T. How Do Environmental Conditions Affect the Deadwood Decomposition of European Beech (Fagus sylvatica L.)? For. Ecol. Manag. 2016, 381, 177–187. [Google Scholar] [CrossRef]
  36. Xiao, S.; You, H.; You, W.; Liu, J.; Cai, C.; Wu, J.; Ji, Z.; Zhan, S.; Hu, Z.; Zhang, Z.; et al. Rhizosphere and Bulk Soil Enzyme Activities in a Nothotsuga longibracteata Forest in the Tianbaoyan National Nature Reserve, Fujian Province, China. J. For. Res. 2017, 28, 521–528. [Google Scholar] [CrossRef]
  37. You, H.; He, D.; You, W.; Liu, J.; Cai, C. Effect of Environmental Gradients on the Quantity and Quality of Fallen Logs in Tsuga longibracteata Forest in Tianbaoyan National Nature Reserve, Fujian Province, China. J. Mt. Sci. 2013, 10, 1118–1124. [Google Scholar] [CrossRef]
  38. Cao, Y.; He, D.; Zhou, M.; Liu, J.; Cai, C.; You, W. Long-Term Dynamic Simulation of Forest Landscape Succession in Tianbaoyan National Nature Reserve under Climate Change Scenarios. Acta Ecol. Sin. 2023, 43, 3636–3649. (In Chinese) [Google Scholar] [CrossRef]
  39. Jaman, M.S.; Yu, Q.; Xu, C.; Jamil, M.; Ke, Y.; Yang, T.; Knapp, A.K.; Wilkins, K.; Collins, S.L.; Griffin-Nolan, R.J.; et al. Chronic Drought Decreased Organic Carbon Content in Topsoil Greater than Intense Drought across Grasslands in Northern China. Geoderma 2024, 443, 116832. [Google Scholar] [CrossRef]
  40. Yan, E.; Wang, X.; Huang, J. Concept and Classification of Coarse Woody Debris in Forest Ecosystems. Acta Ecol. Sin. 2005, 25, 158–167. (In Chinese) [Google Scholar] [CrossRef]
  41. Sollins, P. Input and Decay of Coarse Woody Debris in Coniferous Stands in Western Oregon and Washington. Can. J. For. Res. 1982, 12, 18–28. [Google Scholar] [CrossRef]
  42. Zhang, K.; Cheng, X.; Shu, X.; Liu, Y.; Zhang, Q. Linking Soil Bacterial and Fungal Communities to Vegetation Succession Following Agricultural Abandonment. Plant Soil 2018, 431, 19–36. [Google Scholar] [CrossRef]
  43. Li, S.; Lyu, M.; Deng, C.; Deng, W.; Wang, X.; Cao, A.; Jiang, Y.; Liu, J.; Lu, Y.; Xie, J. Input of High-Quality Litter Reduces Soil Carbon Losses Due to Priming in a Subtropical Pine Forest. Soil Biol. Biochem. 2024, 194, 109444. [Google Scholar] [CrossRef]
  44. Chen, W.; Hu, H.; Heal, K.; Sohi, S.; Tigabu, M.; Qiu, W.; Zhou, C. Linking Microbial Decomposition to Dissolved Organic Matter Composition in the Revegetation of the Red Soil Erosion Area. Forests 2023, 14, 270. [Google Scholar] [CrossRef]
  45. Cohen, J. Statistical Power Analysis for the Behavioral Sciences, 2nd ed.; Routledge: New York, NY, USA, 1988; pp. 154–196. [Google Scholar]
  46. Hsu, J.S.; Powell, J.; Adler, P.B. Sensitivity of Mean Annual Primary Production to Precipitation. Glob. Change Biol. 2012, 18, 2246–2255. [Google Scholar] [CrossRef]
  47. Zhang, B.; Tan, X.; Wang, S.; Chen, M.; Chen, S.; Ren, T.; Xia, J.; Bai, Y.; Huang, J.; Han, X. Asymmetric Sensitivity of Ecosystem Carbon and Water Processes in Response to Precipitation Change in a Semi-arid Steppe. Funct. Ecol. 2017, 31, 1301–1311. [Google Scholar] [CrossRef]
  48. Thomas, S.C.; Martin, A.R. Carbon Content of Tree Tissues: A Synthesis. Forests 2012, 3, 332–352. [Google Scholar] [CrossRef]
  49. Herrmann, S.; Kahl, T.; Bauhus, J. Decomposition Dynamics of Coarse Woody Debris of Three Important Central European Tree Species. For. Ecosyst. 2015, 2, 27. [Google Scholar] [CrossRef]
  50. Köster, K.; Metslaid, M.; Engelhart, J.; Köster, E. Dead Wood Basic Density, and the Concentration of Carbon and Nitrogen for Main Tree Species in Managed Hemiboreal Forests. For. Ecol. Manag. 2015, 354, 35–42. [Google Scholar] [CrossRef]
  51. Mukhortova, L.; Pashenova, N.; Meteleva, M.; Krivobokov, L.; Guggenberger, G. Temperature Sensitivity of CO2 and CH4 Fluxes from Coarse Woody Debris in Northern Boreal Forests. Forests 2021, 12, 624. [Google Scholar] [CrossRef]
  52. Lecerf, A.; Risnoveanu, G.; Popescu, C.; Gessner, M.O.; Chauvet, E. Decomposition of Diverse Litter Mixtures in Streams. Ecology 2007, 88, 219–227. [Google Scholar] [CrossRef] [PubMed]
  53. Hu, X.; Arif, M.; Ding, D.; Li, J.; He, X.; Li, C. Invasive Plants and Species Richness Impact Litter Decomposition in Riparian Zones. Front. Plant Sci. 2022, 13, 955656. [Google Scholar] [CrossRef] [PubMed]
Figure 1. Location of the Tianbaoyan National Nature Reserve in Fujian Province, China.
Forests 16 00579 g001
Figure 2. C, N, and C:N of five forest types’ CWD under different decay stage. (a) shows the carbon content, (b) the nitrogen content, and (c) the C:N ratio of CWD across different decay classes. C and N content dynamics across decay stages show that the Tsuga longibracteataPhyllostachys edulis mixed forests have the fastest decomposition, leading to rapid nutrient cycling, but lower soil retention. Different lowercase letters indicate significant differences (p < 0.05).
Forests 16 00579 g002
Figure 3. Independent-samples t test. t-tests showed highly significant differences in carbon content between the Tsuga longibracteataPhyllostachys edulis mixed forests and pure forests and significant differences in nitrogen content between the Tsuga longibracteata–hardwood–Rhododendron simiarum mixed forests and pure forests. Control: The pure Tsuga longibracteata forests, A: the Tsuga longibracteata–hardwood mixed forests, B: the Tsuga longibracteataPhyllostachys edulis mixed forests, C: the Tsuga longibracteataRhododendron simiarum mixed forests, D: the Tsuga longibracteata–hardwood–Rhododendron simiarum mixed forests. * Significant difference at the 0.05 level, ** significant difference at the 0.01 level.
Forests 16 00579 g003
Figure 4. Relative response ratios of C, N, and C:N ratio in the soil across different decay levels of mixed forests compared to pure forest soils. The vertical bars represent the 95% confidence intervals, with negative and positive values indicating a decrease or increase in the variables relative to the control group (denoted by the horizontal gray dashed line). The response ratios were calculated as (CTreatment − CControl)/CControl, with the same method applied for N and C:N ratio calculations. Asterisks on the error bars indicate significant treatment effects at probability levels of 0.05 (*), 0.01 (**), and 0.001 (***).
Forests 16 00579 g004
Figure 5. Structural equation model (SEM) fit results for species richness and vegetation type. (a) illustrates the direct and indirect effects of tree species richness on C, N, and the C:N ratio, while (b) illustrates those of vegetation type. Note: The manifest variables and path coefficients on the lines represent the path coefficients of the structural equation model. Orange indicates a positive correlation, while blue represents a negative correlation. ***. denotes significance at the 0.001 level.
Forests 16 00579 g005
Figure 6. PCA illustrates the relationships between variables in CWD and soil variables. In the biplot, smaller angles between the vectors indicate a higher correlation between the variables, while larger angles suggest a lower correlation. The five pictures are interpreted as follows: (a) Pure Tsuga longibracteata forest, (b) Tsuga longibracteata–hardwood mixed forest, (c) Tsuga longibracteataPhyllostachys edulis mixed forest, (d) Tsuga longibracteataRhododendron simiarum mixed forest, and (e) Tsuga longibracteata–hardwood–Rhododendron simiarum mixed forest. I, II, III, IV, and V represent the five decay stages.
Forests 16 00579 g006
Figure 7. Correlation between C, N, C:N ratio, density, and moisture content of CWD and the C, N, and C:N ratio of adjacent topsoil layers across different decay stages. Note: Type A: Pure Tsuga longibracteata forest, Type B: Tsuga longibracteata–hardwood mixed forest, Type C: Tsuga longibracteataPhyllostachys edulis mixed forest, Type D: Tsuga longibracteataRhododendron simiarum mixed forest, Type E: Tsuga longibracteata–hardwood–Rhododendron simiarum mixed forest. * indicates p < 0.05, ** indicates p < 0.01.
Forests 16 00579 g007
Table 1. Analysis of differences in the average carbon and nitrogen content, C:N ratio, density, and moisture content of CWD across different forest types.
Five Forest Types (Mean ± SD)One-Way ANOVA
12345dfFpη2
C (%)44.22 ± 4.24 b43.05 ± 4.38 b47.72 ± 5.74 a44.04 ± 4.62 b43.19 ± 4.78 b45.9740.0000.162
N (%)0.80 ± 0.360.90 ± 0.950.96 ± 0.320.76 ± 0.330.68 ± 0.2642.1690.0720.065
C:N70.66 ± 42.2262.51 ± 28.4057.53 ± 28.6668.31 ± 31.3276.77 ± 42.1942.2630.0620.068
Density0.36 ± 0.2 ab0.31 ± 0.14 b-0.34 ± 0.16 b0.41 ± 0.16 a35.3090.0010.114
moisture content
(%)
0.43 ± 0.190.45 ± 0.16-0.42 ± 0.170.39 ± 0.1331.8850.1350.044
Note: 1: The pure Tsuga longibracteata forests, 2: the Tsuga longibracteata–hardwood mixed forests, 3: the Tsuga longibracteataPhyllostachys edulis mixed forests, 4: the Tsuga longibracteataRhododendron simiarum mixed forests, 5: the Tsuga longibracteata–hardwood–Rhododendron simiarum mixed forests. Bold indicates p < 0.05 (one-way ANOVA). Values followed by lowercase letters in the same row are significantly different at the p < 0.05 using the LSD method.
Table 2. Analysis of differences in the average carbon and nitrogen content, C:N ratio, density, and moisture content of CWD across different levels of tree species richness (mean ± SD).
Tree Species RichnessC (%)N (%)C:NDensityMoisture Content (%)
144.22 ± 4.240.80 ± 0.3670.66 ± 44.220.36 ± 0.21 ab0.43 ± 0.19
244.18 ± 4.920.84 ± 0.6564.41 ± 29.910.32 ± 0.15 b0.43 ± 0.17
343.19 ± 4.800.68 ± 0.2667.92 ± 35.000.41 ± 0.16 a0.39 ± 0.13
df22222
F1.1022.2702.6097.2701.888
p0.3340.1050.0790.0010.156
η20.0180.0350.0400.1050.030
Note: The p-value is the result of a one-way ANOVA, used to determine whether there is a significant difference between groups. Bold indicates p < 0.05 (one-way ANOVA). Values followed by lowercase letters in the same column are significantly different at the p < 0.05 using the LSD method.
Table 3. Independent sample t-test of the average carbon and nitrogen content, C:N ratio, density, and moisture content of CWD across different vegetation types (mean ± SD).
Vegetation TypesC (%)N (%)C:NDensityMoisture Content (%)
Pure tree forests44.27 ± 4.9 ns0.88 ± 0.7263.95 ± 33.190.32 ± 0.170.44 ± 0.17 ns
Tree–shrub mixed forests43.69 ± 4.690.73 ± 0.3071.86 ± 36.390.37 ± 0.160.41 ± 0.16
t-value1.0732.471−1.994−2.1551.887
df309312307286286
p0.2840.0140.0470.0320.060
Note: The independent sample t-test determines the difference between two group means by calculating the t-value. Bold indicates p < 0.05 (t-test). t > 0 indicates the first group has a higher mean, while t < 0 indicates a lower mean. “ns” indicates that there is no significant difference between the two.
Table 4. Analysis of differences in the average carbon and nitrogen content, C:N ratio in the adjacent soil layers beneath CWD across different forest types.
Five Forest Types (Mean ± SD)One-Way ANOVA
12345dfFpη2
C (%)20.11 ± 8.42 b24.41 ± 11.02 ab11.02 ± 8.37 c29.21 ± 14.38 a16.94 ± 11.93 bc421.9180.0000.414
N (%)1.58 ± 0.53 a1.72 ± 0.63 a0.93 ± 0.40 b1.44 ± 0.56 a1.44 ± 1.96 a43.4210.0090.099
C:N12.81 ± 3.65 bc13.94 ± 3.50 b10.99 ± 4.33 c19.62 ± 4.51 a13.15 ± 4.68 bc438.6810.0000.555
Note: Bold indicates p < 0.05 (one-way ANOVA). Values followed by lowercase letters in the same row are significantly different at the p < 0.05 using the LSD method.
Disclaimer/Publisher’s Note: The statements, opinions and data contained in all publications are solely those of the individual author(s) and contributor(s) and not of MDPI and/or the editor(s). MDPI and/or the editor(s) disclaim responsibility for any injury to people or property resulting from any ideas, methods, instructions or products referred to in the content.

