Article

Research on UAV-LiDAR-Based Detection and Prediction of Tree Risks on Transmission Lines

1
State Key Laboratory of Subtropical Silviculture, Zhejiang A&F University, Hangzhou 311300, China
2
Key Laboratory of Carbon Cycling in Forest Ecosystems and Carbon Sequestration of Zhejiang Province, Zhejiang A&F University, Hangzhou 311300, China
3
School of Environmental and Resources Science, Zhejiang A&F University, Hangzhou 311300, China
4
State Grid Zhejiang Electric Power Co., Ltd., Pan’an County Power Supply Company, Hangzhou 311300, China
5
State Grid Hangzhou Lin’an Power Supply Company, Hangzhou 311300, China
6
Zhejiang Province Key Think Tank: Institute of Ecological Civilization, Zhejiang A&F University, Hangzhou 311300, China
*
Author to whom correspondence should be addressed.
Forests 2025, 16(4), 578; https://doi.org/10.3390/f16040578
Submission received: 26 February 2025 / Revised: 20 March 2025 / Accepted: 21 March 2025 / Published: 26 March 2025
(This article belongs to the Section Forest Inventory, Modeling and Remote Sensing)

Abstract

:
The safe operation of power transmission lines is critical for ensuring the stability of the power supply, especially given the increasing frequency of extreme weather events and the risks posed by tree growth. This study proposes a novel method for detecting and predicting the tree barrier risks on transmission lines using Unmanned Aerial Vehicle–Light Detection and Ranging (UAV-LiDAR) technology. The method employs point cloud classification to effectively separate ground, conductor, tower, and vegetation points, followed by 3D reconstruction of the power lines using the catenary equation. Tree growth models are integrated with measured data to predict future tree barrier risks. The experimental results demonstrate that the point-cloud-based method detects 31 tree barriers, with an RMSE of 0.08 m, while the 3D-reconstruction-based method detects 32 tree barriers, with an RMSE of 0.04 m, indicating its higher accuracy. The Cloth Simulation Filter (CSF) ground point classification method achieved the lowest roughness (1.5%), mean error (0.147 m), and RMSE (0.174 m), proving its effectiveness for flat terrain. Additionally, the assisted seed point individual tree segmentation method extracted tree height with high accuracy (R2 = 0.84, RMSE = 1.01 m). This study predicts an average tree growth rate of 0.248 m/year over the next five years, identifying a new tree barrier at the coordinates 30°15′16.64″ N, 119°43′16.01″ E. This method enhances the efficiency and accuracy of transmission line inspections, supporting both power line safety and sustainable forest management. Its findings provide a robust technical approach to improving power line operations and forest resource utilization.

1. Introduction

The global surge in the electricity demand and accelerating energy transitions have driven extensive expansion of power line networks, yet their safe operation faces escalating threats from the encroachment of vegetation and climate-induced extreme weather events [1,2]. Tree growth near transmission lines—a leading cause of outages, wildfires, and ecological damage—demands precise monitoring to balance grid reliability with sustainable forest management [3,4]. The traditional inspection methods, including ground surveys and helicopter-based aerial assessments, remain constrained by subjective judgments, high costs, and limited quantitative accuracy [5,6,7]. While ground crews risk their safety in complex terrains, aerial methods struggle with the issues of airspace regulations and non-analyzable data, often leading to unnecessary tree removal or missed risks.
Light Detection and Ranging (LiDAR) technology has emerged as a transformative tool, enabling non-contact, high-resolution 3D mapping of power line corridors (PLCs) with unmatched spatial precision [8,9]. UAV-LiDAR systems in particular enhance the efficiency in detecting geometric risks like tree barriers, outperforming manual and aerial approaches [10]. The current research focuses on two primary domains: (1) employing point cloud classification methodologies to identify and delineate power line infrastructure components and (2) assessing the hazard potential within transmission line corridors [11].
For instance, Chen et al. [12] achieved decimeter-level safety distance measurements using catenary modeling and combined conditional Euclidean clustering with linear feature constraints to extract the power line points, achieving F-scores above 0.95. Yang and Kang [13] presented a voxel-based method for extracting transmission lines from airborne LiDAR data, achieving high accuracy and robustness. Recent advancements in predictive modeling and machine learning further demonstrate the potential of integrating UAV-LiDAR with computational techniques for environmental risk forecasting. For example, Habeeb and Mustafa (2025) developed a deep learning framework to predict the forest cover changes in dynamic ecosystems, highlighting the scalability of neural networks in processing large-scale geospatial datasets [14]. Similarly, Mzuri et al. (2024) utilized geo-informatics and ensemble machine learning models to identify flood-prone areas, underscoring the value of hybrid approaches in preemptive environmental hazard management [15]. However, a critical gap persists: mapping the vegetation dynamics within PLCs—specifically, predictive modeling of the impacts of tree growth on line safety—is rarely addressed [3]. The existing studies focus on static risk detection through point cloud classification or manual inspection. For instance, Kim and Sohn [16] utilized airborne LiDAR to identify the existing tree encroachment in transmission corridors but did not account for future growth trajectories. Similarly, Ortega et al. [17] developed a static risk assessment framework by integrating LiDAR and GIS to map clearance violations, yet their model lacked temporal projections of the vegetation dynamics. Such approaches, while effective for immediate hazard identification, fail to address the cumulative risks posed by continuous tree growth and climate variability.
This study aims to develop a UAV-LiDAR-based framework for detecting and predicting the tree encroachment risks in transmission line corridors, with three specific objectives: (1) to establish a high-precision point cloud classification pipeline for ground, vegetation, conductor, and pylon points; (2) to enable proactive risk management by integrating a 3D catenary reconstruction with tree growth modeling (e.g., for Taxodium distichum at 0.248 m/year); and (3) to validate the framework’s operational utility through field experiments, demonstrating its superiority over manual and point-cloud-only methods in its detection accuracy and cost-efficiency. By addressing the gap in dynamic vegetation analytics, this work provides a dual-focus solution: ensuring the grid’s reliability while minimizing ecological disruption through data-driven forest management.

2. Materials and Methods

2.1. Overview of the Study Area

The study area, depicted in Figure 1, is located at Nonglin Road, Jinbei Street, Lin’an District, Hangzhou City, Zhejiang Province (119°42′56.58″ E–119°43′46.59″ E, 30°15′15.42″ N–30°15′52.11″ N). This region has a subtropical monsoon climate, characterized by an average summer temperature of 28.5 °C (June–August), ranging from 24 °C to 35 °C, with hot, rainy conditions and occasional typhoons. In winter (December–February), the average temperature is 4.2 °C, varying between −2 °C and 10 °C, with occasional snowfall. The average altitude within the PLC is approximately 40 m, with the terrain being higher in the north and lower in the south.
The PLC within the study area is predominantly covered by subtropical mixed forests, with Taxodium distichum as the dominant species (74% of total trees). Per the DL/T 741-2019 [18] overhead transmission line operation regulations, the line’s location is not classified as a special section, and the inspection cycle is typically a manual inspection every month. For this study, nine spans were strategically selected to represent the full spectrum of the environmental and operational challenges within the PLC. These spans collectively cover 1.4 km (s12% of the total 11.7 km corridor) and encapsulate 89% of the corridor’s elevation range (32–148 m) and 76% of its tree species composition, as per regional forestry surveys.

2.2. Data Acquisition

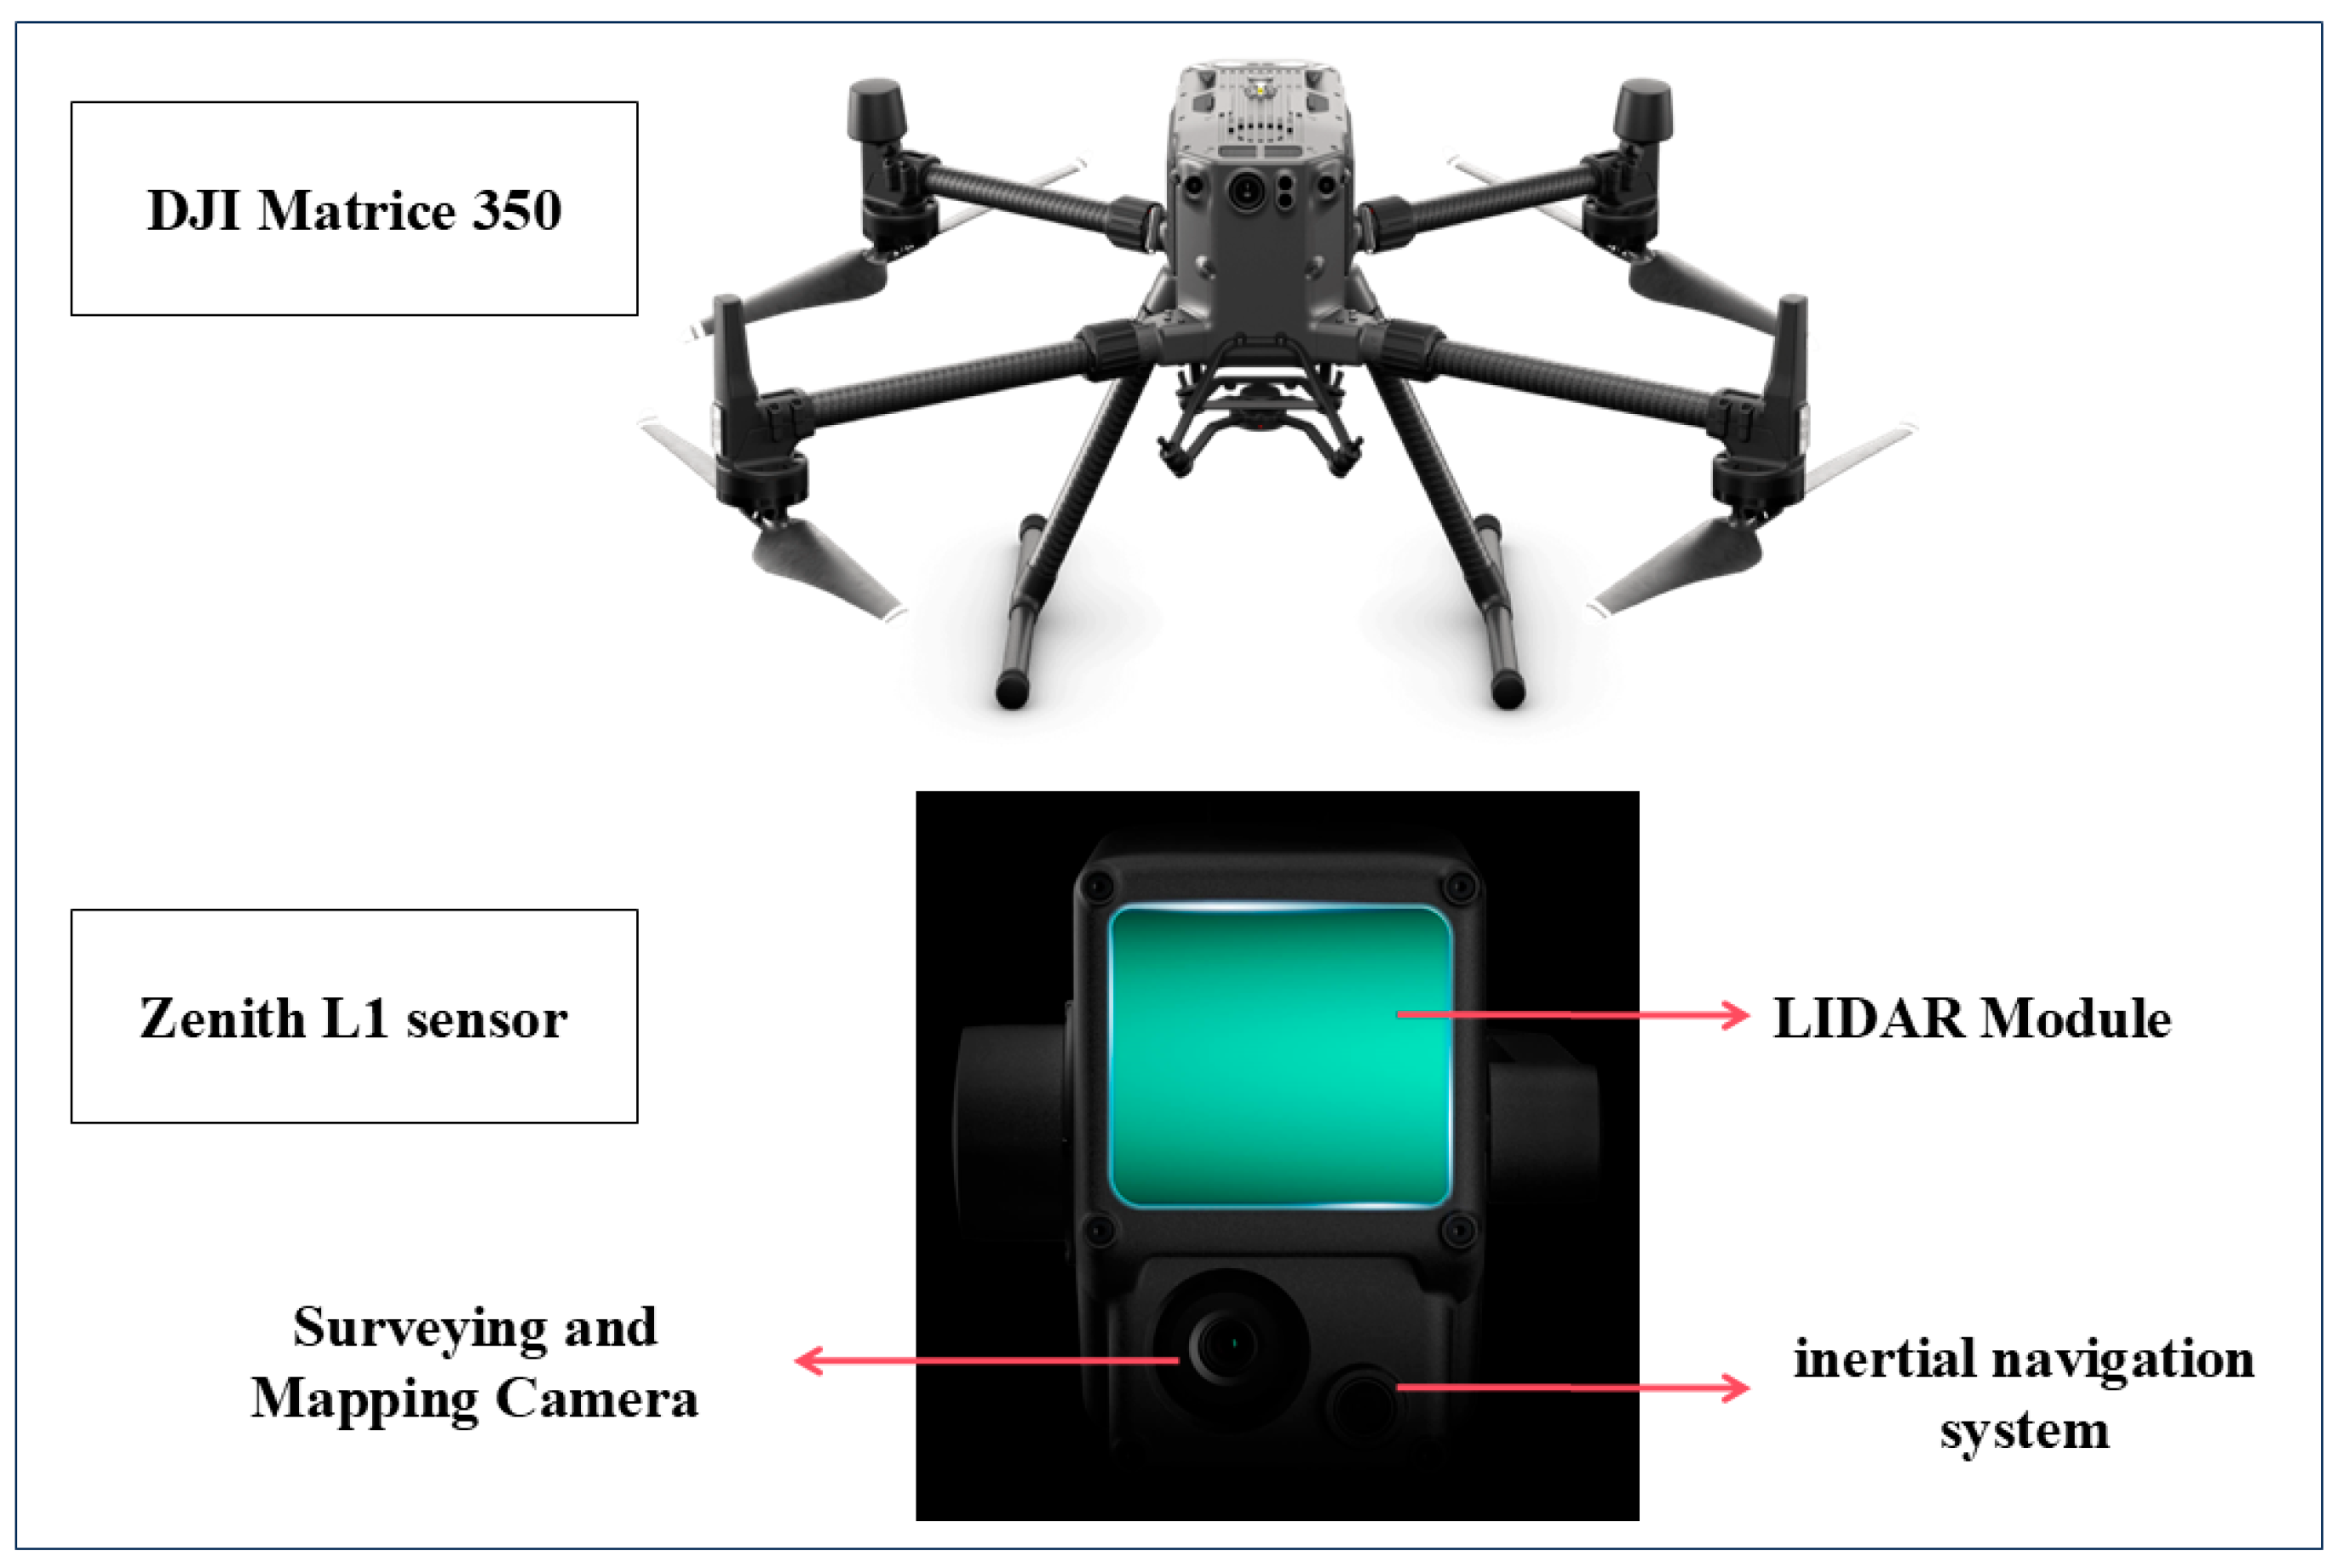
2.2.1. The UAV-LiDAR Data

In this study, a DJI Matrice 350 UAV equipped with a DJI Zenith L1 sensor (Shenzhen, China) (Figure 2) was utilized. Its flight took place under clear skies and at low wind speeds. The flight altitude was 80 m, the speed was 6.4 m/s, and the side overlap was 80%. The first echo wavelength was 905 nm, the maximum scanning angle was 75°, the scanning frequency was 240 kHz, the number of echoes was 2, and the average point cloud density was 210 points/m2. The raw point cloud data underwent systematic preprocessing using LiDAR360 (v7.2) through the following steps: (1) The coordinate system employed CGCS2000 and Yellow Sea 1985 height. (2) Noise removal. (3) Ground point classification. The processed data were exported in LAS format.

2.2.2. Field Inventory Data

We conducted a ground survey in June 2024, obtaining the base coordinates of 121 trees within the PLC and collecting 200 ground points using Real-Time Kinematic (RTK). We measured trees with a diameter at breast height (DBH, defined as the diameter at 1.3 m above ground level) of ≥5 cm using a circumferential ruler. The trees’ heights and the coordinates of 1095 conductor points were measured using a total station. We measured the crown diameter of each tree using a tape measure. The statistical results on the measured data are presented in Table 1.

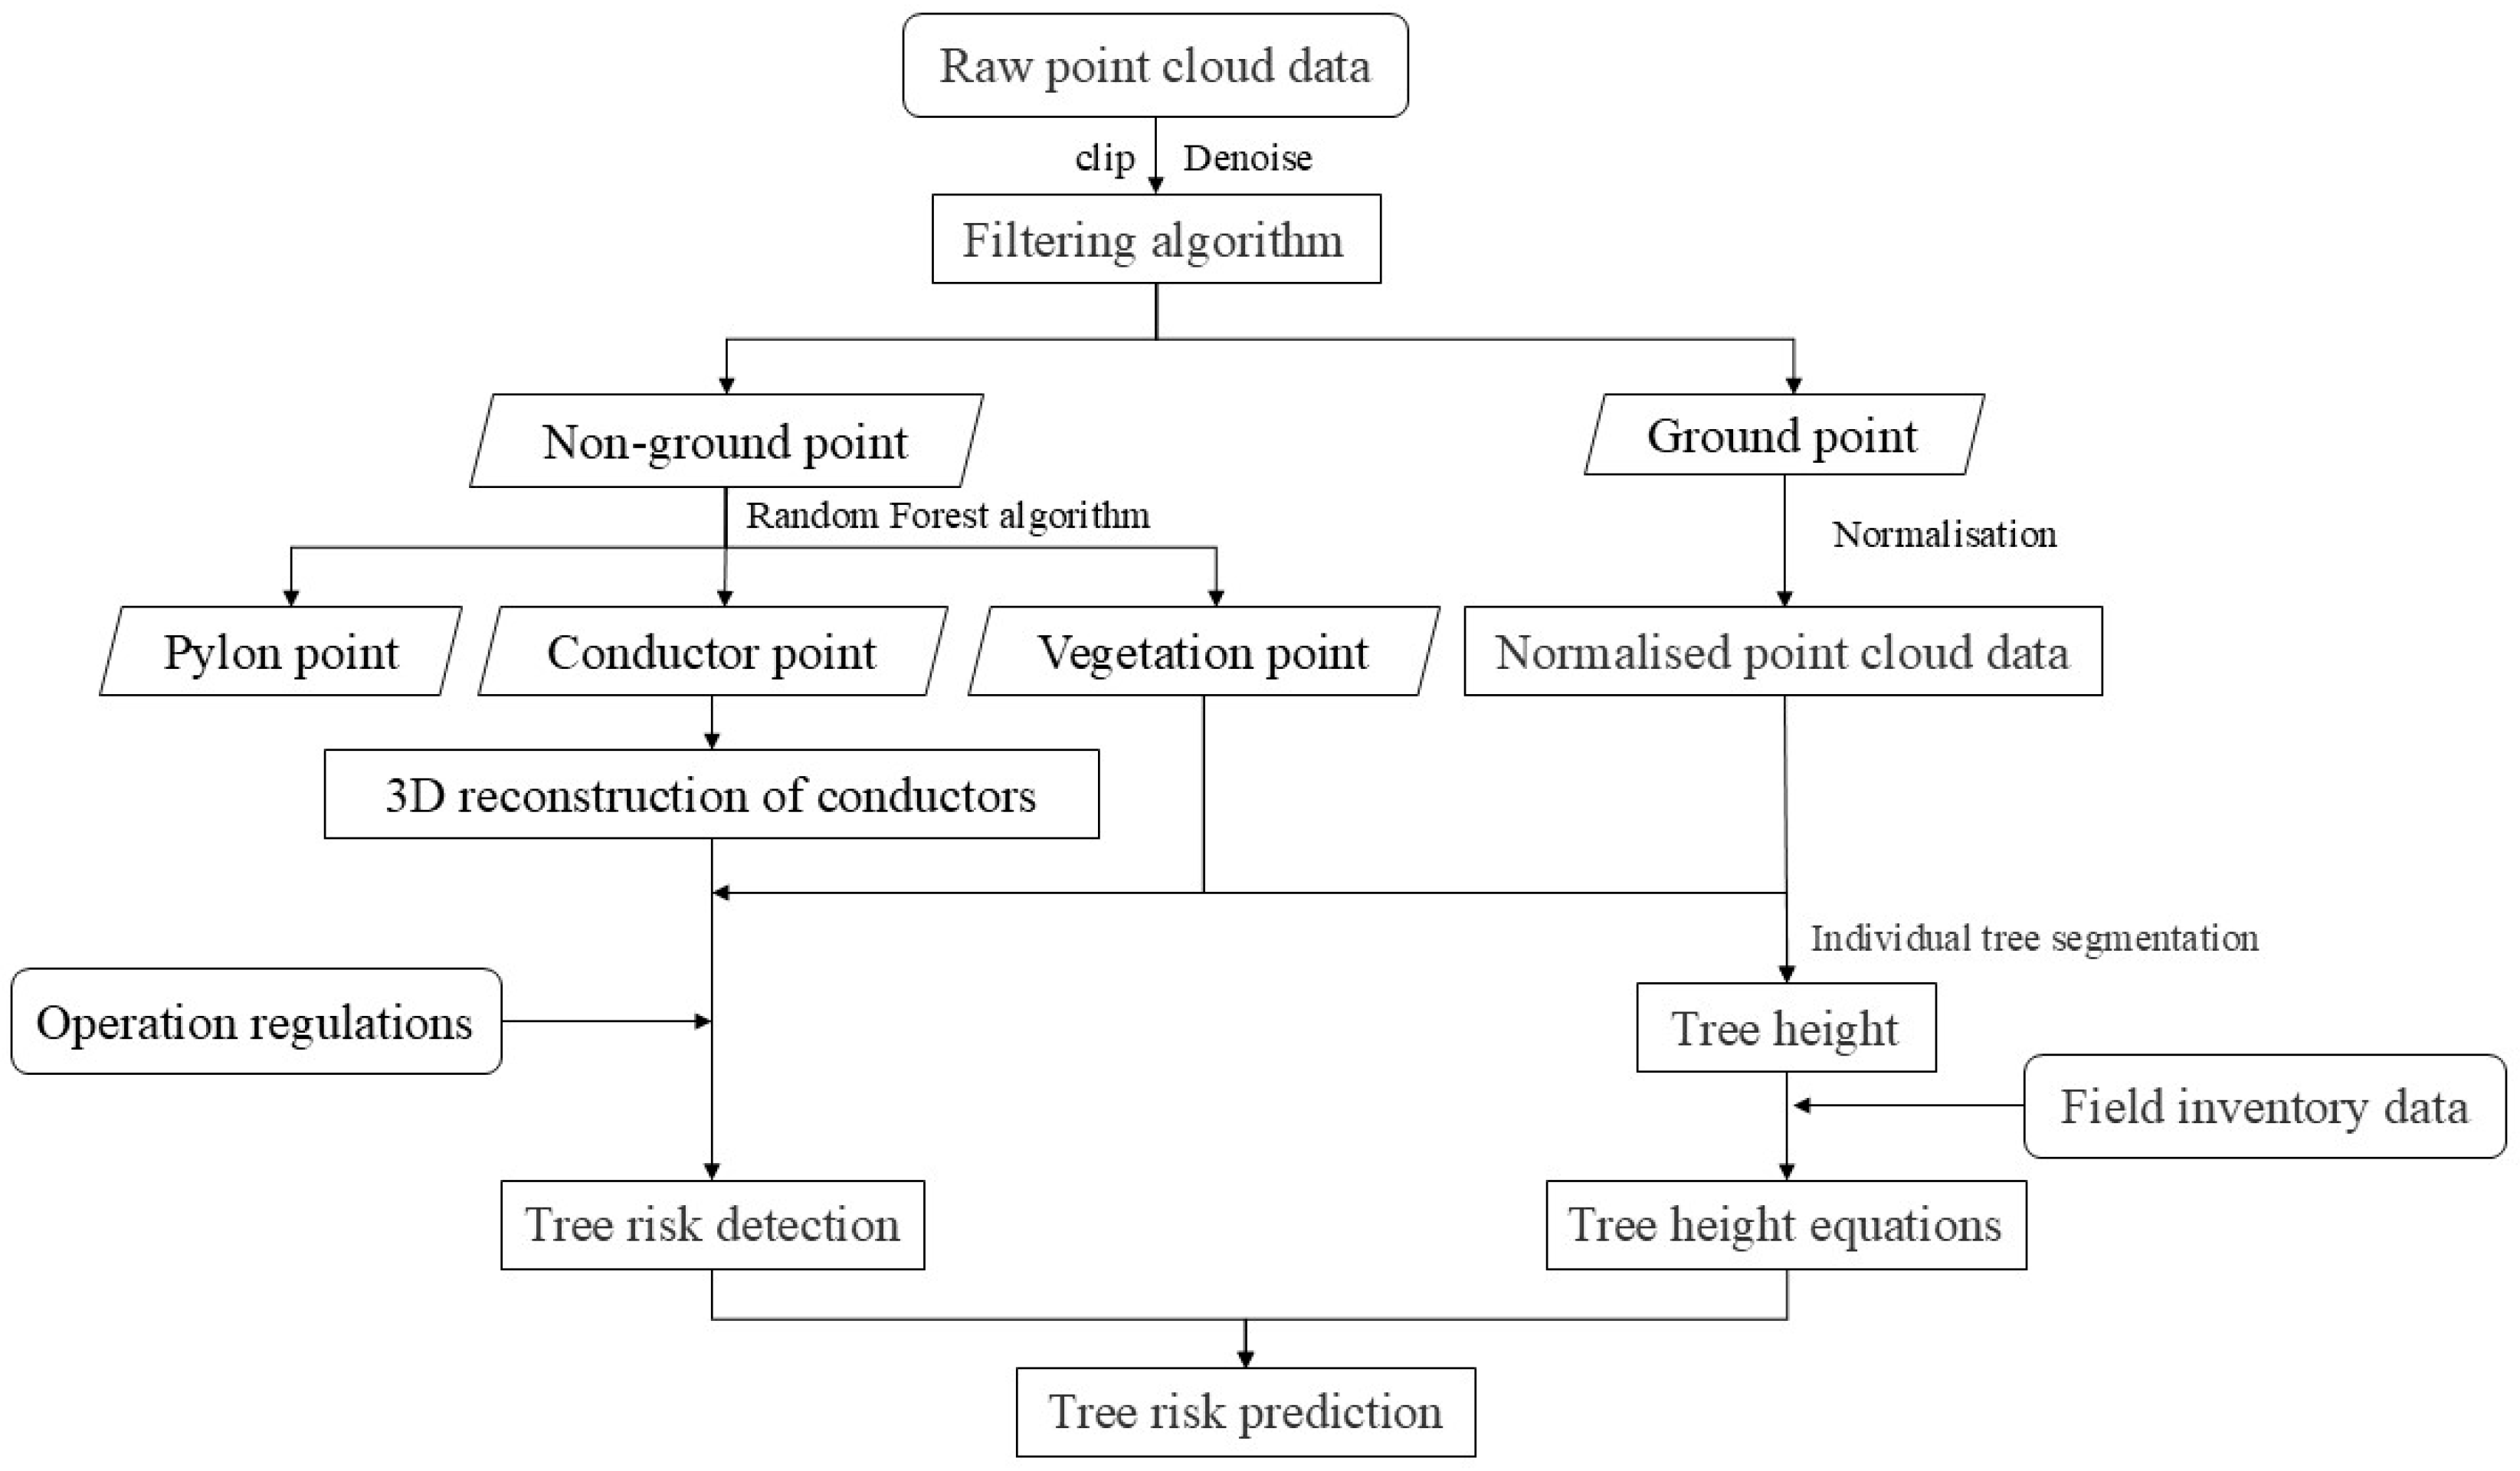
2.3. Overall Architecture

This paper focuses on the vegetation in the AC (110 kV) high-voltage PLC along Nonglin Road in Lin’an District, Hangzhou City, as the research subject and employs UAV-LiDAR technology to acquire point cloud data to detect tree risks on this high-voltage transmission line, integrating field inventory data and utilizing a tree height equation to forecast changes in the tree barriers. The process is illustrated in Figure 3. Initially, the point cloud data are clipped based on the line’s location and direction, and the original point cloud is preprocessed through denoising [19]. Ten pylons in the area are numbered from south to north, and the corresponding files are extracted. Subsequently, various filtering algorithms are employed to separate the ground and non-ground points, and the most accurate method is selected to generate the Digital Elevation Model (DEM). Then, based on this, the Random Forest algorithm, a machine learning technique [20], is used to classify the non-ground points into conductor points, vegetation points, and pylon points, and the extracted power line point cloud is reconstructed in three dimensions using the catenary equation [21]. Then, according to the DL/T 741-2019 overhead transmission line operation regulations [18], the safety distance is set, tree risks are detected, dangerous vegetation points are marked in red, the distance to the conductor is calculated, and the corresponding coordinates are provided. Finally, a span of the data is selected using ground points for normalization, the tree heights are extracted using individual tree segmentation, and appropriate tree height equations are used in combination with the ground survey data to predict changes in the tree risks.

2.4. Methodology

2.4.1. Point Cloud Classification

In this paper, point cloud classification is conducted in two steps. The first step involves classifying the point cloud into ground points and non-ground points using a filtering algorithm; the second step involves classifying the non-ground points into conductor points, pylon points, and vegetation points using the Random Forest algorithm, a machine learning technique.
To more effectively mitigate the impact of the terrain on the accuracy of the single-tree segmentation and tree height extraction, we employed five filtering algorithms: the Cloth Simulation Filter (CSF) [22], Improved Progressive TIN Densification (IPTD) [23], Progressive TIN Densification (PTIN) [24], Quadratic Surface Filtering, and a Slope-Based Filtering Algorithm [25].
The non-ground points were classified into vegetation points, pylon points, and conductor points using the Random Forest (RF) classifier implemented in Scikit-Learn. The model’s architecture was optimized through hyperparameter tuning based on prior LiDAR studies [26] as follows: (1) Ensemble size: 500 decision trees (n_estimators) to balance the computational cost and generalization errors. (2) Depth control: Maximum tree depth = 20, enforced via pre-pruning to prevent overfitting. (3) Split criterion: Gini impurity minimization with the minimum leaf samples = 5. (4) Feature subsampling: Square root of the total features (max_features = ‘sqrt’) per tree, as per Breiman’s recommendation [27]. Seven geometric and radiometric features were extracted from 1 m3 voxels: (1) the height above ground (Z_{normalized}); (2) the intensity percentile (10th, 50th, 90th); (3) the 3D covariance matrix eigenvalues (λ1, λ2, λ3); (4) the omnivariance ( λ 1 λ 2 λ 3 3 ); (5) verticality ( 1 λ 3 λ 1 + λ 2 + λ 3 ); (6) RGB color means; and (7) local point density (pts/m3).
Eight spans (51,498,236 points) were selected for fine manual classification to serve as the training samples for model generation, and one span (6,456,891 points) was designated as the validation data to facilitate the subsequent 3D reconstruction of the conductor points and individual tree segmentation of the vegetation points.

2.4.2. Three-Dimensional Reconstruction of the Conductors

The 3D reconstruction of the conductors involves transforming the point cloud into vector data. Given that the morphology and orientation of the power lines may vary between spans, the classified conductor point cloud data cannot be reconstructed directly in 3D, and the point cloud is divided into multiple spans.
To accurately describe the three-dimensional configuration of an individual conductor, as shown in Figure 4, the structure is methodically decomposed across multiple orthogonal projection planes. On the horizontal X-O-Y plane, linear regression models determine the conductor’s geometric configuration, while on the vertical X-O-Z plane, the catenary curve equation models the conductor’s suspended state [21].
(1)
The Linear Equation
To introduce the angle of the line and the perpendicular distance from the origin to the line, a point-normal equation is used to describe the conductor’s morphology on the X-O-Y plane; this is shown in Equation (1).
T = x c o s θ + y s i n θ
where T corresponds to the orthogonal projection distance from the coordinate’s origin to the linear conductor path; θ denotes the angle between the vertical segment and the X-axis, with the counterclockwise direction considered positive. The model coefficients are derived through computational implementation of a least squares optimization technique based on discrete coordinate datasets.
The least squares method is a standard approach in regression analysis to approximating the solution of overdetermined systems by minimizing the sum of the squares of the residuals. In this study, for the linear equation describing the conductor’s morphology on the X-O-Y plane, the parameters T and θ were determined by applying the least squares method to the projection coordinates obtained from the point cloud data.
To determine the location of the endpoints of the line, the projection range factor μ is defined using trigonometric functions, which are presented in Equation (2) and serve as a link between the linear equation and the catenary equation.
μ = x i x fp sin θ       i f   s i n θ cos θ μ = y i y fp cos θ       i f   s i n θ < cos θ
Here, ( x i , y i ) are the projection coordinates obtained from the point cloud on the X-O-Y plane; ( x fp , y fp ) are the coordinates of the intersection between the linear and vertical segments. The maximum and minimum values of μ correspond to the two endpoints of the line.
(2)
The Catenary Equation
On the vertical X-O-Z projection plane, the conductors manifest as a catenary. Consequently, we employ the catenary equation, as established in Reference [28], to model the power line configuration. The mathematical representation is articulated as follows:
a cosh a μ + b + c = a e a μ + b + e a μ b 2 + c
where a, b, and c are the parameters of the catenary equation.
To facilitate the calculation of the parameters, we simplify the catenary using Taylor’s formula [29]; the higher the degree of the polynomial, the more accurate the fitting result becomes. Therefore, we simplify the catenary into a fourth-degree polynomial, which can be expressed as
Z = a + a ( a μ + b ) 2 2 + a ( a μ + b ) 4 24 + c
where Z denotes the fitted elevation of the conductor using a polynomial.
The optimal parameters of Equation (5) are determined using the least squares method [30], which is mathematically expressed as
F a , b , c = i = 1 n a + a ( a μ i + b ) 2 2 + a ( a μ i + b ) 4 24 + c Z i 2
The partial derivatives of a, b, and c in Equation (5) are calculated to obtain Equation (6).
F a = 2 i = 1 n a + a ( a μ i + b ) 2 2 + a ( a μ i + b ) 4 24 + c Z i Z Z i a F b = 2 i = 1 n a + a ( a μ i + b ) 2 2 + a ( a μ i + b ) 4 24 + c Z i Z Z i b F c = 2 i = 1 n a + a ( a μ i + b ) 2 2 + a ( a μ i + b ) 4 24 + c Z i
Here, n represents the number of point clouds involved in the conductor fitting; Z i and μ i are the elevation and the projection range of the ith conductor point; and Z denotes the fitted elevation calculated using Equation (4).
The optimal values for the parameters in Equation (4) are obtained by setting all of the above partial derivatives to zero.

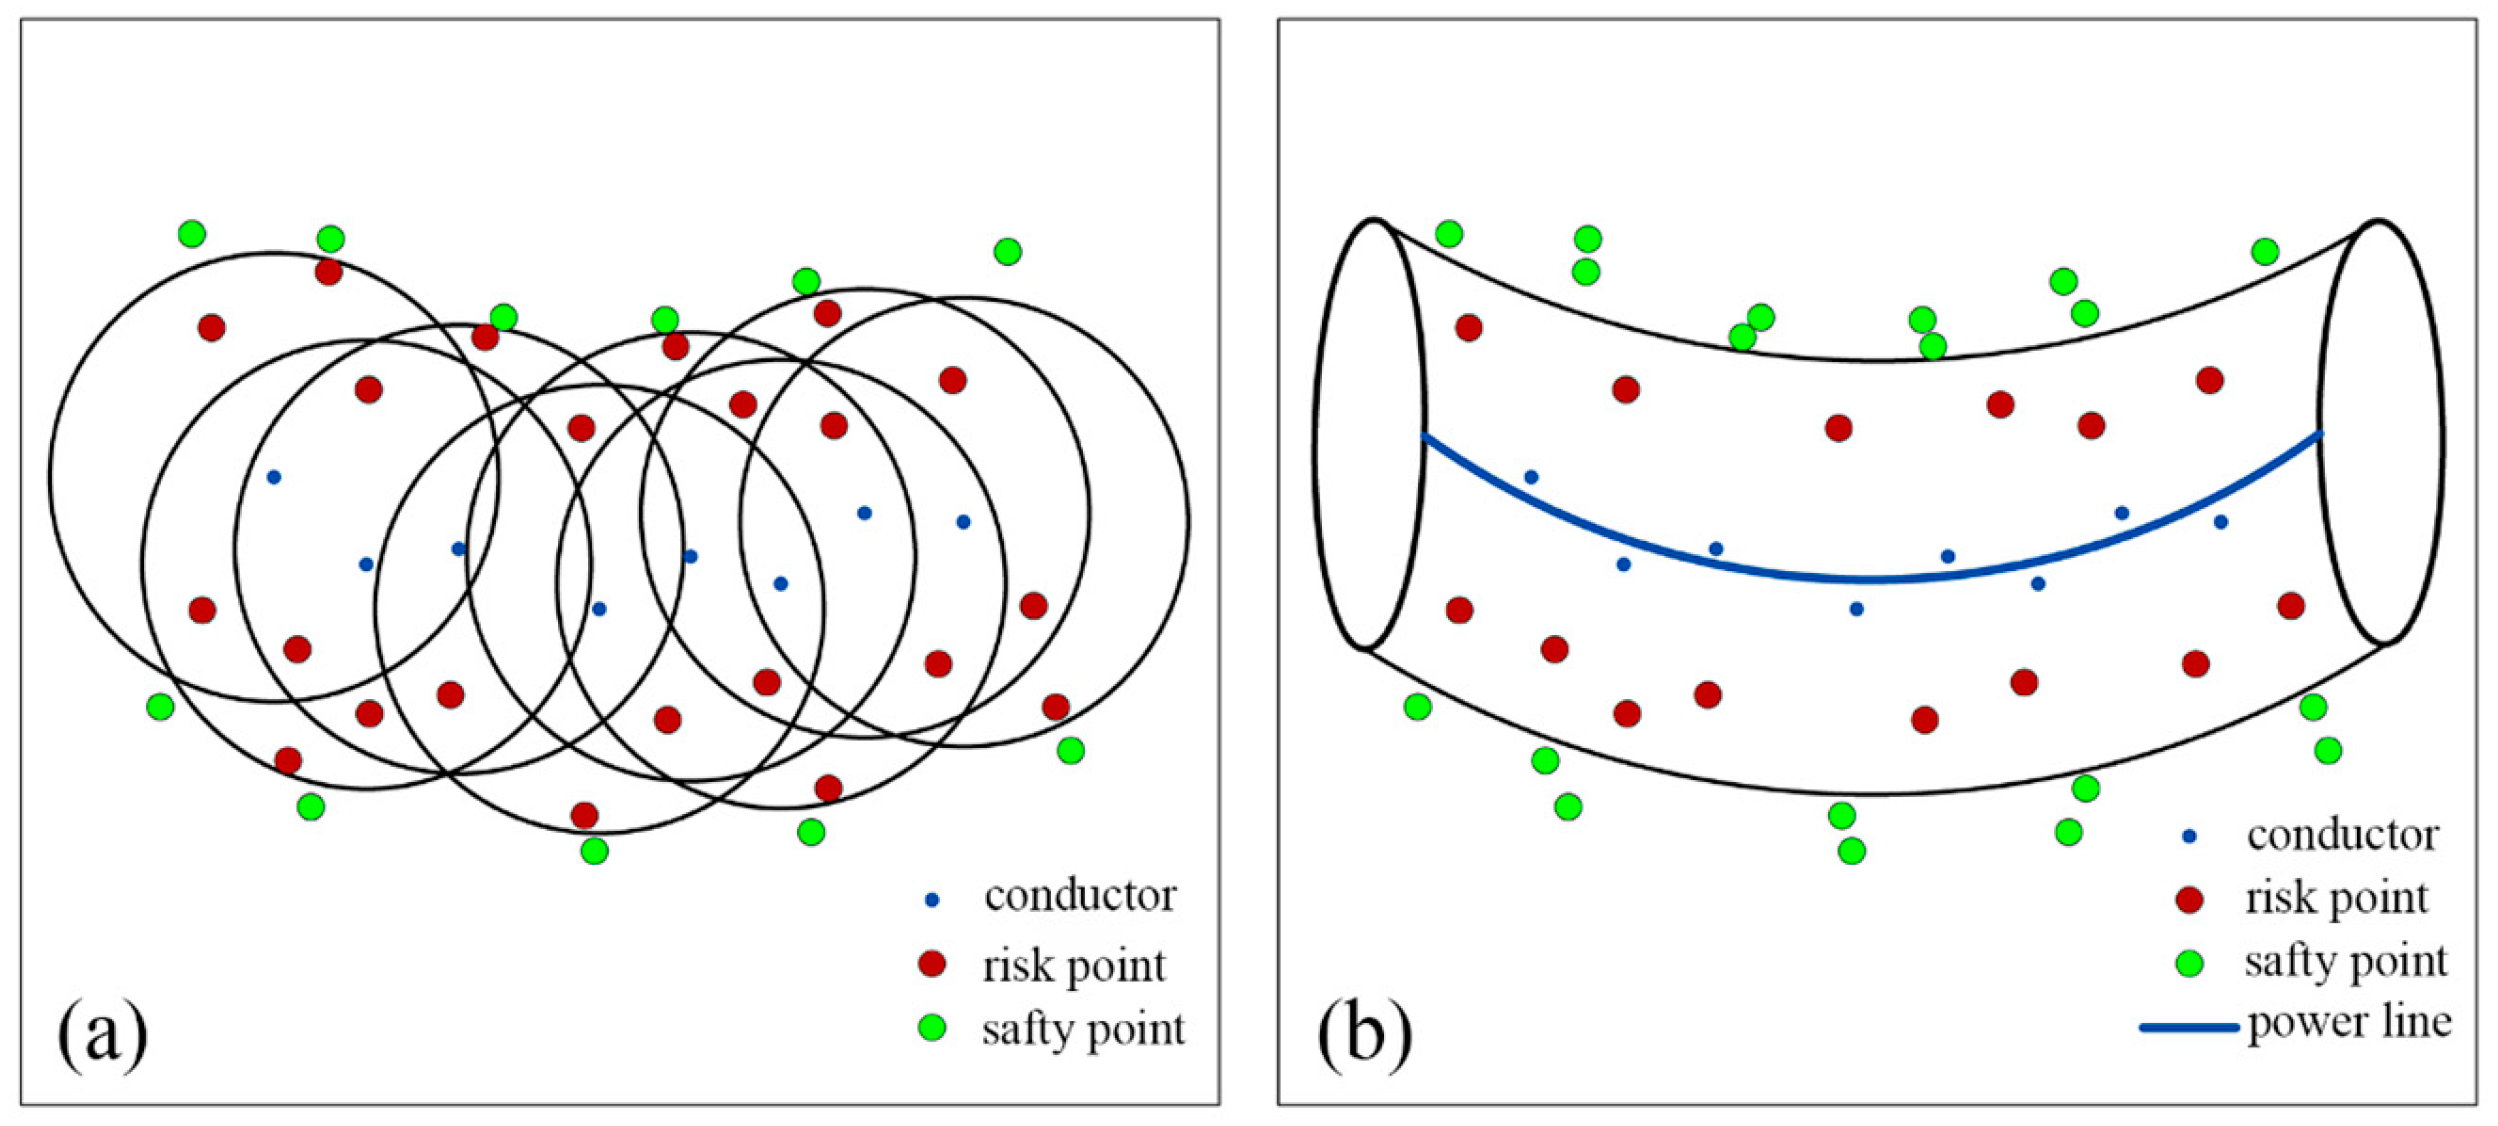
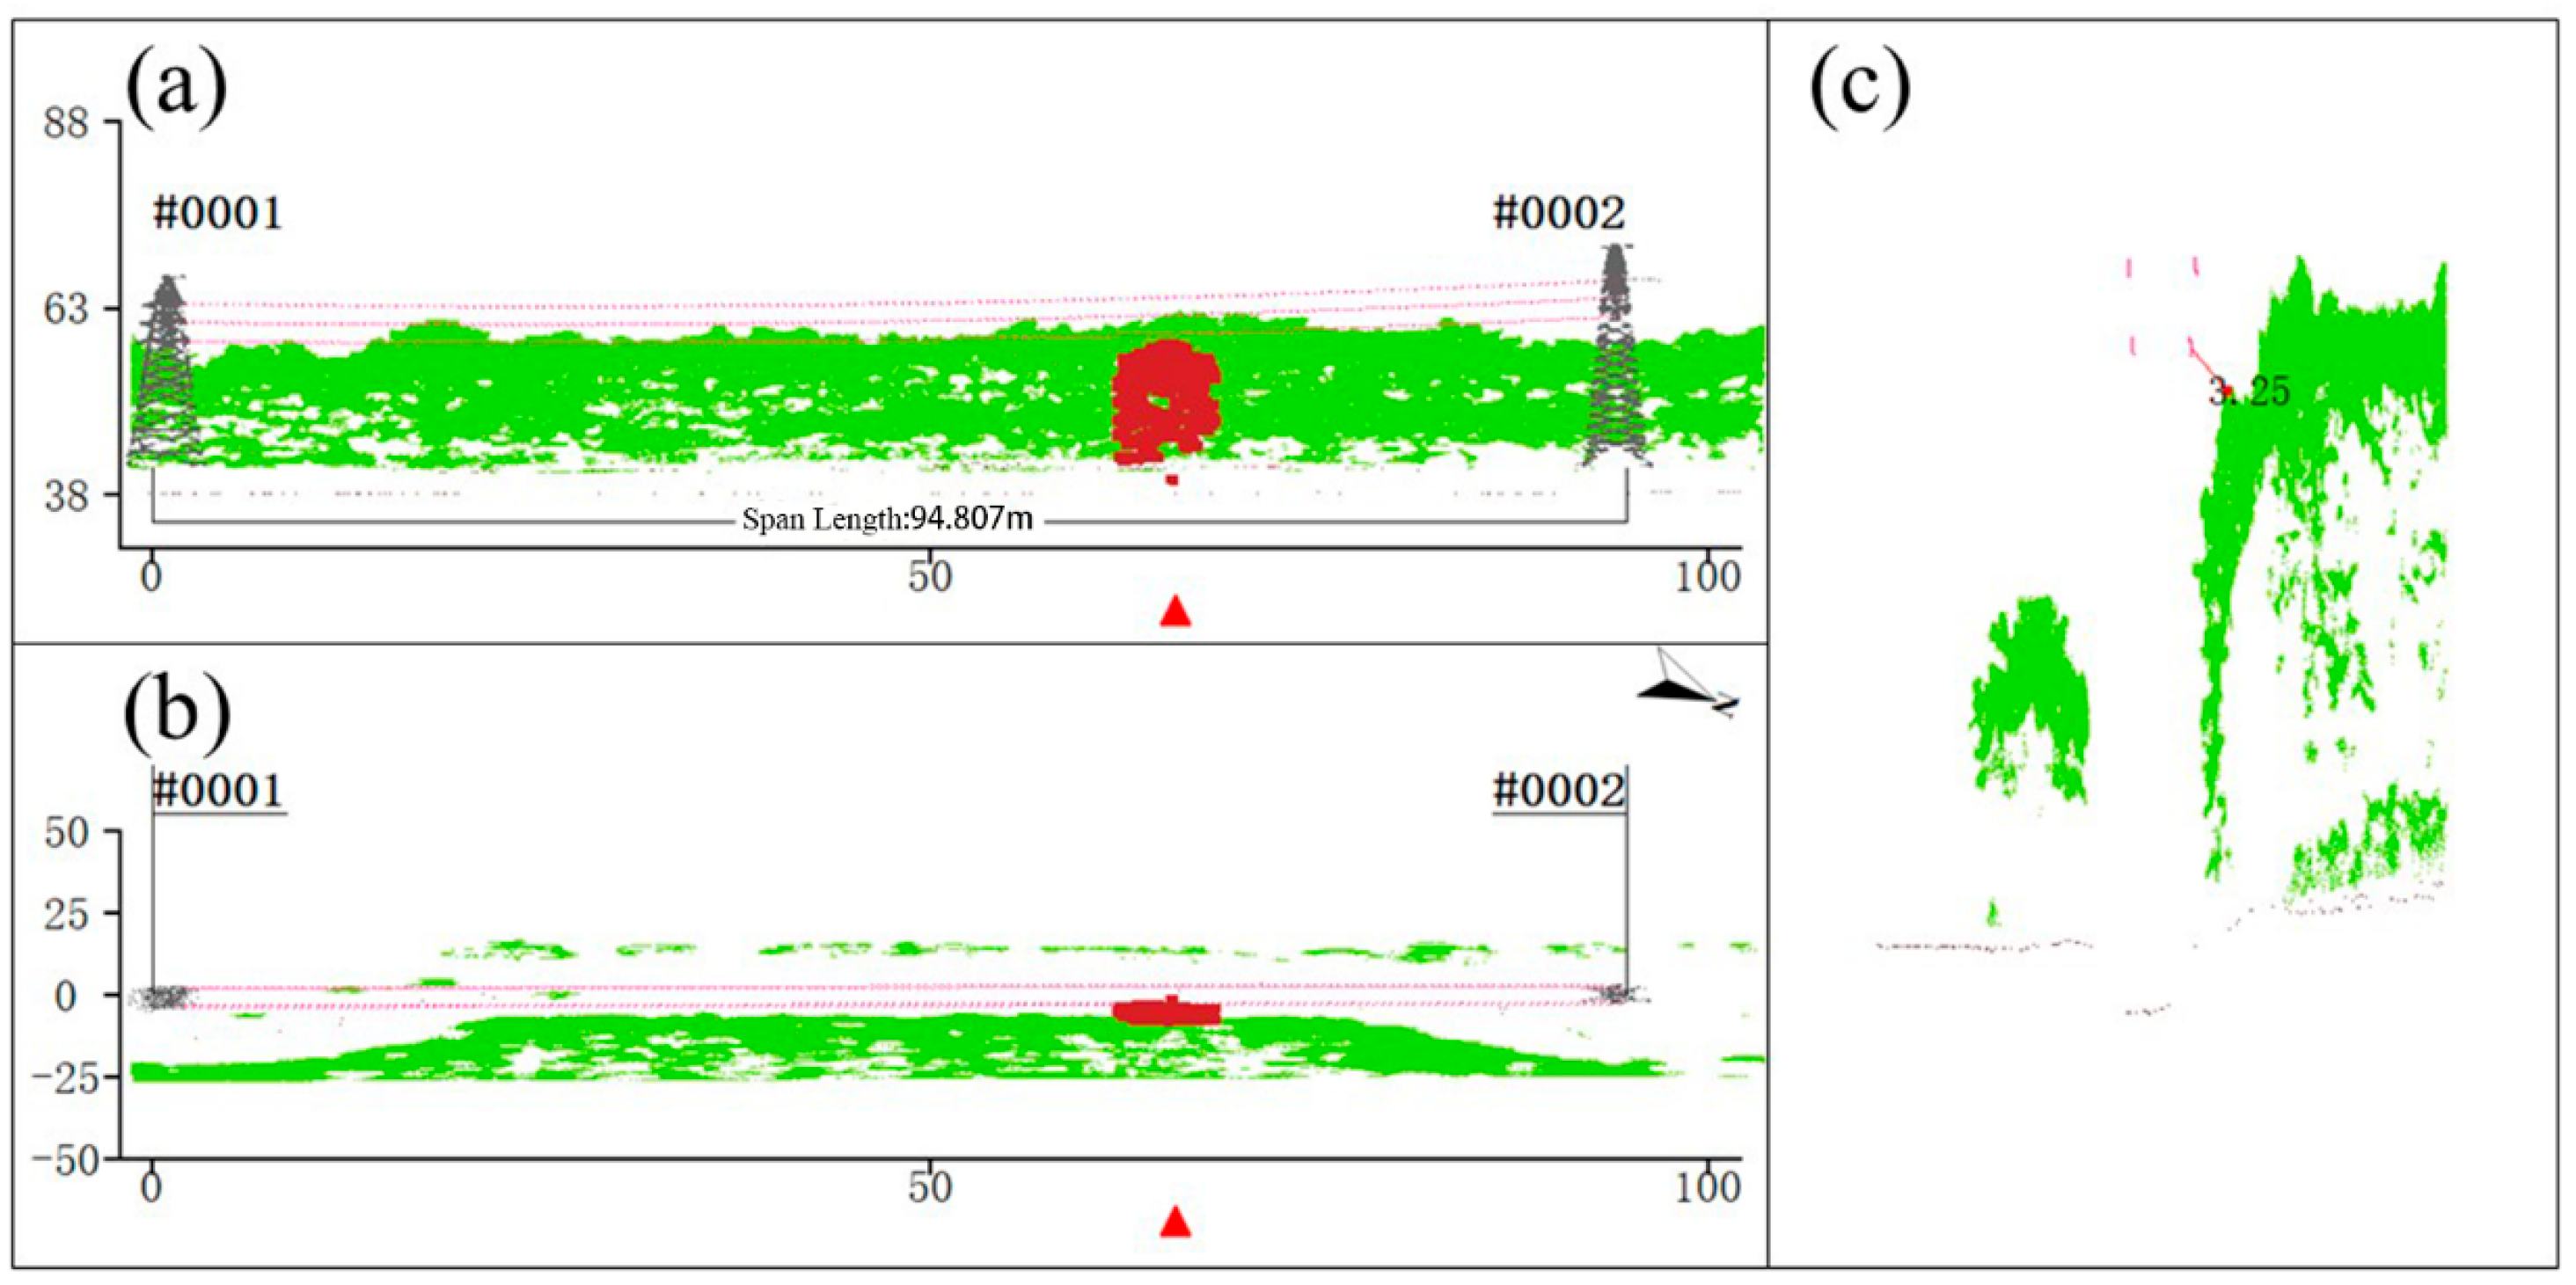
2.4.3. Tree Risk Detection

The identification of tree-related hazards within electrical transmission corridors necessitates quantifying the spatial relationships between the vegetation and electrical conductors. These measurements are evaluated against regulatory safety standards to determine potential vegetation encroachment risks. When vegetation is found to be in unsafe proximity to conductors, its precise geographic coordinates are recorded to facilitate prioritized maintenance interventions and prevent potential power line failures [12]. Based on the voltage level of the selected PLC and the industry code for the power sector, ‘Regulations for the Operation of Overhead Transmission Lines’ (DL/T 741-2019) [18], the safety distance was determined to be 3.5 m.
This paper employs two tree risk detection methods, one based on a point cloud and the other based on 3D reconstruction, to detect the tree risks along the entire line. As shown in Figure 5a, the detection method based on a conductor point cloud involves using the conductor point as the center of a sphere and the safety distance as its radius. If a vegetation point falls within this spherical range, it is identified as a tree risk point. As shown in Figure 5b, 3D-reconstruction-based tree risk detection involves using the power line as the axis. If a vegetation point falls within the cylindrical range defined by the safety distance as the radius, it is identified as a tree risk point; otherwise, it is considered a safety point.

2.4.4. Individual Tree Segmentation and Tree Height Extraction

A single tree is the fundamental unit of a tree barrier, and individual tree segmentation can accurately determine the height of a single tree. Generating DEMs based on the ground points for normalization is a crucial step before individual tree segmentation, as it removes the effect of the terrain relief on the elevation values of the point cloud data.
The traditional Point Cloud Segmentation (PCS) algorithm used by Li et al. [31] struggles to accurately identify canopy vertices in adhering and overlapping canopies, resulting in poor accuracy for individual tree segmentation. To address this, this study combines a seed-point-based approach with the PCS algorithm proposed by Lu et al. [32], using the spatial positions of standing trees obtained from RTK measurements as the initial points. This process involves calculating the horizontal distances of all of the points surrounding the initial point, comparing these distances with a set threshold to determine the tree boundaries, and achieving single-tree segmentation. Cyclic iterations continue until all of the trees are segmented, followed by tree height extraction.

2.4.5. Tree Risk Predictions

In this paper, tree risk predictions are based on using a tree growth model to forecast the coordinates of potential future tree barrier points. First, it is necessary to determine whether fast-growing tree species, such as bamboo and eucalyptus, are present in the PLC. Bamboo, in particular, grows rapidly and has hollow trunks, making it highly susceptible to falling or bending under snow loads. If fast-growing trees are present, all such species must be removed; otherwise, the dominant tree species in the forest stand must be identified, and then, based on the average DBH, average height, and age of the trees in the forest stand, either existing growth equations must be used or a new growth equation developed for the predictions.
In this study, we used the growth equation for Taxodium distichum developed by Hu et al. [33], which is presented as Equation (7). The selection of Taxodium distichum for the growth modeling aligns with its dominance and rapid vertical growth under the region’s subtropical monsoon climate, which increases the risks of collision with conductors.
H = 23.3272 1 exp 0.0801 t 1.22858
where H represents a tree’s height, and t represents a tree’s age.

2.5. Evaluation Methods

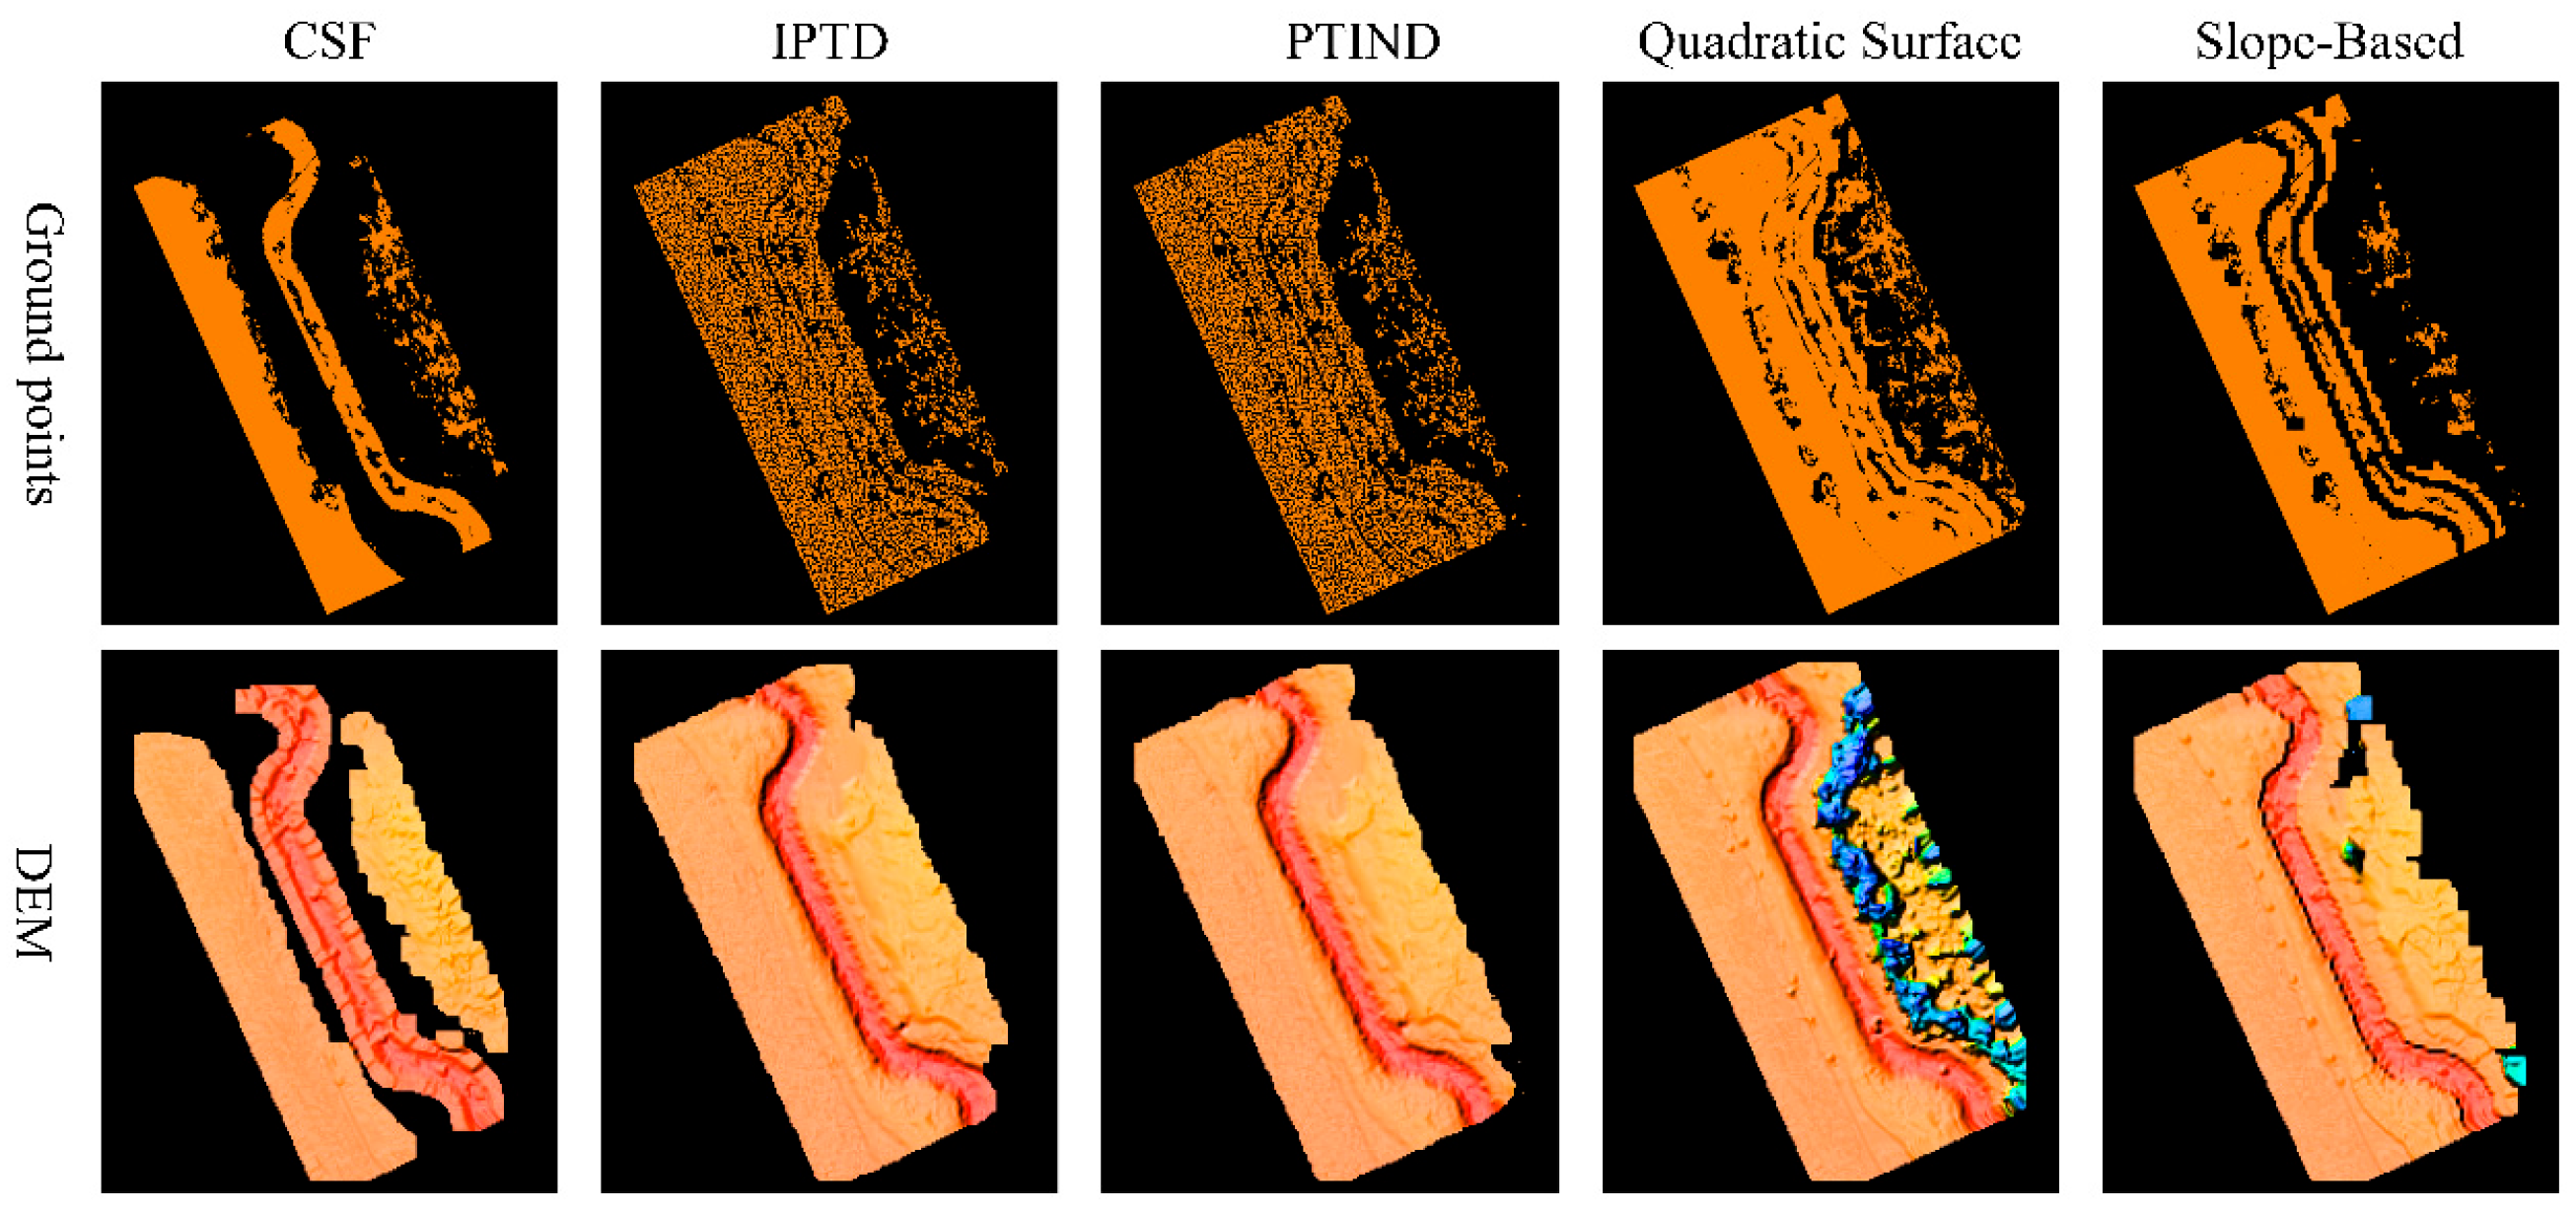
2.5.1. Evaluation of Ground Point Classification Accuracy

We employed various filtering methods to separate the ground points and subsequently used Inverse Distance Weighting (IDW) [34] to generate the DEM. A total of 200 ground points were measured using RTK as the reference values (RVs). The mean error (ME), the RMSE, and the rate of roughness were calculated for the accuracy evaluation. Twice the RMSE was taken as the limit error, errors within the limit error were included in the accuracy statistics, and errors exceeding the limit were considered gross errors.
M E = 1 n i = 1 n ( Z * Z )
R M S E = 1 n i = 1 n Z * Z 2 0.5
Here, Z * denotes the height estimated using the selected interpolation technique, Z denotes the height observed according to RTK, and n is the number of height points.

2.5.2. Accuracy Evaluation of the Conductor Point and Pylon Point Classification

Human-annotated conductor and pylon point clouds serve as the reference standard, while the precision–recall framework [35] is employed to objectively evaluate the performance and reliability of the point cloud classification process. The specific definitions of these evaluation metrics are
Precision = T P T P + F P
Recall = T P T P + F N
F score = 2 × Precision × Recall Precision + Recall
Here, TP, FP, and FN denote the counts of true positives, false positives, and false negatives when compared to the reference standard, respectively. Precision reflects the proportion of correctly identified positive instances among all predicted positives, while recall indicates the proportion of correctly identified positive instances among all actual positives. The F-score represents a balanced assessment of both the precision and recall, providing a single metric that captures the harmony between these two measures.

2.5.3. Accuracy Evaluation of the 3D Reconstruction of the Conductors

To evaluate the accuracy of the 3D reconstruction of the conductors, we measured 1095 conductor points using the total station coordinate measurements as the reference values and calculated the distance from the reconstructed vector to these reference points. The ME, maximum error, and minimum error are the three indices used to analyze the experimental results.

2.5.4. Accuracy Evaluation of Tree Risk Detection

Within this research framework, a total station instrument was employed to quantify the shortest spatial separation between the groupings of the tree risk locations and conductor positions, a value referred to as the RV. An assessment of the accuracy of tree risk point identification was conducted using four evaluation criteria: the ME, maximum error, minimum error, and RMSE.

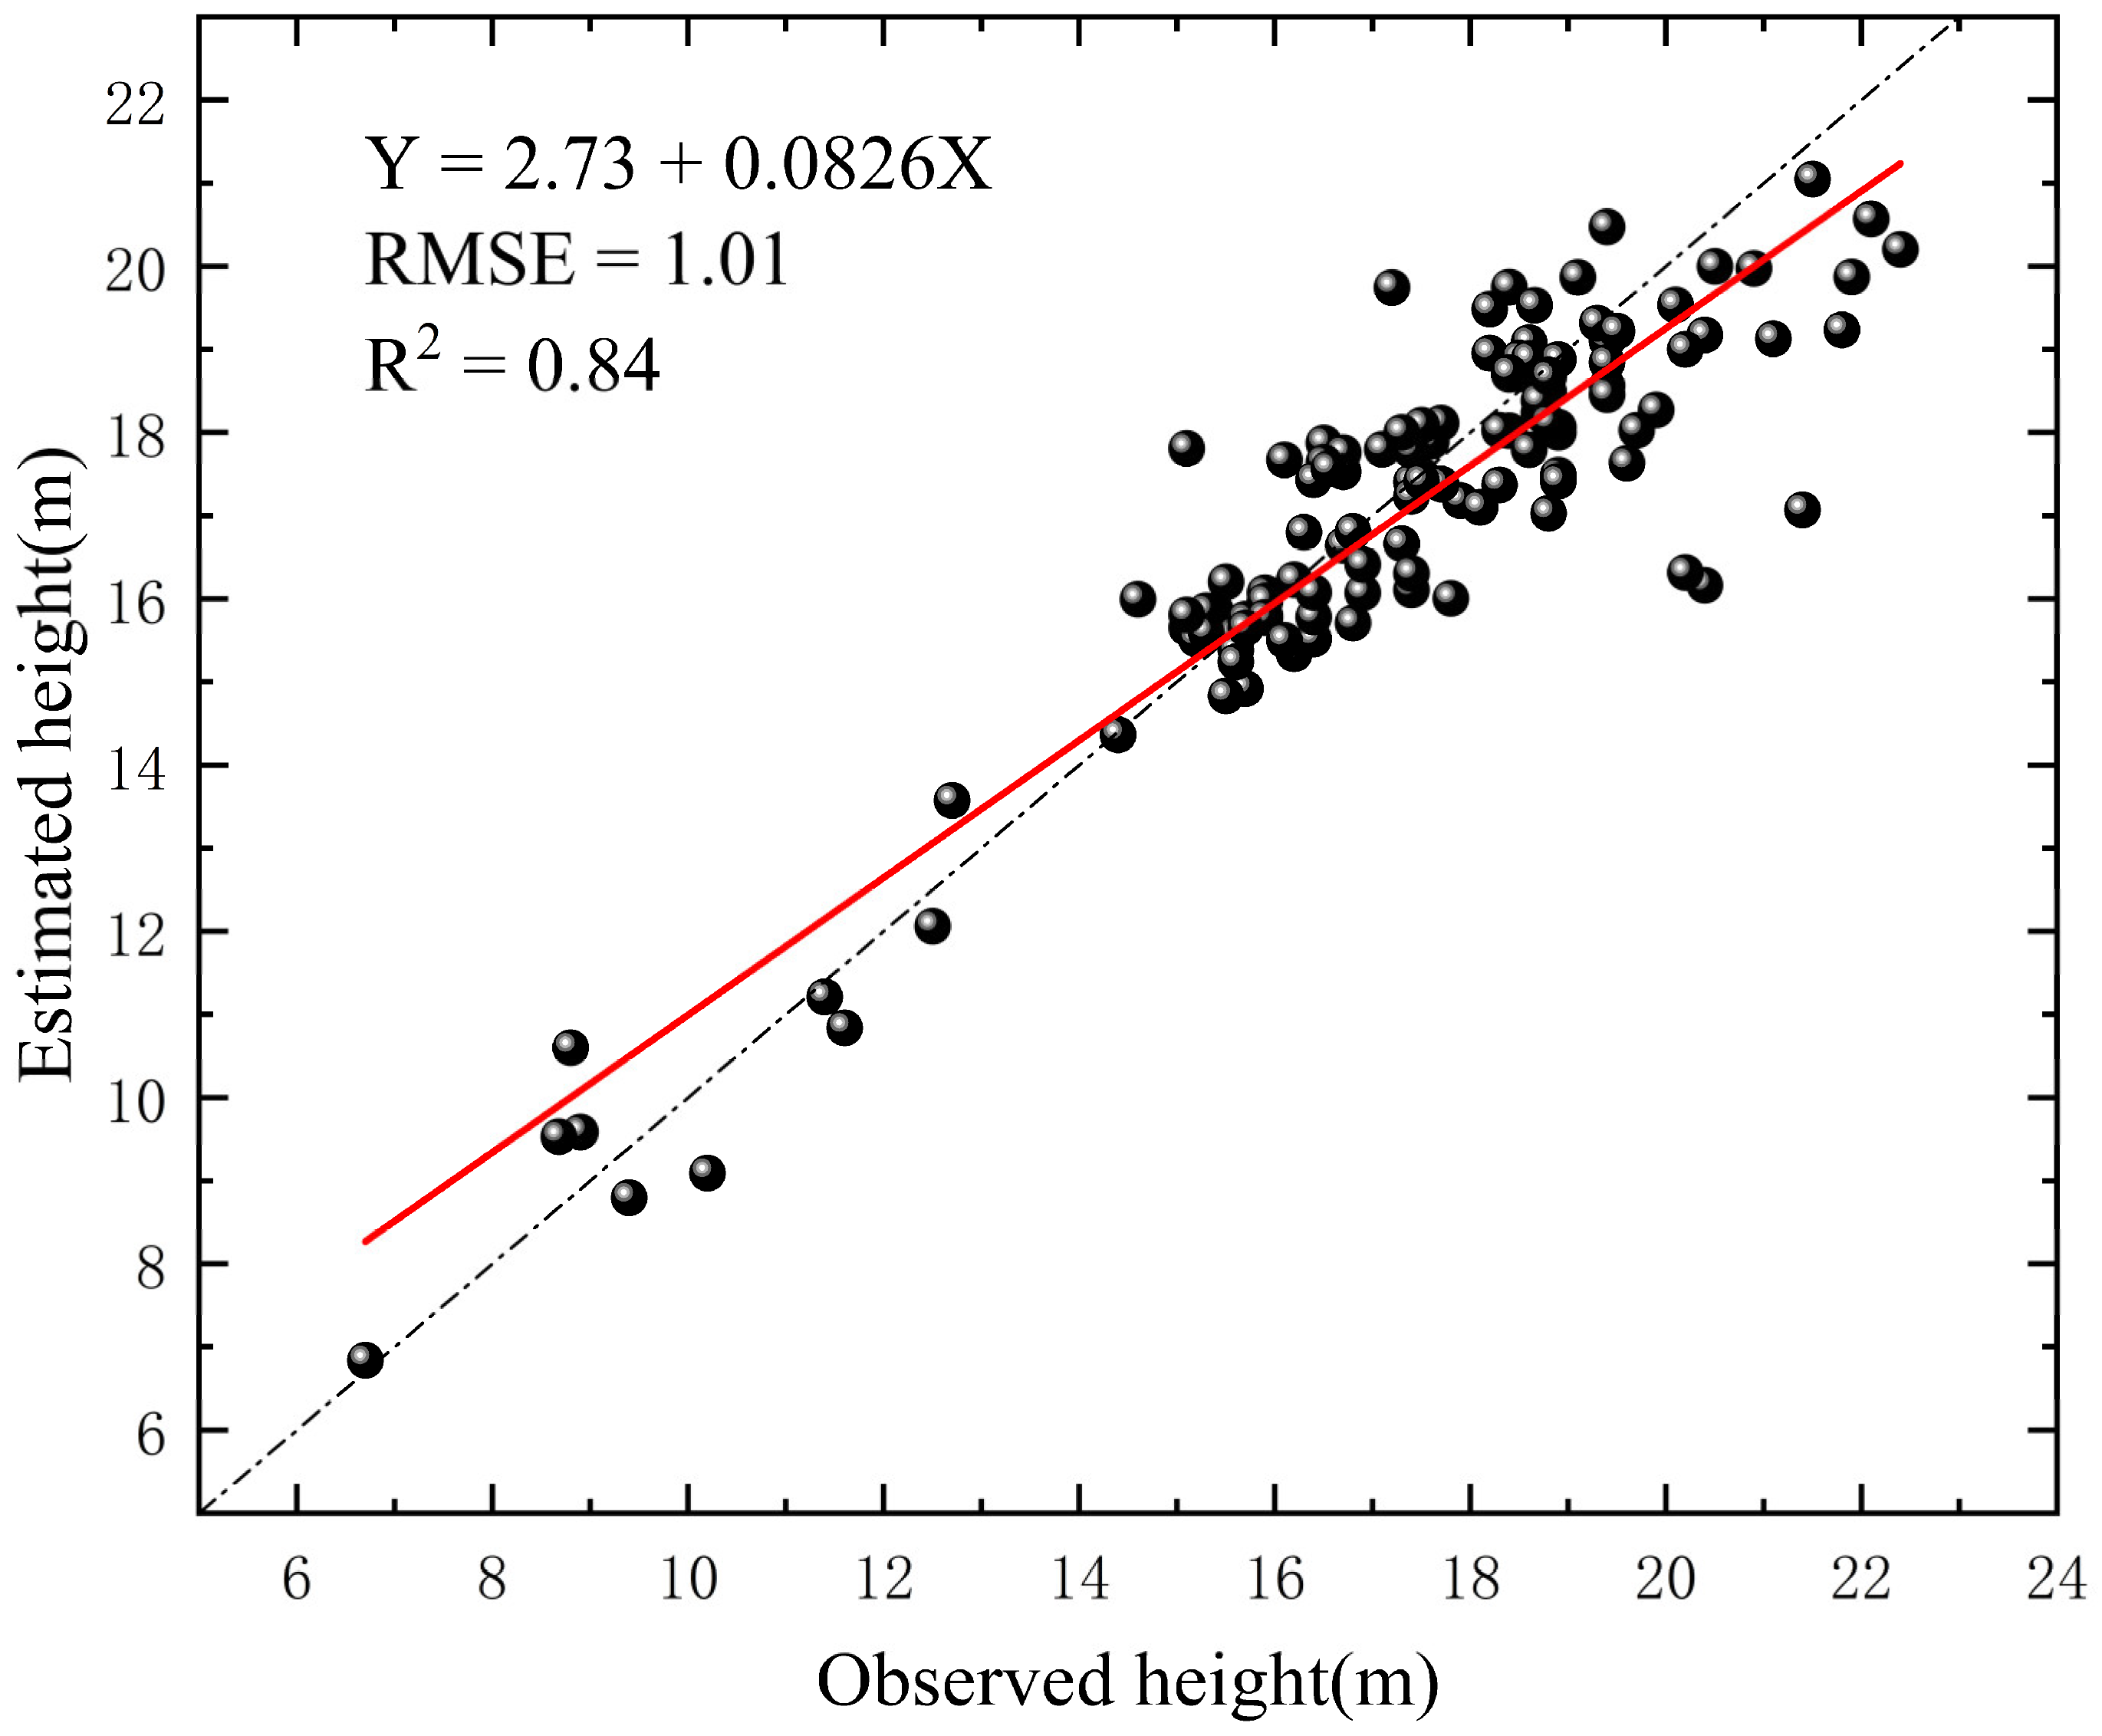
2.5.5. Accuracy Evaluation of Tree Height Extraction for Individual Tree Segmentation

In this study, the tree heights were measured using the total station height measurement method. The accuracy of these measurements was evaluated using the R 2 and the RMSE.
R 2 = 1 i = 1 n x i x i ^ 2 i = 1 n x i x ¯ i 2
where x i is the height observed via the total station, x ^ i is the height estimated from the from the individual tree segmentation, and n is the number of tree heights.

3. Results

3.1. Point Cloud Classification Results

3.1.1. Classification of the Ground Points

As shown in Figure 6, all five methods exhibit missing ground points in the areas covered by vegetation. IPTD and PTIND demonstrate a more uniform distribution of the ground points, whereas the CSF results are more concentrated. There is no obvious misclassification in these three methods. In contrast, quadratic surface filtering and slope-based filtering show significant misclassifications, with quadratic surface filtering having the most severe misclassification. Table 2 indicates that the quadratic surface filter has the highest roughness rate, ME, and RMSE. Conversely, the CSF method has the lowest roughness rate, ME, and RMSE. The accuracies of IPTD and PTIND are relatively similar.

3.1.2. Classification of the Conductor Points and Pylon Points

As shown in Figure 7, the overall classification effect with the experimental data is satisfactory. The primary section of the conductor points was fully extracted without interruptions or classification errors along the central portion of the transmission line. In contrast, the conductor points near the pylon structures exhibit a lower extraction accuracy, with a notable incidence of misclassification.
In particular, when the power lines suspended from transmission towers form near-right angles with the insulator structures, the insulator-related data disrupt the computations of the dimensional characteristics. As a result, the linear probability density of the power line point cloud in this region fails to reach its maximum potential, causing certain power line points to be excluded from identification, as depicted in Figure 7c.
In contrast, when the power line suspended from the tension-resistant tower aligns closely with the insulators, the one-dimensional linear probability of the insulator points and the drain line points at the connection is higher. This results in erroneous extraction of the power line points, as shown in Figure 7b. A statistical analysis based on Table 3 indicates that the Random Forest algorithm effectively classifies the conductor points and pylon points and is suitable for the power lines examined in this study.

3.2. Three-Dimensional Reconstruction of the Conductors

As depicted in Figure 8, the reconstruction results exhibit strong concordance with the point cloud data. To assess the accuracy of the 3D reconstruction of the power line further, we utilized the coordinate measurements of the conductors obtained via the total station as the RVs and computed the distance from each point to the fitted power line vector data to quantify the error. For this study, we selected three key indicators: the ME, maximum error, and minimum error. These metrics were employed to analyze the experimental results, with the findings presented in Table 4. In the 3D reconstruction of the six conductors, the mean error was less than 0.137 m, the maximum error was less than 0.384 m, and the minimum error was less than 0.0019 m. These results demonstrate that the method employed in this study achieves high accuracy, significantly surpassing the error threshold of 0.5 m stipulated by the State Grid Corporation of China.

3.3. Tree Risk Detection

The point-cloud-based method detected 31 tree barriers, and the 3D-reconstruction-based method detected 32 tree barriers. As shown in Figure 9, the horizontal coordinates indicate the distance from the lower-numbered pylon to a point representative of the tree barrier, the vertical coordinates indicate the clearance distance from a point representative of a tree hazard to the power line, the red circles indicate the 3D-reconstruction-based method, and the white diamonds indicate the cloud-based method. From Figure 9, we find that the red circles and white diamonds mostly appear in pairs, which indicates that the locations of the tree barrier points detected using the two methods and the clearance distances are close to each other in general. However, there is a small number of points that appear individually. This is possibly due to errors in both methods causing a few clusters to cross the threshold; for example, the threshold for point-cloud-based clustering is less than 15m but very close to 15m, and when based on 3D reconstruction detection, it exceeds 15m, thus resulting in a few individual points appearing.
As shown in Table 5, regardless of whether the total station measurement or the manual point cloud measurement is used as the RV for the accuracy evaluation, the accuracy of the 3D-reconstruction-based tree barrier detection method is superior to that of the point-cloud-based method. Additionally, for both the point-cloud- and 3D-reconstruction-based tree barrier detection methods, the error associated with the manual point cloud measurements is lower than that for the total station measurements.

3.4. Individual Tree Segmentation and Tree Height Extraction

As shown in Figure 10, the horizontal axis represents the tree height values measured using the total station, while the vertical axis represents the tree height values extracted using the seed points combined with the PCS algorithm. With an R2 = 0.84 and an RMSE = 1.01 m, these results indicate that the method employed in this study achieves high accuracy and good stability in tree height extraction.

3.5. Tree Risk Prediction

We selected the first span of the PCL for a further analysis of the tree risk predictions. The dominant tree species in the area is Taxodium distichum, which constitutes 74% of the trees, with an average height of 18.2 m and an age of 25 years. Figure 11 illustrates the results in tree barrier detection for the first span of power lines. The red point cloud in the figure indicates the locations where tree risks currently exist, and these locations are in urgent need of clearance maintenance.
Based on Equation (6), the average growth rate of the stand over the next 5 years is 0.248 m/year. After scaling up the individual trees proportionally, one additional tree was identified as a new risk point in addition to the risk trees already detected, as shown in Figure 12. We predict that a single tree located at 30°15′16.64″ N, 119°43′16.01″ E will create a new tree barrier risk within 5 years. This tree should be pruned or cut down promptly to mitigate the risk.

4. Discussion

This study focuses on the detection and prediction of transmission line tree risks using UAV-LiDAR technology. Globally, the stability of the power supply is crucial for economic development and social functioning. The increase in extreme weather events and the threat posed to power lines by tree growth underscore the importance of efficient power line monitoring and maintenance. In this paper, we have predicted the tree risk by extracting tree heights from vegetation surveys and applying individual tree segmentation within the PCL. This approach not only enhances the efficiency and accuracy of transmission line inspections but also contributes to more accurate clearance maintenance, which is vital for forest protection and the safe operation of power lines.
As shown in Figure 6 and Table 2, the results of ground point classification are clearly presented. The CSF method achieved the best performance, with the lowest roughness rate, mean error, and RMSE. IPTD and PTIND exhibited similar accuracy, which can be attributed to their comparable algorithmic principles and suitability for the study area’s relatively flat terrain. These two methods both employ progressive TIN densification approaches, which are effective in gradually refining the terrain model by iteratively adding points to the TIN structure. In flat areas, where the terrain changes gently, the performance difference between IPTD and PTIND becomes less pronounced, as both methods can adequately capture the ground surface with similar levels of detail [23].
In contrast, the quadratic surface filtering technique had the highest error rates. This is likely because quadratic surface filtering assumes that the ground surface can be approximated using a quadratic polynomial, which may not hold true in areas with more complex terrain features or interference from vegetation. In such cases, the quadratic surface model fails to accurately represent the actual ground surface, leading to the misclassification of non-ground points as ground points and vice versa. Additionally, the presence of vegetation and other non-ground objects within the point cloud can disrupt the quadratic surface fitting process, further increasing the errors in ground point classification.
In this study, the Random Forest algorithm was employed to extract the conductor points, achieving an F-score of 0.977. Ortega et al. [17] present a novel seven-stage pipeline for classifying the elements in power line corridors from LiDAR point clouds and modeling conductors. Their method performs well in classifying pylons and conductor points, with the recall and precision exceeding 90%. Wang et al. [36] proposed a method that effectively classified the power line points from airborne LiDAR data in urban areas by leveraging multi-scale slant cylindrical neighborhoods and Support Vector Machine (SVM) classification. Their method achieved a precision of over 97%, a recall of over 97%, and a quality rate of over 95% for both datasets. These results suggest that the Random Forest method holds significant potential for the extraction of conductor points. It is important to note that due to the extremely similar morphological characteristics of conductors and ground wires, they have often been grouped together in existing studies [37,38]. Consequently, no distinction was made between conductors and ground wires in this paper.
The results of the two methods for tree risk detection demonstrate that the 3D-reconstruction-based method outperforms the point-cloud-based method, regardless of whether total station measurements or manual point cloud measurements are used as the RVs. The accuracy of tree risk detection achieved in this study highlights the effectiveness of UAV–LiDAR technology in identifying and predicting the tree barriers around PCLs through point cloud classification and 3D reconstruction. This finding is consistent with the research of Matikainen et al. [3], who emphasized the potential of remote sensing technology in power line monitoring. Unlike traditional static clearance assessments, our framework uniquely integrates species-specific growth equations with regional climate projections. This approach enables proactive risk mitigation 3–5 years before potential canopy–conductor contact, contrasting with the reactive post-event maintenance typical of the conventional methods. Furthermore, the conventional bulk removal strategies eliminate significantly more vegetation than necessary. The single-tree risk markers employed in our methodology will substantially reduce unnecessary canopy loss across the validation span.
Although this study has generated valuable insights, certain limitations should be acknowledged. Firstly, our analysis focused on identifying tree risk points under real-world operational conditions, with limited examination of the detection methods under various simulated conditions. Future studies could bridge this gap by integrating the conductor fitting curves with environmental factors such as wind patterns, temperature fluctuations, and ice accumulation. Such an integrative approach would enable the analysis of tree risk points under various simulated operational conditions, potentially improving the comprehensive nature and practical application of detection systems [39,40]. Second, while UAV-LiDAR typically allows a portion of its laser pulse energy to penetrate the forest canopy, enabling the high-accuracy acquisition of tree height and canopy information, UAV–LiDAR faces uncertainty in extracting diameter at breast height (DBH) measurements due to the canopy obstructing the laser points from reaching the tree trunk [41]. Yadav and Chousalkar [42] place special emphasis on the impact of the intrusion of vegetation and other occlusions on power line extraction in complex road environments, specifically within the context of ground-based mobile LiDAR point clouds. Consequently, future research could be enhanced through the following strategies: (1) Multi-sensor fusion: Deploy ground-based mobile LiDAR systems (e.g., handheld or vehicle-mounted) to capture detailed trunk geometry. Fuse these data with UAV-LiDAR point clouds using iterative closest point (ICP) registration for comprehensive tree feature extraction. (2) Deep learning compensation: Train convolutional neural networks (CNNs) on synthetic or multi-modal datasets (LiDAR + RGB imagery) to infer the diameter at breast height (DBH) from partial point clouds, building on recent advances in occluded tree parameter estimation. (3) Hybrid field sampling: Integrate UAV-LiDAR with terrestrial laser scanning (TLS) for a subset of trees to establish and calibrate the DBH–height relationships. This would enable more accurate large-scale extrapolation of the tree metrics across the power line corridor. These approaches could significantly improve the accuracy and reliability of tree risk assessments and power line inspection using UAV-LiDAR technology.
In addition, using UAV images to inspect power lines holds great potential. For example, Zhang et al. [43] proposed a novel automatic power line measurement method (PLAMEC) that addressed the challenges of detecting thin power lines against complex backgrounds. They detected eight obstacles with a distance root mean square (RMS) error of 0.319 m compared to that of the field measurements and a maximum error of 0.420 m. Lastly, this study directly utilized an existing growth model for Taxodium distichum given the similar climate and terrain conditions between our study area and the area in which the model was developed. In the absence of a suitable tree height growth model, it is necessary to conduct field surveys within the PCL to gather data on tree species, height, DBH, and age in order to develop an appropriate model.
When conducting the 3D reconstruction of conductors, discrepancies exist between the distances measured by the total station and those extracted from the point cloud. The sources of these discrepancies are multifaceted. For instance, the total station relies on the manual alignment of treetops and wires, which can introduce visual errors. Additionally, treetops affected by wind are difficult to accurately target. Furthermore, high summer temperatures and the collection of point cloud data can cause the conductors to expand, resulting in discrepancies between the actual conductors and the results of the catenary equation. To reduce these discrepancies, future work could consider the following approaches: (1) Advanced sensors: Utilize higher-resolution LiDAR or multispectral LiDAR to enhance the penetration into the vegetation and reduce occlusion errors. (2) Data fusion: Integrate UAV-LiDAR with ground-based mobile LiDAR or photogrammetry to enable cross-verification and improve the data accuracy. (3) Dynamic modeling: Incorporate real-time wind and temperature compensation into the catenary equation to account for variations in conductor sag.
In summary, this study not only provides a novel technical approach to the monitoring and maintenance of power lines but also offers new directions and ideas for future research on tree barrier prediction. By continuously refining these methods, we can enhance the safety and reliability of power lines further, thereby providing a solid foundation for the stable operation of society.

5. Conclusions

This study presents an effective approach to detecting and predicting tree risks in transmission lines using UAV-LiDAR technology. By integrating point cloud classification, 3D reconstruction, and tree growth modeling, this approach achieves high accuracy in identifying existing tree barriers and forecasting future risks. The 3D-reconstruction-based method outperforms the point-cloud-based method, offering more precise detection of tree locations and clearance distances. These advancements hold significant practical value: For power grid operators, this framework enables proactive maintenance by prioritizing high-risk zones and optimizing the inspection cycles, reducing outage risks and operational costs. For forest managers, the integration of growth models supports sustainable practices by minimizing unnecessary tree removal while ensuring compliance with safety thresholds.
The results not only underscore the potential of UAV-LiDAR for practical applications in power line maintenance and tree risk assessments but also offer a scalable solution for balancing grid reliability with ecological conservation in rapidly changing environments.

Author Contributions

Conceptualization: Z.N. and X.C. Data curation: Z.N. and K.S. Formal analysis: Z.N. and X.C. Funding acquisition: Y.S. Investigation: Z.N., K.S., X.W. and J.Y. Project administration: Y.S. Resources: K.S. and X.W. Supervision: Y.S. Validation: Z.N., K.S. and X.C.; Visualization: Z.N. Writing—original draft: Z.N. Writing—review and editing: Z.N. L.P. contributed to the data curation, resources, validation. All authors have read and agreed to the published version of the manuscript.

Funding

This research was funded by the Key Research and Development Program of Zhejiang Province (Grant number: 2021C02005; 2023C02003).

Data Availability Statement

The datasets presented in this article are not readily available because the data are part of an ongoing study, as well as due to time limitations. Requests to access the datasets should be directed to the corresponding author.

Acknowledgments

We are thankful for the technical support of Xu Jiuen.

Conflicts of Interest

The funders had no role in the design of this study; in the collection, analyses, or interpretation of the data; in the writing of the manuscript; or in the decision to publish the results. Kangqi Shi is employed by State Grid Zhejiang Electric Power Co., Ltd. Pan’an County Power Supply Company, but his employer’s company was not involved in this study, and there is no relevance between this research and the company. Lingsong Pang is employed by State Grid Hangzhou Lin’an Power Supply Company, but his employer’s company was not involved in this study, and there is no relevance between this research and the company.

Abbreviations

The following abbreviations are used in this manuscript:
UAV-LiDARUnmanned Aerial Vehicle–Light Detection and Ranging
PLCpower line corridor
RMSEroot mean square error
CSFCloth Simulation Filter
RTKReal-Time Kinematic
DBHdiameter at breast height
IPTDImproved Progressive TIN Densification
PTINProgressive TIN Densification
PCSPoint Cloud Segmentation
IDWInverse Distance Weighting
RVreference value
DEMDigital Elevation Model
MEmean error
SVMSupport Vector Machine

References

  1. Yoo, S.-H.; Lee, J.-S. Electricity Consumption and Economic Growth: A Cross-Country Analysis. Energy Policy 2010, 38, 622–625. [Google Scholar] [CrossRef]
  2. Zhou, R.; Jiang, W.; Jiang, S. A Novel Method for High-Voltage Bundle Conductor Reconstruction from Airborne LiDAR Data. Remote Sens. 2018, 10, 2051. [Google Scholar] [CrossRef]
  3. Matikainen, L.; Lehtomäki, M.; Ahokas, E.; Hyyppä, J.; Karjalainen, M.; Jaakkola, A.; Kukko, A.; Heinonen, T. Remote Sensing Methods for Power Line Corridor Surveys. ISPRS J. Photogramm. Remote Sens. 2016, 119, 10–31. [Google Scholar] [CrossRef]
  4. Li, X.; Wang, R.; Chen, X.; Li, Y.; Duan, Y. Classification of Transmission Line Corridor Tree Species Based on Drone Data and Machine Learning. Sustainability 2022, 14, 8273. [Google Scholar] [CrossRef]
  5. Ahmad, J.; Malik, A.S.; Abdullah, M.F.; Kamel, N.; Xia, L. A Novel Method for Vegetation Encroachment Monitoring of Transmission Lines Using a Single 2D Camera. Pattern. Anal. Appl. 2015, 18, 419–440. [Google Scholar] [CrossRef]
  6. Mills, S.J.; Gerardo Castro, M.P.; Li, Z.; Cai, J.; Hayward, R.; Mejias, L.; Walker, R.A. Evaluation of Aerial Remote Sensing Techniques for Vegetation Management in Power-Line Corridors. IEEE Trans. Geosci. Remote Sens. 2010, 48, 3379–3390. [Google Scholar] [CrossRef]
  7. Radmer, D.T.; Kuntz, P.A.; Christie, R.D.; Venkata, S.S.; Fletcher, R.H. Predicting Vegetation-Related Failure Rates for Overhead Distribution Feeders. IEEE Trans. Power Deliv. 2002, 17, 1170–1175. [Google Scholar] [CrossRef]
  8. Tan, J.; Zhao, H.; Yang, R.; Liu, H.; Li, S.; Liu, J. An Entropy-Weighting Method for Efficient Power-Line Feature Evaluation and Extraction from LiDAR Point Clouds. Remote Sens. 2021, 13, 3446. [Google Scholar] [CrossRef]
  9. Roussel, J.-R.; Achim, A.; Auty, D. Classification of High-Voltage Power Line Structures in Low Density ALS Data Acquired over Broad Non-Urban Areas. PeerJ Comput. Sci. 2021, 7, e672. [Google Scholar] [CrossRef]
  10. Huang, Y.; Du, Y.; Shi, W. Fast and Accurate Power Line Corridor Survey Using Spatial Line Clustering of Point Cloud. Remote Sens. 2021, 13, 1571. [Google Scholar] [CrossRef]
  11. Xi, S.; Zhang, Z.; Niu, Y.; Li, H.; Zhang, Q. Power Line Extraction and Tree Risk Detection Based on Airborne LiDAR. Sensors 2023, 23, 8233. [Google Scholar] [CrossRef] [PubMed]
  12. Chen, C.; Yang, B.; Song, S.; Peng, X.; Huang, R. Automatic Clearance Anomaly Detection for Transmission Line Corridors Utilizing UAV-Borne LIDAR Data. Remote Sens. 2018, 10, 613. [Google Scholar] [CrossRef]
  13. Yang, J.; Kang, Z. Voxel-Based Extraction of Transmission Lines From Airborne LiDAR Point Cloud Data. IEEE J. Sel. Top. Appl. Earth Obs. Remote Sens. 2018, 11, 3892–3904. [Google Scholar] [CrossRef]
  14. Habeeb, H.N.; Mustafa, Y.T. Deep Learning-Based Prediction of Forest Cover Change in Duhok, Iraq: Past and Future. Forestist 2025, 75, 1–13. [Google Scholar] [CrossRef]
  15. Mzuri, R.; Fatah, K.; Mustafa, Y. Identification of Flood-Prone Areas Using Geo-Informatics: A Case Study of Erbil City, Kurdistan Region, Iraq. Iraqi Geol. J. 2024, 57, 277–295. [Google Scholar] [CrossRef]
  16. Kim, H.B.; Sohn, G. Point-Based Classification of Power Line Corridor Scene Using Random Forests. Photogramm. Eng. Remote Sens. 2013, 79, 821–833. [Google Scholar]
  17. Ortega, S.; Trujillo, A.; Santana, J.M.; Suárez, J.P.; Santana, J. Characterization and Modeling of Power Line Corridor Elements from LiDAR Point Clouds. ISPRS J. Photogramm. Remote Sens. 2019, 152, 24–33. [Google Scholar] [CrossRef]
  18. DL/T 741-2019; Overhead Transmission Line Operation Regulations. National Energy Administration: Beijing, China, 2019.
  19. Qin, H.; Zhou, W.; Yao, Y.; Wang, W. Individual Tree Segmentation and Tree Species Classification in Subtropical Broadleaf Forests Using UAV-Based LiDAR, Hyperspectral, and Ultrahigh-Resolution RGB Data. Remote Sens. Environ. 2022, 280, 113143. [Google Scholar] [CrossRef]
  20. LeCun, Y.; Bengio, Y.; Hinton, G. Deep Learning. Nature 2015, 521, 436–444. [Google Scholar] [CrossRef]
  21. Melzer, T.; Briese, C. Extraction and Modeling of Power Lines from ALS Point Clouds; Vienna University of Technology: Vienna, Austria, 2004. [Google Scholar]
  22. Zhang, W.; Qi, J.; Wan, P.; Wang, H.; Xie, D.; Wang, X.; Yan, G. An Easy-to-Use Airborne LiDAR Data Filtering Method Based on Cloth Simulation. Remote Sens. 2016, 8, 501. [Google Scholar] [CrossRef]
  23. Zhao, X.; Guo, Q.; Su, Y.; Xue, B. Improved Progressive TIN Densification Filtering Algorithm for Airborne LiDAR Data in Forested Areas. ISPRS J. Photogramm. Remote Sens. 2016, 117, 79–91. [Google Scholar] [CrossRef]
  24. Axelsson, P. DEM Generation from Laser Scanner Data Using Adaptive TIN Models. Int. Arch. Photogramm. Remote Sens. 2000, 33, 110–117. [Google Scholar]
  25. Vosselman, G. Slope based filtering of laser altimetry data. Int. Arch. Photogramm. Remote Sens. 2000, 33, 935–942. [Google Scholar]
  26. Pedregosa, F.; Varoquaux, G.; Gramfort, A.; Michel, V.; Thirion, B.; Grisel, O.; Blondel, M.; Prettenhofer, P.; Weiss, R.; Dubourg, V.; et al. Scikit-Learn: Machine Learning in Python. J. Mach. Learn. Res. 2011, 12, 2825–2830. [Google Scholar]
  27. Breiman, L. Random Forests. Mach. Learn. 2001, 45, 5–32. [Google Scholar] [CrossRef]
  28. Liu, Y.; Zhao, X.; Jiao, Y.; Yang, X.; Xu, H. Method for Real-Time Reconstruction of a Transmission Line Based on the LiDAR Point Cloud Data of a Partial Line Segment. Sustain. Energy Technol. Assess. 2023, 57, 103180. [Google Scholar] [CrossRef]
  29. Odibat, Z.M.; Shawagfeh, N.T. Generalized Taylor’s Formula. Appl. Math. Comput. 2007, 186, 286–293. [Google Scholar] [CrossRef]
  30. Arjomandi-Lari, M.; Karimi, M. Array Auto-Calibration Using a Generalized Least-Squares Method. AEU Int. J. Electron. Commun. 2019, 106, 20–31. [Google Scholar] [CrossRef]
  31. Li, W.; Guo, Q.; Jakubowski, M.K.; Kelly, M. A New Method for Segmenting Individual Trees from the Lidar Point Cloud. Photogramm. Eng. Remote Sens. 2012, 78, 75–84. [Google Scholar] [CrossRef]
  32. Lu, J.; Wang, H.; Qin, S.; Cao, L.; Pu, R.; Li, G.; Sun, J. Estimation of Aboveground Biomass of Robinia Pseudoacacia Forest in the Yellow River Delta Based on UAV and Backpack LiDAR Point Clouds. Int. J. Appl. Earth Obs. Geoinf. 2020, 86, 102014. [Google Scholar] [CrossRef]
  33. Hu, X.; Zheng, L.; Ding, C.; Hu, X.; Dai, X. Growth Regularity of Metasequoia glyptostroboides, Taxodium ascendens and Taxodium distichum. J. Northeast For. Univ. 2012, 40, 11–13+19. (In Chinese) [Google Scholar] [CrossRef]
  34. Chaplot, V.; Darboux, F.; Bourennane, H.; Leguédois, S.; Silvera, N.; Phachomphon, K. Accuracy of Interpolation Techniques for the Derivation of Digital Elevation Models in Relation to Landform Types and Data Density. Geomorphology 2006, 77, 126–141. [Google Scholar] [CrossRef]
  35. Goutte, C.; Gaussier, E. A Probabilistic Interpretation of Precision, Recall and F-Score, with Implication for Evaluation. In Advances in Information Retrieval; Lecture Notes in Computer Science; Springer: Berlin/Heidelberg, Germany, 2005; Volume 3408, pp. 345–359. [Google Scholar]
  36. Wang, Y.; Chen, Q.; Liu, L.; Zheng, D.; Li, C.; Li, K. Supervised Classification of Power Lines from Airborne LiDAR Data in Urban Areas. Remote Sens. 2017, 9, 771. [Google Scholar] [CrossRef]
  37. Li, W.; Luo, Z.; Xiao, Z.; Chen, Y.; Wang, C.; Li, J. A GCN-Based Method for Extracting Power Lines and Pylons From Airborne LiDAR Data. IEEE Trans. Geosci. Remote Sens. 2022, 60, 1–14. [Google Scholar] [CrossRef]
  38. Munir, N.; Awrangjeb, M.; Stantic, B. Power Line Extraction and Reconstruction Methods from Laser Scanning Data: A Literature Review. Remote Sens. 2023, 15, 973. [Google Scholar] [CrossRef]
  39. Olsen, R.G.; Edwards, K.S. A New Method for Real-Time Monitoring of High-Voltage Transmission Line Conductor Sag. IEEE Power Eng. Rev. 2002, 22, 62–63. [Google Scholar] [CrossRef]
  40. He, W.-Y.; Meng, F.-C.; Ren, W.-X. Cable Force Estimation of Cables with Small Sag Considering Inclination Angle Effect. Adv. Bridge Eng. 2021, 2, 15. [Google Scholar] [CrossRef]
  41. Dong, T.; Zhang, X.; Ding, Z.; Fan, J. Multi-Layered Tree Crown Extraction from LiDAR Data Using Graph-Based Segmentation. Comput. Electron. Agric. 2020, 170, 105213. [Google Scholar] [CrossRef]
  42. Yadav, M.; Chousalkar, C.G. Extraction of Power Lines Using Mobile LiDAR Data of Roadway Environment. Remote Sens. Appl. Soc. Environ. 2017, 8, 258–265. [Google Scholar] [CrossRef]
  43. Zhang, Y.; Yuan, X.; Li, W.; Chen, S. Automatic Power Line Inspection Using UAV Images. Remote Sens. 2017, 9, 824. [Google Scholar] [CrossRef]
Figure 1. Overview of the study area: (a) the location of the study area in China and Zhejiang Province; (b) orthophoto of the block where the line is located; (c) a point cloud of the PLC (displayed as elevation); and (d) a photo of the line in the field.
Forests 16 00578 g001
Figure 2. UAV-LiDAR system.
Forests 16 00578 g002
Figure 3. Flow chart.
Forests 16 00578 g003
Figure 4. Conductor morphology analysis: On the X-O-Y plane, the projection appears as a straight line; on the X-O-Z plane, the projection appears as a catenary.
Forests 16 00578 g004
Figure 5. Construction of tree risk candidate area (a) based on point cloud and (b) based on 3D reconstruction.
Forests 16 00578 g005
Figure 6. Ground points and DEM effects obtained using the five filtering methods (displayed as elevation).
Forests 16 00578 g006
Figure 7. Point cloud data and classification results: (a) pre-classification point cloud; (b) classification results; (c) details of the area around the suspension point of Pylon 1; (d) details of the area around the suspension point of Pylon 2.
Forests 16 00578 g007
Figure 8. Three-dimensional reconstruction of conductors: (a) general image; (b) detailed image.
Forests 16 00578 g008
Figure 9. The locations of tree barrier representative points and clearance distances.
Forests 16 00578 g009
Figure 10. Evaluation of tree height accuracy.
Forests 16 00578 g010
Figure 11. Results of tree barrier detection: (a) side view; (b) top view.
Forests 16 00578 g011
Figure 12. Results of tree barrier predictions: (a) side view; (b) top view; (c) section views.
Forests 16 00578 g012
Table 1. Statistical tables of measured data from field inventory.
DBH (cm)Tree Height (m)Crown Diameter (m)
minimum9.46.73.4
maximum43.622.46.3
mean25.3917.24.7
standard deviation8.62.81.2
Table 2. Ground point classification accuracy.
CSFIPTDPTINDQuadratic Surface
Filtering
Slope-Based
Filtering
Number of ground points1,213,305926292842,439,5661,817,021
Average altitude (m)39.80040.22740.23240.69840.296
Roughness316168631
Roughness rate1.50%8%8%43%15.5%
ME (m)0.1470.1220.1200.1980.172
RMSE (m)0.1740.1610.1580.2230.194
Table 3. Classification of conductor points and pylon points.
TPFNFPPrecisionRecallF-Score
conductor points27,39148624280.9830.9190.950
pylon points34,73813103090.9640.9910.977
Table 4. Evaluation of 3D reconstruction accuracy.
Number of Measured PointsME/mMaximum Error/mMinimum Error/m
12500.096544264276780.3840378170.00103580
21580.081446721762810.3152188210.00124817
31970.045716455138560.2842213290.00189604
41640.137531086489250.3445930190.00116123
51830.042131691100980.2122601700.00138073
61430.069825941518320.1777576450.00195071
Table 5. Evaluation of tree barrier detection accuracy.
Source of RVME/mMaximum Error/mMinimum Error/mRMSE/m
Point-cloud-basedTotal station measurement0.110.410.010.15
Manual point cloud measurement0.070.220.010.08
Three-dimensional-reconstruction-basedTotal station measurement0.090.30.010.13
Manual point cloud measurement0.030.130.010.04
Disclaimer/Publisher’s Note: The statements, opinions and data contained in all publications are solely those of the individual author(s) and contributor(s) and not of MDPI and/or the editor(s). MDPI and/or the editor(s) disclaim responsibility for any injury to people or property resulting from any ideas, methods, instructions or products referred to in the content.

