Article

An Accelerated Test Method for Evaluating the Performance of Wood Pole Fumigants

1
Department of Wood Science and Engineering, Oregon State University, Corvallis, OR 97331, USA
2
WoodsWorks, 17 Halterman Rd, Granville, NY 12832, USA
3
Poles Inc., 336 Clarksley Rd., Manitou Springs, CO 80829, USA
*
Author to whom correspondence should be addressed.
Forests 2025, 16(4), 572; https://doi.org/10.3390/f16040572
Submission received: 10 February 2025 / Revised: 7 March 2025 / Accepted: 17 March 2025 / Published: 26 March 2025
(This article belongs to the Special Issue Wood Durability and Protection)

Abstract

:
Dazomet (tetrahydro-3,5-dimethyl-2H-1,3,5-thiadiazine-2-thione) is a solid fumigant that breaks down into gaseous methylisothiocyanate (MITC) in the presence of water, a process that can be enhanced by the addition of accelerant chemicals. Experiments to discover the ideal conditions for dazomet decomposition were largely performed at the lab scale or on field-scale full utility poles or sections thereof. A rapid assessment method in wood commodities would improve the ability to assess a wider range of treatments to improve performance. Here, we present a method to test dazomet performance at the mesocosm scale in 102 × 152 mm (4 × 6-inch nominal) lumber. The protocol was trialed using two EPA-registered dazomet formulations to produce MITC under varying moisture conditions using different copper-containing accelerants. The test allowed the assessment of MITC levels at different locations and the full visual inspection of the treatment hole after splitting the block. MITC levels tended to be higher in the wood interior, closer to the treatment holes in test blocks. Below-ground portions also tended to have higher MITC levels at higher-moisture conditions. The method developed reduces the time required to test dazomet formulations and application methods in whole wood and will help improve the development of new dazomet formulations and application methods.

1. Introduction

Wood poles are by far the most used material to support electrical distribution networks in the United States. Most of the wood species used for utility poles are susceptible to fungal and insect damage and must be preserved with biocidal compounds. The depth of treatment is usually limited by the amount of treatable sapwood. Pine species have thick sapwood and are generally more deeply treated, while species such as Douglas-fir have a thin sapwood band surrounding a moderately durable, but non-treatable heartwood core. Checks that develop as poles season in service can open beyond this thin treated shell, exposing the untreated heartwood inside to decay and insect attacks [1,2]. Regular inspection coupled with the application of internal remedial treatments at the critical groundline zone is proven to dramatically increase lifespan by up to 60% [3,4].
Internal remedial treatments include several fumigant compounds adopted from the agricultural sector [5,6,7]. Fumigants can be applied through holes drilled into the heartwood during an inspection where they subsequently volatilize and move through the wood. The fumigant kills the fungus, but more importantly, interacts with the wood to remain active for periods ranging from 3 to 20 years, depending on the chemical and wood species [8,9]. Fumigants are available as liquids, solid-melt formulas, and solids. Solid fumigants have several advantages including ease of handling, reduced risk for lineman exposure, and shelf stability.
For decades, two liquids, metham sodium and trichloronitromethane, were the primary fumigants used in North America, but concerns about spills and odors encouraged the development of solid fumigants. The first was methylisothiocyanate, which is a solid at room temperature and converts directly from a solid to a gas. This system was first commercialized in glass vials and later in aluminum tubes, since direct contact would cause skin burns. While highly effective, this chemical remains in limited use. Subsequent research led to exploratory studies with dazomet (tetrahydro-3,5-dimethyl-2H-1,3,5-thiadiazine-2-thione), a solid fumigant that breaks down in the presence of water into a variety of sulfur-containing compounds including the gaseous compound methylisothiocyanate (MITC) [10]. Dazomet has been used for decades as a pole fumigant for a 10-year inspection and treatment cycle [11]. However, its reliance on water to break down into active fumigant compounds limits its effectiveness in dryer conditions. Copper-based accelerants have been shown to improve MITC production from dazomet when they are applied to treatment holes with the fumigant [10,12,13]. However, more research needs to be conducted to make this fumigant more versatile under a variety of environmental conditions.
Effective dazomet accelerants were originally identified in laboratory trials [14] and were later evaluated on Douglas-fir pole sections in field trials, where they were shown to improve dazomet decomposition into MITC [12]. However, these field trials took several years to produce useful results. A small-scale block test was carried out for evaluating internal remedial treatments; but this test was intended to be a primary screening test for active ingredients, not for additives. There is a need for an intermediate test method that creates conditions similar to those found in the field but at a much-reduced scale that allows intensive repeated sampling.
This study describes a novel method for testing the efficacy of internal remedial treatments in larger wood samples that can be evaluated over a 2–3-year timeframe. This method was used to compare the performance of two formulations of granular dazomet in combination with several currently available accelerant mixtures in dry and wet climates.

2. Materials and Methods

2.1. Materials

Two different formulations of granular dazomet (tetrahydro-3,5-dimethyl-2H-1,3,5-thiadiazine-2-thione) were used in this study. Granular Formulation 1 had a larger particle size and contained 98% active ingredient (EPA Registration Number 1448-104-88201). Granular Formulation 2 contained 99% dazomet with a smaller particle size than granular Formulation 1. The copper naphthenate accelerant solution used in this study was made by diluting an 8% w/w (copper as metal) copper naphthenate concentrate to 1% w/w using mineral spirits. The copper–boron accelerant solution was made from a commercially available concentrate of copper ethanolamine (5.00% w/w as metal) and 12.75% disodium octaborate tetrahydrate solution that was diluted 1:1 with water before application. A third accelerant solution was made from a paste consisting of 16.83% anhydrous disodium octaborate and 3.20% copper hydroxide (2.08% copper as metal).

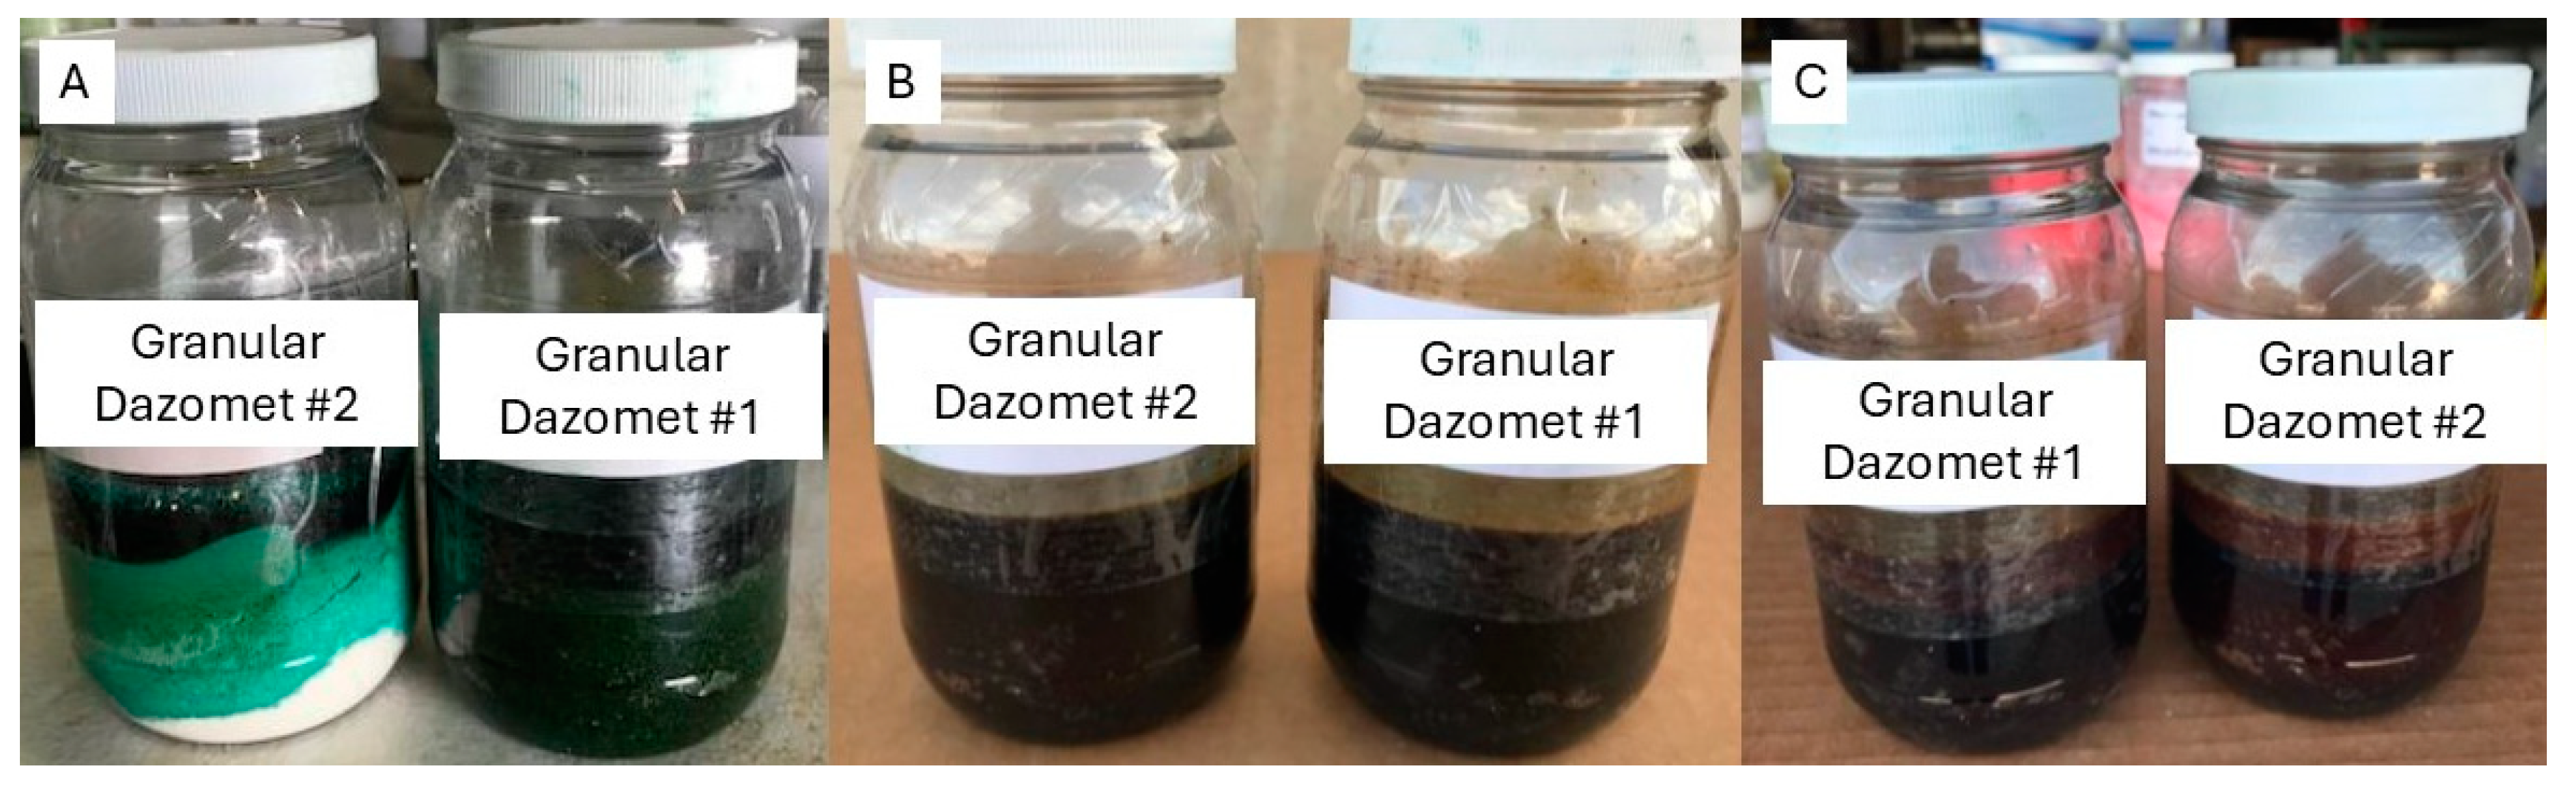
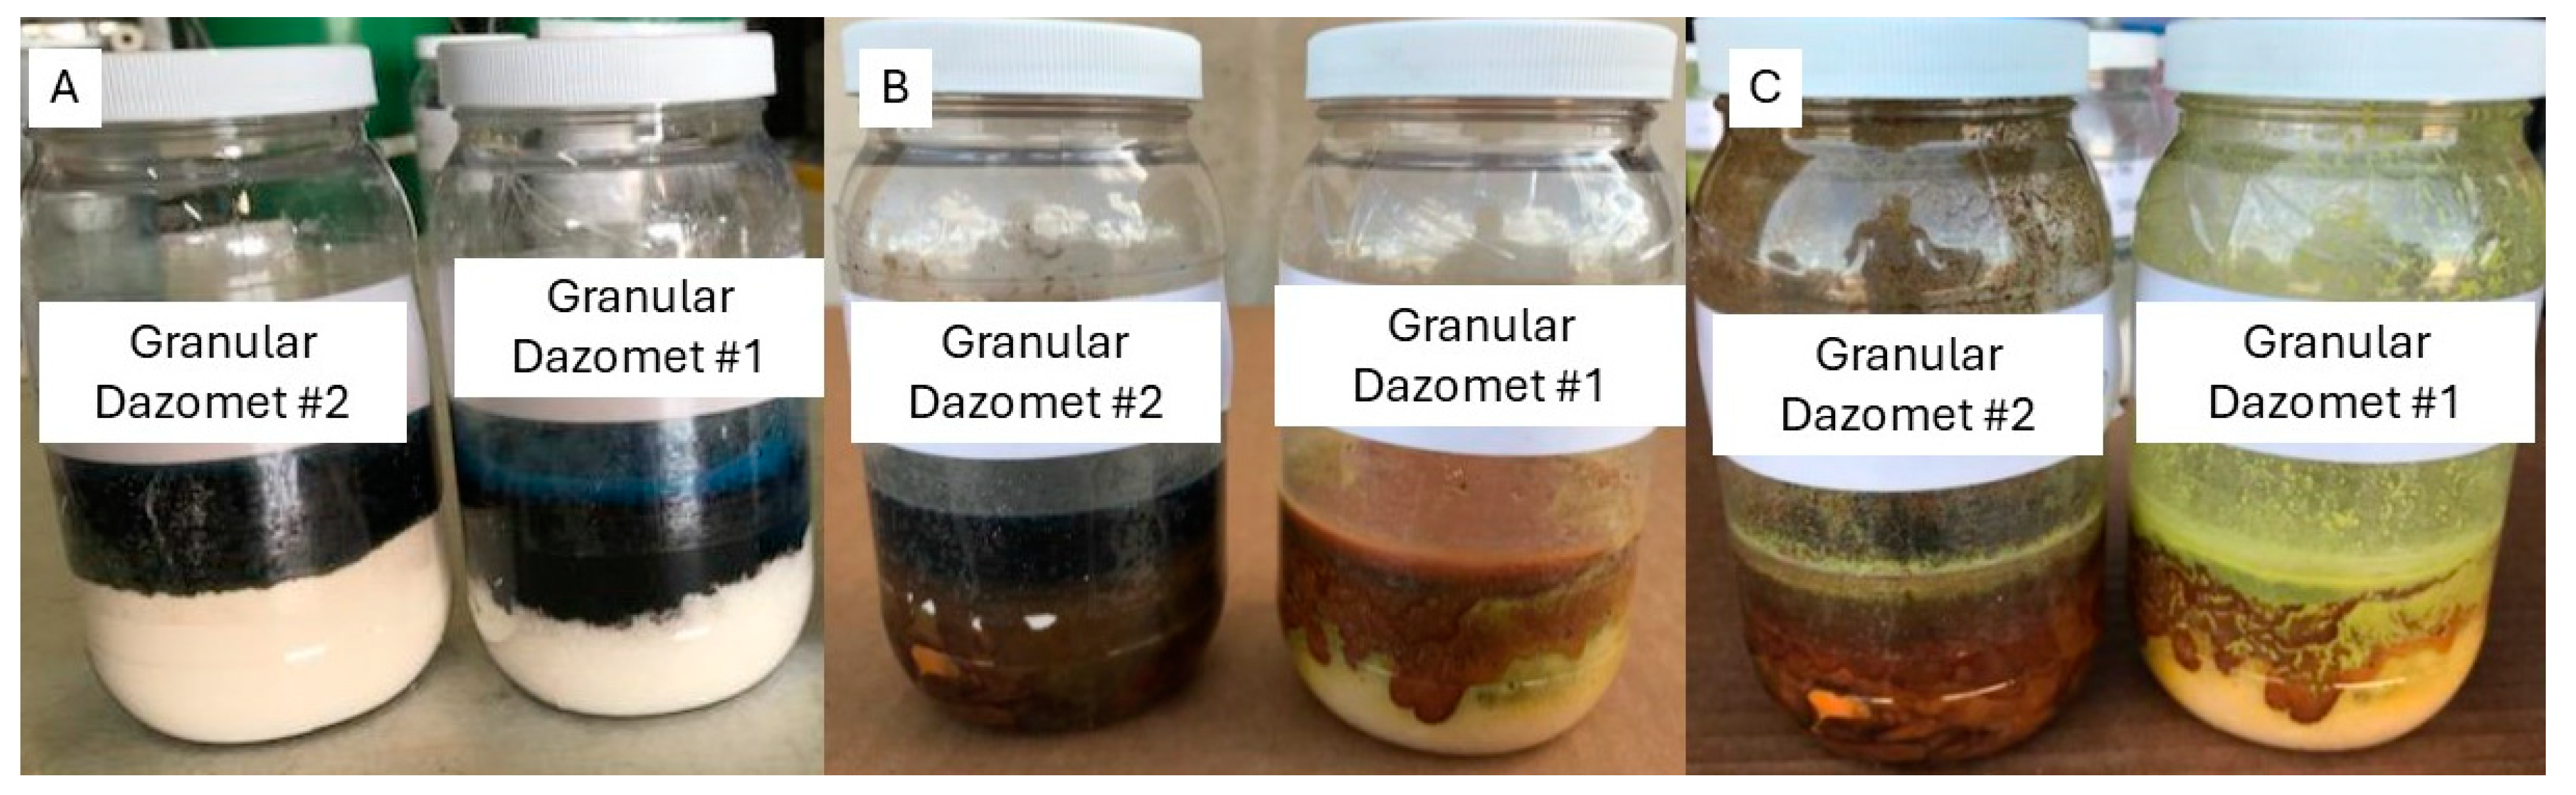
2.2. Accelerant Percolation Through Dazomet Crystals

An important consideration for accelerant activity is its contact with dazomet, but this is difficult to visualize within the treatment hole. Instead, visual analysis of accelerant migration through granular dazomet was carried out in 455 mL glass jars. Granular fumigant (127 g/4.5 oz) was added to each test jar, followed by 85 g (3.0 oz) of either a 1% copper as metal solution in mineral spirits or a commercially available water-based solution of copper ethanolamine (2.5% as copper) and DOT (6.25%). The jars were capped and stored at room temperature (~20–23 °C). Each treatment combination was assessed on one jar. Periodic inspections were made to determine the degree of mixing/penetration. Extensive prior studies during the development of dazomet as a pole fumigant indicated that dazomet decomposition was indicated by the yellowing of the pellets to residual sulfur.

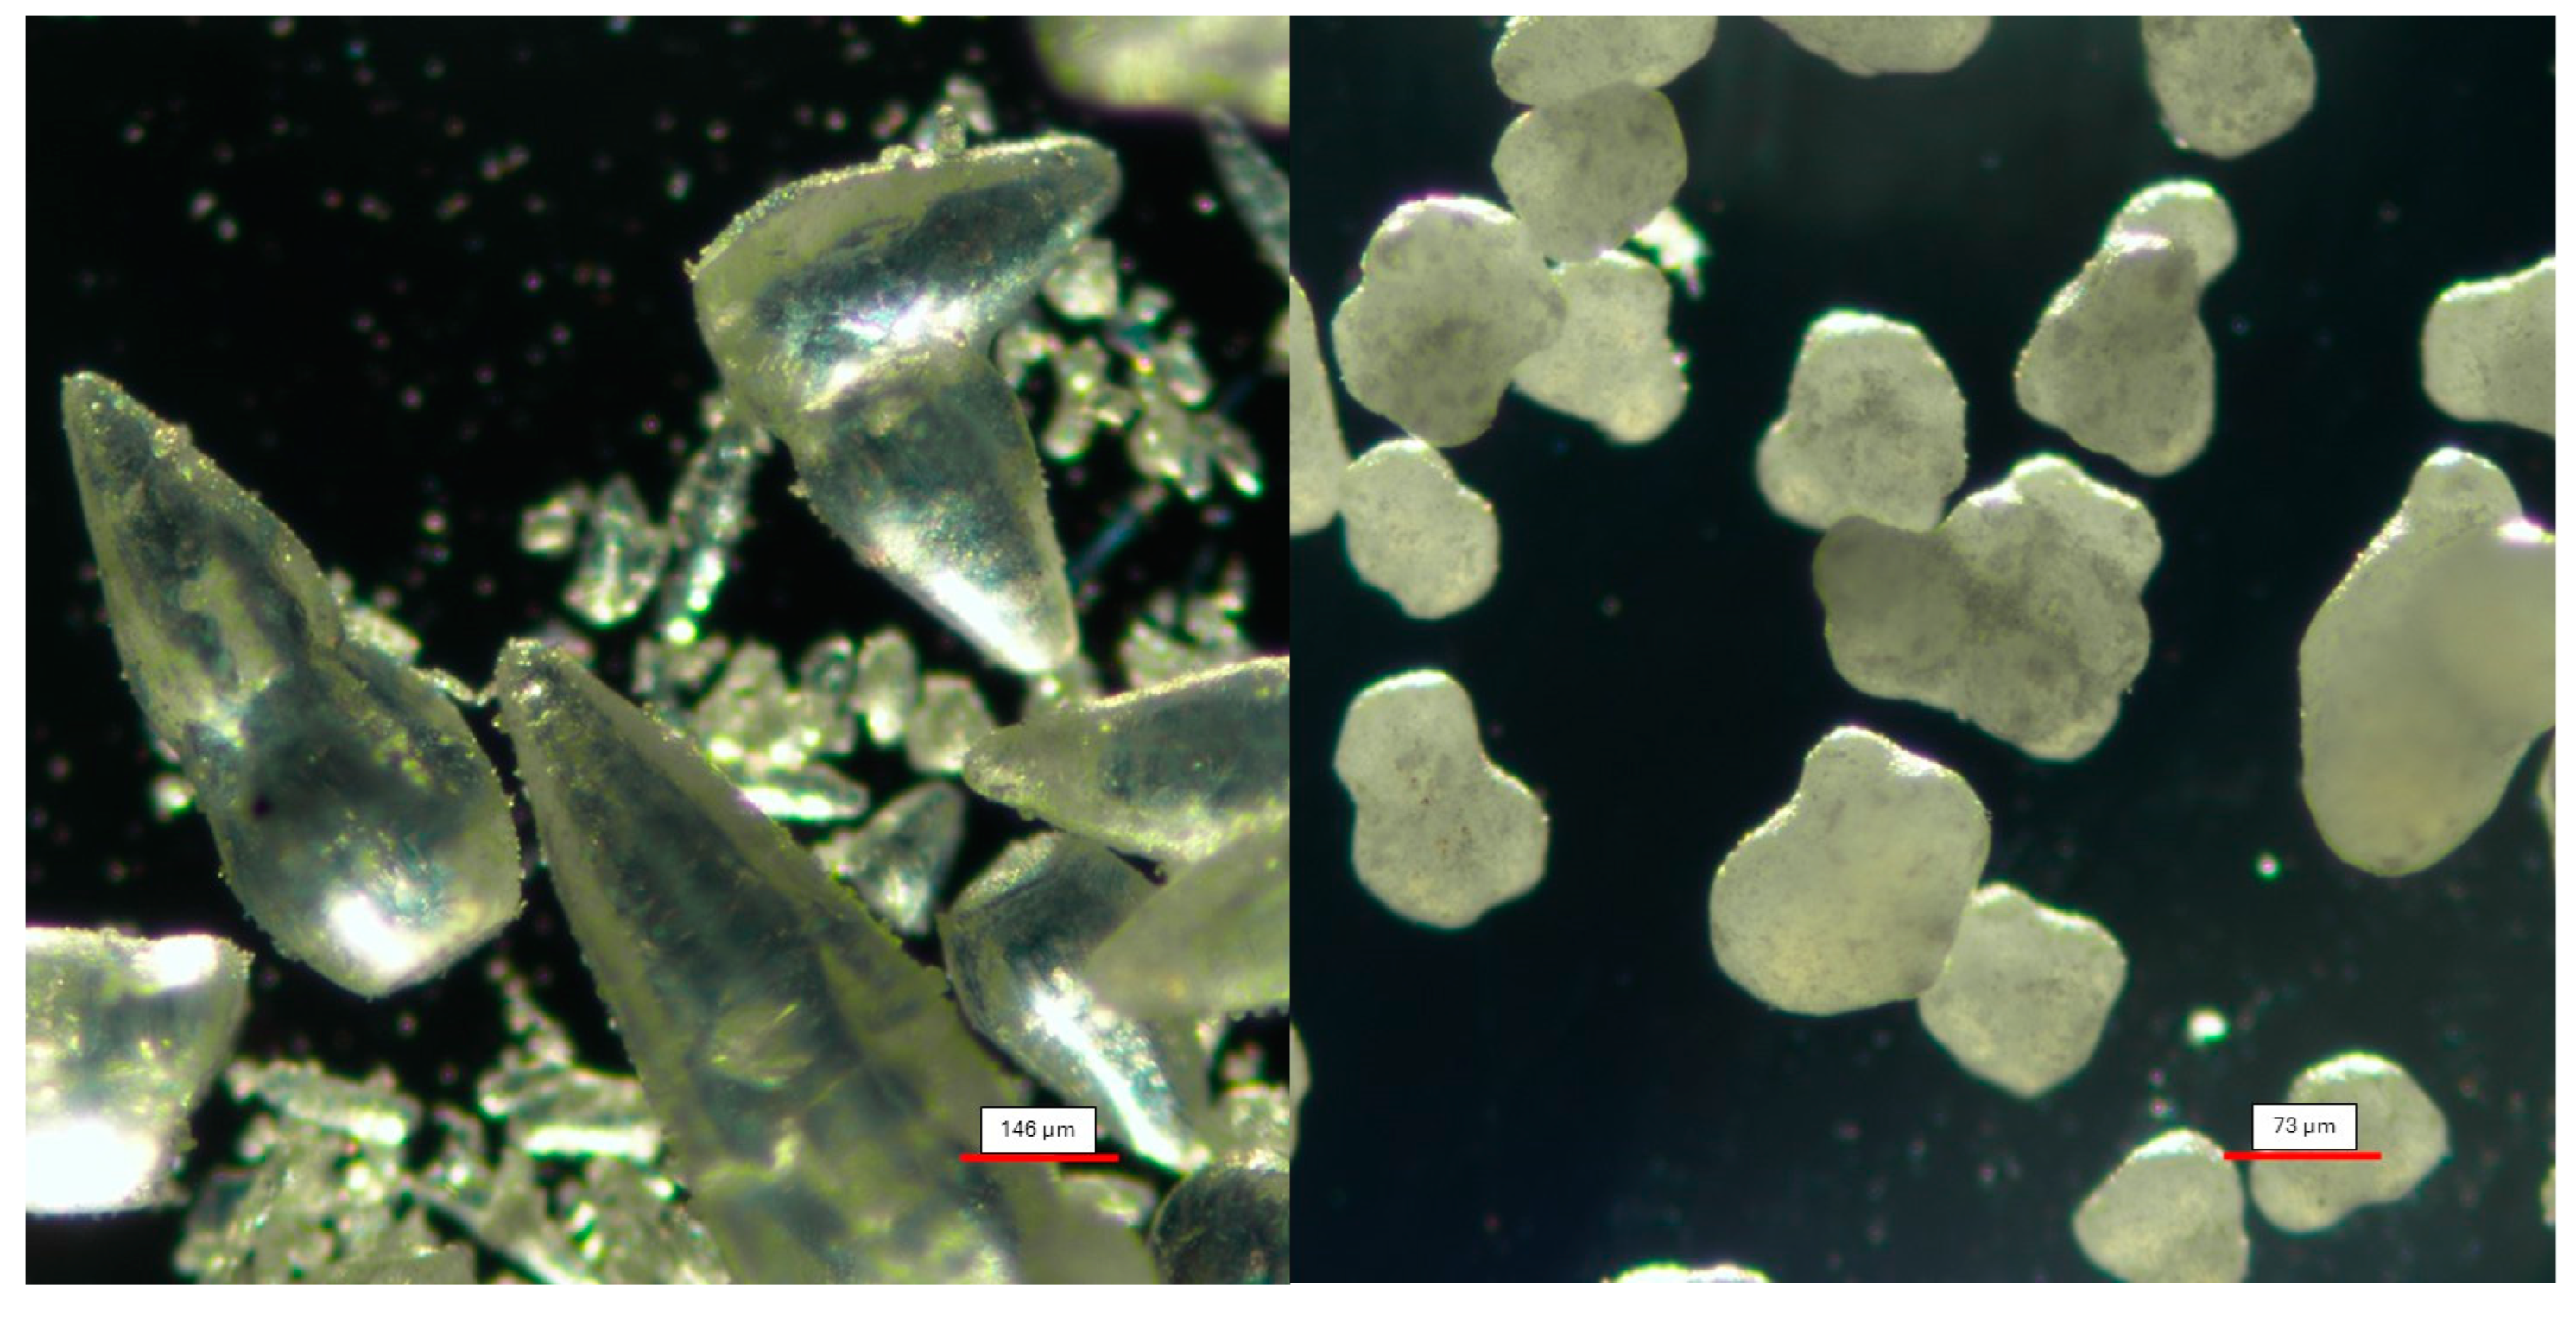
2.3. Dazomet Crystal Measurements

As noted earlier, the two formulations appeared to vary in granule size, and this would result in different surface areas exposed to the accelerant. Measurements were made using an ocular micrometer. Granules of each formulation were placed in a concave microscope slide, covered with a coverslip and observed at 100 or 200-foldfor Formulations 1 and 2, respectively, using a Nikon NI-U-Eclipse microscope with a Nikon DS-Ri2 camera. One hundred granules of each formulation were measured in two directions. Formulation 1 granules were more oblong and cone-shaped while those for Formulation 2 were globular. Measurements for the latter formulation were taken at two perpendicular points on each granule. The results were averaged for each formulation, and the data were subjected to a single-factor ANOVA (α = 0.05).

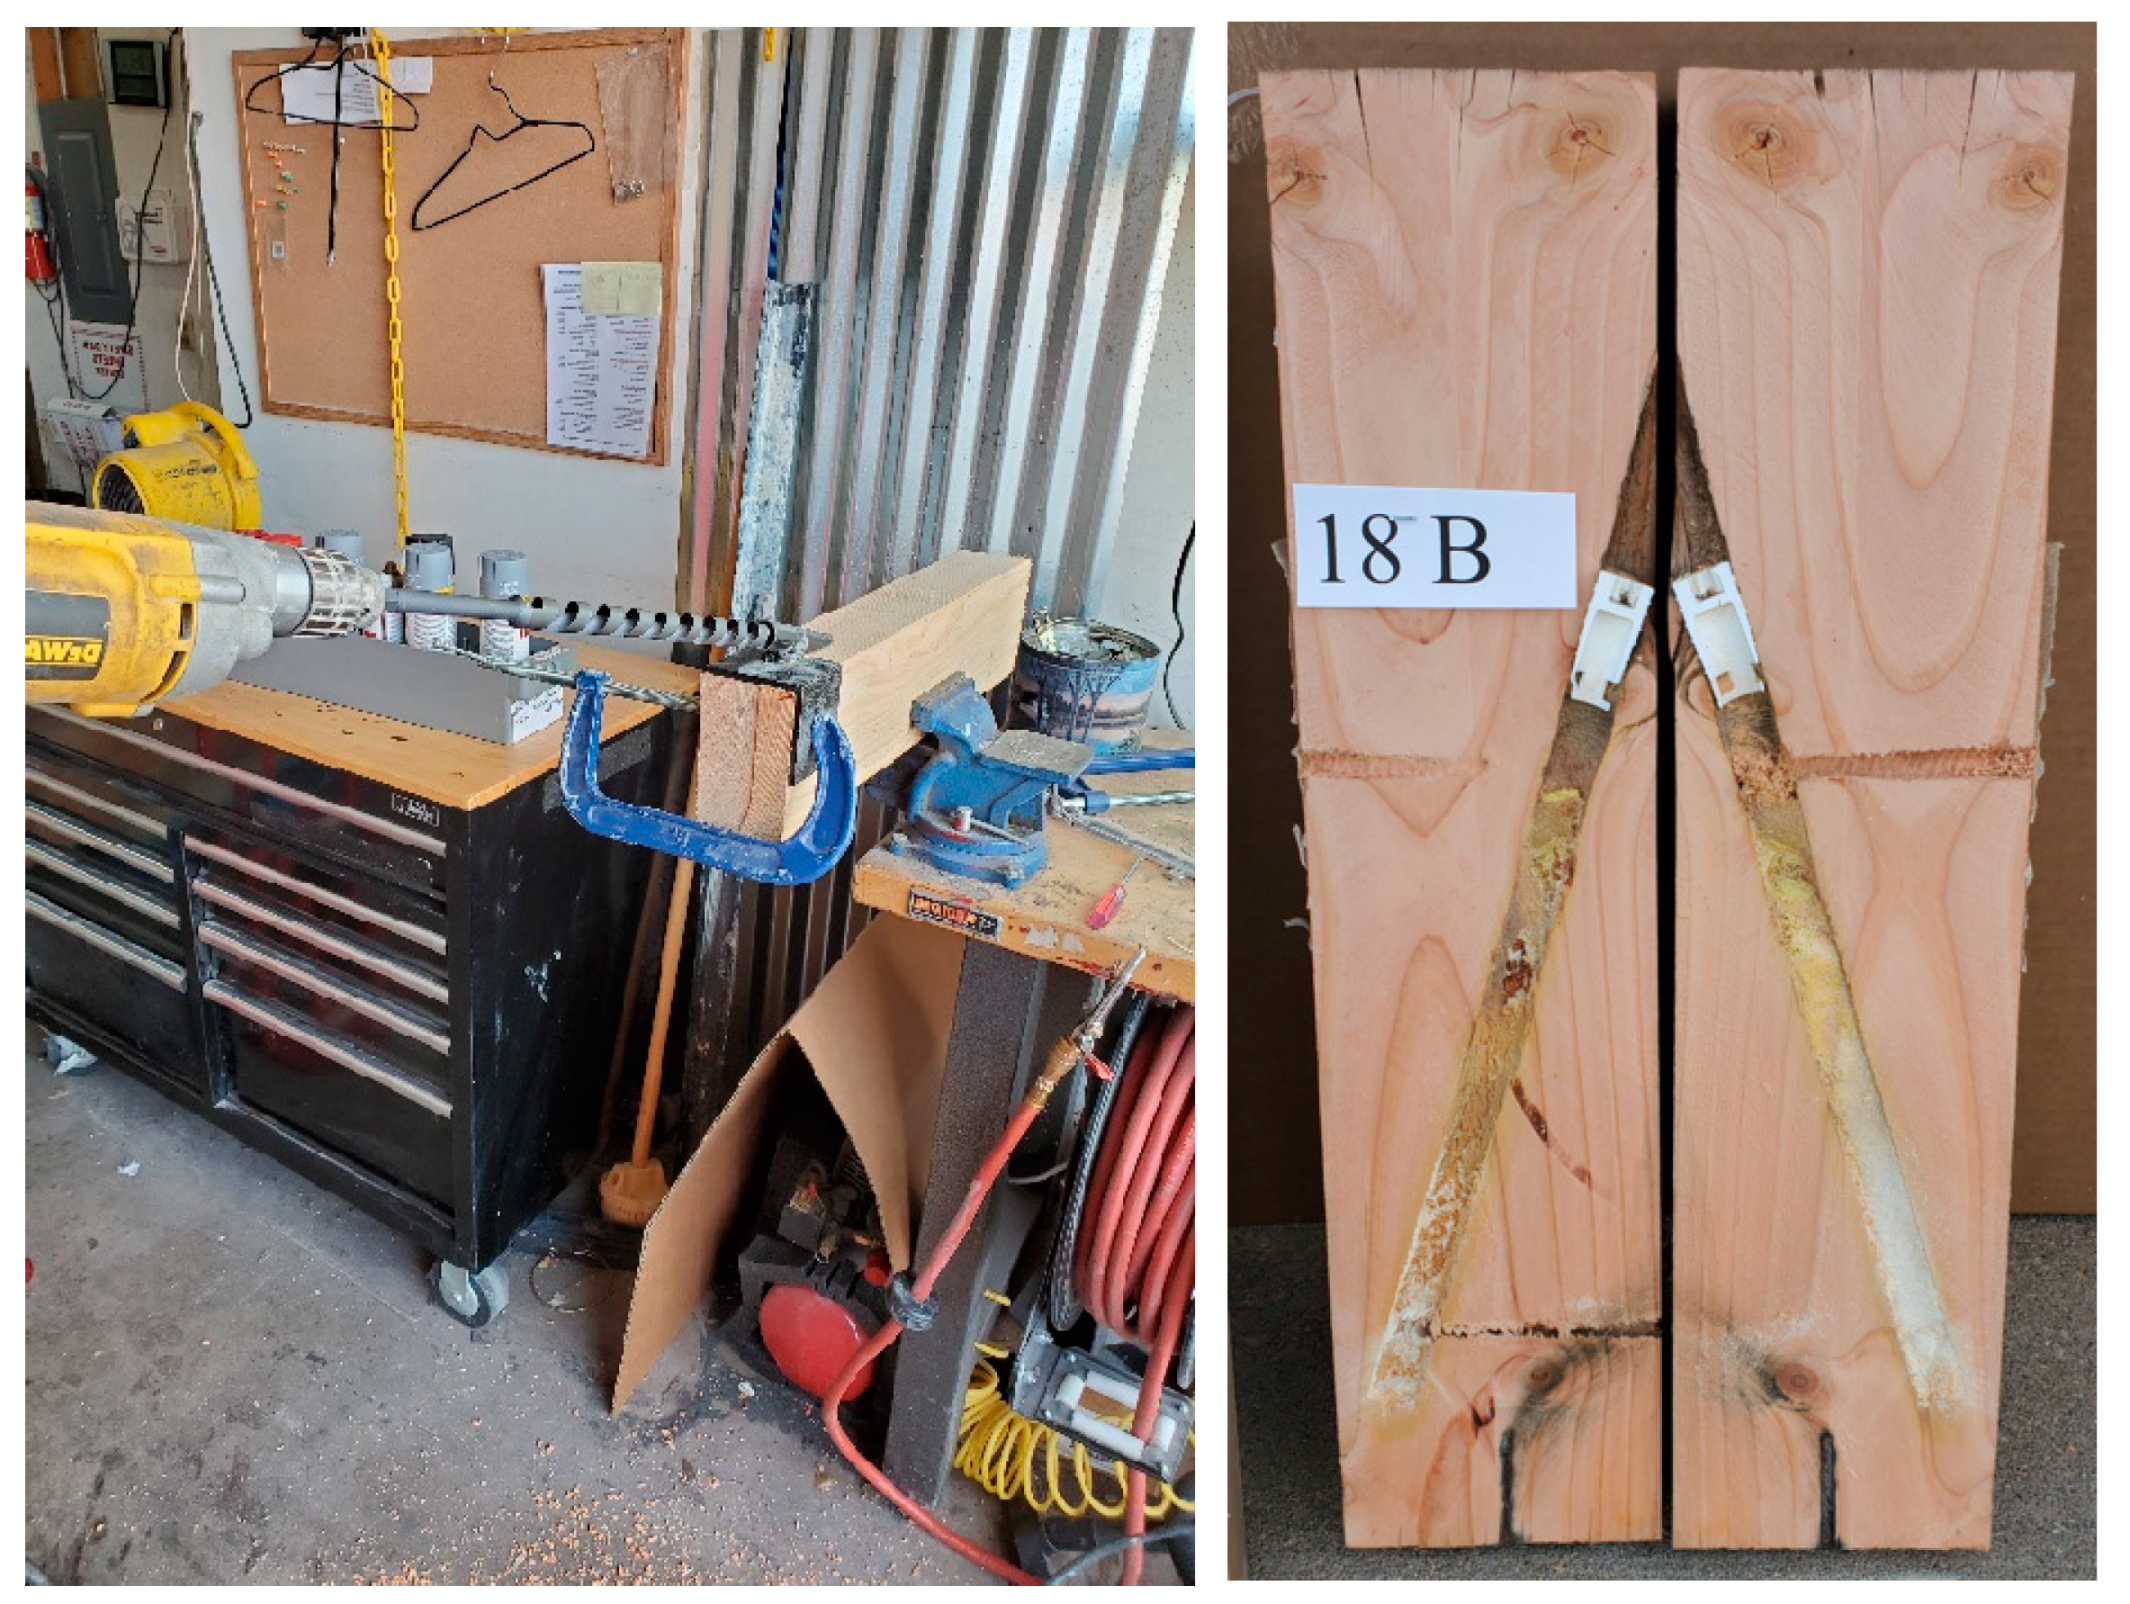
2.4. Wood Substrate Preparation and Treatment

Air-dried and machined Coastal Douglas-fir heartwood timbers 102 × 152 mm (4 × 6-inch nominal) from ten different trees were purchased locally (Colorado Springs, CO). The wood was cut into 610 mm (24-inches) long sections that were randomly assigned to 15 different treatments. A 22.8 mm (7/8 inch) diameter by 356 mm (14 inch) long treatment hole was drilled at a 45-degree angle into each block at a site approximately 200 mm (8 inches) above the intended groundline (Figure 1).
The two granular formulations of dazomet were added to bore holes, with and without various chemical accelerants (Table 1). After chemical addition, the treatment hole was sealed with a 22.2 mm (7/8-inch) plastic plug to cap the hole. Preservatives were applied using a method simulating an actual field application, where a steeply sloping inspection hole is drilled into a pole and dazomet powder is added to the hole followed by a copper-containing accelerant over the dazomet powder. Each treatment was replicated on two posts that were allocated to be exposed at different sites.

2.5. Test Sites and Field Sites

Matched pairs of treated blocks containing the same treatment were buried in commercially obtained soil to a depth of 406 mm (16 inches) at sites located outside of Phoenix, AZ, USA, and Colorado Springs, CO, USA. The Arizona site is located in a hot dry climate which receives an average of 203 mm (8 inches) of rainfall annually, while the Colorado site averages 483 mm (19 inches) of rainfall annually. The Colorado site also received supplemental moisture throughout the year to maintain below-groundline moisture contents at or above the fiber saturation point. The Colorado site was also subjected to sub-freezing temperatures for about four months of the year. The blocks were installed in May of 2018 and harvested for analysis 13 months later (Figure 2).

2.6. Sampling and Sample Preparation

MITC levels in the timbers were determined by removing 100 mm long (4 inch) increment cores (9.5 mm diameter/3/8 inch) 150 mm (6 inches) above and below the groundline. The outer 25 mm of the boring was discarded, and the segments 25 to 50 mm and 75 to 100 mm from the surface were sealed in separate glass vials with Teflon-lined caps to minimize fumigant loss. In most cases, the samples were at least 12.5–25 mm from the treatment hole. After sampling, each block was cut in half along the treatment hole and photographed (Figure 1).

2.7. MITC Analysis

Inner and outer core sections were placed in 5 mL of ethyl acetate and extracted for a minimum of 48 h at room temperature. The extract was then decanted and filtered through a 0.45 µm filter and analyzed for MITC content, using a photometric detector (Kyoto, Japan). Briefly, 2 µL of extract was injected for each sample and injected into a Shimadzu GC-2014 equipped with a flame photometric detector with filters specific for sulfur (Shimadzu Corp., Kyoto, Japan). A glass column (2.6 mm inner diameter, 2.1 m length) packed with 10% carbowax on 80/100 Supelcoport was used to separate materials, and nitrogen was used as the carrier gas at a flow rate of 60 mL/min. The injector, oven, and detector temperatures were 100, 150, and 200 °C, respectively. The total run time was 7 min, with no temperature change during the run. While the analyses are helpful, it is important to note that they are single samples of each treatment exposed at each site.

3. Results and Discussion

3.1. Accelerant Penetration Through Granular Dazomet Formulas

Copper naphthenate penetration appeared to be more rapid and complete for Formulation 1 (Figure 3). However, penetration for the two formulations became indistinguishable as time progressed, and the mineral oil-based solution coated all visible granules. The copper ethanolamine and DOT accelerant initially penetrated rapidly into Formulation 1, but penetration into Formulation 2 was more complete after a longer incubation (Figure 4). These studies, while preliminary, illustrate one way in which different dazomet and accelerant combinations can be assessed as a supporting analysis for the field-based method summarized here.

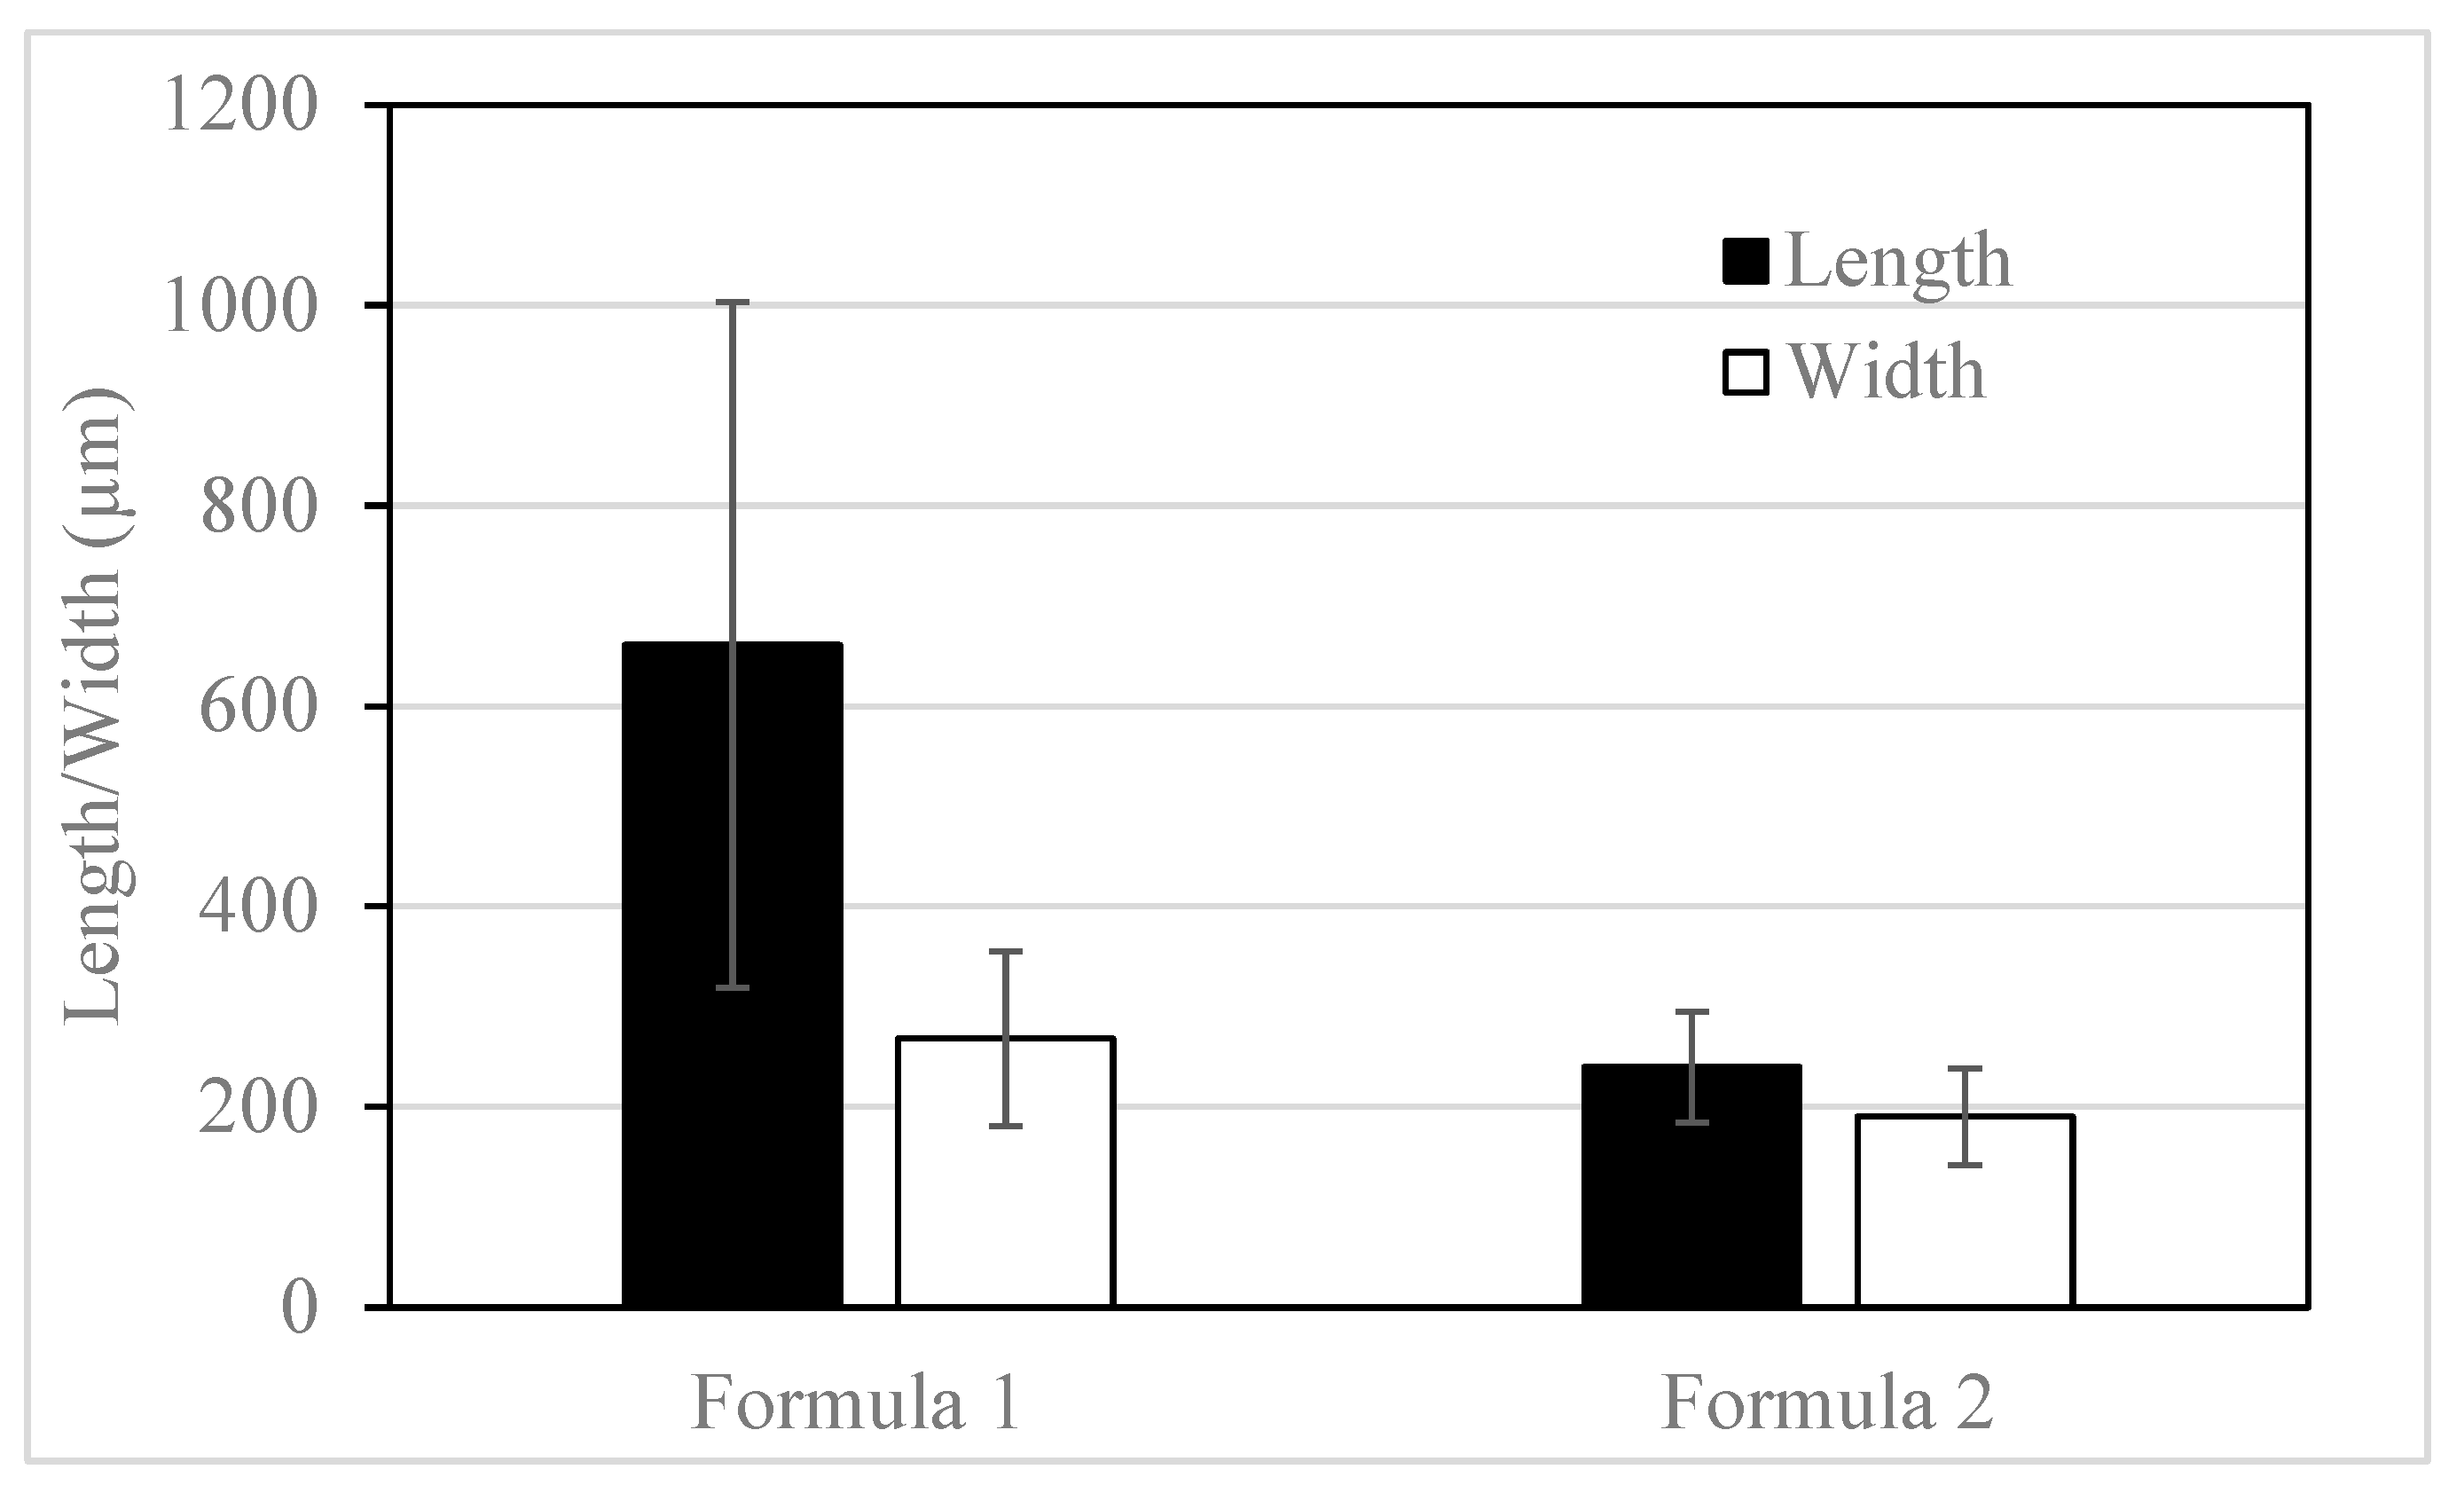
3.2. Crystal Size and Morphology of the Two Dazomet Formulations

Dazomet granules in Formulation 1 were oblong and appeared mostly as teardrop-shaped crystals with a tapered end and round bottom. Some of these crystals had two lobes and a tapered end, which gave them a pointed hourglass shape (Figure 5). Dazomet granules in Formulation 2 were globular and appeared as rounded crystals with several lobes.
The dazomet granules from Formulation 1 were significantly longer than those from Formulation 2, averaging 661 µm and 240 µm, respectively (p < 0.05, ANOVA) (Figure 6). The granule lengths of Formulation 1 were more variable than those of Formulation 2, with coefficients of variation (COV) of 51.8% versus 23.2%, respectively. The granule widths were similar between the two formulations, with Formulation 1 averaging 268 µm compared to 190 µm for Formulation 2, but the differences were still significant, and the COVs were similar (p = 0.01, ANOVA). Differences in granule size and shape may play a role in accelerant penetration because they impact how closely granules can pack together. For example, the larger granules of Formulation 1 may have resulted in greater voids between neighboring crystals, enabling the soluble to pass more easily through the dazomet granules. While this study represents only a preliminary investigation, and the preceding statement remains a hypothesis only, subsequent measurements of accelerant penetration should be carried out in relation to the field performance of fumigant/accelerant combinations.

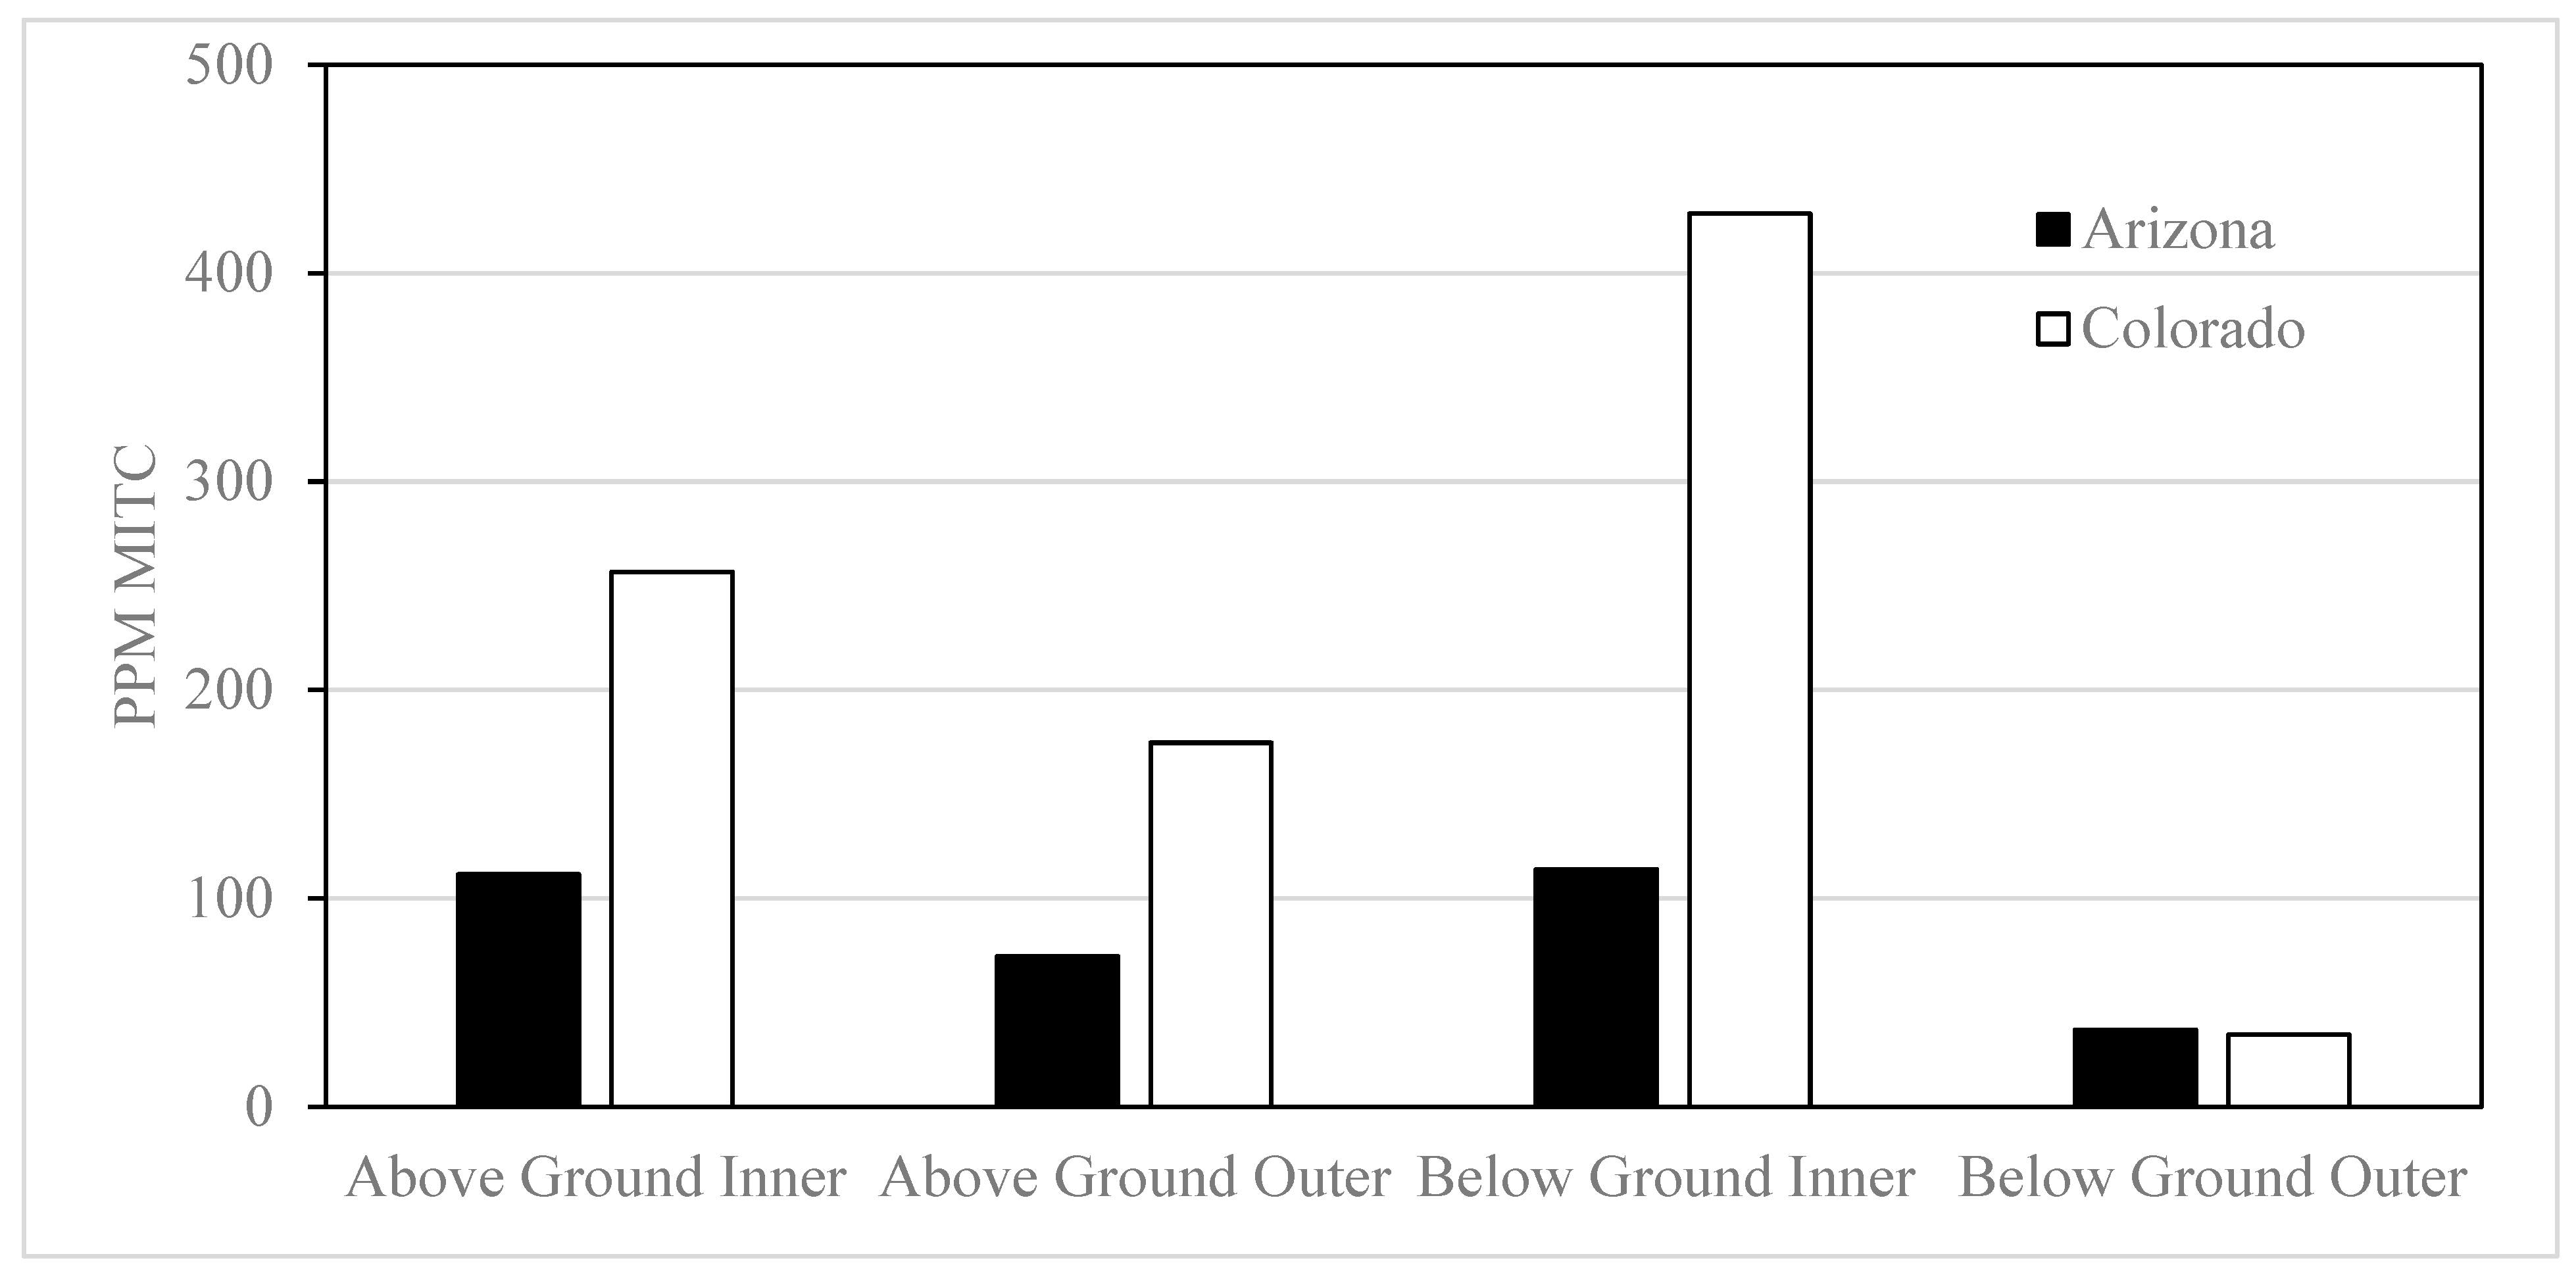
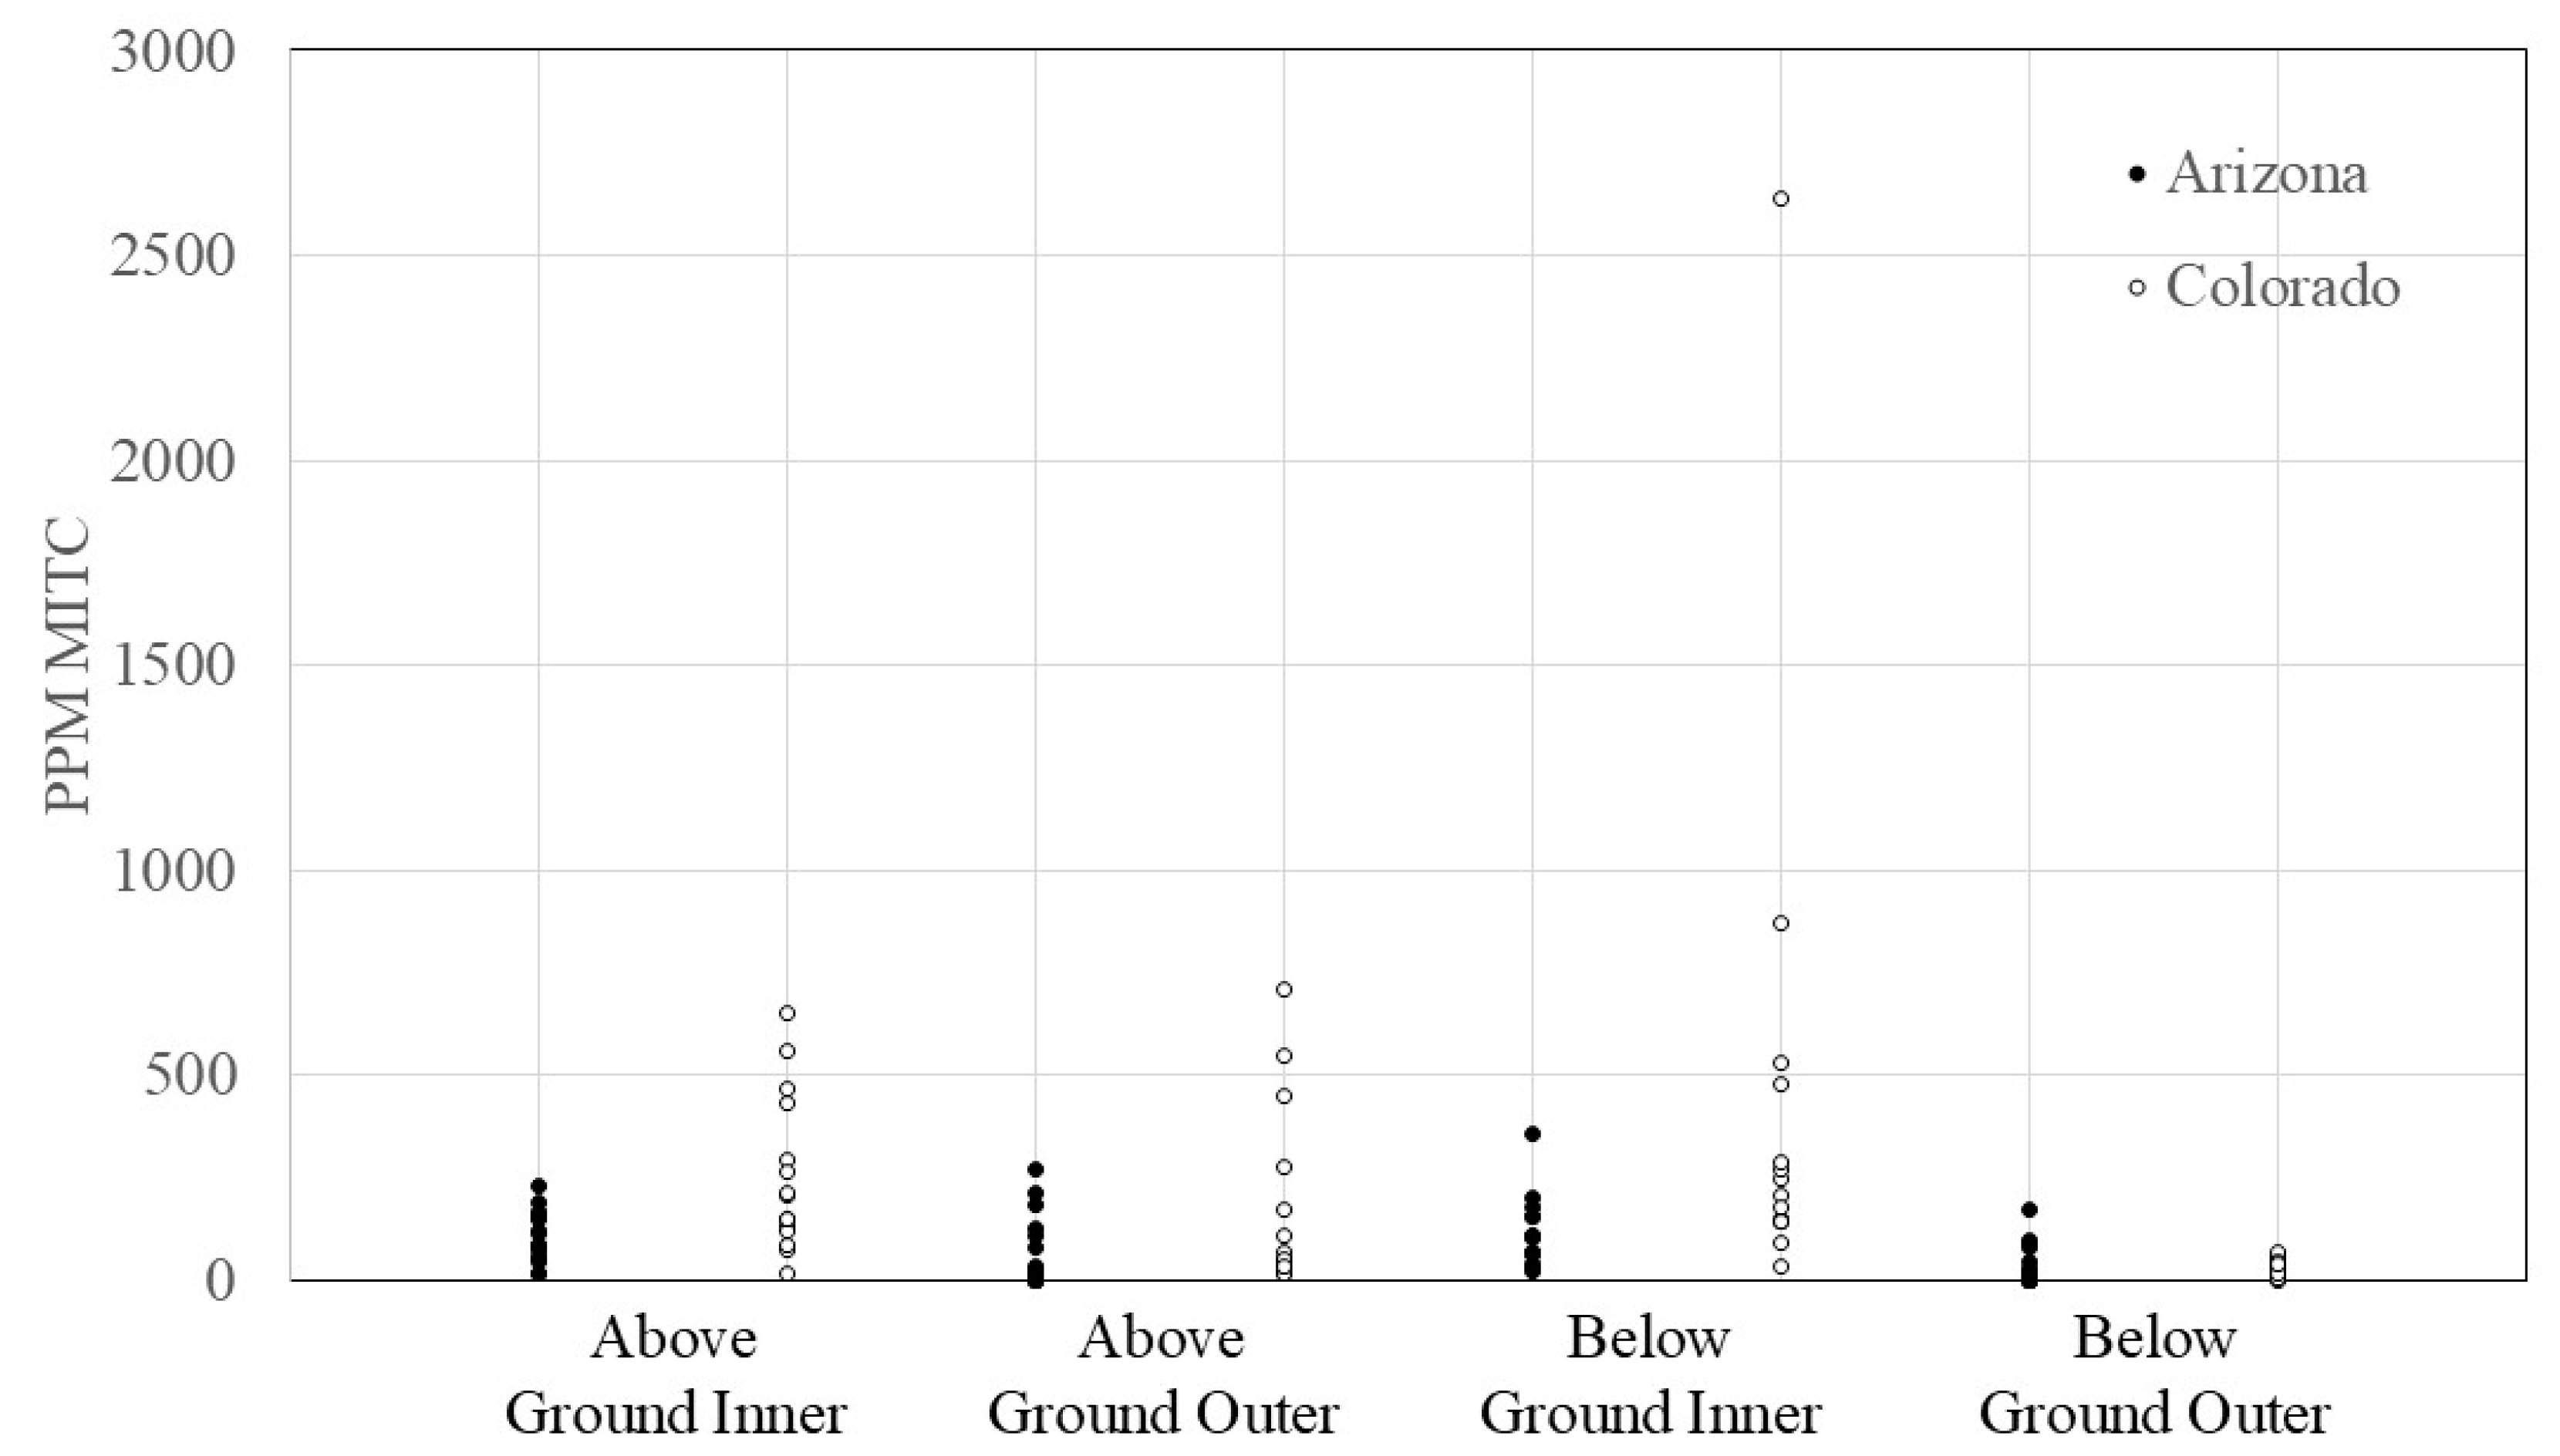
3.3. Methylisothiocyanate Production in Wood Mesocosms

The blocks exposed in Arizona were extremely dry, with moisture levels below the detection limit for the infrared moisture meter above ground and only 14% below ground. Average moisture contents of timbers exposed in Colorado were 13% above ground and over 60% below ground, which is consistent with the repeated wetting of the timbers at this site. As noted earlier, moisture is essential for dazomet decomposition, although the accelerant can help mitigate this issue.
MITC levels trended lower at most sampling locations at the drier site in Arizona except in the below-ground outer sampling location. This is likely due to the higher moisture content maintained at the Colorado test site by supplemental watering. It is unclear why the outer zones below ground contained lower MITC levels at both sites, as moisture is a critical driver of dazomet decomposition. It is possible that the sampling point was too far below the bulk of the granular dazomet, and much of the gaseous MITC traveled away from that sampling point. The inner core sections tended to have higher MITC levels, and this is consistent with the previous studies [11]. The downward-sloping treatment holes likely enhanced the levels at these sites. MITC was present above the 20 ppm threshold in most samples, which has previously been shown to be the approximate threshold of inhibition for decay fungi in wood poles [15].
MITC levels were highly variable among treatments and sampling locations, with COVs ranging from 54 to 151%, some of which were driven by a few exceedingly high values (Figure 7 and Figure 8 and Table 2). This is typical of fumigant studies, because the distribution of gaseous compounds in wood can vary by orders of magnitude within only a few centimeters [11]. This high level of variability suggests that users of this method will require many replicates for each treatment tested to resolve differences. MITC levels were over the threshold in most treatments for both sites, but the levels tended to be higher in samples from Colorado, again reflecting the higher moisture levels at this site.

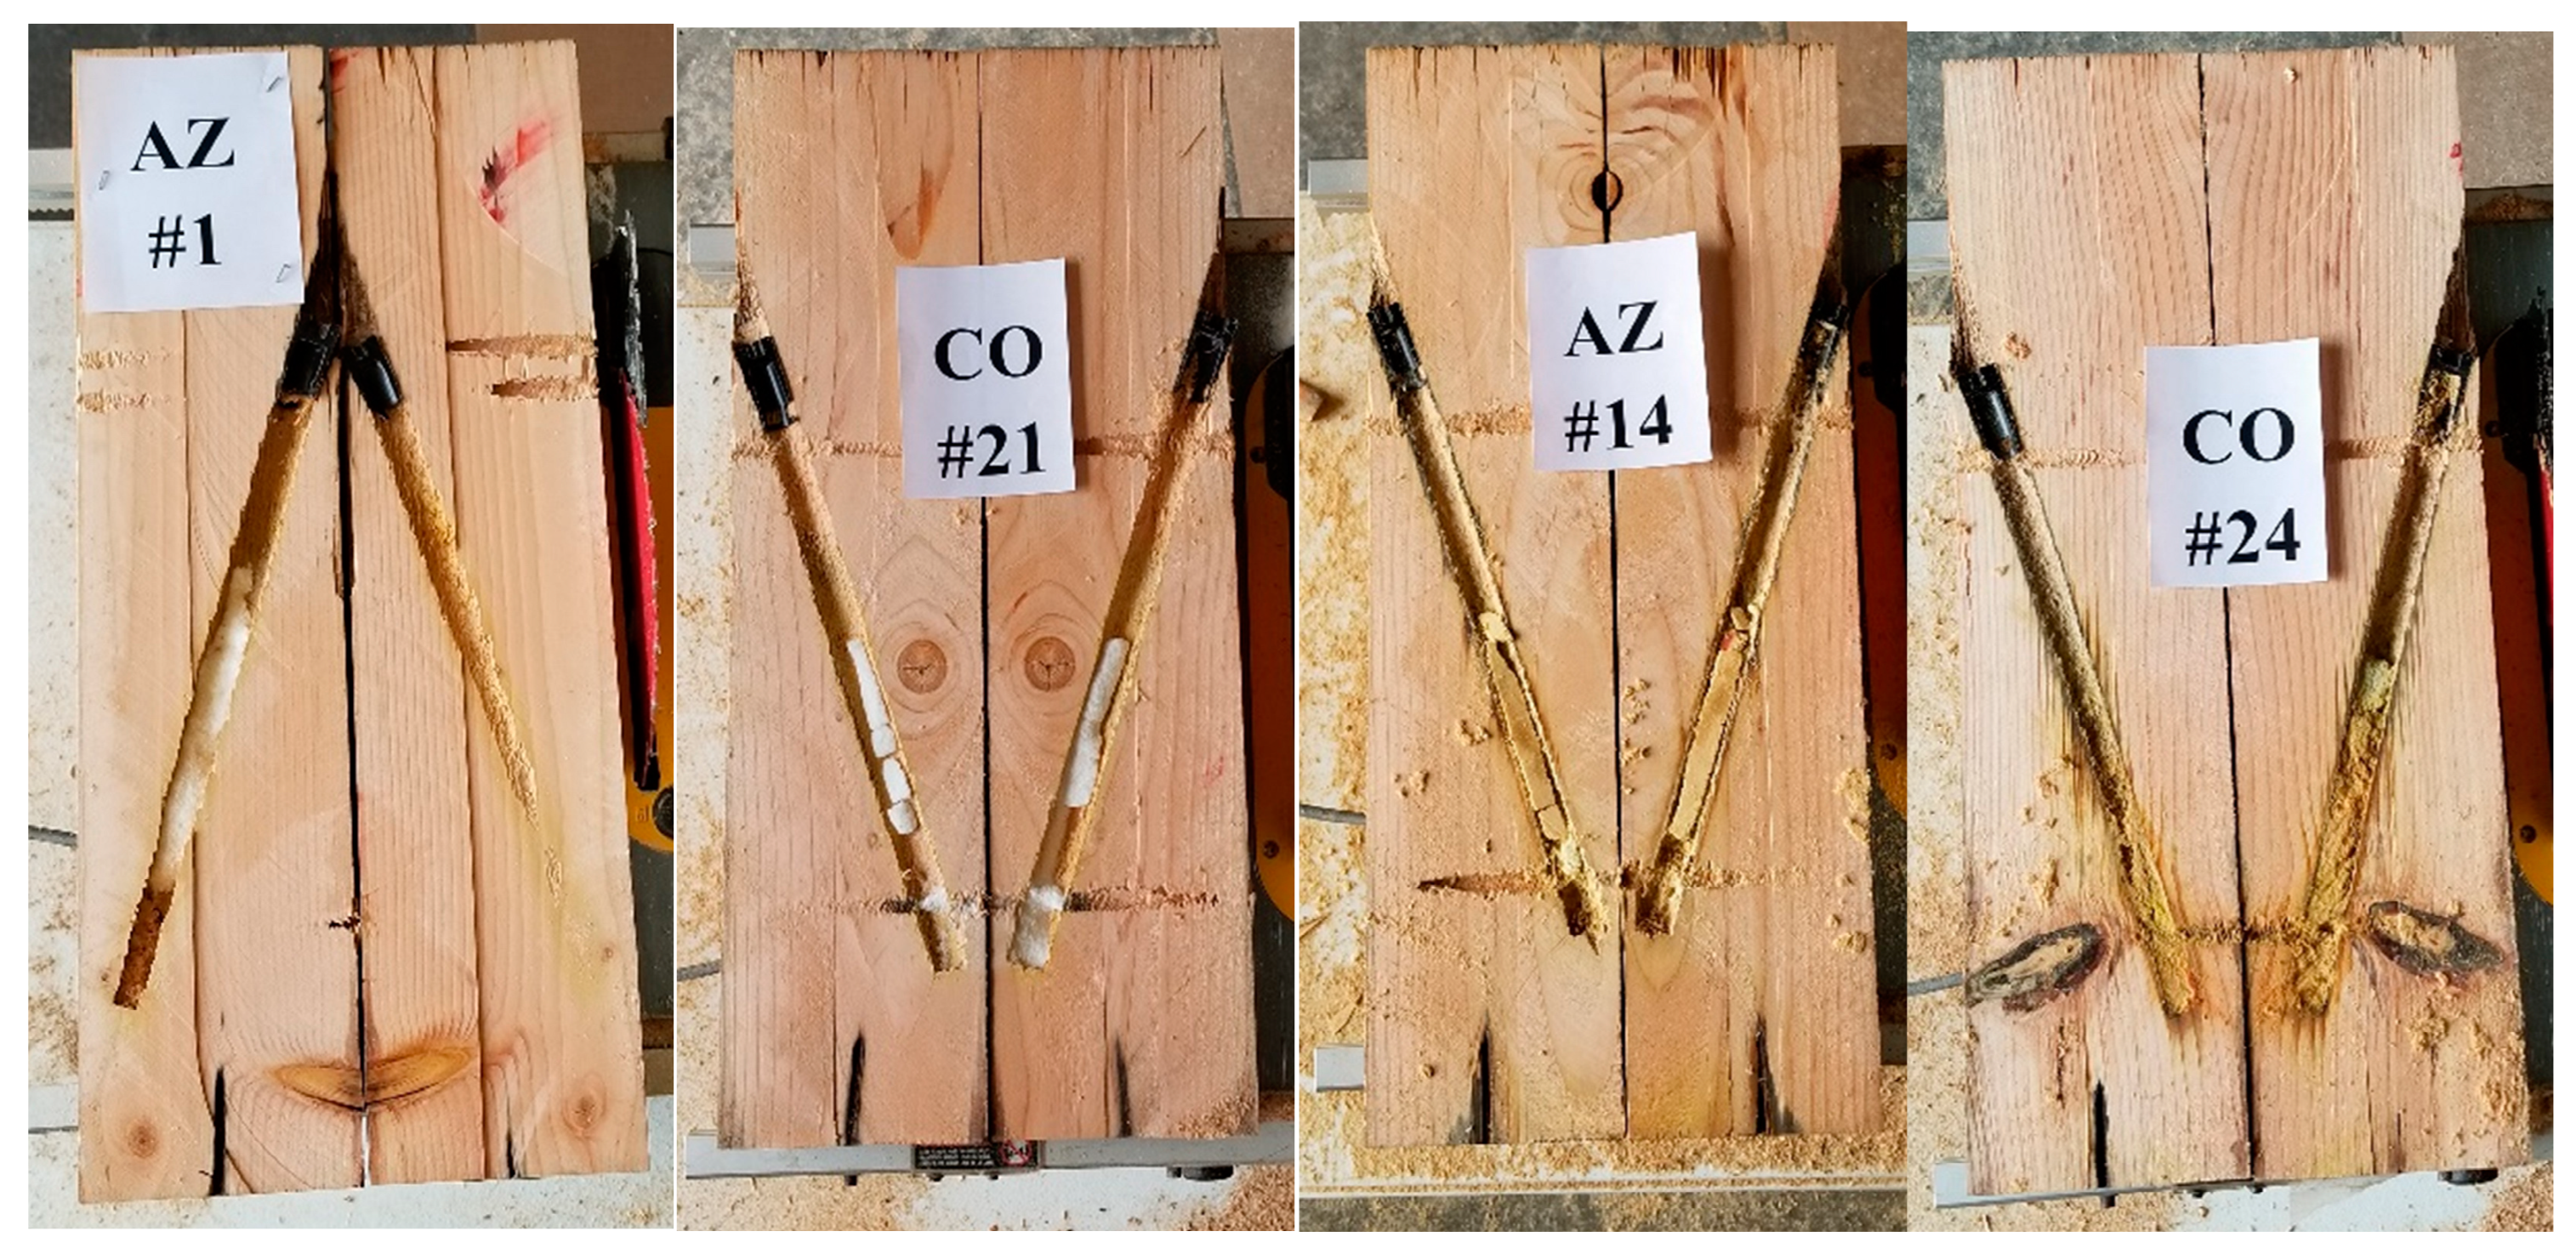
3.4. Condition of Granular Dazomet After the Tests

When test blocks were ripped along the treatment hole to visualize dazomet decomposition among the different conditions, yellowing of the fumigant was apparent in many cases (Figure 9). In some cases, milling the blocks along the treatment hole resulted in loss of the fumigant, and it was not possible to examine the extent of decomposition (Figure 10). Where intact, the fumigant had yellowed to some degree in all specimens. More yellowing was generally visible near the end of the treatment hole, which is likely due to the downward percolation of water in the test beds and the resultant increased dazomet decomposition.

4. Conclusions

This study describes a useful, rapid methodology for measuring the relative performance of granular dazomet in combination with accelerants at the mesocosm scale while maintaining a wood test substrate. MITC tended to be found at higher levels in the inner sampling locations, closer to the treatment holes. Below-ground sampling locations were wetter and more conducive to dazomet decomposition, but the outer portion of the wood samples showed generally lower MITC levels than any other sampling location. MITC concentrations had very high coefficients of variation in this study when each sampling location was considered across all treatments, and users of this method should include many replicates to resolve differences among treatments. Microscopic analysis of different dazomet formulas tested here showed that crystal morphology can vary widely among commercial preparations, possibly causing differences in accelerant penetration.

Author Contributions

Conceptualization, M.J.K.; Methodology, M.J.K., T.L.W., R.S.G., J.J.M. and G.P.; Investigation, M.J.K., T.L.W. and R.S.G.; Resources, M.J.K., T.L.W. and R.S.G.; Data curation, M.J.K. and G.P.; Writing—original draft, M.J.K., T.L.W., J.J.M. and G.P.; Supervision, M.J.K. and R.S.G.; Project administration, M.J.K., T.L.W., R.S.G. and J.J.M.; Funding acquisition, M.J.K. All authors have read and agreed to the published version of the manuscript.

Funding

This research was privately funded by Poles Inc.

Data Availability Statement

All data is available in the manuscript except raw data files.

Acknowledgments

We would like to thank Mike Woodward for providing the test site in Arizona for this study.

Conflicts of Interest

Randy S. Gross is the owner of Poles Inc. Poles Inc. provided in-kind support of materials and staff time to complete this research.

References

  1. Morrell, J.J. Wood Pole Maintenance Manual: 2012 Edition (Research Contribution 51); Forest Research Laboratory, Oregon State University: Corvallis, OR, USA, 2012. [Google Scholar]
  2. Graham, R.D.; Mothershead, J.S. Inspecting and Treating Western Redcedar and Douglas Fir Poles in Service; Forest Products Research Laboratory, Oregon State University: Corvallis, OR, USA, 1967. [Google Scholar]
  3. Morrell, J.J. Estimated Service Life of Wood Poles (Technical Bulletin No. 16-U-101); North American Wood Pole Council: Alpharetta, GA, USA, 2016. [Google Scholar]
  4. Graham, R.D. Improving the Performance of Wood Poles. Proc. Am. Wood Preserv. Assoc. 1983, 79, 222–229. [Google Scholar]
  5. Graham, R. Preventing and Stopping Internal Decay of Douglas-fir Poles. Holzforschung 1973, 27, 168–173. [Google Scholar] [CrossRef]
  6. Morrell, J.; Corden, M. Controlling wood deterioration with fumigants—A review. For. Prod. J. 1986, 36, 26–34. [Google Scholar]
  7. Eslyn, W.E.; Highley, T.L. Efficacy of Various Fumigants in the Eradication of Decay Fungi Implanted in Douglas-fir Timbers. Phytopathology 1985, 75, 588–592. [Google Scholar] [CrossRef]
  8. Zahora, A.R.; Humphrey, P.E.; Morrell, J.J. Preliminary modelling of methylisothiocyanate movement through Douglas fir transmission poles. In Proceedings of the IRG Annual Meeting, IRG/WP/3466, Madrid, Spain, 24–29 April 1988; p. 12. [Google Scholar]
  9. Highley, T.L. Movement and Persistence of Dazomet and Pelleted Methylisothiocyanate in Wrapped Douglas-fir and Southern Pine Timbers. In Proceedings of the IRG Annual Meeting, IRG/WP/1496-91, Kyoto, Japan, 20–24 May 1991; p. 5. [Google Scholar]
  10. Forsyth, P.G. Decomposition of Basamid in Douglas-Fir Heartwood; Oregon State University: Corvallis, OR, USA, 1993. [Google Scholar]
  11. Konkler, M.J.; Cappellazzi, J.; Love, C.S.; Freitag, C.; Morrell, J.J. Performance of Internal Remedial Treatments on Douglas-Fir Poles: A Large-Scale Field Trial. For. Prod. J. 2019, 69, 289–304. [Google Scholar] [CrossRef]
  12. Forsyth, P.; Morrell, J.; Chen, H. Rates of MITC release from Basamid® applied with selected additives to Douglas-fir poles. For. Prod. J. 1998, 48, 40–43. [Google Scholar]
  13. Love, C.S.; Freitag, C.; Morrell, J.J. Effect of Copper on Long-Term Performance of Dazomet as an Internal Remedial Treatment in Douglas-Fir Poles. For. Prod. J. 2010, 60, 194–199. [Google Scholar] [CrossRef]
  14. Forsyth, P.; Morrell, J. The effect of selected additives and conditions on the decomposition of Basamid in Douglas-fir Heartwood. In Proceedings of the IRG Annual Meeting, IRG/WP/3698-92, Harrogate, UK, 10–15 May 1992; p. 11. [Google Scholar]
  15. Morrell, J.; Freitag, C.; Rhatigan, R.; Love, C.S.; Mankowski, M. Oregon State University Cooperative Pole Research Program 20th Annual Report; Oregon State University: Corvallis, OR, USA, 2001; p. 108. [Google Scholar]
Figure 1. (Left) Wood boring rig showing a wood block clamped in a vise and jig for guiding the wood boring bit and (right) a treatment block ripped open to show the angled treatment hole as well as visual evidence of fumigant decomposition to sulfur (yellow color) and the horizontal core boring locations. 18B indicates one of the dazomet treatments combined with a waterbased solution of 2.5% copper ethanolamine and 6.25% disodium octaborate tetrahydrate.
Forests 16 00572 g001
Figure 2. Photo of the dazomet-treated 4 × 6 inch timbers set in soil after one year of exposure at the Colorado test site (foreground) and the Arizona test site (left, background).
Forests 16 00572 g002
Figure 3. (A) Examples of penetration of the water-based 1% copper naphthenate accelerant into granular Formulations 1 and 2 shortly after chemical addition, (B) 24 h after accelerant addition, and (C) 30 days after accelerant addition, showing slightly faster penetration into Formulation 1.
Forests 16 00572 g003
Figure 4. (A) Examples of penetration of water-based copper ethanolamine (2.5% as copper) and DOT (6.25%) through granular Formulations 1 and 2 shortly after chemical addition, (B) 24 h after accelerant addition, and (C) 30 days after accelerant addition, showing slower penetration than with the organic solvent-based accelerant system.
Forests 16 00572 g004
Figure 5. (Left) Light microscopic images of dazomet granules from Formulations 1 and 2 (left and right), showing differences in morphology and dimensions that might affect accelerant interactions.
Forests 16 00572 g005
Figure 6. Average dimensions for 100 dazomet granules each from Formulations 1 and 2. Error bars represent one standard deviation.
Forests 16 00572 g006
Figure 7. Average MITC concentrations in increment cores taken from above or below ground of Douglas-fir timbers 13 months after treatment with two dazomet formulations with or without a copper-based accelerant and exposure in Arizona or Colorado.
Forests 16 00572 g007
Figure 8. Scatter plot showing each individual MITC concentration in increment cores taken from above or below ground of Douglas-fir timbers 13 months after treatment with two dazomet formulations with or without a copper-based accelerant and exposure in Arizona or Colorado.
Forests 16 00572 g008
Figure 9. Photos of ripped test blocks showing partially degraded dazomet from accelerant-free treatments (#1, #21) and degraded, yellowed fumigant (#14, #24).
Forests 16 00572 g009
Figure 10. Photos of ripped test blocks where fumigant was lost while ripping the lumber and could not be assessed for level of decomposition.
Forests 16 00572 g010
Table 1. Combinations of dazomet and accelerants used to examine decomposition to MITC in Douglas-fir post sections.
Granular Dazomet FormulaDazomet Dose (g)AccelerantAccelerant Dose (g)
170None0
170Copper naphthenate 1% as metal in mineral spirits14
16033% sodium N-methyldithiocarbamate20
160Water-based solution of copper ethanolamine (2.5% as copper) and DOT (6.25%)20
160Runny paste 16.83% DOT, Cu(OH)2 2.08% as metal20
140Copper naphthenate 1% as metal in mineral spirits40
140Water-based solution of copper ethanolamine (2.5% as copper) and DOT (6.25%)40
140Runny paste 16.83% DOT, Cu(OH)2 2.08% as metal40
260None0
260Copper naphthenate 1% as metal in mineral spirits20
260Water-based solution of copper ethanolamine (2.5% as copper) and DOT (6.25%)20
260Runny paste 16.83% DOT, Cu(OH)2 2.08% as metal20
240Copper naphthenate 1% as metal in mineral spirits40
240Water-based solution of copper ethanolamine (2.5% as copper) and DOT (6.25%)40
240Runny paste 16.83% DOT, Cu(OH)2 2.08% as metal40
Table 2. Effects of accelerant addition and field exposure site on methylisothiocyante (MITC) concentrations in inner and outer sections of increment cores removed from above and below groundline of Douglas-fir timbers 13 months after treatment.
FormulaDazomet Dose (g)AccelerantAccelerant Dose (g)Arizona MITC (ppm)Colorado MITC (ppm)
Above GroundBelow GroundAbove GroundBelow Ground
InnerOuterInnerOuterInnerOuterInnerOuter
170None046.50.0156.40.018.219.034.40.0
170Copper naphthenate 1% as Cu in mineral spirits14152.70.036.80.0135.721.1249.939.7
16033% sodium N-methyldithiocarbamate20119.90.0107.20.0296.215.3274.38.4
160Copper ethanolamine (2.5% as Cu) and DOT (6.25%)20113.0270.5156.112.0655.5707.52638.435.5
160Runny paste 16.83% DOT, Cu(OH)2 2.08% as Cu2014.90.9107.90.0151.336.5148.757.1
140Copper naphthenate 1% as Cu in mineral spirits40158.212.523.422.4267.8279.3532.521.3
140Copper ethanolamine (2.5% as copper) and DOT (6.25%)4072.5111.541.57.1562.7170.8205.133.5
140Runny paste 16.83% DOT, Cu(OH)2 2.08% Cu4088.10.063.40.075.851.7143.427.5
260None017.417.527.90.0210.244.791.228.4
260Copper naphthenate 1% as Cu in mineral spirits2086.282.5178.9172.0122.068.1180.935.4
260Copper ethanolamine (2.5% as Cu) and DOT (6.25%)20228.3182.7200.496.9431.0549.8286.652.7
260Runny paste 16.83% DOT, Cu(OH)2 2.08% as Cul20155.435.771.929.989.254.5145.817.8
240Copper naphthenate 1% as Cu in mineral spirits40167.827.7360.578.2215.9450.9480.970.5
240Copper ethanolamine (2.5% as Cu) and DOT (6.25%)4059.5126.571.343.4465.0112.5871.448.3
240Runny paste 16.83% DOT, Cu(OH)2 2.08% as Cu40192.0215.0104.192.2151.637.6145.542.2
Values represent single analyses. Values in bold are above the presumed fungitoxic threshold 20 ppm MITC as per prior testing [15].
Disclaimer/Publisher’s Note: The statements, opinions and data contained in all publications are solely those of the individual author(s) and contributor(s) and not of MDPI and/or the editor(s). MDPI and/or the editor(s) disclaim responsibility for any injury to people or property resulting from any ideas, methods, instructions or products referred to in the content.

