Abstract
This study assessed the health risks of date palms in Taiwan with aerial root growth using visual tree assessment and minimally invasive testing. The phenomenon of aerial root growth on the outer side of the trunk is presumed to be a growth response of the palm to adapt to environmental changes, while the distinct dark stem tissue band between the decayed and sound stem tissue in the cross-section is likely a result of stem tissue variation. Key external defects included leaning and insect damage, while acoustic tomography confirmed internal structural variability but required accuracy improvements. Drilling resistance tests showed that healthy palms had the highest resistance near the cortex, decreasing toward the center, while decayed palms exhibited significant amplitude reductions. These findings highlight the need for comprehensive palm health assessments and provide a scientific basis for improved urban palm management and conservation.
1. Introduction
The date palm (Phoenix dactylifera Linn.) is an important street tree in Taiwan, significantly enhancing the beautification of urban and rural landscapes. However, as an ornamental tree, it faces potential risks due to its unique structural characteristics. The stability of date palms differs from coniferous or broadleaf trees, increasing the risk of overturning during strong winds or extreme weather. Additionally, they are susceptible to pests and diseases that threaten their health and the surrounding environment. Regular inspection and maintenance are essential, and professional arborists can conduct health risk assessments to ensure the palms’ safety.
Despite their significance, comprehensive risk assessment information for date palms is lacking. Aerial roots, known as respiratory roots, extend from the trunk, allowing the palm to absorb moisture and nutrients from the air, which enhances survival under drought and high temperatures. The current literature indicates that these roots typically do not affect the tree’s structural integrity [1,2]. However, the internal condition of the trunk remains unclear, necessitating assessments to better understand their health status.
The visual tree assessment (VTA) is a systematic method for evaluating tree health and potential hazards through visual inspection of the trunk, crown, root system, and surrounding environment. This process allows arborists to identify signs of decay, pests, or other abnormalities quickly, facilitating timely management actions [3,4].
Advanced inspections utilize minimally invasive technologies (MIT), such as acoustic tomography and drilling resistance, to assess a tree’s internal structure while minimizing damage [5,6]. Acoustic tomography detects internal cavities by sending sound waves into the tree, providing a visual image of its internal structure [7]. This method is effective for decay detection in urban trees [8], although its accuracy can be influenced by various factors. While the drilling resistance method involves some physical intervention, it is designed to gather information with minimal impact on the tree’s overall health.
The drilling resistance method involves creating small drill holes to measure resistance at different depths, helping interpret tomographic images and assess wood structure [9,10,11,12]. By combining these techniques, a comprehensive assessment of tree health can be achieved, ensuring safety in urban and rural environments.
During inspections of date palms, noticeably inclined trees and the presence of aerial roots were observed (Figure 1). While surveying trees in the Pingtung area, we noted that aerial roots developed at varying heights (<1.3 m above ground) and quantities around the trunks. These roots extend from the bulbous base and aid in water absorption, enhancing stability. However, excessive growth may negatively impact health and lead to trunk deformation, posing safety challenges. Thus, professionals must pay special attention to aerial roots during inspections [13,14].
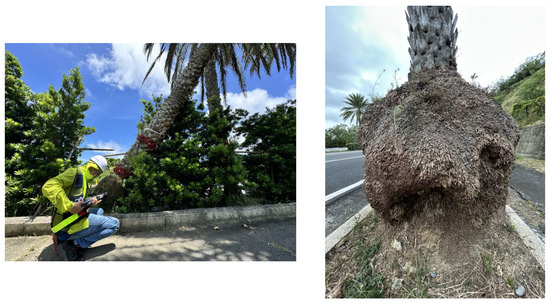
Figure 1.
Inclined date palm and aerial roots growing around the trunk.
This study emphasizes the importance of tree risk assessment, particularly for street trees, as they significantly impact the surrounding environment. The presence of aerial roots adds another layer of interest, as these roots play a crucial role in the tree’s stability and health.
This study aimed to inspect the structural condition and hazards of date palms with aerial roots. The VTA method was first employed to identify potential hazardous defects. Next, sonic tomography assessed the trunk’s cross-sectional condition based on lateral stress wave velocity, followed by the drilling resistance method to analyze the trunk’s cross-section. Finally, palms were felled based on the results of the inspections for visual examination of cross-sectional discs. The collected data provide valuable references for arboricultural science in tree risk assessment.
2. Materials and Methods
2.1. Experimental Procedure
This experiment was conducted in the environment of Pinga Highway in Pingtung, Taiwan, targeting date palm (Phoenix dactylifera) street trees. First, the visual tree assessment (VTA) method was used to inspect the trees, following the ISA basic tree risk assessment form to check for hazardous defects. A total of 372 date palm street trees underwent VTA inspection to identify visual defects. Subsequently, 30 trees without visible damage defects and 1 palm with decay and hollowness were selected for acoustic imaging to detect the cross-section of the trunk, obtaining 2D tomographic images of stress wave velocity.
Next, a drilling resistance instrument was used to conduct drilling resistance tests on 5 palms without visible damage defects, collecting drilling resistance amplitude data. With the consent of the tree management unit, one palm without visible damage defects and one palm with decay and hollowness were felled. Discs 15 cm thick were cut from their cross-sections and placed in the laboratory to air dry. The drilling resistance instrument was then used to test these discs, obtaining drilling resistance amplitude profile data from one undamaged disc and one decayed hollow disc, measured from the east, south, west, and north directions towards the center of the trunk along the cortex.
The current testing design involved drilling resistance tests on five palms without visible damage during the standing tree phase, while after felling, one sound disc and one decayed hollow disc were examined. Since visual inspection confirmed the presence of decay and hollowness in some tree trunks; these trees were only assessed using stress wave imaging, and no drilling resistance tests were conducted during the standing tree phase. Instead, the drilling tests were performed after felling.
The primary consideration for this design was to compare the drilling resistance characteristics of sound and decayed stem tissue. Testing on discs ensured a clearer distinction between the two conditions and minimized the influence of moisture content on resistance amplitude in standing trees. Additionally, the testing conditions for discs were more stable, allowing for a more precise analysis of internal stem tissue variations. Future research could further compare decayed standing trees and felled discs to investigate the effect of moisture variation on drilling resistance results and enhance the applicability of the testing method.
2.2. Acoustic Tomography Testing
Acoustic tomography imaging was conducted using the Fakopp 3D stress wave detection system (Fakopp Enterprise Ltd., Sopron, Hungary, v6.5 [15]), aiming to construct 2D tomographic images of the cross-sections of 30 date palms without visible damage defects and 1 palm with decay and hollowness. The operation of the instrument and software followed the user manual [16]. The method measures the transmission time and sound speed of stress waves to obtain raw data for 2D tomographic image processing. The Fakopp 3D tomograph consists of 8 sensors, which are evenly spaced around the circumference of the trunk cross-section on a horizontal plane.
Under the operation of ArborSonic 3D software (v5.3.164; Fakopp Enterprise Ltd., Sopron, Hungary), the 2D tomographic images of stress wave velocity across the tree cross-section were generated. By repeatedly striking each sensor with a steel hammer, sound transmission data was collected, resulting in a complete data matrix at each testing location. The frequency of the generated stress waves was measured and found to be within the range of [specific frequency range, e.g., 35–40 kHz]. This technique of wave generation through mechanical impact ensures consistent and reliable data collection for analysis.
The software automatically calculates the stress wave velocity values to generate 2D tomographic images of lateral stress wave velocity. Acoustic tomography tests were conducted on date palms using the Fakopp stress wave tomography system (no. 27), with the process outlined in Figure 2.
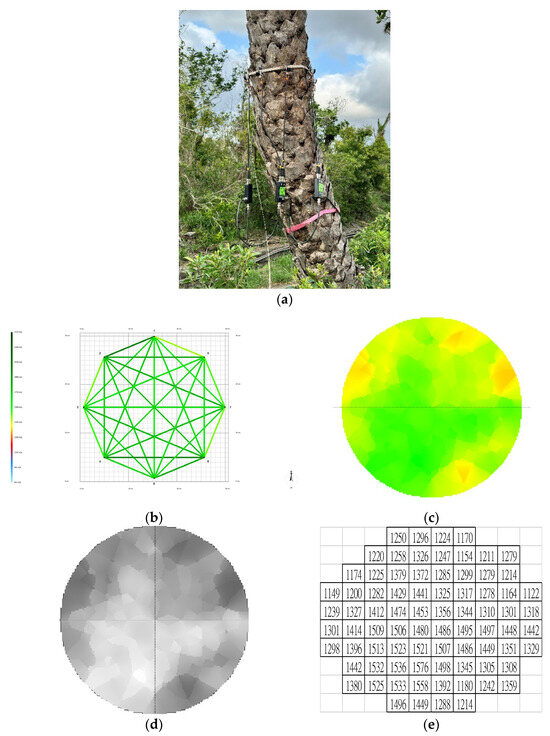
Figure 2.
Sonic tomography test on date palm using a Fakopp stress wave tomographic tool (no. 27). (a) Photo of the appearance of a date palm trunk; (b) Sensor arrangement (1 to 8) and sonic measurement paths; (c) Stress wave velocity tomography using a green–yellow–red color scale (1632–706 m/s): Green represents healthy wood (1632–1669 m/s), yellow indicates slightly degraded wood (1670–1200 m/s), and red denotes severely decayed or hollow wood (1199–706 m/s); (d) Schematic of the stress wave velocity tomography with a grayscale (highest to lowest velocity); (e) The corresponding stress wave velocity grid map (30 × 30 mm).
2.3. Drilling Resistance Testing
In this study, a drilling resistance device (RESI PD500, IML Company, Kennesaw, GA, USA) was used to test 5 palms without visible damage defects during the standing tree phase. Additionally, one undamaged disc and one decayed hollow disc obtained after felling were used as test samples. Drilling tests were conducted on the cross-sections of the trunks in the east, south, west, and north directions. The drilling was performed from the cortex towards the center of the palm to obtain drilling resistance amplitude profile data. A specialized needle was used for this process, with a tip diameter of 3.0 mm and a shaft diameter of 1.5 mm, made of stainless steel with a special surface coating. The drilling was conducted using the Resi (IML) device, which is designed for precise measurement of stem tissue resistance. The Resi device offers a measurement range of 500 mm and a resolution of 0.1 mm (resolution for each drilling amplitude value), and simple measurements of penetration resistance can be obtained by directly reading the drilling depth in a 1:1 scale, ensuring accurate data collection for analysis.
The aim was to compare and correlate these profile data with the 2D tomographic images and the surfaces of the trunk cross-section discs, thereby understanding the areas of undamaged decay, varying degrees of decay, and hollowness on the cross-section. The drilling resistance parameters were set to obtain one resistance amplitude value every 0.1 mm, with a feed rate of 100 cm/min and a drill speed of 3500 RPM.
2.4. Visual Inspection of Disc Cross-Sections
After inspecting the palms using the visual tree assessment (VTA) method, 7 date palm street trees were identified as having immediate hazards and were subsequently felled for removal. Samples were taken from the felled palms in the form of discs. After surface treatment of the disc cross-sections, visual observations were made to check for undamaged defects, varying degrees of decay, hollowness, aerial roots, and other phenomena.
3. Results
3.1. Visual Tree Assessment
A total of 372 date palm street trees underwent visual tree assessment (VTA), with an average tree height of 768.4 cm and a diameter at breast height (DBH) of 36.4 cm, having standard deviations of 24.4 cm and 5.0 cm, respectively. The inspection results indicated that the main external defects of the trees included: 1 palm with top dieback, 25 palms with a lean, 27 palms with cortex beetle damage or decay on the trunk’s exterior, and 1 palm with hollowness, totaling 4 defect categories. In total, 40 palms exhibited one or more of these four hazardous defect categories, with individual palms potentially having multiple defects.
3.2. Aerial Root Observations
Additionally, among the 368 date palms, aerial root growth was observed around the trunk at various heights below approximately 1.3 m from the ground, with an average growth height of 89.4 cm and a standard deviation of 3.6 cm. Only 4 palms did not exhibit aerial root growth. Therefore, the primary issues identified in the visual assessment of palm defects were the leaning of the palms and the cortex beetle damage or decay on the trunk’s exterior. Following the inspection of these palms with visible defects, non-destructive testing and evaluation of the internal conditions will be conducted using other instruments.
3.3. Visual Inspection of Cross-Sectional Discs
This study conducted a visual tree assessment (VTA) on date palms (Phoenix dactylifera) to examine the health status of the palms and the impact of their surrounding environment on the trunk. After inspection, the date palm street trees were determined to pose an immediate risk and were subsequently removed. After felling, cross-sectional samples of the trunks were processed, and their surface characteristics were observed visually (Figure 3).
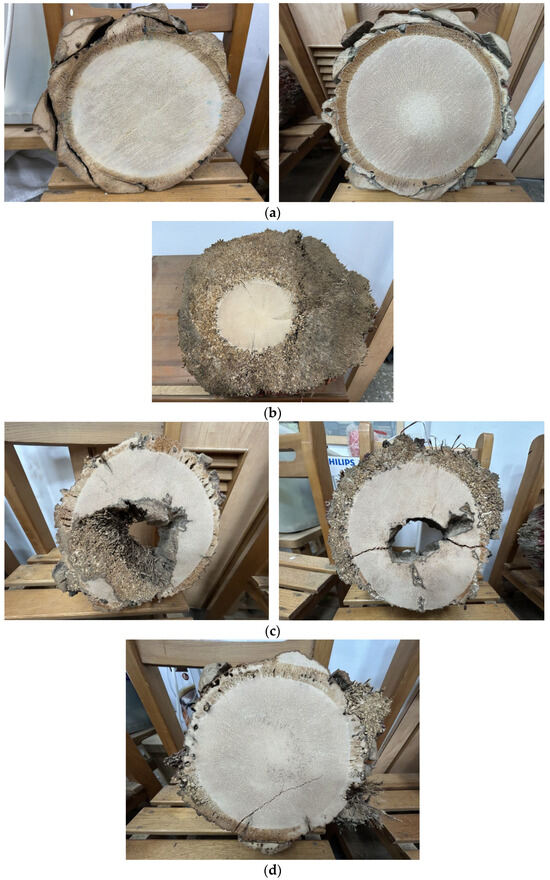
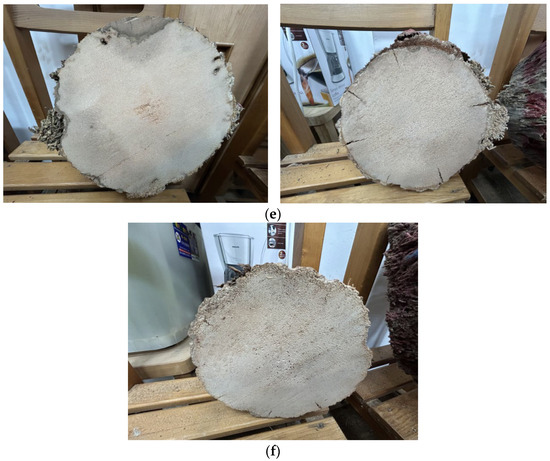
Figure 3.
Photos of aerial roots (AR), undamaged stem tissue (UDW), decayed and hollow stem tissue (DW), gradually deteriorating stem tissue (GDW), and stem tissue variation responses (WR) under the adaptive growth of discs in cross-sectional surfaces. (a) The outer side of a normal trunk has a cortex and remnants of leaf sheaths, and the vascular bundles in the cross-section of the trunk exhibit a spiral pattern (left) and a radial pattern (right). (b) The outer side of the trunk of the date palm shows vigorous growth of aerial roots, with no cortex or leaf sheaths visible on the outer side. (c) The cross-section of the trunk shows decay and hollowness, with aerial roots growing inside the cavity. There is a dark stem tissue boundary between the decayed hollow and the sound stem tissue, indicating a phenomenon of stem tissue variation due to the adaptive growth of the palm. Whether this is a defensive mechanism of the palm’s tissue remains to be confirmed through further research. The outer side of the trunk has remnants of cortex and leaf sheaths. (d) Some aerial roots grow on the outer side of the trunk, with remnants of cortex and leaf sheaths remaining. (e) Some aerial roots are located on the outer side of the trunk, where there is a dark stem tissue boundary indicating damage. This is a phenomenon of stem tissue variation due to the adaptive growth of the palm, and the cortex and leaf sheaths have fallen off. (f) The leaf sheaths and cortex on the outer side of the trunk have fallen off, and the deterioration of the stem tissue is gradually developing inward toward the cross-section of the trunk.
During the inspection, the condition of the cortex and residual leaf sheaths on the outer side of the trunk was noted. Specifically, healthy trunks exhibited cortex and residual leaf sheaths, with the vascular bundles in the trunk’s cross-section displaying spiral or radial patterns, indicating a healthy growth state (see Figure 3a). However, in some palms, vigorous aerial roots were observed growing on the outer side of the trunk, with no cortex or leaf sheaths present, suggesting that the palm’s growing environment may have been affected (see Figure 3b). Among the 368 date palm street trees visually inspected, varying heights and quantities of aerial roots were found around the trunk below a height of 1.3 m.
Additionally, some trunks exhibited decay and hollowness in their cross-sections, with aerial roots growing inside the hollows, and a dark stem tissue band (boundary) present between the decayed hollow and healthy stem tissue. This phenomenon may reflect the palm’s adaptive growth mechanisms and the resulting variations in stem tissue structure. However, whether this represents a defensive mechanism of the palm still requires further research (see Figure 3c). In other trunks, some aerial roots were found growing on the outer side of the trunk, with remnants of cortex and leaf scars (see Figure 3d). These phenomena indicate that palms may be influenced by various environmental factors during their growth, leading to changes in the structure surrounding their trunks.
Further observations revealed that the growth of aerial roots on the outer side of the trunk was accompanied by stem tissue degradation, developing from the outer trunk towards the interior. Additionally, damaged areas on the outer side of the trunk exhibited a dark stem tissue band different from healthy stem tissue, suggesting a phenomenon of stem tissue variation related to the palm’s adaptive growth (see Figure 3e). As the inspection progressed, it was found that the leaf sheaths and cortex on the outer side of the trunk had fallen off, with stem tissue degradation gradually extending into the interior of the trunk’s cross-section (see Figure 3f).
Overall, the results of this study indicate that the health status of date palms in public landscapes is influenced by various factors, particularly environmental conditions, and management practices. It also highlights the phenomenon of stem tissue variation related to the adaptive growth of date palms. These findings provide important references for future palm management and conservation efforts.
3.4. Acoustic Tomography Analysis
After conducting acoustic tomography testing on 30 undamaged date palms, data on lateral stress wave velocities were collected. Table 1 presents the results of the lateral stress wave velocities (V) for these palms, including the maximum velocity (Vmax), average velocity (Vmean), and minimum velocity (Vmin). The data indicate that the stress wave velocities of the palms range from 770 m/s to 2159 m/s, demonstrating variability in the internal structure of the palms. The stress wave velocity measured perpendicular to the grain (transverse direction) aims to assess whether there is decay or hollowness within the palm trunk. The degree of attenuation in the transverse stress wave velocity can serve as a parameter for evaluating the health of the palm.

Table 1.
Transverse stress wave velocities (V, m/s) in tomographies of undamaged living date palm palms (N = 30).
Specifically, the average maximum, central, and minimum stress wave velocities (Vmax, Vmean, Vmin) are 1652, 1258, and 864 m/s, respectively, suggesting that the overall health of these palms is good. However, some palms exhibit a minimum stress wave velocity (Vmin) of 510 m/s, indicating potential weaknesses in their internal structure. The standard deviations (SD) are 236.7, 178, and 152 m/s, respectively, reflecting the degree of variability in stress wave velocities among the palms.
Table 1 shows the transverse stress wave velocity 2D grayscale images of 30 sample palms, with a grayscale range from 0 to 255. The darker the color, the lower the stress wave velocity, while the lighter the color, the higher the stress wave velocity. By combining the 2D image with a grid-based approach, the stress wave velocity in each region of the image was analyzed, allowing for an understanding of the variation in stress wave velocity values across different areas. Since the stress wave imaging data was a 2D analysis result and the drilling resistance data was a linear result, the combination of both provided more precise information. The 2D image of stress wave velocity primarily revealed potential areas of decay or voids, while the amplitude data from the drilling resistance was used to more accurately locate these areas of decay or voids.
3.5. Stress Wave Imaging of Decayed Date Palm
In this study, we conducted stress wave imaging testing on a date palm with decayed hollow damage. The reason for selecting this palm was that, among all the inspected palms, it was the only one with a visibly identifiable decay cavity. Therefore, it was chosen as the sample palm for damaged palm detection. After completing the assessment, the palm was felled, and a cross-section was taken to observe the extent of the decay and hollow damage. Through this process, we were able to visually understand the internal structural condition of the palm and compare it with the results from the stress wave two-dimensional images.
Firstly, the cross-section of the disc clearly displayed significant decay cavities, with the extent and location of the damage corresponding to the distribution of stress wave speeds shown in the 2D image grids (Figure 4). The two-dimensional image of stress wave speeds utilized a color scale of green, yellow, and red, indicating variations from the highest to the lowest speeds, ranging from 899 m/s to 1733 m/s. This data provided detailed information about the internal structure of the palm, allowing us to determine the specific locations of the decay cavities and their impact on the overall health of the palm.
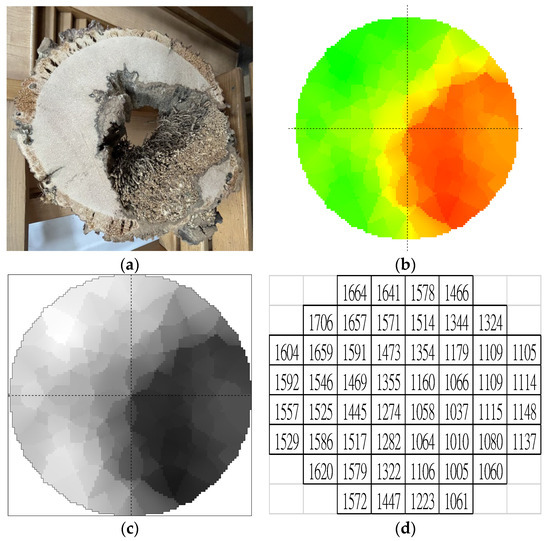
Figure 4.
Sonic tomography test on a decay-damaged date palm using a Fakopp stress wave tomographic tool (no. 78). (a) Disc photo of the cross-section appearance of a date palm trunk; (b) Stress wave velocity tomography using a green-yellow-red color scale (1733–899 m/s): Green represents the highest velocity (1733–1316 m/s), yellow indicates medium velocity (1315–1100 m/s), and red denotes the lowest velocity (1099–899 m/s); (c) Schematic of the stress wave velocity tomography with a grayscale (highest to lowest velocity); (d) The corresponding stress wave velocity grid map (30 × 30 mm).
Additionally, we created a grayscale diagram of stress wave speeds, which clearly illustrated the variations in stress wave speeds across the cross-section of the trunk, complemented by the corresponding stress wave speed image grid (30 × 30 mm). This made the assessment of internal damage and its location more accurate. These results not only validated the effectiveness of stress wave imaging in palm health assessment but also provided important references for subsequent palm management and protection. By comparing cross-sectional observations and stress wave imaging, a more comprehensive understanding of the palm’s decay condition can be gained, thereby facilitating the formulation of more effective management strategies.
When comparing the range of stress wave speeds for decayed hollow palms (899 m/s to 1733 m/s) with that of healthy palms (864 m/s to 1651.7 m/s), it was found that the speeds of the decayed palms did not exhibit significantly lower values. This phenomenon can be explained from multiple perspectives. Firstly, it may result from differences in the quantity (area) and distribution of different stress wave speeds. The internal structure of decayed palms shows greater variability, with certain areas still maintaining relatively high stress wave speeds, which could elevate the overall speed range. For example, the density of the stem tissue in the center of a healthy trunk is significantly lower than that of the stem tissue surrounding the cortex, thus the attenuation of stress wave speeds in different regions of the cross-section can represent varying degrees and areas of decay, which is an important indicator.
Moreover, the distribution and variability of stress wave speeds are also crucial. Through the analysis of two-dimensional images and grid diagrams, we can more clearly observe the variations in stress wave speeds within the palm and reveal the health status of different areas. These illustrations help us understand the degree of decay in the palm and its impact on stress wave speeds, providing a more comprehensive assessment. However, relying solely on the numerical range of stress wave speeds to determine palm health is insufficient; it is essential to conduct a comprehensive analysis that combines data from two-dimensional images and grid diagrams to achieve more accurate conclusions. Furthermore, the results from acoustic 2D imaging may not be precise or practical enough, necessitating the use of other minimally destructive testing techniques to confirm the degree and location of decay.
3.6. Drilling Amplitude Analysis of Healthy Date Palms
In this study, Table 2 presents the drilling amplitude results of five healthy date palms at different orientations (north, south, west, and est), including percentage data for average drilling amplitude (ADA), maximum drilling amplitude (MDA), and minimum drilling amplitude (MIA). Overall, these data indicate that the palms exhibit a certain level of resistance during the drilling process, with an average drilling amplitude (ADA) of 25.90%, while the maximum drilling amplitude (MDA) is 57.19%. This suggests that the palms in certain locations have relatively strong resistance (amplitude), primarily observed near the xylem within the inner cortex close to the trunk’s periphery.
Table 2.
The drilling resistance amplitude (%) of undamaged living date palms (N = 5).
Specifically, the ADA values for the north orientation (N) range from 18.65% to 32.97%, showing variability among different palms. The average ADA for the south orientation (S) is 25.95%, which is relatively high, indicating that palms in this direction demonstrate stronger resistance during drilling. In contrast, the ADA values for the west (W) and east (E) orientations are lower, at 25.84% and 22.47%, respectively, which may be related to the palms’ growing environment or structural characteristics.
Additionally, the standard deviation (SD) data indicate the degree of variation in each orientation, with an ADA standard deviation of 5.96%, an MDA standard deviation of 13.25%, and an MIA standard deviation of 4.17%. This suggests that the MDA data exhibit greater variability, potentially reflecting differences in the internal structure of the palms. Overall, these results not only reveal significant variability in the drilling amplitudes of healthy date palms across different orientations but also provide important references for future palm health assessments.
Figure 5 illustrates the variation in drilling resistance amplitude profiles from the cortex to the center of the trunk in five healthy date palms. The results indicate a clear trend in amplitude changes between the cortex layer and the interior of the trunk. Starting from the cortex, the amplitude rapidly increases, reaching its peak in the outermost stem tissue portion of the trunk, which suggests that this area exhibits the strongest resistance. As one moves deeper into the trunk, the amplitude gradually decreases, indicating that the internal structure has relatively lower resistance.
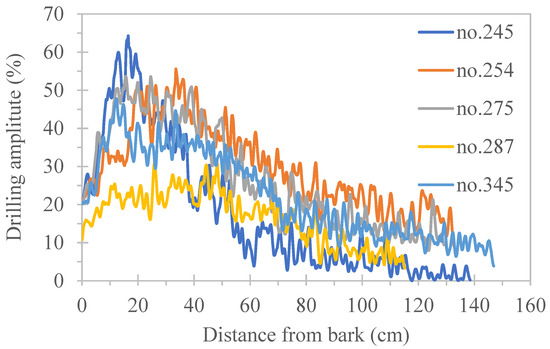
Figure 5.
The drilling amplitude profiles (east to west) to the center of the trunk of living date palms.
This pattern reflects the growth and structural characteristics of the palm. The outer stem tissue of the trunk (i.e., near the xylem just inward from the cortex) shows higher resistance due to its density and structural compactness. As one goes deeper into the trunk, the stem tissue structure may become looser or less dense, leading to a decrease in amplitude. This finding is significant for understanding the health status of the palm and its growing environment, and it can serve as a reference for future palm assessments and management.
3.7. Drilling Resistance Amplitude Analysis of Disc Testing
Table 3 presents the drilling resistance amplitude data for a healthy air-dried disc (No. 27) at different orientations (north, south, west, and east), including percentage data for average drilling resistance amplitude (ADA), maximum drilling resistance amplitude (MDA), and minimum drilling resistance amplitude (MIA). The data indicate that the ADA for the south orientation (S) is 33.68%, demonstrating that the palms in this direction exhibit the best resistance, while the ADA for the west (W) and east (E) orientations are 26.60% and 26.99%, respectively, which are relatively low.
Table 3.
The drilling resistance amplitude (%) to the center of the trunk of undamaged date palm discs (No. 27).
Overall, the average drilling resistance amplitude (ADA) is 28.66%, while the average maximum drilling resistance amplitude (MDA) is 60.10%. These data show that the palm’s outer structure exhibits higher strength in resisting external pressure, particularly in the outer stem tissue of the trunk (i.e., near the xylem just inward from the cortex) in the south orientation. In contrast, the average minimum drilling resistance amplitude (MIA) is 6.29%, indicating that the palm’s resistance is relatively weak in certain orientations.
It is noteworthy that these results are similar to the trend observed in the drilling amplitudes of the five standing trees as they move from the cortex toward the interior of the trunk, demonstrating the similarity between disc tests and standing tree tests. This suggests that the data from the disc can effectively reflect the structural characteristics and health status of the palm, providing valuable references for future palm health assessments. Additionally, the standard deviation (SD) data indicate the degree of variation among the orientations, with an ADA standard deviation of 3.36% and an MDA standard deviation of 8.81%, showing that there is a certain variability in resistance among different orientations, which may be related to the palm’s growing environment and structural characteristics.
There was a strong density variation in the cross-section, as indicated by the drilling profile results from the palm discs (see Figure 6). This variation reflects the changes in drilling amplitude from the cortex to the interior of the trunk, highlighting the structural differences within the palm stem tissue.
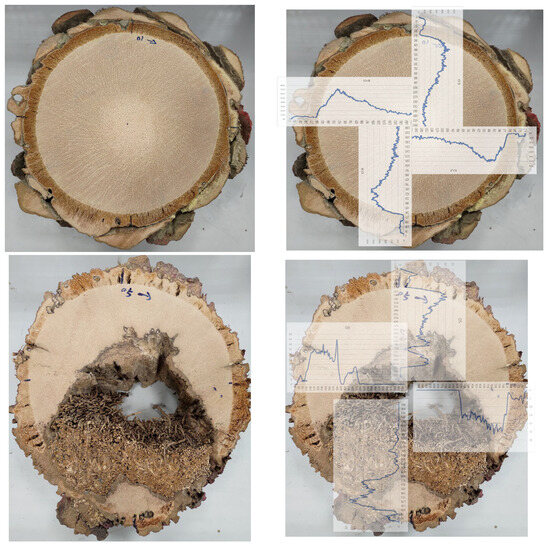
Figure 6.
The drilling resistance amplitude (%) of undamaged (No. 27) and decayed date palm discs (No. 78) in cross-sections.
Figure 6 presents the drilling resistance amplitude data for a healthy disc (No. 27) and a decayed disc (No. 78) in the trunk cross-section. The amplitude trend for the healthy disc (Figure 7) is similar to the results in Figure 5, showing a pattern where the amplitude rapidly increases from the cortex to the center of the trunk and then gradually decreases. This indicates that the outer resistance of the palm is stronger, while the internal structure’s resistance decreases as one moves deeper into the trunk.
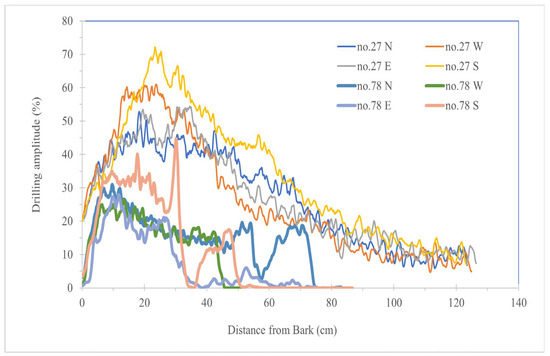
Figure 7.
Drilling amplitude profiles at the center of trunk cross-sections for a healthy date palm disc (No. 27) and a decayed, hollow date palm disc (No. 78).
In contrast, the data for the decayed disc show a significant decline in amplitude at the center of the trunk (Figure 6), especially in the decayed hollow areas, reflecting structural weakening or lower stem tissue density in that region, with resistance significantly lower than that of healthy stem tissue. This phenomenon emphasizes the impact of decay on palm structure and highlights the clear differences in physical properties between decayed and healthy stem tissue.
Additionally, at the junction between the decayed hollow and healthy stem tissue, a dark stem tissue band approximately 1–2 mm wide appears, accompanied by higher amplitude resistance. This may represent an adaptive growth phenomenon of the palm in response to the challenges posed by decay. Overall, the results in Figure 6 not only illustrate the significant differences in amplitude between healthy and decayed discs but also provide insights into how palms respond to external challenges through structural variations, which is crucial for understanding the health status and growth adaptability of palms.
4. Discussion
4.1. Methods
This study used grayscale 2D stress wave velocity imaging and grid maps to improve internal damage assessment in palms. While acoustic tomography helps detect basal stem rot in oil palms [7,16], its accuracy is limited, especially with aerial roots affecting imaging. To address this, drilling resistance testing was combined with acoustic tomography to better identify decay and hollowness. Effective techniques, such as ultrasonic tomography and drilling resistance, have been used for royal palms (Roystonea regia) to assess stem tissue density, moisture, and deterioration [5,6].
Tree assessment methods generally include visual tree assessment (VTA) and non-destructive testing (NDT). VTA primarily relies on external visual inspection to assess tree health, while NDT employs instruments to measure internal conditions. Indeed, some scholars believe that the VTA system includes NDT (instrumental inspection), while others consider VTA and NDT as two separate components (VTA + NDT). In general, NDT or instrumental inspection is considered a more advanced tree assessment method that may complement VTA or provide a more in-depth examination of the internal condition of trees. However, since NDT inspections may cause minor damage to trees, they do not strictly meet the definition of ’non-destructive technology’. Therefore, some researchers refer to such methods as minimally invasive technologies (MIT). In this study, stress wave velocity 2D imaging and drilling resistance amplitude were used to assess the internal condition of palm trunks, and these methods may cause slight damage to the palms. Therefore, this study adopts the concept of MIT to distinguish between VTA and the methods used in this research.
Acoustic tomography is a well-known method in urban tree studies. However, reports that combine this technique with other instruments for internal stem inspection are relatively few. Specifically, studies focusing on risk assessment for Phoenix dactylifera (Date Palm), a species of the Arecaceae family, are limited due to its distinct growth characteristics compared to typical tree species. Furthermore, the inspection of street trees is less common, as the environmental conditions of street trees differ significantly from those in forests or landscaped areas. Lastly, Phoenix dactylifera, which grows aerial roots, may exhibit unique characteristics compared to other tree species. These specific factors make the combination of acoustic tomography particularly valuable for risk assessment. The integration of these elements provides a new perspective and highlights the innovative contribution of this study to the field.
In this study, a visual inspection for defects was conducted, and the internal condition of the palms was assessed using acoustic imaging and drilling resistance methods. The phenomena of aerial root growth and stem tissue variation were investigated, providing references for assessing palm health risks.
4.2. Findings
Date palm, although belonging to the Arecaceae (palm family), differs structurally from typical trees but is still considered a tree in ecological systems and management. Additionally, its trunk consists of fibrous woody tissue, giving it potential utilization as wood, thus it can be broadly referred to as timber. This study employs acoustic tomography and drilling resistance testing to assess its internal condition, contributing to research on risk assessment for palm species. Due to its unique growth form compared to traditional trees, risk assessment methods may require adjustments. The findings of this study help optimize evaluation strategies and provide a reference for future management of street trees and palm species.
This study focuses on ornamental trees in urban environments, significantly contributing to urban forestry and tree health, which are vital for ecological studies. While the limited number of tested trees was due to logistical constraints, this sample was selected for detailed analysis, providing practical applications for tree management. We recognize the need for reference sites and will incorporate the relevant literature from similar urban studies to contextualize our findings. Local studies are essential for understanding specific environmental challenges and offer insights applicable to other urban settings. Future research will expand to include additional cities and a larger sample size, enhancing the international applicability of our findings.
This study examined date palm (Phoenix dactylifera) street trees in Pingtung, Taiwan, where nearly all exhibited aerial roots are below 1.3 m. These roots, linked to trunk deformation, may have resulted from improper irrigation, as excessive moisture can cause vertical trunk splitting; fungal infections; and pseudo-bark erosion [13]. Aerial roots aid root system expansion and water absorption, but their excessive growth—potentially extending up to ten feet—primarily affects appearance rather than structural integrity [1,2]. In Taiwan, date palms were watered twice weekly via overhead irrigation at 1.3 m, possibly triggering aerial root development as a survival response to moisture stress or trunk damage. The phenomenon of aerial root growth on the outer side of the trunk is presumed to be a growth response of the palm to adapt to environmental changes.
Trunk deformation was observed in 97% of affected palms, mostly in the lower third (58%). Spray and drip irrigation were identified as key factors, causing trunk expansion rates of 3.5 cm and 3.3 cm per year, respectively. Such deformations impact aesthetics and may affect palm health. Proper irrigation management is crucial to minimizing damage and ensuring the healthy growth of date palms [14].
In this study, there was a strong density variation in the cross-section, as indicated by the drilling profile results from the palms. This variation reflects the changes in drilling amplitude from the cortex to the interior of the trunk, highlighting the structural differences within the palm stem tissue. These patterns align with the drilling resistance trends observed in this study.
The wood density of oil palm (Elaeis guineensis) decreases from the outer edge (222–417 kg/m3) to the center, as vascular bundle density declines from about 30% to 14% [17,18]. Similarly, the royal palm (Roystonea regis) has a high-density outer cortex, while the inner trunk remains low-density [6,19,20]. Wood density peaks 5–10 mm from the bark, then gradually decreases towards the center [21]. All properties (density of wood, frequency of vascular bundles, and mechanical properties) increase with the radial distance from the inner to the outer zone of the trunk. The properties of density and strength also decrease from the bottom to the top of the trunk. The density for coconut, oil palm, and date palm ranged from low to high density with 0.41–1.11, 0.14–0.90, and 0.30–0.68 g/cm3, respectively [22].
4.3. Importance and Development
A dark stem tissue band forms at the junction of decayed and healthy stem tissue, showing higher resistance amplitude, likely as an adaptive response to decay. The distinct dark stem tissue band between the decayed and sound stem tissue in the cross-section is likely a result of stem tissue variation. Palms may resist decay through robust vascular bundles but lack CODIT-like compartmentalization [23]. Trees adapt structurally through reaction growth, producing new wood—such as reaction, flexure, and wound wood—to compensate for damage and stress [24]. Further research is needed on cortex immunity and endophytic fungi. Additionally, the role of radial and axial parenchyma (RAP) in fungal defense has been explored, showing that RAP’s compartmentalization and active response form a protective boundary, with living parenchyma and heartwood playing key roles [25,26].
The correlation between stress wave imaging and drilling resistance data presents an opportunity for future exploration. Overlapping and comparing these two datasets could provide deeper insights into the relationships between velocity measurements and resistance values. This analysis may enhance our understanding of palm structural integrity and improve risk assessment methodologies. Future studies should focus on developing a robust framework for integrating these data types, enabling a comprehensive evaluation of decay and void locations within the palm.
In practical palm management, it is essential to consider multiple aspects comprehensively. Firstly, regarding water management, it is important to ensure that irrigation water is supplied from the ground rather than around the palm trunk to avoid water accumulation at the root zone, which can lead to the formation of air roots. Air roots not only affect palm stability but can also harm the overall health of the palm. To prevent such issues, regular checks of the palm’s growing environment should be conducted to ensure proper soil drainage and to avoid over-watering.
Additionally, based on visual palm hazard assessments, attention should be given to issues such as palm tilting, insect infestations, rot, cavities, and dead tops, as these are defects that may threaten the structural safety of the palm. When these defects are identified, immediate preventive measures should be taken. If internal decay or cavities are detected, minimally invasive techniques should be considered for inspecting the internal condition of the trunk to minimize damage to the palm. Moreover, the environment and management of street trees should be better planned, with proper spacing, soil compaction prevention, and water accumulation management to ensure the healthy growth of palms.
Lastly, tree risk assessments should establish systematic evaluation methods to promptly identify and address potential risks that could threaten palm safety. Such risk assessments will assist palm managers in making more accurate decisions and reduce potential risks posed by palms. This not only helps improve palm management efficiency but also ensures public safety.
However, these assessments may still be influenced by multiple factors, including the palm’s own cellular structure, physiological characteristics, self-weight, gravity, moisture distribution, growth stress, environmental changes, and the limitations of the techniques used. Further exploration is still needed in the future.
5. Conclusions
This study conducted a health risk assessment of the date palm with aerial roots growing around its trunk. The results showed that the visual inspection revealed significant external defects in the palm, including leaning, insect damage, decay, and hollowness. The phenomenon of aerial root growth on the outer side of the trunk is presumed to be a growth response of the palm to adapt to environmental changes, while the distinct dark stem tissue band between the decayed and sound stem tissue in the cross-section is likely a result of stem tissue variation. The application of stress wave velocity 2D imaging technology on undamaged and decayed hollow palms confirmed the variability of the internal structure of the trunk and indicated the location of deteriorated stem tissue through the stress wave velocity grid chart. However, this method still requires further improvement in both accuracy and practicality. Coupled with drilling resistance tests, the results indicated significant variation in resistance amplitude of healthy palms in different orientations. From the cortex to the center of the trunk, the drilling amplitude sharply increased to the xylem and then gradually decreased. The detection results for decayed hollow trunks reflected the degree of amplitude decrease and its location. These findings provide a scientific basis for palm management and have significant implications on an international scale, as they can help improve health monitoring and management strategies for urban palms.
Author Contributions
P.-H.P. and C.-Y.C. contributed to the preparation of experimental materials, conducted the experiments, and analyzed the data. C.-J.L. proposed the research idea and the experimental framework and wrote the manuscript. All authors have read and agreed to the published version of the manuscript.
Funding
This work was supported by the Taiwan Forestry Research Institute and Tung-Hai University Tree Inspection Project [No. 114GT744A01 and No. Q11300033]. This study was financially supported by the Science and Technology Project of the Taiwan Forestry Research Institute, and we are gratefully acknowledged.
Data Availability Statement
The date palms detection dataset used in this study is confidential but can be made available by the corresponding author upon reasonable request after the article is published online.
Conflicts of Interest
The authors declare that there are no competing interests.
References
- Kirschner, G.K.; Xiao, T.T.; Blilou, I. Rooting in the Desert: A Developmental Overview on Desert Plants. Genes 2021, 12, 709. [Google Scholar] [CrossRef] [PubMed]
- Schuch, U.K.; Quist, T.M. Arizona Landscape Palms and Their Management. Cooperative Extension; University of Arizona: Tucson, AZ, USA, 2023; Available online: http://hdl.handle.net/10150/671215 (accessed on 11 February 2025).
- Linhares, C.S.F.; Gonçalves, R.; Martins, L.M.; Knapic, S. Structural Stability of Urban Trees Using Visual and Instrumental Techniques: A Review. Forests 2021, 12, 1752. [Google Scholar] [CrossRef]
- Nocetti, M.; Brunetti, M. Advancements in Wood Quality Assessment: Standing Tree Visual Evaluation—A Review. Forests 2024, 15, 943. [Google Scholar] [CrossRef]
- Lin, C.J.; Chang, T.T.; Juan, M.Y.; Lin, T.T. Detection deterioration in royal palm (Roystonea regia) using ultrasonic tomographic and resistance microdrilling techniques. J. Trop. Forest Sci. 2011, 23, 230–270. [Google Scholar]
- Lin, C.J.; Yang, T.H. Detection of acoustic velocity and electrical resistance tomographies for evaluation of peripheral-inner wood demarcation in urban royal palms. Urban For. Urban Green. 2015, 14, 583–589. Available online: www.elsevier.com/locate/ufug (accessed on 11 February 2025). [CrossRef]
- Ishaq, I.; Alias, M.S.; Kadir, J.; Kasawani, I. Detection of basal stem rot disease at oil palm plantations using sonic tomography. J. Sustain. Sci. Manag. 2014, 9, 52–57. [Google Scholar]
- Son, J.; Kim, S.; Shin, J.; Lee, G.; Kim, H. Reliability of nondestructive sonic tomography for detection of defects in old Zelkova serrata (Thunb.) Makino trees. Forest Sci. Technol. 2021, 17, 110–118. [Google Scholar] [CrossRef]
- Downes, G.M.; Lausberg, M.; Potts, B.M.; Pilbeam, D.L.; Bird, M.; Bradshaw, B. Application of the IML Resistograph to the infield assessment of basic density in plantation eucalypts. Aust. For. 2018, 81, 177–185. [Google Scholar] [CrossRef]
- Fundova, I.; Funda, T.; Wu, H.X. Non-destructive wood density assessment of Scots pine (Pinus sylvestris L.) using resistograph and Pilodyn. PLoS ONE 2018, 13, e0204518. [Google Scholar] [CrossRef]
- Sharapov, E.; Brischke, C.; Militz, H.; Smirnova, E. Effects of white rot and brown rot on the drilling resistance measurements in wood. Holzforschung 2018, 72, 905–913. [Google Scholar] [CrossRef]
- Sharapov, E.; Brischke, C.; Militz, H. Assessment of preservative- treated wooden poles using drilling-resistance measurements. Forests 2020, 11, 20. [Google Scholar] [CrossRef]
- Al-Mana, F.A.; Ahmad, Y.A. Case study on the trunk’s deformity of date palm trees used in street landscape in Riyadh, Saudi Arabia. Am.-Eurasian J. Agric. Environ. Sci. 2010, 8, 67–72. [Google Scholar] [CrossRef]
- Al-Sulbi, A.O. Date palm (Phoenix dactylifera) trunk deformation in public landscaping: Causes and categorization. Landsc. Online 2019, 65, 1–12. [Google Scholar] [CrossRef]
- Fakopp Enterprise Bt. FAKOPP Manual for the ArborSonic 3D Acoustic Tomography. User’s Manual v6.5; Fakopp Enterprise Bt.: Agfalva, Hungary, 2020; 63p. [Google Scholar]
- Michael, M.L.; Cheong, S.Y.; Janaun, J.; Phin, C.K.; Dayou, J. A Short Report on Application of Acoustic Tomography for Basal Stem Rot Disease Severity Assessment in Oil Palm. Plant. Kuala Lumpur 2021, 97, 465–476. [Google Scholar]
- Srivaro, S.; Matan, N.; Lam, F. Property gradients in oil palm trunk (Elaeis guineensis). J. Wood Sci. 2018, 64, 709–719. [Google Scholar] [CrossRef]
- Ramle, S.F.M.; Sulaiman, O.; Hashim, R.; Arai, T.; Kosugi, A.; Abe, H.; Murata, Y.; Mori, Y. Parenchyma and vascular of Oil Palm. Lignocellulose 2012, 1, 33–44. [Google Scholar]
- Rinn, F. Detecting Fungal Decay in Palm Stems by Resistance Drilling. Fla. Arborist 2013, 1, 10–17. [Google Scholar]
- Rinn, F. Shell-wall thickness and breaking safety of mature trees. West. Arborist 2013, 39, 14–18. [Google Scholar]
- Huang, Y.H.; Chung, C.H.; Wu, M.L.; Lin, C.J. Stress Wave Tomogram and Wood Density Profile in a Royal Palm Tree: A Case Study. Taiwan J. Forest Sci. 2013, 28, 129–144. [Google Scholar]
- Fathi, L. Structural and Mechanical Properties of the Wood from Coconut Palms, Oil Palms and Date Palms. Ph.D. Thesis, Universität Hamburg, Hamburg, Germany, 2014; p. 174. [Google Scholar]
- Lilly, S.; Bassett, C.G.; Komen, J.; Purcell, L. Arborists’ Certification Study Guide, 4th ed.; International Society of Arboriculture (ISA): Champaign, IL, USA, 2022; p. 200. [Google Scholar]
- Dunster, J.A.; Smiley, E.T.; Matheny, N.; Lilly, S. Tree Risk Assessment Manual, 2nd ed.; International Society of Arboriculture: Champaign, IL, USA, 2017; p. 200. [Google Scholar]
- Morris, H.; Brodersen, C.; Schwarze, F.W.M.R.; Jansen, S. The parenchyma of secondary xylem and its critical role in tree defense against fungal decay in relation to the CODIT model. Front. Plant Sci. 2016, 7, 1665. [Google Scholar] [CrossRef]
- Morris1, H.; Hietala, A.M.; Jansen, S.; Ribera, J.; Rosner, S.; Salmeia, K.A.; Schwarze, F.W.M.R. Review: Part of the focus issueon plant defence and stress response. Using the CODIT model to explain secondary metabolites of xylem in defence systems of temperate trees against decay fungi. Ann. Bot. 2020, 125, 701–720. [Google Scholar] [CrossRef]


Disclaimer/Publisher’s Note: The statements, opinions and data contained in all publications are solely those of the individual author(s) and contributor(s) and not of MDPI and/or the editor(s). MDPI and/or the editor(s) disclaim responsibility for any injury to people or property resulting from any ideas, methods, instructions or products referred to in the content. |
© 2025 by the authors. Licensee MDPI, Basel, Switzerland. This article is an open access article distributed under the terms and conditions of the Creative Commons Attribution (CC BY) license (https://creativecommons.org/licenses/by/4.0/).