Abstract
Young forest stands from natural regeneration are characterized by high competitive pressure and dynamic changes over time, especially in the initial growth stages. Despite their increasing area in the temperate zone, they have received significantly less scientific attention than old forest stands. Therefore, our research was conducted on young, over-dense European beech (Fagus sylvatica L.) forest originating from natural regeneration, grown in central Slovakia, Western Carpathians. Repeated measurements of tree height and stem diameter measured on the base within a beech stand revealed significant temporal changes in their relationship. Over 16 years, height increased more than stem diameter. Both Lorey’s height and mean diameter d0 showed continuous growth, with Lorey’s height increasing 3.5-fold and mean diameter increasing 2.8-fold. The height-to-diameter ratio increased until stand age 15, then briefly declined before rising again. Stand density decreased over time, with the sharpest decline occurring between ages 15 and 16 (dropping from 843 to 599 trees per 100 m2). Mortality rates peaked at age 16, with an average annual rate of 9.4% over the entire observation period (2008–2023). Specific leaf area (SLA) was negatively related to tree size, and its value was smaller in 10- than in 20-year-old stands. The increase in SLA was driven by greater leaf area relative to leaf weight. Additionally, allometric relationships showed that branch and leaf contributions to aboveground biomass decreased with tree size within the stand but were greater in the older stand than in the younger growth stage. Estimated aboveground biomass was 667 ± 175 kg per 100 m2 in the 10-year-old stand and 1574 ± 382 kg per 100 m2 in the 20-year-old stand, with stems contributing the majority of biomass. Leaf Area Index (LAI) remained similar across both stand ages, while the Leaf Area Ratio (LAR) was nearly twice as high in the younger stand. These findings highlight dynamic shifts in beech stand structure, biomass allocation, and leaf traits over time, reflecting growth patterns and competition effects. The outputs indicate that competition in young forest stands is a dominant force in tree mortality. Understanding key interactions in young stands is crucial for sustainable forest management, as these interactions influence long-term stand stability and ecosystem functions.
1. Introduction
The European beech (Fagus sylvatica L.) is one of the most common tree species in Europe and is highly significant for both ecological and economic purposes [1]. The species is widespread across nearly all European countries, except for the central and southern parts of the Pyrenean Peninsula, the majority of Scandinavia, and the territories of the former Soviet Union. The European beech is not particularly sensitive to soil conditions and can grow in a wide variety of soils with a broad range of pH levels, although it does not grow well in very acidic soils [2].
The European beech tolerates very shady environments, facilitating its natural regeneration in silvicultural systems with continuous crown coverage [1]. Hence, beech seedlings can survive and successfully grow beneath the canopy of the parent stand [3]. The ability of beech trees, especially in their early growth stages, to survive under low-light conditions is associated, among other factors, with their pronounced morphological plasticity [4]. Examples of this plasticity include modifications in height and diameter growth [5], crown shape [6], foliage traits [7], and in biomass allocation among the tree components [8].
Beech trees can grow under intense competition stress, whether intra- or interspecific [9]. This stress affects their growth, productivity, and qualitative properties such as the structure of biomass [10]. High levels of competition stress are particularly typical in young, dense beech stands that originate from natural regeneration without any silvicultural interventions, such as thinning [11]. Notably, the initial number of beech trees per hectare in planted stands typically consists of a few thousand individuals [12]. In contrast, naturally regenerated stands can contain tens of thousands, or even exceed one hundred thousand, individuals per hectare [13].
One of the key responses to competition stress, primarily influenced by light availability, is the modification of foliage traits. Among these traits, leaf area and weight are the most accessible and commonly studied, both at the individual tree and stand levels. Many researchers have employed the metric known as specific leaf area (SLA), which represents the ratio of leaf area to leaf dry mass [14,15,16]. In forest stands, light availability, especially in areas with a closed canopy, is often influenced by the tree’s position within the canopy and along the vertical profile of the crown. Our earlier research [13] on young trees of four broadleaved species in a temperate forest revealed that SLA values varied within the stand, depending on tree size and crown position. This finding suggested that foliage mass density decreases as light intensity diminishes, aligning with observations from Poorter et al. [17].
It is generally known that tree foliage plays a critical role in growth and development as it serves as the principal photosynthetic organ [18]. Moreover, foliage is extremely important for biochemical cycles, including the carbon cycle [19]. For photosynthesis, the surface area of the leaf is decisive; therefore, from a physiological perspective, leaf area is more relevant than leaf mass. Leaf area can be expressed at the tree level, stand level, or in relative terms, such as Leaf Area Index (LAI). The LAI is defined as half of the total leaf surface area per unit of ground area and plays a critical role in ecological and agricultural research [20]. In fact, foliage intercepts photons and serves as a source or sink for the transfer of energy, carbon, and water vapor between forest ecosystems and the atmosphere [21]. Therefore, the LAI is commonly used in both empirical studies (e.g., [22]) and modeling-based (theoretical) physiological research [23]. Moreover, long-term measurements of the LAI are highly significant for studying climate change and a variety of ecosystems growth, and it can also serve as a potential indicator of ecosystem services [24].
In young forest stands, where the number of trees exceeds one individual per square meter, the value of the LAI reflects a combination of tree density and the total leaf area of the individual trees. Simultaneously, as tree density decreases during stand development, the total foliage area per tree tends to increase. Hence, it is challenging to predict the trend of the LAI during stand development, especially in young, very dense stands, which are typical in the case of naturally regenerated forest stands [25]. Therefore, changes in the LAI in young stands, specifically those of European beech originating from natural regeneration, have become a focus of our research interests. In fact, although there are many field measurement and remote sensing estimation methods, most of them introduce uncertainties [20].
The main objectives of this work were as follows:
- (a)
- To study patterns in the long-term development of a dense beech stand originating from natural regeneration, focusing on key characteristics such as stand density, mean height, and mean diameter;
- (b)
- To observe tree mortality and mortality rate over time;
- (c)
- To develop stand-specific allometric models at two time points separated by a 10-year interval;
- (d)
- To quantify changes in biomass structure over the 10-year period;
- (e)
- To investigate leaf traits, with a particular emphasis on specific leaf area (SLA);
- (f)
- To compare the Leaf Area Index (LAI) and Leaf Area Ratio (LAR) between the two time points;
- (g)
- To examine how changes in these attributes are associated with increasing competition stress in young, naturally based European beech stands.
2. Materials and Methods
2.1. Site and Stand Conditions
Our research activities focused on the study site Vrchslatina (48°38′ N, 19°36′ E), located in central Slovakia on the border of the Detva and Brezno districts, about 15 km northeast of the town of Hriňová. The site is situated at an altitude of approximately 970 m a.s.l. and is owned by the Forests of the Slovak Republic, Forest Enterprise in Kriváň, Poľana Forest District. The site lies within the geomorphological unit of the Veporské Hills, specifically in the Sihlianska Plateau subunit. This subunit comprises mainly of porphyritic granodiorites, biotite tonalites, and granites, with prevailing cambisols derived from the parent material.
Aerial photographs (see [26]) indicate that in 2002, only a few mature trees remained on the site, and by 2006, no mature trees were left. We estimated that the beech trees in 2008 were approximately seven years old, based on their size and the assumption that seedlings likely emerged in 2002. This assumption was further supported by the fact that 2001 was characterized by a rich beech mast year. In the first year of our study, i.e., 2008, young beech stands had not yet fully covered the area, with a few gaps among the forest complexes occupied by grass communities dominated by bush grass (Calamagrostis epigejos L. Roth). However, all our measurements and sampling were conducted in the compact areas of young beech complexes.
2.2. Tree Measurements and Samplings
In the autumn of 2008, five circular plots were established in the selected beech stand. Each plot had a radius of 1.0 m and included at least 40 trees. All trees within the plots were labeled, and tree height and diameter at the stem base (hereinafter referred to as d0) were recorded. We used stem diameter d0_instead of the conventional DBH (i.e., measured at 130 cm from ground level) since not all trees reached a height of 1.3 m. Tree heights were measured with a wooden measuring rod (±1 cm), and trunk thickness was measured with a digital micrometer (±0.1 mm). Each stem diameter was measured twice in two perpendicular directions. These measurements were taken annually in early spring over 16 consecutive years (from 2008 to 2023).
In addition to the annual tree measurements, two tree samplings were conducted in the second half of the growing season—specifically in 2011 (for the 10-year-old stand) and in 2021 (for the 20-year-old stand). In 2011, 60 randomly selected beech trees were sampled outside the circular plots to prevent altering their conditions while ensuring an equal distribution (one quarter of individuals) among overtopped, intermediate, codominant, and dominant individuals. The second sampling in 2021 involved 40 beeches selected using the same method as the first sampling. The selected trees were felled using a chainsaw. The stem diameter d0 and height of the sampled trees were measured (see Table 1), and the trees were packed into paper bags and transported to the laboratory.

Table 1.
Descriptive statistical characteristics of tree height (in m) and stem diameter (d0 in mm) in a young European beech stand at the Vrchslatina research site, Western Carpathians (2011 and 2021).
In the laboratory, branches were cut off from the stems, and leaves were manually separated from the branches, resulting in three aboveground components: leaves, branches, and stems. Fifteen leaves were selected from each sampled tree along the vertical crown profile, individually scanned, and archived in TIFF format. Leaf area was then quantified using the Easy Leaf Area software, version 1.0 (see also Easlon and Bloom [27]). Afterwards, each leaf was oven-dried at 90 °C for 24 h and weighed on a laboratory scale with a precision of ±0.001 g. The remaining leaves were oven-dried and weighed using the same method as the subsamples. Stems and branches were separately oven-dried at 105 °C for 4–5 days and then weighed (precision of ±0.1 g).
2.3. Calculations, Analyses, and Statistical Approaches
The dependence of height on stem diameter d0 for the entire set of measured trees in the years 2011 and 2021 was expressed using the regression equation of the form
The regression coefficients b0, b1, b2, and their standard error (S.E.), p-value (p), coefficient of determination (R2), and mean square error (MSE) were calculated.
For each tree, i.e., 60 sample trees in the first harvest and 40 sample trees in the second harvest, a sample of fifteen leaves was taken. Hence, the number of scanned leaves was 600 and 450 pieces in the first and second samplings, respectively, representing the minimum statistical set required to obtain reliable results at the stand level. Then, the average leaf mass (LM), average leaf area (LA), and average specific leaf area (SLA) were calculated. The calculated average values served as input data for deriving the dependence of LM, LA, and SLA on stem diameter d0. This dependence was expressed using a power function of the form
where the dependent variable Y is LM, LA, or SLA, and the independent variable X is the stem diameter d0.
Allometric equations for calculating the dry biomass of individual tree components were constructed for the predictor diameter d0, Equation (3), and tree height, Equation (4), as well as for their combination, Equation (5), separately for the tree samplings in 2011 and 2021. The equations take the forms
where b0, b1, and b2 are regression coefficients, and λ is the correction factor. Their derivation is described in detail in the work of Pajtík et al. [28]. The allometric equations were derived for calculating the dry biomass of the stem, branches, and foliage. Then, the dry aboveground biomass was calculated as their sum.
The Leaf Area Index (LAI) for trees growing in the subplot is calculated as the ratio of the sum of the leaf areas of individual trees in the subplot to the area of the subplot, according to the formula
where
- LAij is the leaf area of the i-th tree in the j-th subplot, which is calculated as the product of the dry biomass of the leaves of the given tree and its specific leaf area derived depending on the diameter d0, i.e.,
- Wl is the leaf biomass;
- Sj is the area of the j-th subplot.
The Leaf Area Ratio (LAR) is defined as the ratio of leaf area to the dry aboveground biomass of the tree:
where
- TPLA is the total projected leaf area of all leaves of the trees present in the plot (tree projected leaf area);
- Wl is the dry biomass of tree leaves in the plot;
- Ww is the dry aboveground biomass of trees in the plot;
- SLAp is the mean one-sided specific leaf area, which expresses how much one-sided leaf area corresponds to one gram of dry leaf mass.
Here, we would like to explain why we used the are (i.e., 100 m2) as the basis for our calculations instead of the generally preferred hectare. The reason is that our plots had small areas (3.14 m2); therefore, converting to hectares would involve too large a scale-up.
Data archiving and processing were conducted using MS Excel and MS Access. Statistical analyses, including a one-way ANOVA (p < 0.001), were carried out using Statistica 10.0.
3. Results
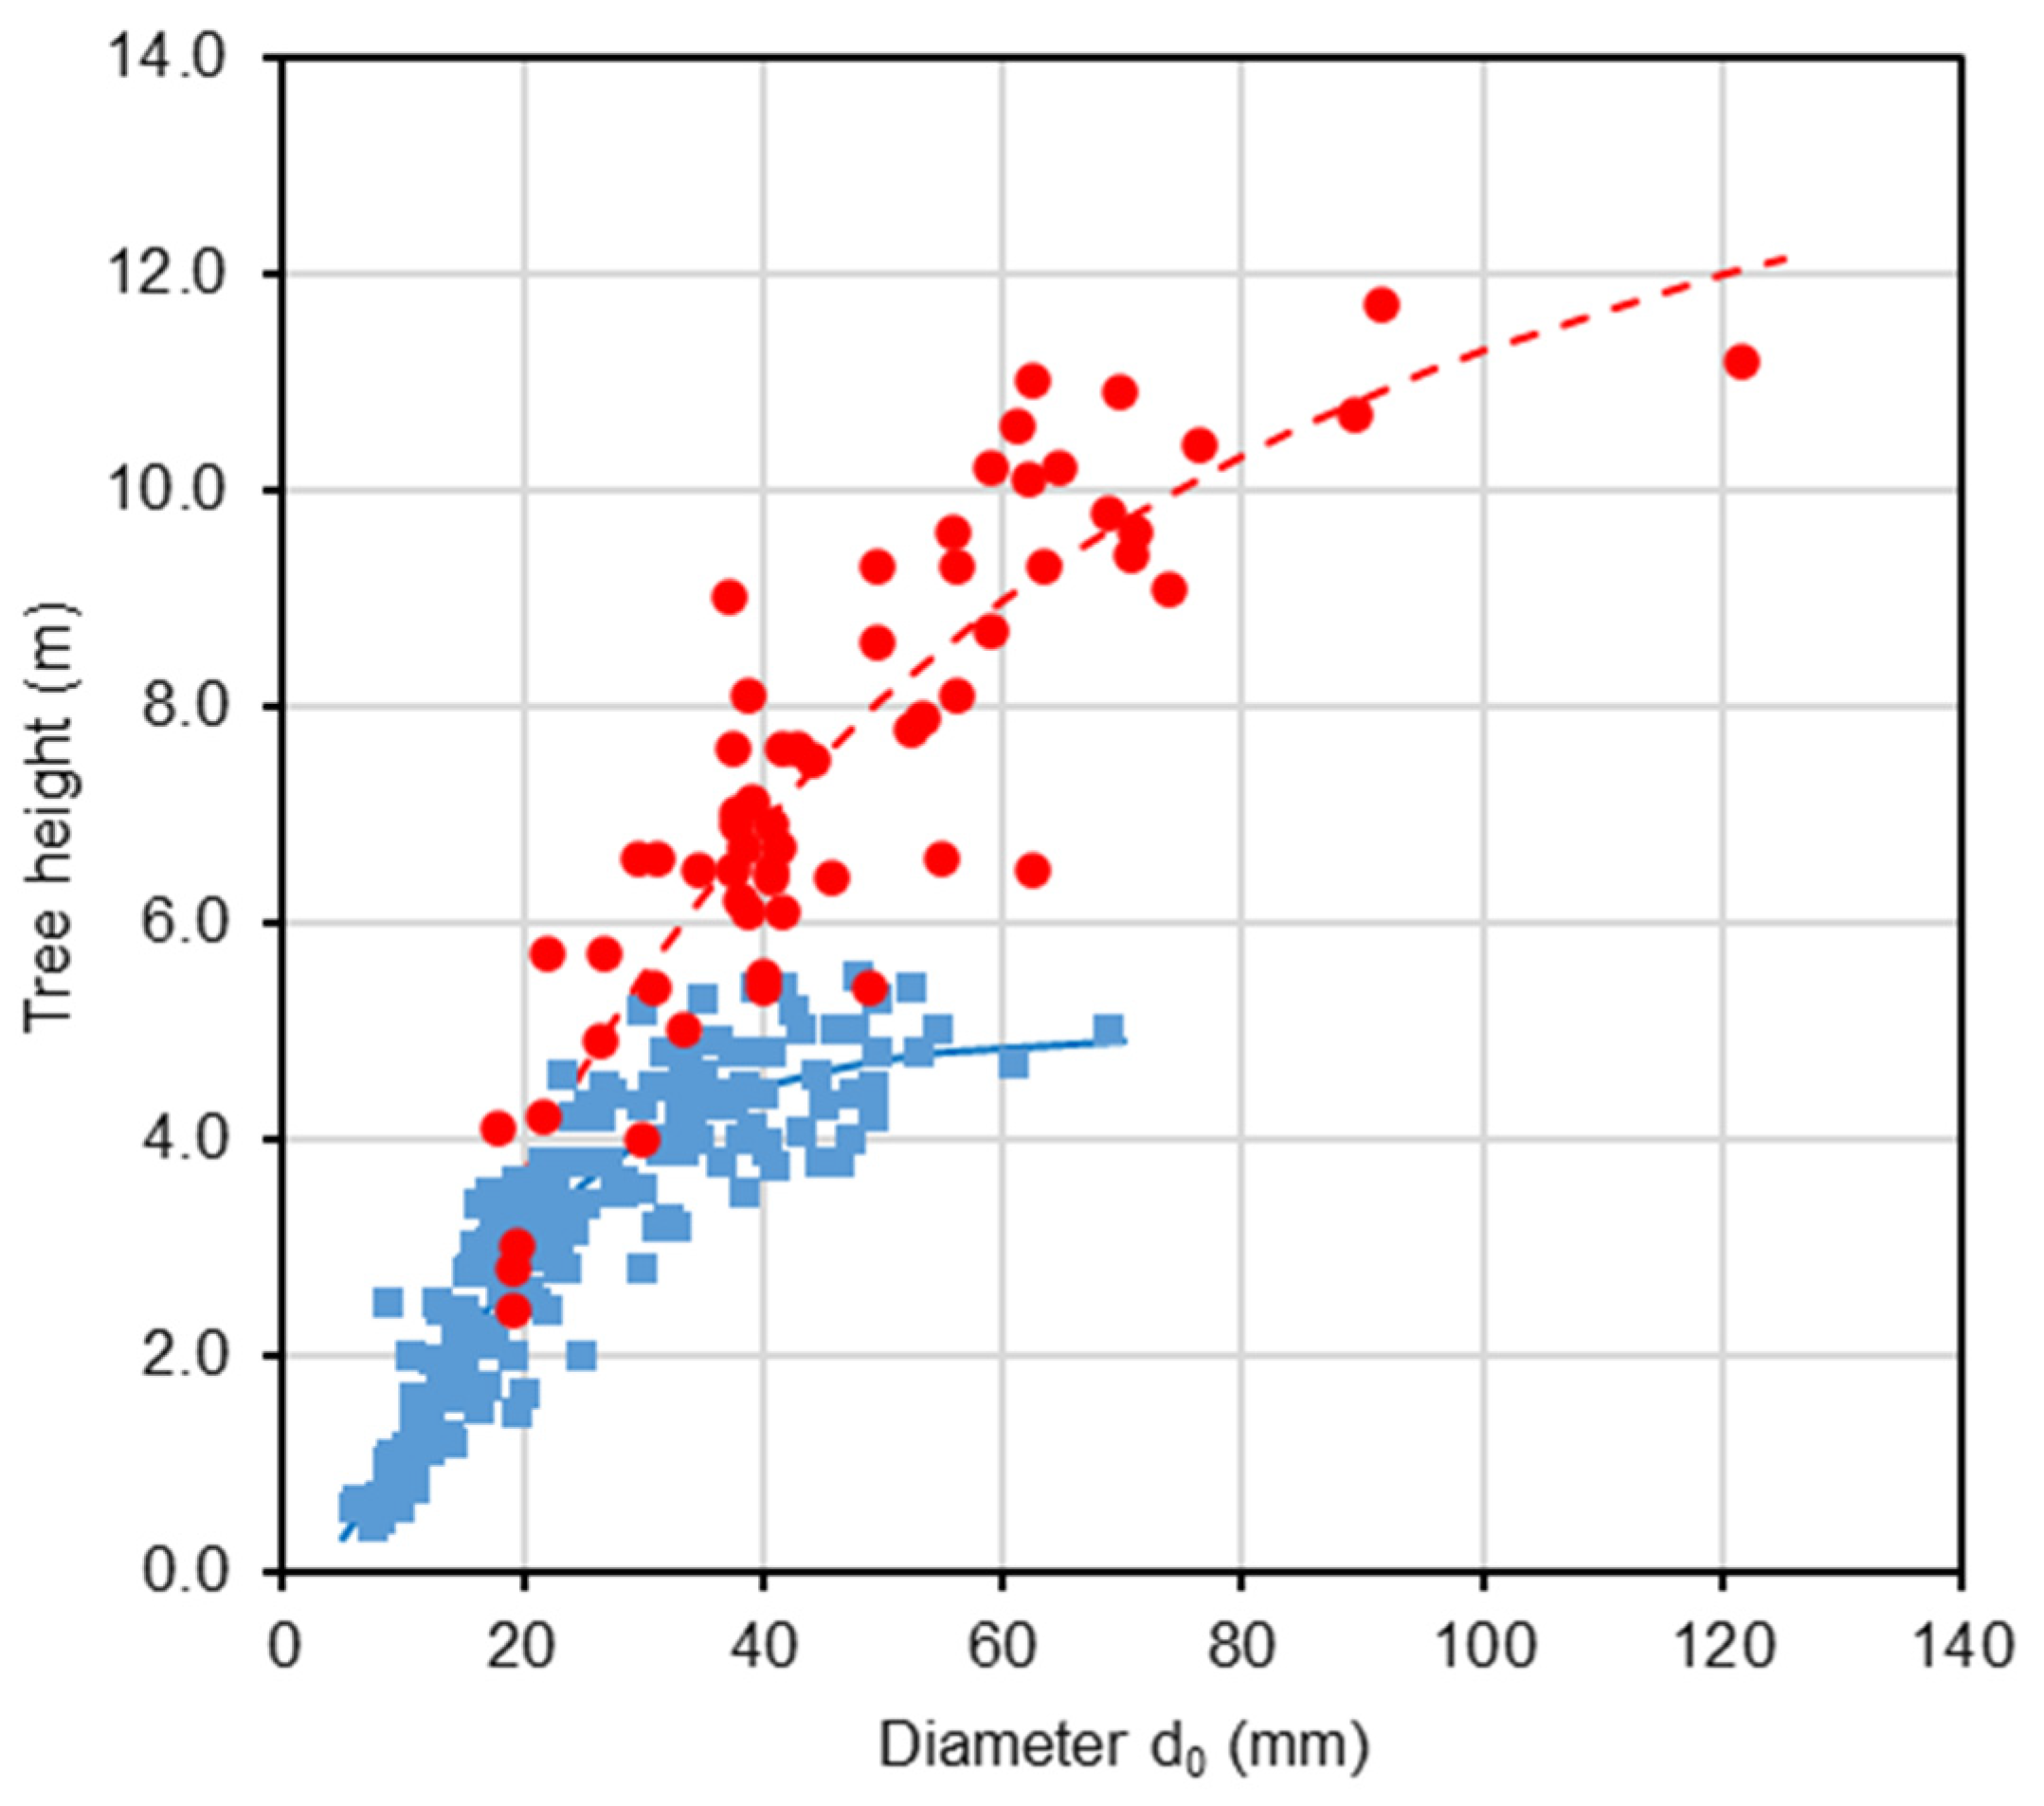
The analysis of tree height and stem diameter d0 revealed that, in both harvest years, the sampled trees effectively represented the stands across the full range of these variables (Table 1). Our repeated measurements of tree height and diameter d0 within the beech stand in 2011 and 2021 indicated that the relationship between these two variables changed over time (Figure 1; Table 2). Most trees over the decade showed a greater relative increase in height than in diameter. As a result, taller trees in 2021 had the same diameter as they did in 2011 (see individuals with reference diameters from 20 to 60 mm in Figure 1). Furthermore, the repeated measurements showed a continuous increase in both Lorey’s height (i.e., a measure of average stand height that is weighted by basal area) and mean stand diameter d0 (Figure 2). Over 16 years, Lorey’s height increased by a factor of 3.5 (from 2.6 m to 9.1 m), while the mean diameter increased by a factor of 2.8 (from 19 mm to 54 mm). The ratio between tree height and diameter d0 increased steadily until the age of 15 years (0.17 m mm−1), then briefly decreased before increasing again. Regarding stand density, the number of trees continuously declined, with a particularly sharp decrease occurring between the ages of 15 and 16 years (from 843 to 599 individuals per 100 m2).

Figure 1.
Relationship (see Equation (1)) between stem diameter d0 and tree height in 2011 (blue color) and 2021 (red color) in young European beech stand at the Vrchslatina research site, Western Carpathians.
Table 2.
Dependence of tree height on stem diameter d0 in 2011 and 2021. Regression coefficients b0, b1, and b2, their standard error (S.E.), p-value (p), coefficient of determination (R2), and mean squared error (MSE) for Equation (1).
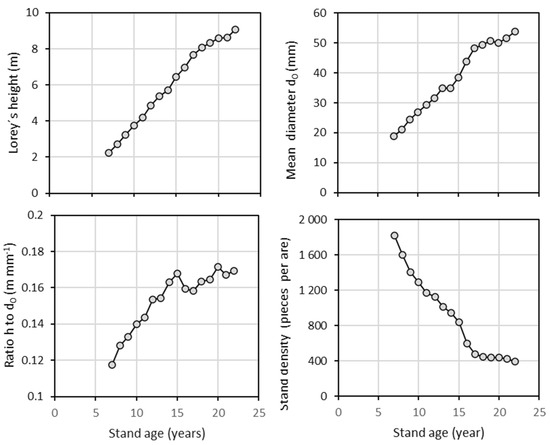
Figure 2.
Development of Lorey’s height, mean diameter d0, height to diameter d0 ratio, and stand density with regard to stand age of European beech.
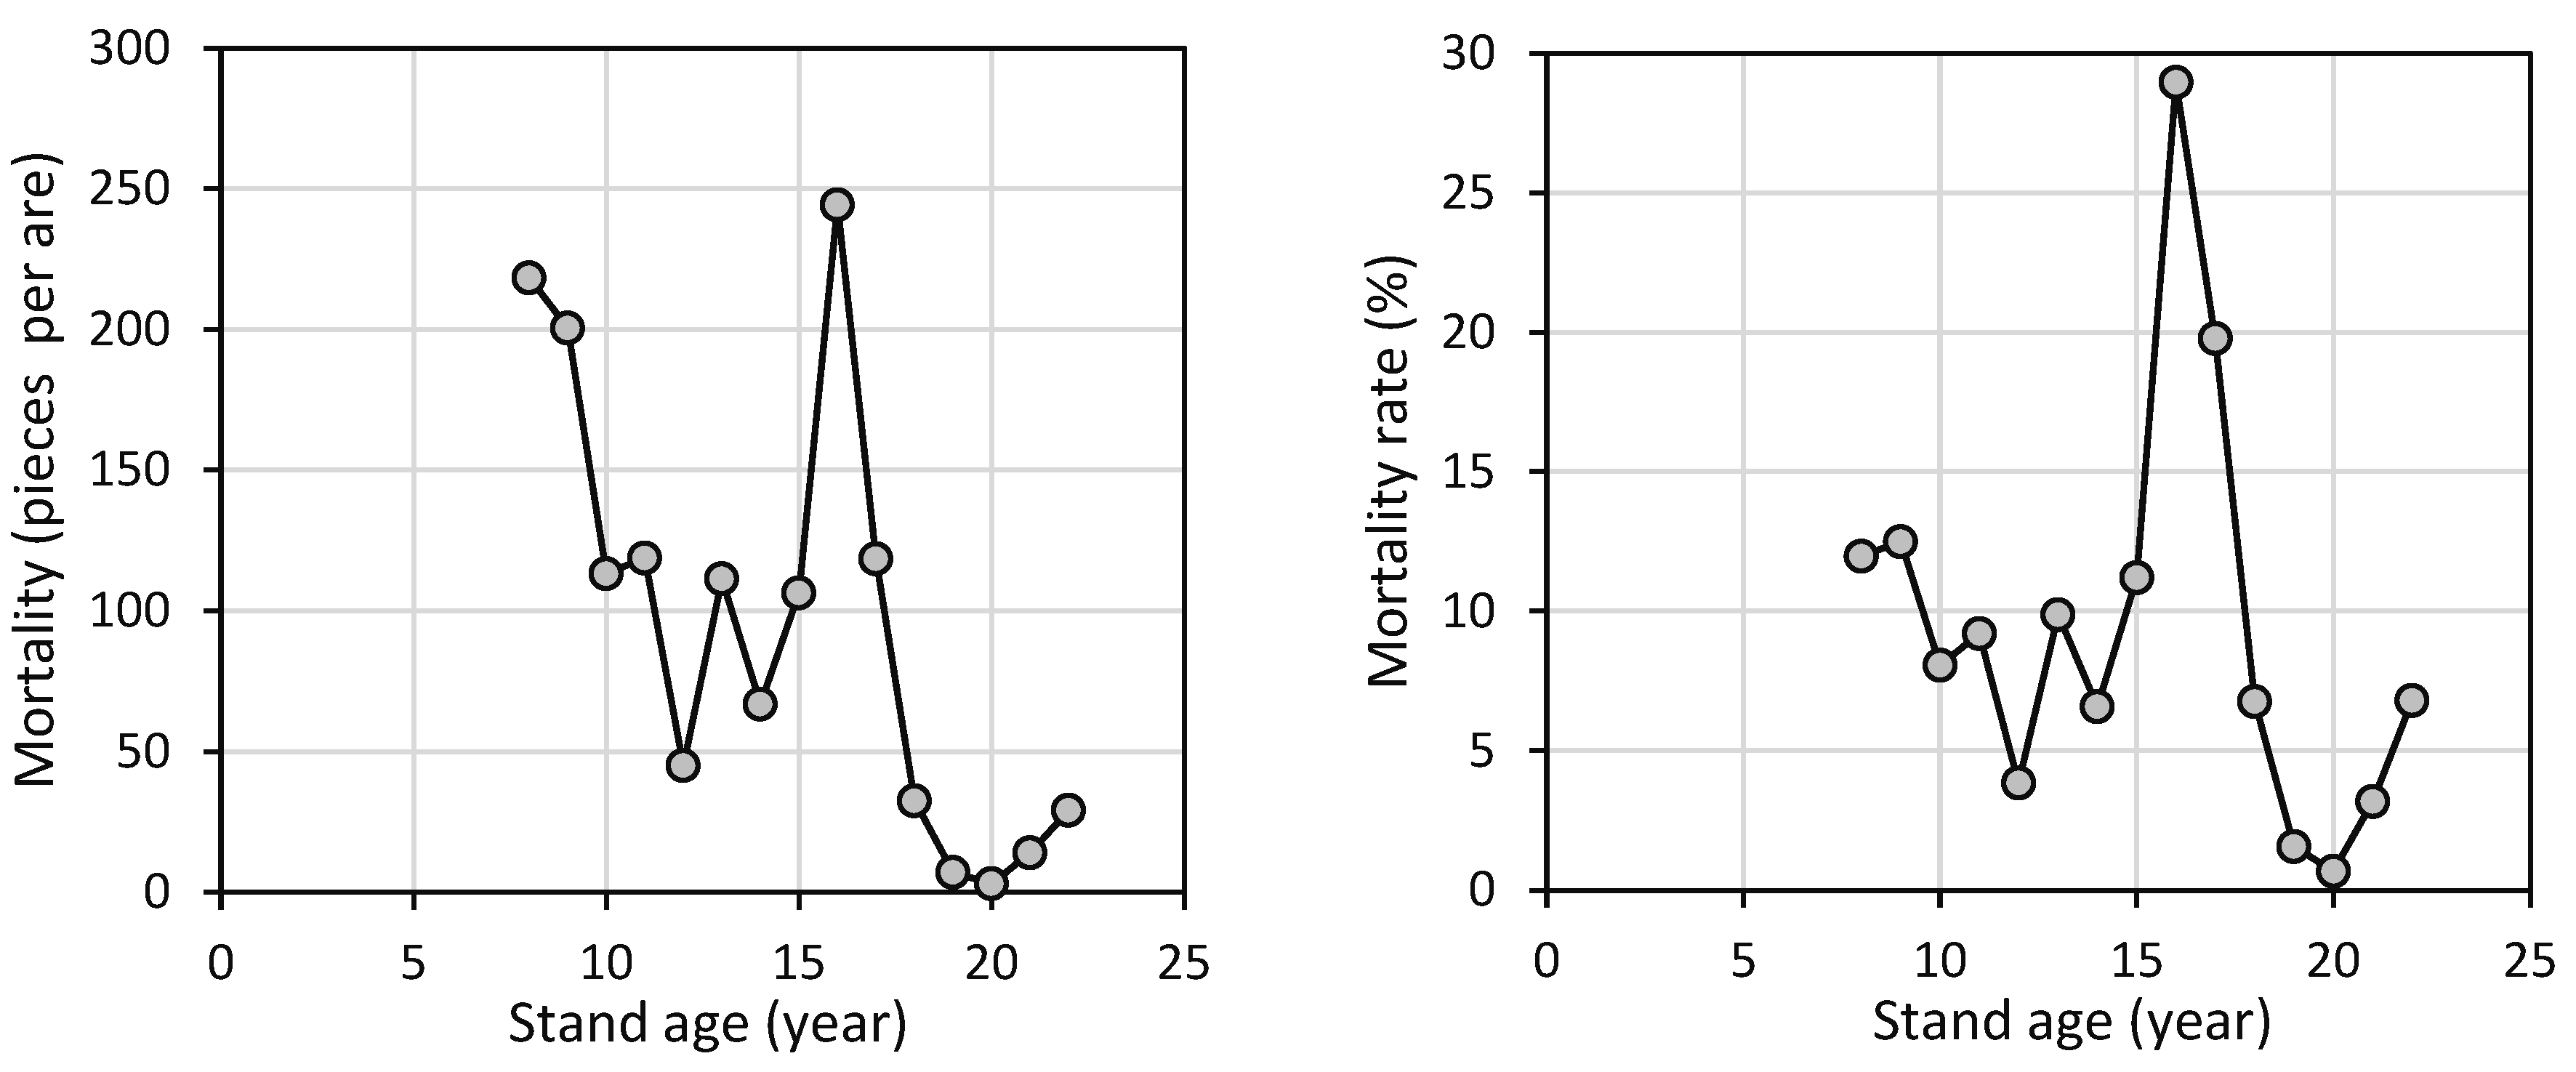
Tree mortality in the beech stand varied over the years (Figure 3). The highest mortality (244 individuals per 100 m2) was recorded at age 16. Since the number of living trees fluctuated significantly, a primarily decreasing mortality rate is a more appropriate indicator of the effects of competition on tree survival. The maximum mortality rate (nearly 29.0%) was observed at age 16. Considering all years of observation (from 2008 to 2023), the average annual mortality rate was 9.4%. This average value was exceeded six times, specifically at ages 8, 9, and 13, and continuously between ages 15 and 17.
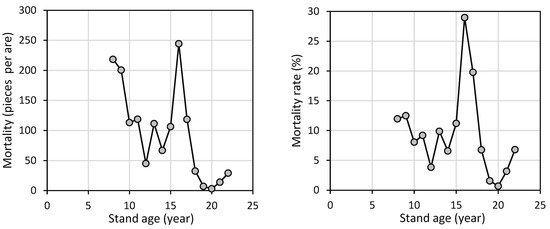
Figure 3.
Development of tree mortality and tree mortality rate with regard to stand age of European beech.
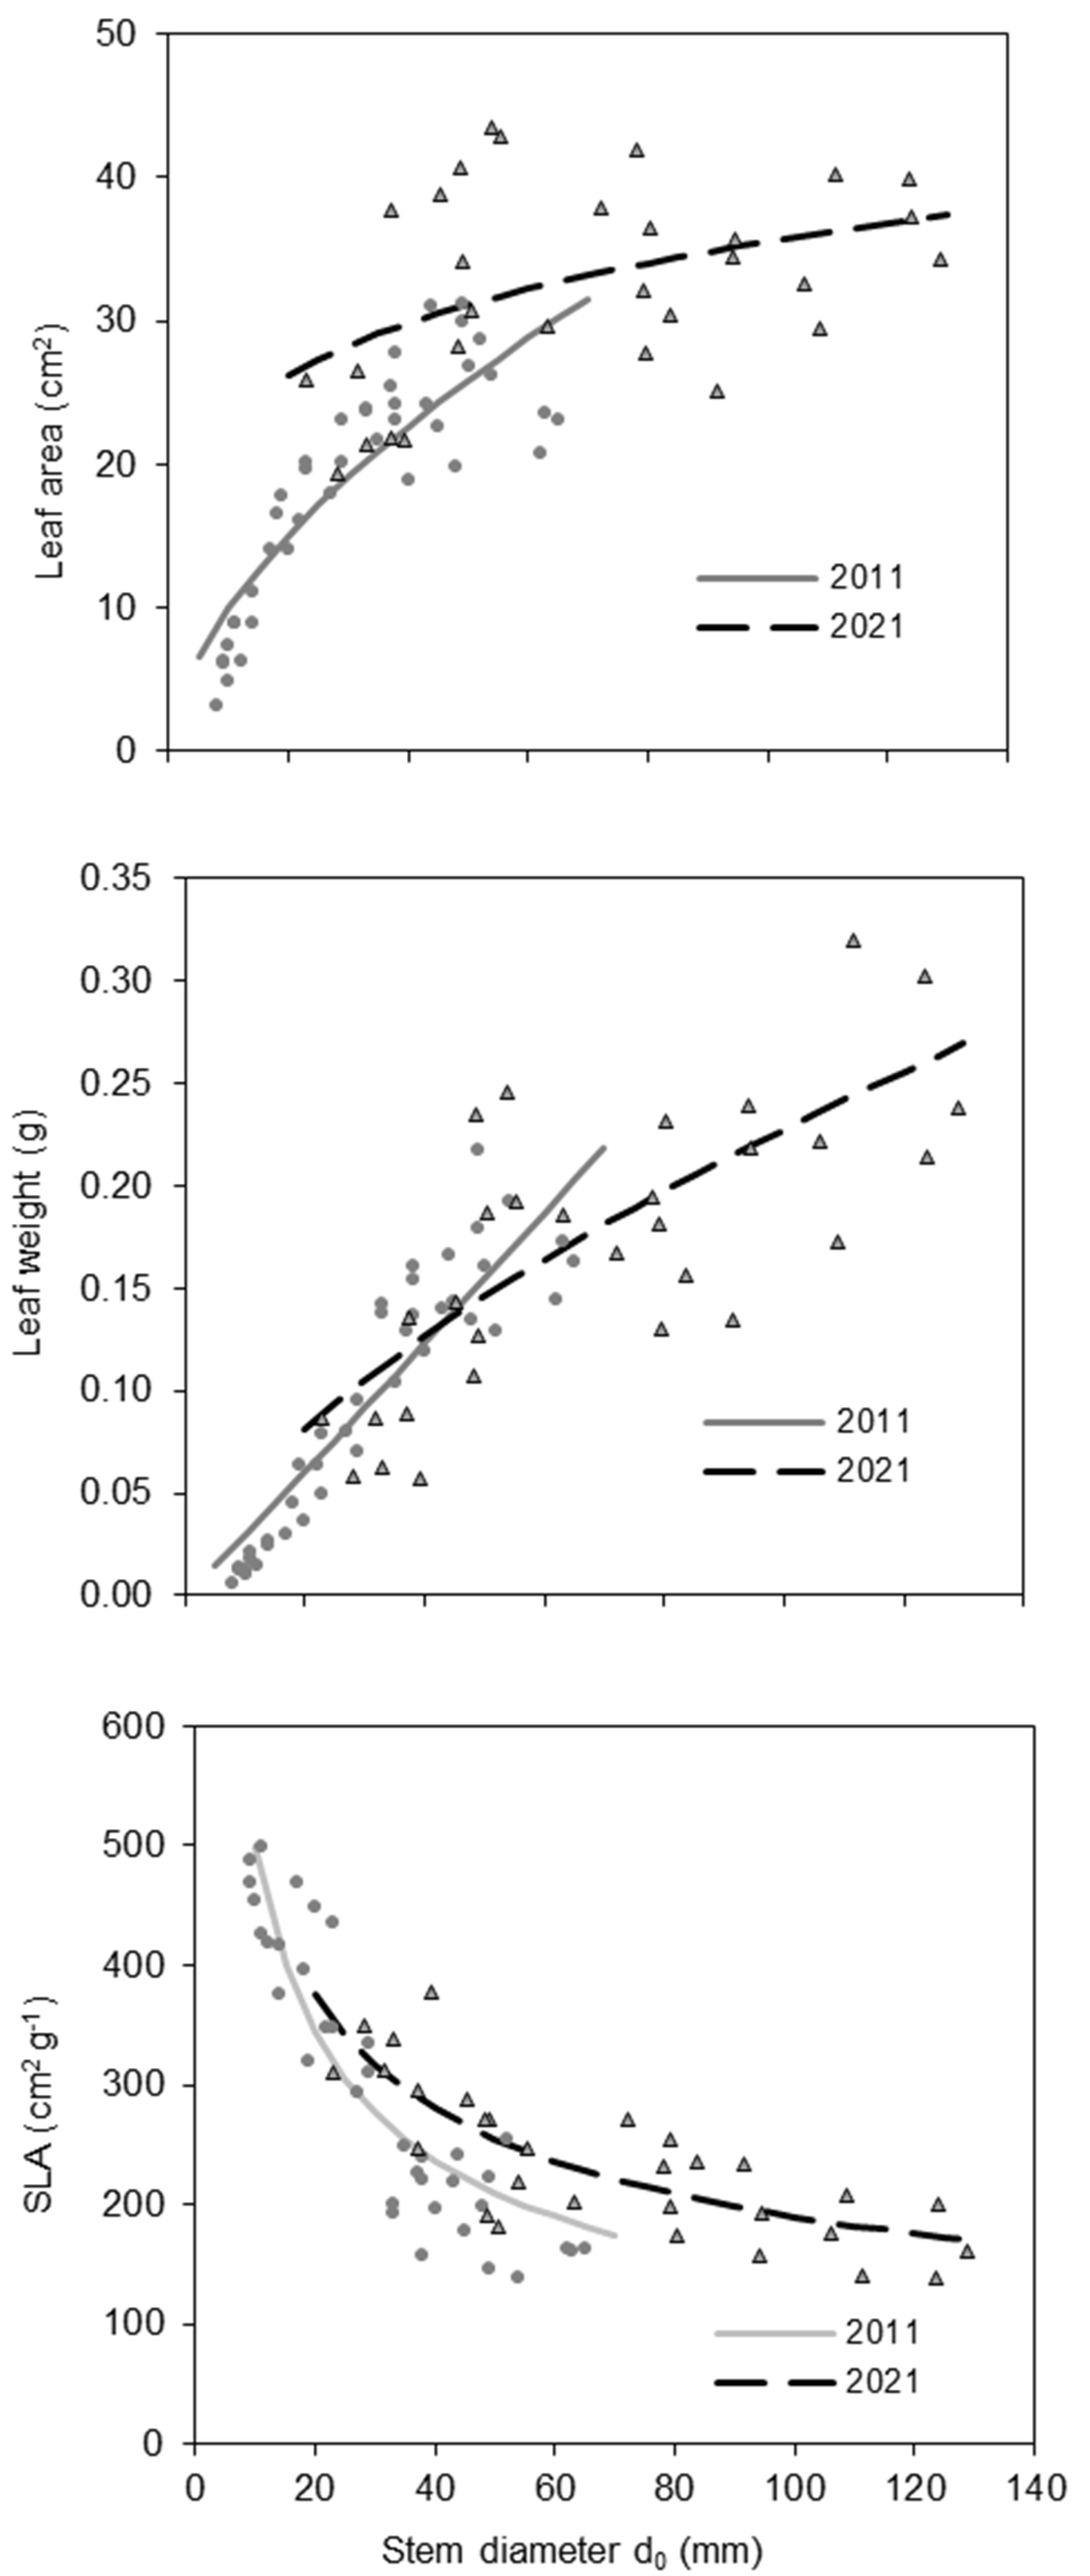
The SLA was related to tree size (expressed by diameter d0) and differed between trees in the 10-year-old and 20-year-old beech stands. Specifically, in both age groups, SLA decreased with tree size (Figure 4; Table 3). However, for trees with the same stem diameter, SLA was higher at age 20 than at age 10. The highest SLA values (between 400 and 500 cm2 g−1) were observed in the smallest trees, mainly those with d0 under 20 mm recorded in the 10-year-old stand. The increase in SLA was related to a larger increase in leaf area than in leaf weight (Figure 4; Table 3). Interestingly, while leaf area and weight were closely related to tree size in the 10-year-old stand, this relationship was weaker in the 20-year-old stand.
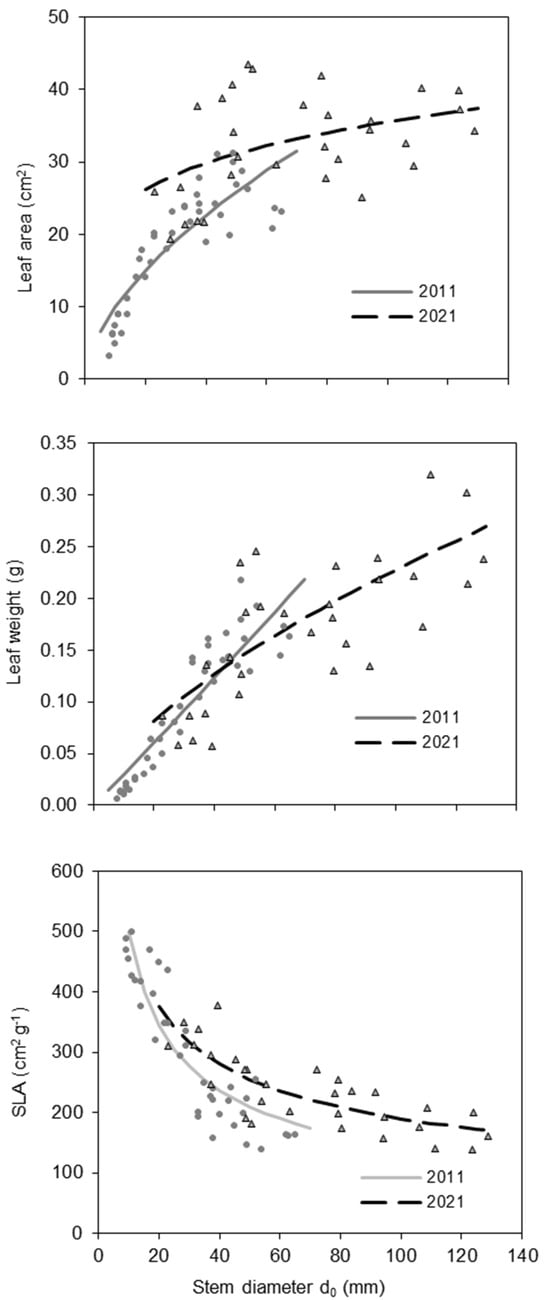
Figure 4.
Leaf area, leaf weight, and SLA of European beech trees in 2011 and 2021 with regard to stem diameter d0 of European beech.
Table 3.
Statistical characteristics of regression equations expressing the dependence of leaf area (LA), leaf mass (LM), and specific leaf area (SLA) of European beech expressed on stem diameter d0. Regression coefficients b0 and b1, their standard error (S.E.), p-value (p), coefficient of determination (R2), and mean squared error (MSE) for Equation (2).
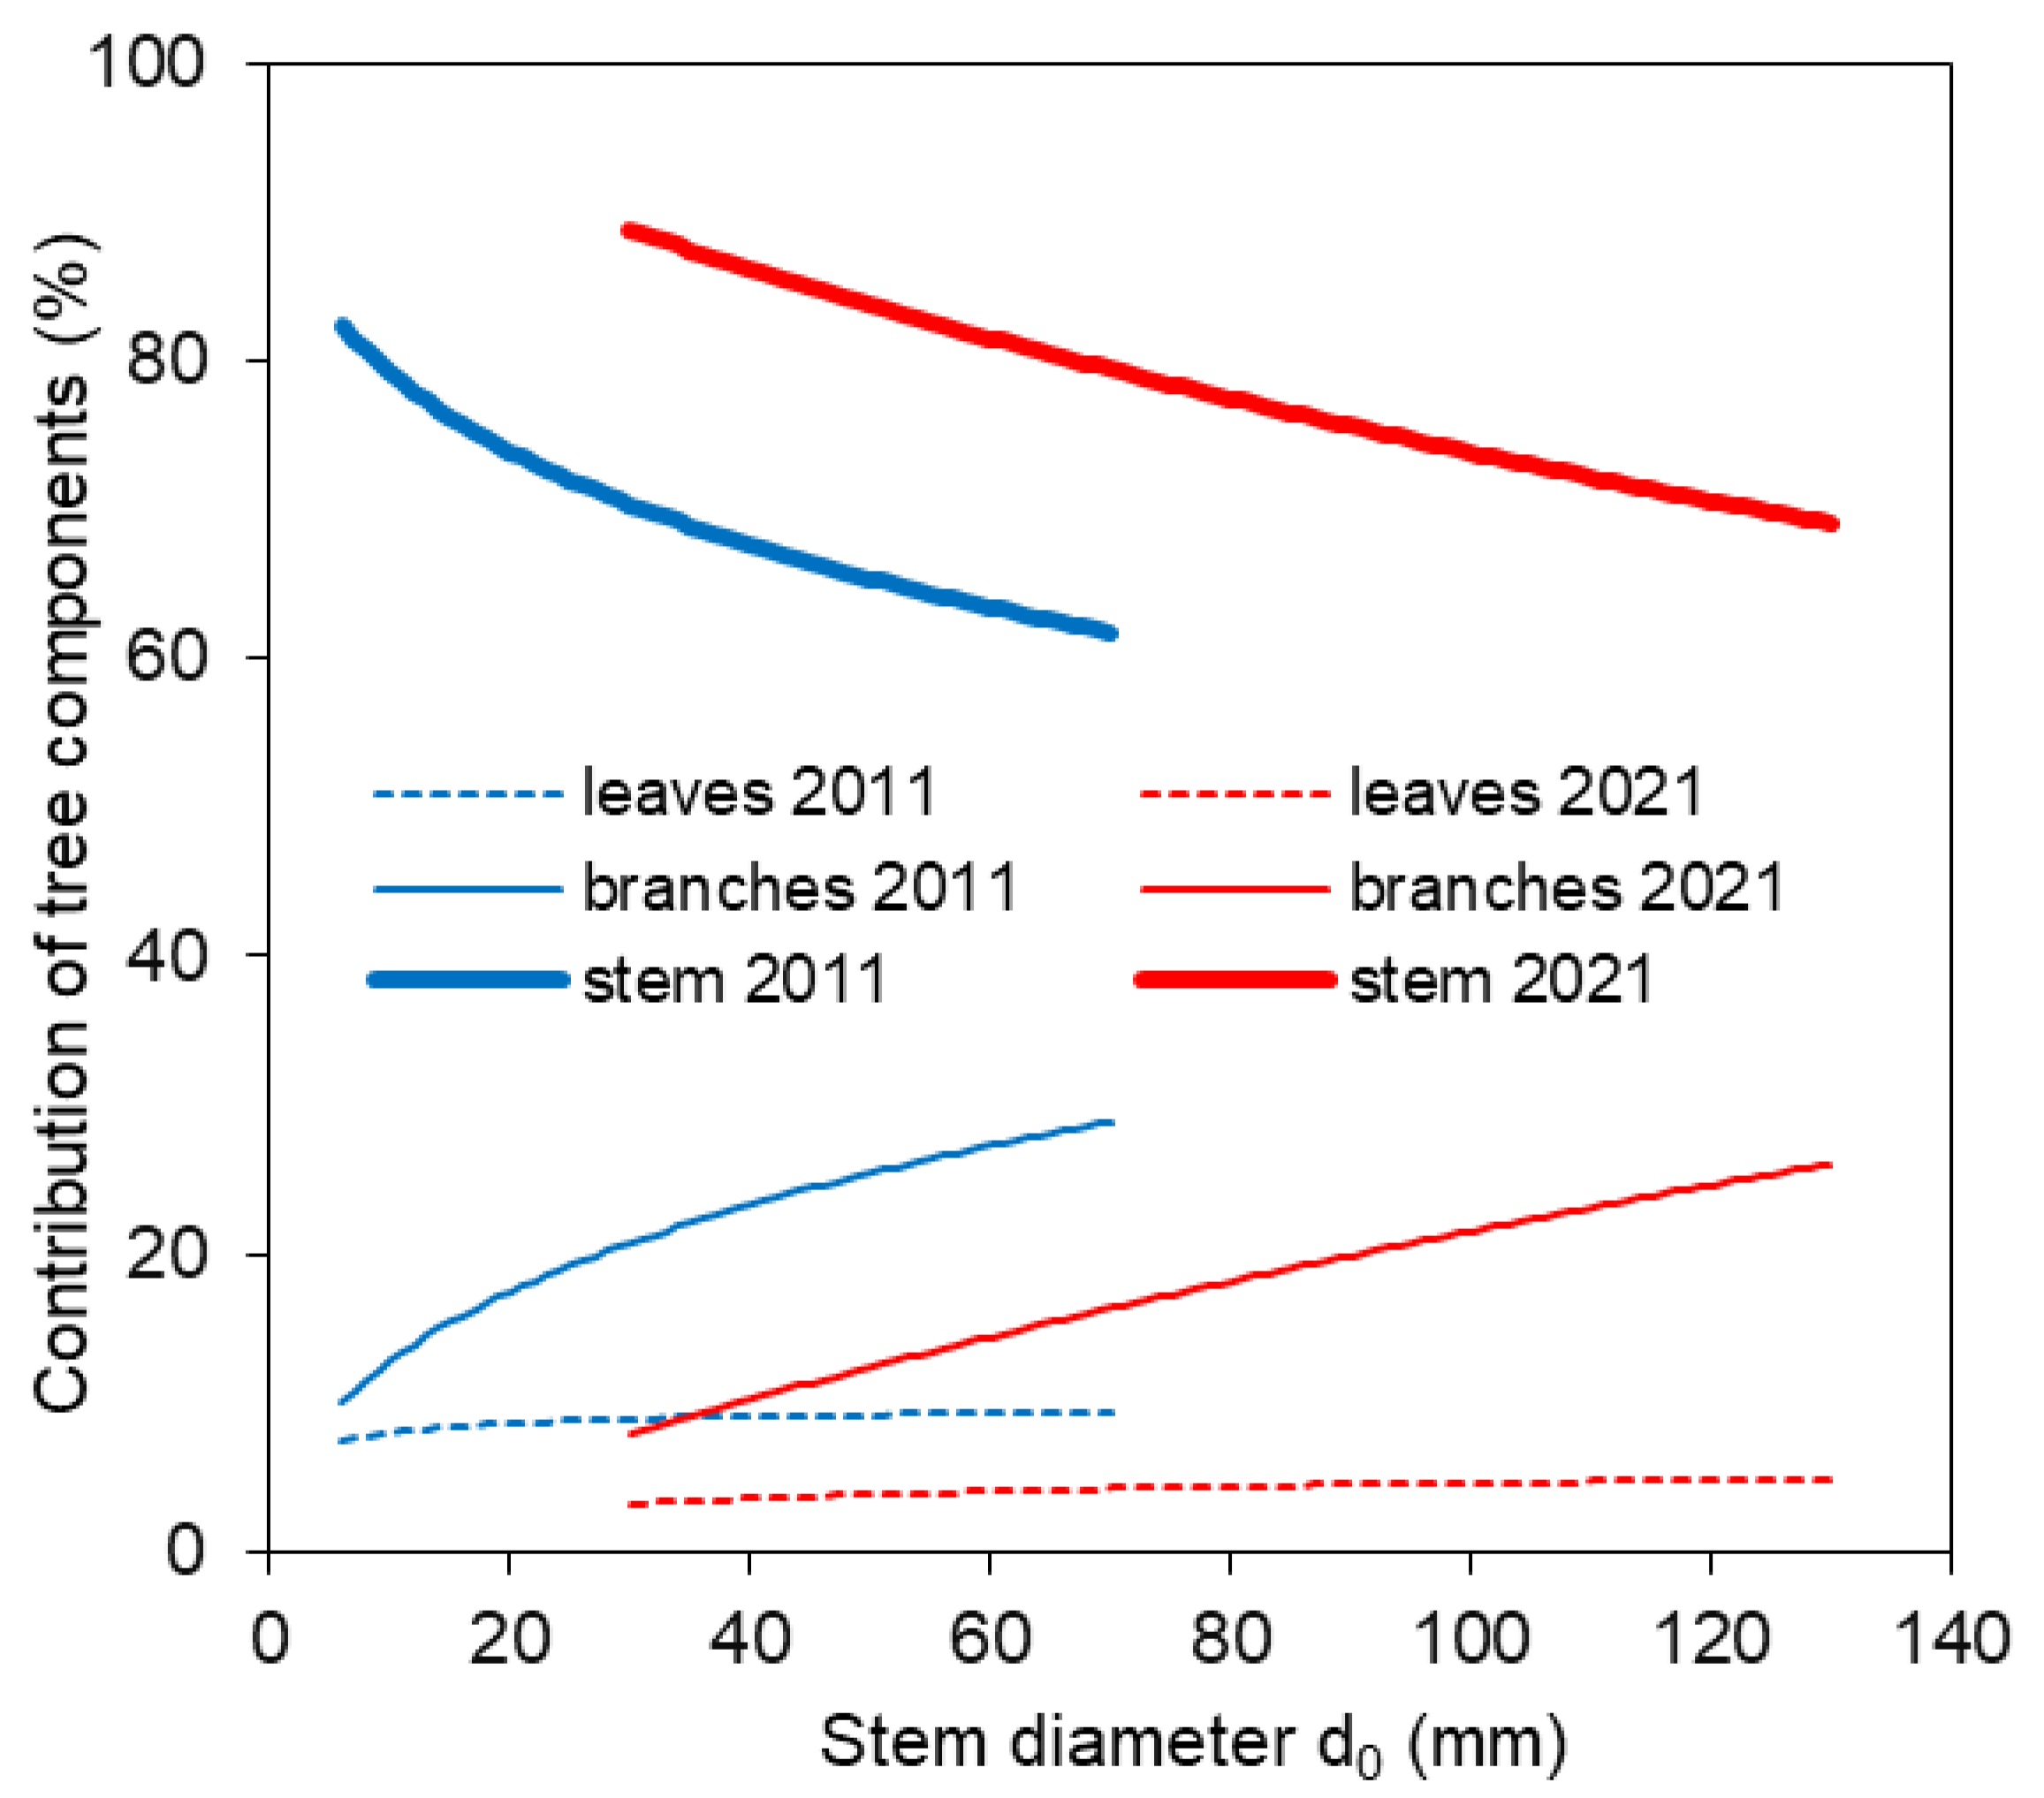
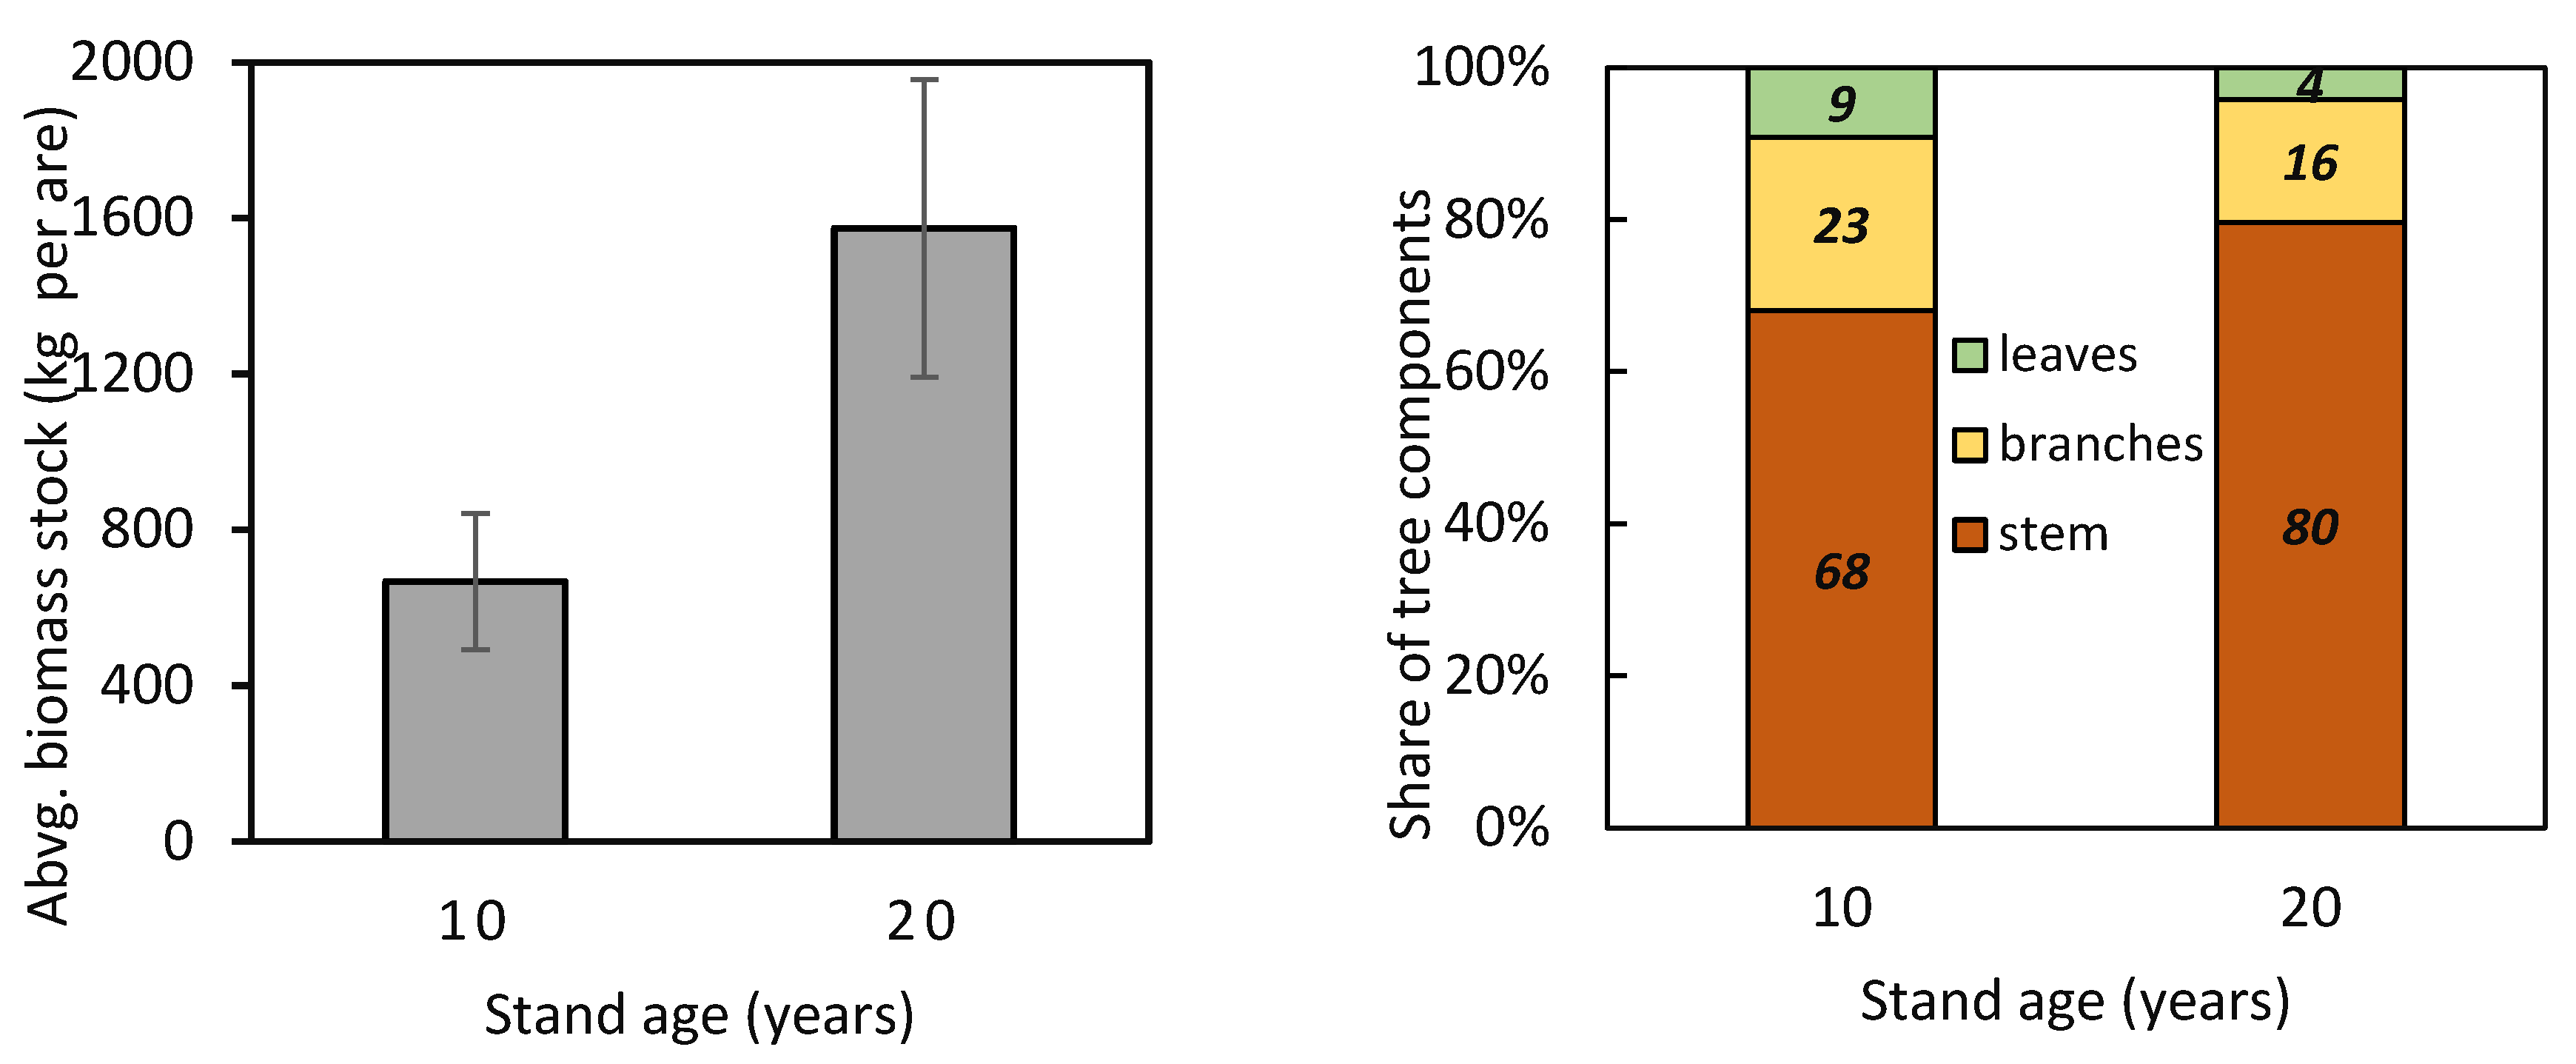
The new site- and year-specific allometric relationships (based on data from 2011 and 2021; Table A1—see the Appendix A) allowed us to compare component contributions to aboveground biomass at different stand ages. The comparison showed that the contribution of branches and leaves to aboveground biomass was minor in older trees than in younger ones (Figure 5). At the same time, within both the 10-year-old and 20-year-old stands, stem contribution decreased while branch and leaf contributions increased with tree size. Furthermore, the allometric relationships were used to estimate aboveground biomass at the stand level (Figure 6). The estimated aboveground biomass was 667 ± 175 kg per 100 m2 (we show the mean value and standard deviation) in the 10-year-old stand and 1574 ± 382 kg per 100 m2 in the 20-year-old stand. In the 10-year-old stand, stems accounted for 68.0% of the total biomass, branches 22.9%, and leaves 9.1%. In the 20-year-old stand, stems contributed 79.6%, branches 16.2%, and leaves only 4.2%.

Figure 5.
Contribution of tree components (stem, branches, and leaves) of European beech trees to aboveground biomass in 2011 and 2021 with regard to stem diameter d0.
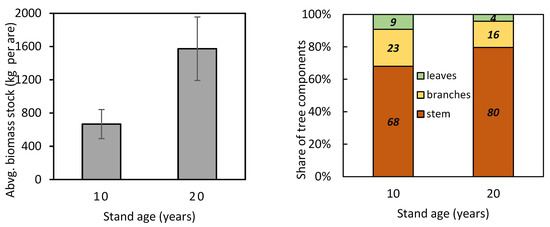
Figure 6.
Aboveground biomass stock and contribution of tree components (stem, branches, and leaves) to aboveground biomass in 10- and 20-year-old European beech stands.
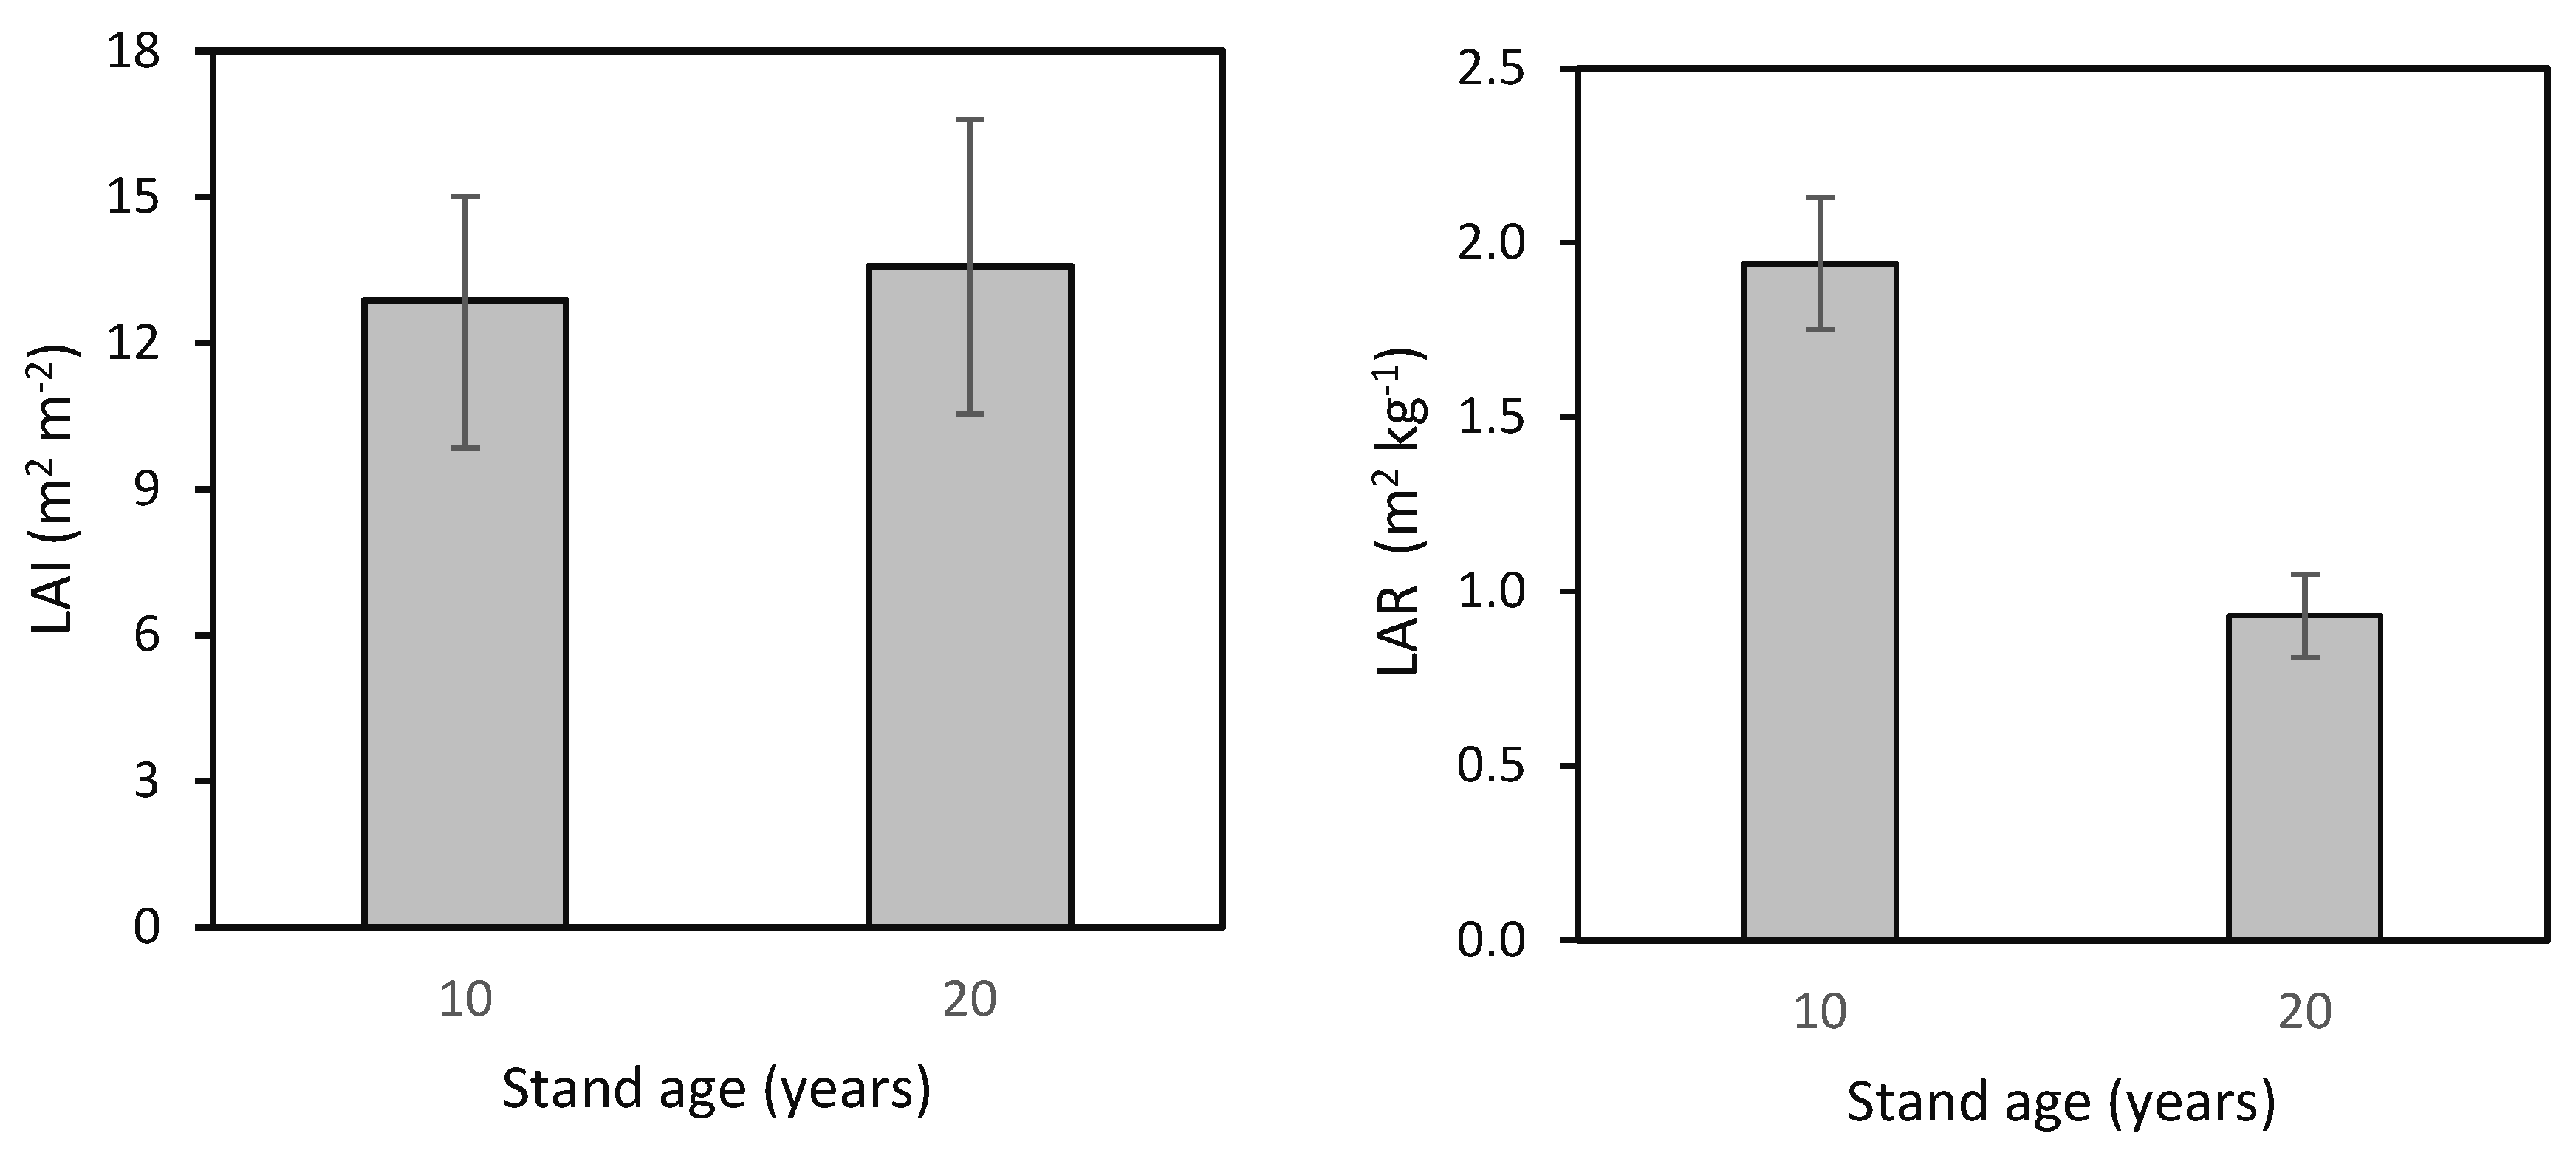
Finally, we calculated the Leaf Area Index (LAI) and Leaf Area Ratio (LAR) for the beech stand at ages 10 and 20 years (Figure 7). LAI values were similar for both ages, specifically 12.9 ± 2.1 m2 m−2 and 13.6 ± 3.0 m2 m−2. However, LAR was nearly twice as high in the 10-year-old stand as in the 20-year-old stand, i.e., 1.94 ± 0.19 m2 kg−1 and 0.93 ± 0.12 m2 kg−1, respectively.
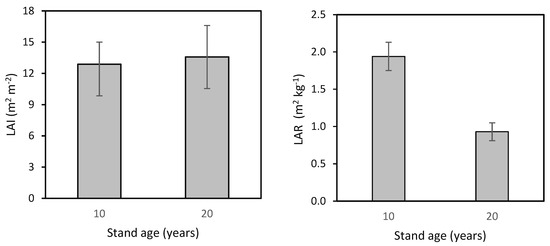
Figure 7.
Leaf Area Index (LAI) and Leaf Area Ratio (LAR) in 10- and 20-year-old European beech stands (while differences between LAIs were not significant, those between LARs were significant; one-way ANOVA; p < 0.001).
4. Discussion
4.1. Dynamics in Basic Stand Properties and Mortality
Our results illustrate dynamic inter-annual changes in a young, over-dense beech stand. The ratio between the mean stand values of height and diameter increased by 40% over a period of 16 years. This increase in the mean stand height-to-diameter ratio may be attributed not only to faster height growth compared to diameter growth but also to tree selection due to mortality caused by intraspecific competition. The height-to-diameter ratio is considered an indicator of tree competition (e.g., [29,30,31]) in addition to its other applications, such as assessing stand stability [32]. Since height and diameter increments do not follow the same growth intensity throughout a tree’s life [33], temporal changes in the height-to-diameter ratio occur.
According to our results, the maximum height-to-diameter ratio was observed at a stand age of 15 years. In the following year, severe tree mortality occurred, reaching a rate as high as 29%. This high mortality and a subsequent sharp reduction in stand density led to a year-over-year decline in the height-to-diameter ratio. As the surviving trees continued to grow and accumulate more aboveground biomass in the overcrowded space, competition intensified again, leading to a recurring increase in the height-to-diameter ratio. It is highly likely that severe competition primarily caused mortality among sub-dominant and suppressed trees, which generally exhibit a higher height-to-diameter ratio than dominant and co-dominant individuals (see also [30]).
Our results indicate that the average mortality rate over the 16-year development of the young beech stand was 9.4%. Pajtík et al. [34] reported that, in Slovakia and the Czech Republic, mortality rates in beech stands from the early 1990s to 2016 were mostly below 1.0%. However, their study focused on middle-aged and mature stands, which are likely less affected by intraspecific competition. Furthermore, they did not account for trees removed through thinning, tending, or sanitary cuts. Comparing our findings with those of Pajtík et al. [34] proved that mortality rates are significantly higher in young, dense (unthinned) beech stands than in middle-aged and mature stands, which are typically managed through silvicultural interventions such as thinning, tending, and sanitary cutting.
Larson et al. [35] explained that in young forest stands, tree mortality is primarily density-dependent due to competition for light, leading to an increasingly uniform spatial distribution of surviving trees. In contrast, mortality in old-growth forests is also driven by external factors such as insect outbreaks and wind damage, resulting in a more aggregated spatial pattern of surviving trees. On the other hand, Monserud et al. [36] emphasized that the individual-tree mortality model should always account for stand density as a key factor. A broad survey in Chinese temperate forests [37] proved that the relative contributions of competition, age, and structure variables to mortality were substantial (88.8%) and much larger than climate variables (11.2%). In general, competitive interactions between trees are fundamental to nearly all aspects of forest ecology, making their understanding crucial for effective forest ecosystem management [38].
4.2. Changes in Biomass Allocation
We found that aboveground biomass stock more than doubled within 10 years. At the same time, measurements showed that in both growth stages—i.e., in 10- and 20-year-old beech stands—the stem represented the main component of aboveground biomass, followed by branches and leaves. Additionally, within the stand, larger trees had a higher contribution of branches and leaves compared to smaller ones. This might be related to the size of the growing space, as larger dominant and codominant trees have more room for developing branches and an adequate amount of leaves. In contrast, smaller trees (intermediate and overtopped) are spatially restricted and primarily invest carbohydrates in stem height growth to compete with neighboring trees. In general, as tree competition increases, crown size (both breadth and length) decreases (e.g., [39]), leading to a reduced contribution of branches and leaves to both aboveground and total tree biomass [8].
In our over-dense beech stand, the biomass structure changed over the 10-year period. Specifically, while the contribution of the stem increased, the opposite trend was observed for branches and leaves. This presents an intriguing paradox: the contribution of tree components changes with tree size but in opposite ways within a stand and during stem development. The increase in stem contribution to tree biomass as the stand develops has been widely studied, with numerous publications on the topic (e.g., [11,40,41]). According to Goncalves [42], analyzing tree biomass structure is of fundamental importance for studying and modeling forest stands as well as for forest management. Findings on forest biomass allocation and structure can provide valuable insights into carbon sequestration and cycling. In this context, the proportion of short-lived organs (i.e., leaves) versus long-lived organs (i.e., all woody parts) plays a crucial role in these processes.
4.3. Changes in Leaf Traits
We found differences in leaf traits among trees of varying sizes, as well as between two growth stages (10 and 20 years). Regarding the within-stand variability of leaf properties, both leaf area and leaf weight increased with tree size. The opposite tendency was observed for SLA, meaning that the temporal increase in leaf weight was larger than that in leaf area. Interestingly, stronger relationships between tree size and both leaf area and leaf weight were found in the 10-year-old stand compared to the 20-year-old stand. This may be related to the more complex structure (greater variability in tree sizes and canopy closure) in the older stand. At the same time, the relationship between tree size and SLA showed similar regression coefficients in both growth stages. Hence, we may assume that SLA is a better indicator of tree growth conditions than leaf area or leaf weight per se. Moreover, SLA increased with stand development, which we hypothesize might be related to increasing competition stress among trees. SLA is a key functional trait reflecting the trade-off between resource capture and conservation and plays an important role in plant community assembly [43]. These authors demonstrated that light availability is a key factor influencing SLA, with higher light levels leading to lower SLA values. Leaf mass and area are influenced by stand density and also differ among trees based on their bio-sociological status [44], which are also primarily related to light conditions.
Additionally, we found that while LAR changed considerably over the 10-year period (decreasing by more than half), LAI remained relatively stable. This suggests that, at the stand level, the same leaf area had to support, via photosynthesis, twice the amount of woody biomass in 20-year-old beech stands compared to 10-year-old stands. While numerous studies have investigated LAI, research focusing on LAR remains scarce. One of the few studies on LAR in young beech stands found that its values decreased with the canopy openness of the maternal stand [45], ranging from 0.4 to 1.9 m2 kg−1, with lower values observed in denser canopies.
Since the studies on LAI have been conducted across various forest types, tree species, and ages, the reported values are highly variable [46]. A global review [46] reported LAI values ranging from 1.0 m2 m−2 to approximately 20.0 m2 m−2, with common values between 1.0 and 8.0 m2 m−2 in broadleaf forests and between 2.0 and 10.0 m2 m−2 in coniferous forests. Our results fall within the upper range of these global values. However, our stand was over-dense and at a young growth stage, likely contributing to these high values. This interpretation is supported by Schlerf et al. [47], who found that LAI decreases with stand age, reaching its maximum between 10 and 20 years. Similarly, our previous work [25] reported LAI values between 10.0 and 14.0 m2 m−2 in young (approximately 10-year-old) stands of European beech and Norway spruce from natural regeneration. At the same time, we cannot fully exclude some methodological biases, as the diameter-based allometric method of LAI estimation has been reported to yield slightly higher values than other approaches [48]. Nevertheless, understanding LAI and its changes across different forest types and developmental stages is crucial. Besides its variety of theoretical significances, LAI influences atmosphere/biosphere CO2 exchange and can be estimated using remote sensing techniques [49].
5. Conclusions
This study highlights the dynamic changes in young, dense European beech forest over time, particularly in terms of growth patterns, competition, mortality, and biomass structure, which is a result of carbohydrate allocation. As trees develop, height tends to increase at a faster rate than diameter, leading to shifts in structural ratios that indicate competition intensity. In dense stands, competition for light and resources plays a key role in shaping tree survival when suppressed trees are exposed to higher mortality rates. This process naturally reduces stand density but can also lead to cycles of intensified competition among the remaining trees. Mortality rates tend to be higher in unmanaged young stands compared to mature or thinned forests, where management practices help control density and resource distribution.
Biomass allocation changes as trees grow, with a more significant proportion of biomass being directed toward stems rather than branches and leaves. Larger trees within the stand, which have more access to space and light, tend to develop larger crowns, while smaller, suppressed trees invest more in height growth to compete. These shifts in biomass distribution have important implications for carbon storage and forest productivity. Leaf traits also change over time, with SLA increasing as competition intensifies. The balance between leaf area and biomass allocation affects overall stand productivity, influencing processes like photosynthesis and carbon cycling.
We assume that while external factors such as climate and environmental stressors can influence forest dynamics, competition in young forest stands remains a dominant force in mortality. Understanding these interactions is crucial for sustainable forest management, as they affect long-term stand stability and ecosystem functions. Insights from studies on stand development, biomass allocation, and leaf traits can inform forest management strategies, especially in the context of carbon sequestration.
Author Contributions
Conceptualization, B.K.; data curation, J.P. and V.Š.; funding acquisition, B.K., J.P. and V.Š. investigation, B.K., V.Š. and J.P.; methodology, J.P. and B.K.; visualization, V.Š.; supervision, B.K.; writing—original draft preparation, B.K. and J.P.; writing—review and editing, all authors. All authors have read and agreed to the published version of the manuscript.
Funding
This research was funded by grant “EVA4.0”, No. Z.02.1.01/0.0/0.0/16_019/0000803 supported by OP RDE as well as by the projects APVV-18-0086, APVV-19-0387, APVV-20-0168, and APVV-22-0056 from the Slovak Research and Development Agency.
Data Availability Statement
Data are contained within the article.
Conflicts of Interest
The authors declare no conflicts of interest.
Appendix A
Table A1.
Statistical characteristics in allometric models for components in young European beech trees: regression coefficients (b0, b1, b2), their standard errors (S.E.), p-values (p), coefficients of determination (R2), mean squared errors (MSE), logarithmic transformation biases (λ), and standard deviations (S.D.) for Equations (3)–(5).
| Year | Eq. No | Tree Compartment | b0 | S.E. | p | b1 | S.E. | p | b2 | S.E. | p | R2 | MSE | λ | S.D. |
|---|---|---|---|---|---|---|---|---|---|---|---|---|---|---|---|
| 2011 | (3) | Stem | −3.800 | 0.222 | <0.001 | 2.879 | 0.070 | <0.001 | 0.965 | 0.076 | 1.038 | 0.297 | |||
| Branches | −6.913 | 0.330 | <0.001 | 3.424 | 0.105 | <0.001 | 0.947 | 0.168 | 1.077 | 0.416 | |||||
| Leaves | −6.576 | 0.256 | <0.001 | 3.085 | 0.081 | <0.001 | 0.960 | 0.102 | 1.047 | 0.308 | |||||
| (4) | Stem | 2.569 | 0.116 | <0.001 | 2.787 | 0.110 | <0.001 | 0.914 | 0.189 | 1.093 | 0.476 | ||||
| Branches | 0.842 | 0.216 | <0.001 | 3.119 | 0.205 | <0.001 | 0.794 | 0.653 | 1.299 | 0.930 | |||||
| Leaves | 0.383 | 0.179 | 0.037 | 2.841 | 0.170 | <0.001 | 0.823 | 0.450 | 1.221 | 0.785 | |||||
| (5) | Stem | −1.763 | 0.216 | <0.001 | 1.905 | 0.093 | <0.001 | 1.069 | 0.093 | <0.001 | 0.989 | 0.024 | 1.011 | 0.152 | |
| Branches | −6.581 | −0.577 | <0.001 | 3.265 | 0.249 | <0.001 | 0.174 | 0.248 | 0.485 | 0.947 | 0.170 | 1.076 | 0.413 | ||
| Leaves | −5.943 | 0.439 | <0.001 | 2.783 | 0.190 | <0.001 | 0.332 | 0.189 | 0.083 | 0.962 | 0.098 | 1.045 | 0.305 | ||
| 2021 | (3) | Stem | −2.149 | 0.388 | <0.001 | 2.538 | 0.093 | <0.001 | 0.964 | 0.059 | 1.028 | 0.248 | |||
| Branches | −8.030 | 1.004 | <0.001 | 3.517 | 0.241 | <0.001 | 0.884 | 0.396 | 1.183 | 0.667 | |||||
| Leaves | −7.112 | 0.866 | <0.001 | 2.987 | 0.208 | <0.001 | 0.881 | 0.295 | 1.158 | 0.712 | |||||
| (4) | Stem | 0.887 | 0.531 | 0.106 | 3.425 | 0.241 | <0.001 | 0.879 | 0.198 | 1.094 | 0.465 | ||||
| Branches | −2.089 | 1.294 | 0.039 | 4.281 | 0.586 | <0.001 | 0.656 | 1.176 | 1.741 | 2.163 | |||||
| Leaves | −2.690 | 1.102 | 0.021 | 3.642 | 0.499 | <0.001 | 0.655 | 0.852 | 1.560 | 1.920 | |||||
| (5) | Stem | −1.682 | 0.220 | <0.001 | 1.785 | 0.106 | <0.001 | 1.215 | 0.150 | <0.001 | 0.989 | 0.018 | 1.008 | 0.126 | |
| Branches | −8.150 | 1.055 | <0.001 | 3.711 | 0.507 | <0.001 | −0.314 | 0.716 | 0.665 | 0.885 | 0.408 | 1.180 | 0.655 | ||
| Leaves | −7.205 | 0.911 | <0.001 | 3.137 | 0.437 | <0.001 | −0.242 | 0.618 | 0.698 | 0.881 | 0.304 | 1.158 | 0.707 |
References
- San-Miguel-Ayanz, J.; De Rigo, D.; Caudulo, G.; Durrant, T.H.; Mauri, A. European Atlas of Forest Tree Species; Publication Office of the European Union: Luxembourg, 2016; 200p. [Google Scholar]
- Walthert, L.; Graf Pannatier, E.; Meier, E.S. Shortage of nutrients and excess of toxic elements in soils limit the distribution of soil-sensitive tree species in temperate forests. For. Ecol. Manag. 2013, 297, 94–107. [Google Scholar]
- Barna, M.; Kulfan, J.; Bublinec, E. (Eds.) Beech and Beech Ecosystems of Slovakia; VEDA: Bratislava, Slovakia, 2011; 636p. [Google Scholar]
- Dieler, J.; Pretzsch, H. Morphological plasticity of European beech (Fagus sylvatica L.) in pure and mixed-species stands. For. Ecol. Manag. 2013, 295, 97–108. [Google Scholar] [CrossRef]
- Aleinikovas, M.; Linkevičius, E.; Kuliešis, A.; Rolhle, H.; Schroeder, J. The Impact of Competition for Growing Space on Diameter, Basal Area and Height Growth in Pine Trees. Balt. For. 2014, 20, 301–313. [Google Scholar]
- Schröter, M.; Härdtle, W.; von Oheimb, G. Crown plasticity and neighborhood interactions of European beech (Fagus sylvatica L.) in an old-growth forest. Eur. J. For. Res. 2012, 131, 787–798. [Google Scholar]
- Rubio, V.E.; Zambrano, J.; Iida, Y. Improving predictions of tropical tree survival and growth by incorporating measurements of whole leaf allocation. J. Ecol. 2021, 109, 1331–1343. [Google Scholar] [CrossRef]
- Le Goff, N.; Ottorini, J.M. Biomass distribution, allocation and growth efficiency in European beech trees of different ages in pure even-aged stands in northeast France. Cent. Eur. For. J. 2022, 68, 117–138. [Google Scholar]
- Wagner, S.; Collet, C.; Madsen, P.; Nakashizuka, T.; Nyland, R.D.; Sagheb-Talebi, K. Beech regeneration research: From ecological to silvicultural aspects. For. Ecol. Manag. 2010, 259, 2172–2182. [Google Scholar]
- Fichtner, A.; Sturm, K.; Rickert, C.; Härdtle, W.; Schrautezr, J. Competition response of European beech Fagus sylvatica L. varies with tree size and abiotic stress: Minimizing anthropogenic disturbances in forests. J. Appl. Ecol. 2012, 49, 1306–1315. [Google Scholar]
- Lifeng, P.; Wang, G.; Sharma, R.P.; Lu, J.; Tang, X.; Fu, L. Simulation of Thinning by Integrating Tree Competition and Species Biodiversity for Target Tree-Based Management of Secondary Forests. Forests 2023, 14, 1896. [Google Scholar] [CrossRef]
- Pajtík, J.; Konôpka, B.; Šebeň, V. Allometric models for estimating aboveground biomass of young Norway spruce trees in the Western Carpathians, Slovakia. Cent. Eur. For. J. 2022, 68, 154–162. [Google Scholar]
- Repáč, I.; Parobeková, Z.; Sendecký, M. Reforestation in Slovakia: History, current practice and perspectives. Reforesta 2017, 12, 53–88. [Google Scholar] [CrossRef]
- Konôpka, B.; Pajtík, J.; Šebeň, V.; Lukac, M. Decadal forest mensuration cycle significantly underestimates net primary production in dense young beech stands. For. Ecol. Manag. 2024, 555, 121711. [Google Scholar]
- Vile, D.; Garnier, E.; Shipley, B.; Laurent, G.; Navas, M.L.; Roumet, C.; Lavorel, S.; Díaz, S. Specific Leaf Area and Dry Matter Content Estimate Thickness in Laminar Leaves. Ann. Bot. 2005, 96, 1129–1136. [Google Scholar] [PubMed]
- Gao, J.; Wang, X.; Zhang, X. Patterns and drivers of community specific leaf area in China. Glob. Ecol. Conserv. 2022, 33, e01971. [Google Scholar]
- Poorter, H.; Niinemets, Ü.; Poorter, L.; Wright, I.J.; Villar, R. Causes and consequences of variation in leaf mass per area (LMA): A meta-analysis. New Phytol. 2009, 182, 565–588. [Google Scholar]
- Kozlowski, T.T.; Pallardy, S.G. Physiology of Woody Plants, 2nd ed.; Academic Press: Cambridge, UK, 1996; 469p. [Google Scholar]
- Anderson-Teixeira, K.J.; Herrmann, V.; Morgan, R.B.; Bond-Lamberty, J.; Cook-Patton, B.S.; Ferson, A.E.; Muller-Landau, H.C.; Wang, M.H. Carbon cycling in mature and regrowth forests globally. Environ. Res. Lett. 2021, 3, 053009. [Google Scholar]
- Fang, H.; Baret, F.; Plummer, S.; Schaepman-Strub, G. An Overview of Global Leaf Area Index (LAI): Methods, Products, Validation, and Applications. Rev. Geophys. 2019, 57, 739–799. [Google Scholar]
- Pokorný, R.; Tomášková, I.; Havránková, K. Temporal variation and efficiency of leaf area index in young mountain Norway spruce stand. Eur. J. For. Res. 2008, 127, 359–367. [Google Scholar]
- Larcher, W. Physiological Plant Ecology: Ecophysiology and Stress Physiology of Functional Groups, 4th ed.; Springer: Berlin/Heidelberg, Germany, 2023; 513p. [Google Scholar]
- Nemani, R.R.; Running, S.W. Testing a theoretical climate–soil–leaf area hydrologic equilibrium of forests using satellite data and ecosystem simulation. Agric. For. Meteorol. 1989, 44, 245–260. [Google Scholar]
- Taugourdeau, S.; le Maire, G.; Avelino, J.; Jones, J.R.; Ramirez, L.G.; Quesada, M.J.; Charbonnier, F.; Gómez-Delgado, F.; Harmand, J.-M.; Rapidel, B.; et al. Leaf area index as an indicator of ecosystem services and management practices: An application for coffee agroforestry. Agric. Ecosyst. Environ. 2014, 192, 19–37. [Google Scholar] [CrossRef]
- Olamide, M. Estimation of Site-Specific Biomass and Leaf Area Index in a Young Scots pine Stand in Southern Sweden. Ph.D. Thesis, SLU Alnarp, Alnarp, Sweden, 2023; 42p. [Google Scholar]
- Konôpka, B.; Pajtík, J.; Šebeň, V.; Bošeľa, M.; Máliš, F.; Priwitzer, T.; Pavlenda, P. The research site Vrchslatina—An experimental design and the main aims. Lesn. Čas.—For. J. 2013, 59, 203–213. [Google Scholar] [CrossRef]
- Easlon, H.M.; Bloom, A.J. Easy Leaf Area: Automated digital image analysis for rapid and accurate measurement of leaf area. Appl. Plant Sci. 2014, 2, 1400033. [Google Scholar] [CrossRef] [PubMed]
- Pajtík, J.; Konôpka, B.; Lukac, M. Biomass functions and expansion factors in young Norway spruce (Picea abies [L.] Karst) trees. For. Ecol. Manag. 2008, 256, 1096–1103. [Google Scholar] [CrossRef]
- Opio, C.; Jacob, N.; Coopersmith, D. Height to diameter ratio as a competition index for young conifer plantations in northern British Columbia, Canada. For. Ecol. Manag. 2000, 137, 245–252. [Google Scholar] [CrossRef]
- Zhang, X.; Wang, H.; Chhin, S.; Zhang, J. Effects of competition, age and climate on tree slenderness of Chinese fir plantations in southern China. For. Ecol. Manag. 2020, 485, 117815. [Google Scholar] [CrossRef]
- Zhang, B.; Sajjad, S.; Chen, K.; Zhou, L.; Zhang, Y.; Yong, K.K.; Sun, Y. Predicting Tree Height-Diameter Relationship from Relative Competition Levels Using Quantile Regression Models for Chinese Fir (Cunninghamia lanceolata) in Fujian Province, China. Forests 2020, 11, 183. [Google Scholar] [CrossRef]
- Xu, Q.; Lei, X.L.; Zang, H.; Zeng, W. Climate Change Effects on Height–Diameter Allometric Relationship Vary with Tree Species and Size for Larch Plantations in Northern and Northeastern China. Forests 2022, 13, 468. [Google Scholar] [CrossRef]
- Oliver, C.D.; Larson, B.C. Forest Stand Dynamics; John Wiley & Sons, Inc.: Hoboken, NJ, USA, 1996; 520p. [Google Scholar]
- Pajtík, J.; Čihák, T.; Konôpka, B.; Merganičová, K.; Fabiánek, P. Annual tree mortality and felling rates in the Czech Republic and Slovakia over three decades. Cent. Eur. For. J. 2018, 64, 238–248. [Google Scholar]
- Larson, A.J.; Lutz, J.A.; Donato, D.C.; Freund, J.A.; Swanson, M.E.; Lambers, J.H.; Spruger, D.G.; Franklin, J.F. Spatial aspects of tree mortality strongly differ between young and old-growth forests. Ecology 2015, 96, 2855–2861. [Google Scholar] [CrossRef]
- Monserud, R.A.; Ledermann, T.; Sterba, H. Are Self-Thinning Constraints Needed in a Tree-Specific Mortality Model? For. Sci. 2004, 50, 848–858. [Google Scholar] [CrossRef]
- Zhang, X.; Wang, Z.; Chhin, S.; Wang, H.; Duan, A.; Zhang, J. Relative contributions of competition, stand structure, age, and climate factors to tree mortality of Chinese fir plantations: Long-term spacing trials in southern China. For. Ecol. Manag. 2020, 465, 118103. [Google Scholar] [CrossRef]
- Thorpe, H.C.; Astrup, R.; Trowbridge, A.; Coates, K.D. Competition and tree crowns: A neighborhood analysis of three boreal tree species. For. Ecol. Manag. 2010, 259, 1586–1596. [Google Scholar] [CrossRef]
- Yang, X.-Z.; Zhang, W.H.; He, Q.Y. Effects of intraspecific competition on growth, architecture and biomass allocation of Quercus liaotungensis. J. Plant Interact. 2018, 14, 284–294. [Google Scholar] [CrossRef]
- Jia, Q.; Luo, C.; Liu, Q.; Meng, S.; Zhou, G.; Zhuang, H. Biomass Allocation in Relation to Stand Age and Density in Natural Larix gmelinii Forests in Cold Temperate China. Nat. Environ. Pollut. Technol. 2016, 15, 1027–1033. [Google Scholar]
- Ma, S.H.; Eziz, A.; Tian, D.; Yan, Z.B.; Cai, Q.; Jiang, M.W.; Ji, C.J.; Fang, J.Y. Size- and age-dependent increases in tree stem carbon concentration: Implications for forest carbon stock estimations. J. Plant Ecol. 2020, 13, 233–240. [Google Scholar] [CrossRef]
- Goncalves, A.C. Effects of Forest Stand Structure in Biomass and Carbon. In Forest Biomass and Carbon; Shukla, G., Chakravarty, S., Eds.; IntechOpen: London, UK, 2018; pp. 28–42. [Google Scholar]
- Peralta, A.L.; Escudero, A.; de la Cruz, M.; Sanchez, A.M.; Luzuriaga, A.L. Functional traits explain both seedling and adult plant spatial patterns in gypsum annual species. Funct. Ecol. 2023, 37, 1170–1180. [Google Scholar] [CrossRef]
- Barna, M. Adaptation of European beech (Fagus sylvatica L.) to different ecological conditions: Leaf size variation. Pol. J. Ecol. 2024, 52, 34–45. [Google Scholar]
- Barna, M. Natural regeneration of Fagus sylvatica L.: A Review. Austrian J. For. Sci. 2011, 128, 71–91. [Google Scholar]
- Parker, G.G. Tamm review: Leaf Area Index (LAI) in both a determinant and a consequence of important processes in vegetation canopies. For. Ecol. Manag. 2020, 477, 118496. [Google Scholar] [CrossRef]
- Schlerf, M.; Atzberger, M.; Vohland, M.; Buddenbaum, H.; Seeling, S.; Hill, J. Derivation of forest leaf area index from multi- and hyperspectral remote sensing data. In New Strategies for European Remote Sensing; Oluic, M., Ed.; Millerpress: Rotterdam, The Netherlands, 2005; pp. 253–261. [Google Scholar]
- Marshall, J.D.; Waring, R.H. Comparison of methods of estimating leaf-area index in old-growth Douglas-fir. Ecology 1986, 40, 975–979. [Google Scholar] [CrossRef]
- Ramezani, M.R.; Bavani, A.R.; Jafari, M.; Peters, S. Investigating the leaf area index changes in response to climate change (case study: Kasilian catchment, Iran). SN Appl. Sci. 2020, 2, 501. [Google Scholar] [CrossRef]

Disclaimer/Publisher’s Note: The statements, opinions and data contained in all publications are solely those of the individual author(s) and contributor(s) and not of MDPI and/or the editor(s). MDPI and/or the editor(s) disclaim responsibility for any injury to people or property resulting from any ideas, methods, instructions or products referred to in the content. |
© 2025 by the authors. Licensee MDPI, Basel, Switzerland. This article is an open access article distributed under the terms and conditions of the Creative Commons Attribution (CC BY) license (https://creativecommons.org/licenses/by/4.0/).