Article

Experiments and Simulation on the Effects of Arch Height Variation on the Vibrational Response of Paulownia Wood

Key Laboratory of Bio-Based Material Science and Technology of Ministry of Education, Northeast Forestry University, Harbin 150040, China
*
Authors to whom correspondence should be addressed.
Forests 2025, 16(3), 545; https://doi.org/10.3390/f16030545
Submission received: 20 February 2025 / Accepted: 17 March 2025 / Published: 19 March 2025
(This article belongs to the Special Issue Wood Testing, Processing and Modification)

Abstract

:
Resonance boards of Chinese traditional instruments such as the Guzheng and Guqin typically are arched, with the arch height influencing their resonance characteristics. This study focuses on Paulownia wood utilized for resonance boards. The bottom surfaces were thinned in 1 mm increments, with vibration signatures acquired at each reduction stage using a multi-channel FFT analyzer. Subsequently, time-domain characteristic parameters of the signals were extracted through MATLAB-based signal processing. Modal and harmonic response simulations of the structure were conducted using finite element software. The results indicated that variations in arch height affected the frequency spectrum response of the vibrations of Paulownia wood, altering the structural energy radiation levels. Lower arch heights (0–2 mm) had a greater impact on the fundamental frequency. The arch height was 1 mm and 2 mm, with R1,1 and R1,2 being −5.31% and −8.62%, respectively. Skewness and kurtosis were negatively correlated with arch height. When ΔH was 3.06, the radiation effect was optimal. The changes in arch height influenced the vibrational modes and energy distribution of Paulownia. Higher arch heights (3–6 mm) have less effect on the fundamental frequency and impose some constraints on the mode vibration pattern. Furthermore, the results of the frequency-domain and time-domain analyses were found to be largely consistent with the finite element simulation results. The results provide guidance for changing the arch height to modulate the acoustic vibration response of the resonance board, which is of significance for the personalized design of future musical instruments.

1. Introduction

With the advancement of acoustic research, the impact of musical instrument structural design on timbre and expressiveness has gained increasing attention. In particular, the sound quality of wooden instruments is influenced not only by playing techniques but also by the material and structural design of the instrument’s resonance boards [1,2,3,4]. The selected wood should have basic properties such as appropriate density, moisture content, and modulus of elasticity [5,6,7]. Additionally, structural parameters such as thickness distribution and curvature play a critical role in shaping the vibrational behavior [8,9,10].
Research has demonstrated that the thickness of the pipe wall significantly impacts the sound of an organ, with reductions in back wall thickness leading to decreases in natural frequency [11]. However, studies on optimizing the structural parameters of resonance boards for musical instruments remain limited, particularly regarding the specific effects of the key parameter, arch height, on vibration response, which have not been fully explored. In the design of Chinese traditional musical instruments (e.g., Guzheng) and Western stringed instruments (e.g., violin, cello, etc.), the resonance plate typically has a certain thickness and is not completely flat but slightly arched [12,13]. Arch height is the height of curvature of the resonance board, i.e., the vertical distance between the highest point in the center of the resonance board and the plane of its edges [14,15], which is achieved by chipping, pressing, or steam bending the wood, etc. [16]. Different arch heights affect the vibration modes of the resonance board [17]. In a series of experiments with wooden plates, it was observed that plates exhibiting a thinner center and thicker ends produce a sound characterized by softness and mellowness. Conversely, plates that are thicker in the center and thinner at the ends tend to generate a sound that is harder and more pronounced. When the ends of these plates are fixed, the former type yields a higher fundamental frequency, while the latter is associated with a lower fundamental frequency. From the acoustic point of view, variations in arch height alter the rigidity distribution and vibration response of resonance boards. This design allows them to more efficiently excite air vibrations when transmitting string vibrations, thereby enhancing the acoustic effect [18]. For instance, the resonance board of the Guzheng is designed to be thinner at the edges and thicker in the center, with a specific arch height, creating a distinct curved morphology. This design enables resonance boards to form a series of specific vibration modes when vibrating [19]. The relationship between these vibration modes and their frequencies exhibits a pronounced division characteristic. Traditionally, the process of adjusting arch height relies heavily on the expertise of skilled craftsmen, who determine the optimal parameters through repeated trials and listening calibrations. While this approach has preserved the artistry and individuality of instrument-making, it has inherent limitations, including subjectivity, lack of quantifiability, and difficulty in meeting the demands of mass production. These challenges highlight the need for a more systematic and precise method.
With advancements in modern technology, particularly the introduction of computational modal analysis, a scientific foundation has been established for the design and optimization of resonance boards [20,21,22,23]. Computational modal analysis can simulate the effects of different structural parameter adjustments on the vibration modes while keeping other parameters (e.g., dimensions, material properties) unchanged [24,25]. Modal shapes, which describe the vibration patterns of resonance boards at specific frequencies [26]. For instance, a modal response analysis of a guitar’s top plate revealed that different vibration modes contribute uniquely to low and high frequencies. By altering the structural parameters of the resonance board, the modal distribution can be optimized, thereby enhancing tonal performance within specific frequency bands [27]. Thus, computational modal analysis offers a powerful and reliable approach for exploring the complex relationships between arch height and the vibration characteristics of resonance plates. It offers significant advantages over traditional trial-and-error methods by providing a faster and more cost-effective approach to achieving the desired acoustic outcome. In this way, researchers and musical instrument manufacturers will be able to analyze and predict vibrational behavior more accurately and build high-quality instruments more efficiently. This approach not only accelerates the design process but also ensures that each instrument can be finely tuned to meet specific acoustic goals, resulting in better overall sound quality and consistency.
The quantitative effects of arch height variations remain underexplored, particularly in comparison to advances in mechanical vibration systems. Most studies have focused only on the thickness of arched resonance plates, without considering that the arch height may vary across different parts. In contrast, this study extracts a single arch height parameter and investigates Paulownia timber, a material widely used for musical instrument resonance boards, to examine the influence of arch height variation on its vibration spectrum and the underlying relationship between arch height and time-domain vibration characteristics. Furthermore, the finite element method was utilized to uncover the influence of arch height on modal shapes and harmonic response. This research investigated the vibrational behavior of the resonance board by adjusting the arch height, providing valuable references for the personalized design and optimization of resonance boards in future musical instruments.

2. Materials and Methods

2.1. Materials

The selected Paulownia timber was approximately 30a, and all materials were obtained from quarter-sawn heartwood boards, with a scar-free surface. The initial specimens were 300 mm (L) × 50 mm (R) × 10 mm (T) rectangular boards. The moisture content was equilibrated to about 10%. The structural design is based on a face-dug Guzheng (Figure 1). After the top surface of the rectangular specimen was machined into an arch, the thickness change from the bottom surface was recorded as the arch height H (i.e., the maximum height from the horizontal plane to the bottom surface of the specimen) each time it was thinned. The thinning method is shown in Figure 2, and each structural parameter is shown in Table 1.

2.2. Experimental Tests

2.2.1. Frequency Spectral Measurement

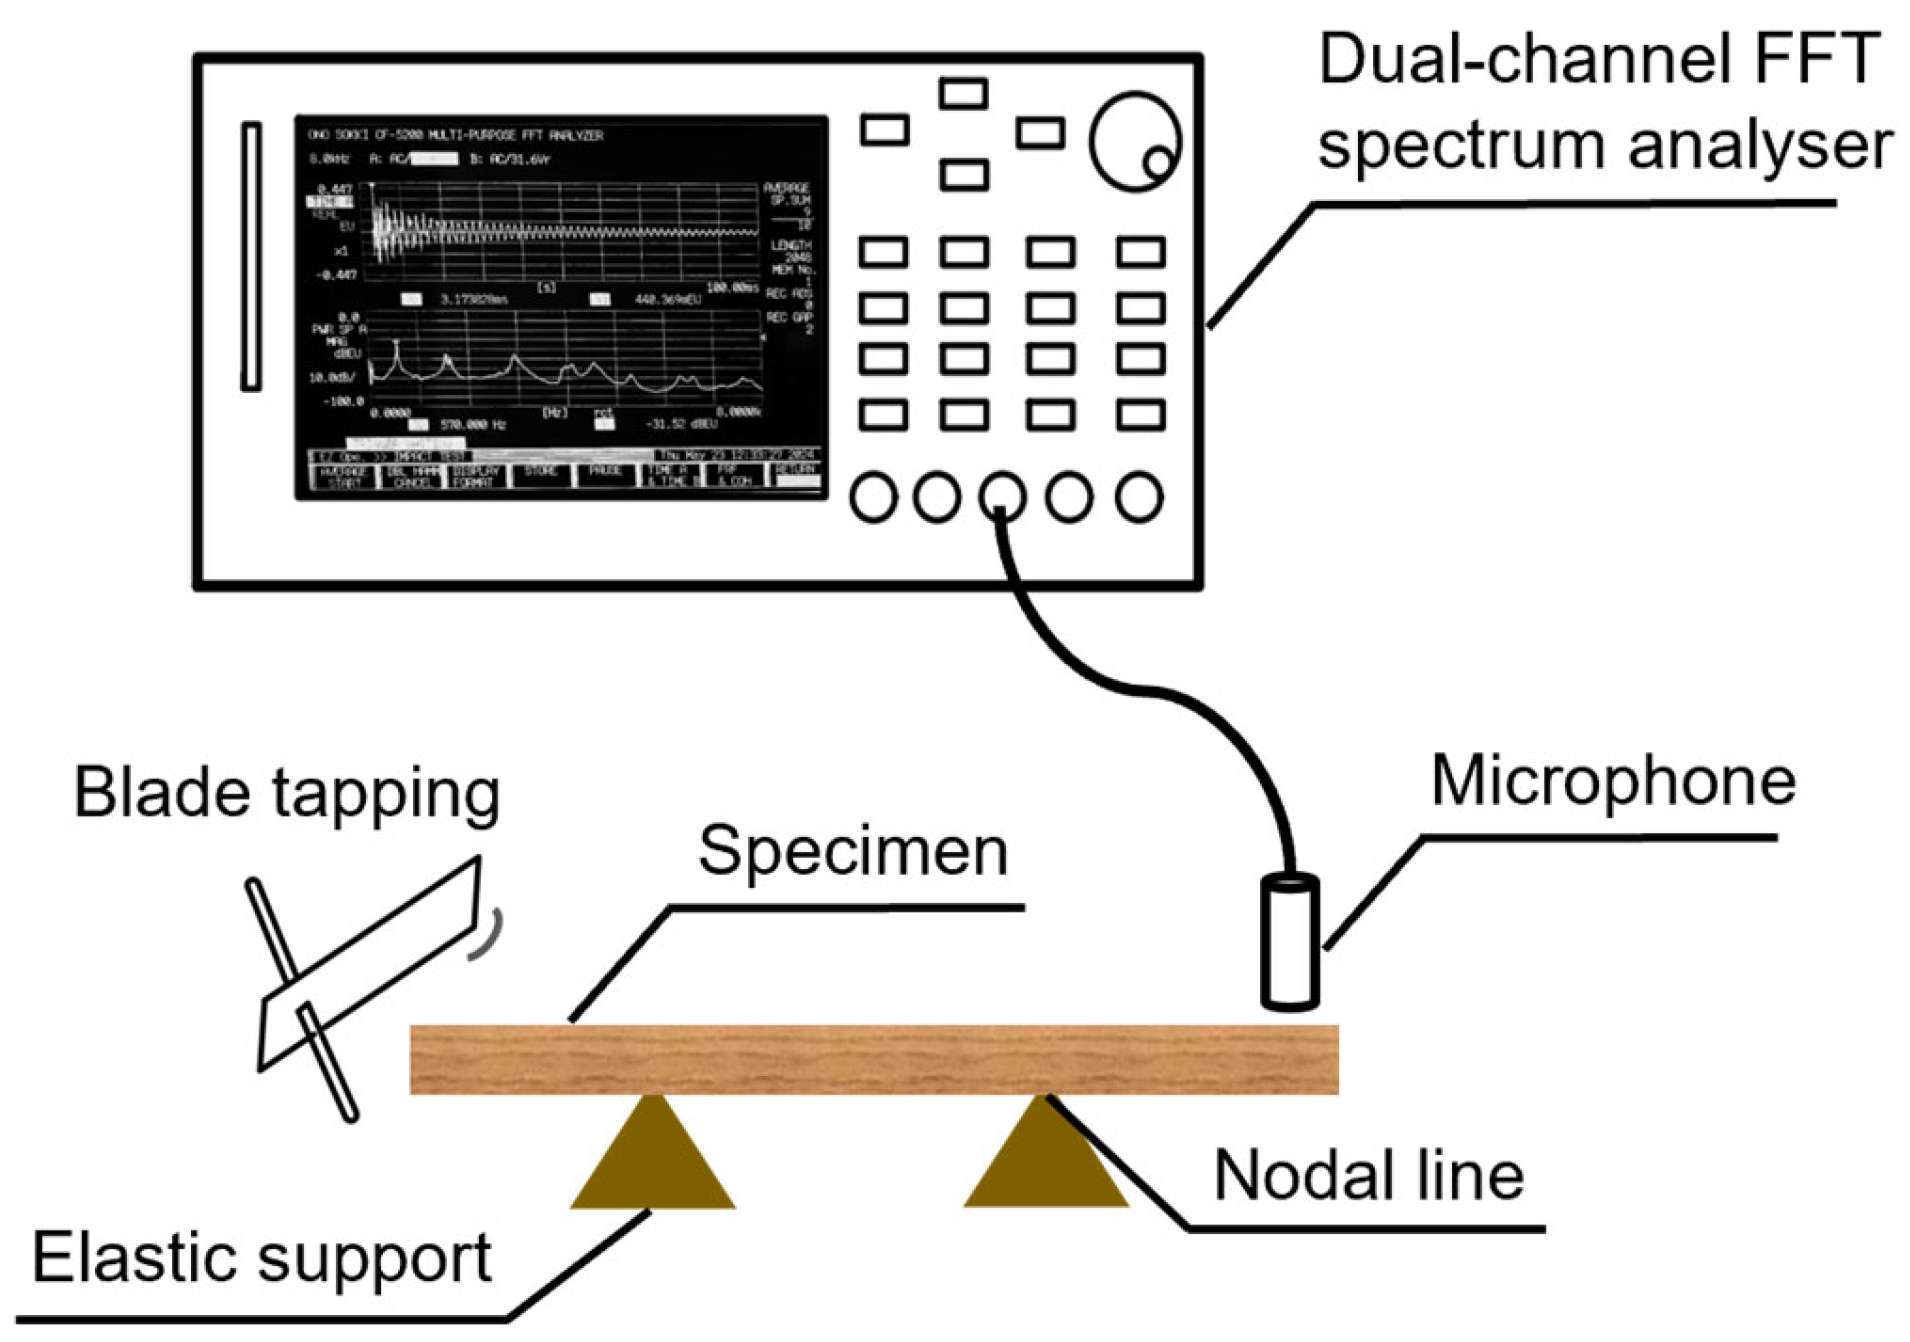
Based on the vibration theory of beams, the boundary conditions with two free ends were adopted [28]. Since the specimen had an irregular structure, the minimum displacement points of the specimen under different arch heights were obtained using ANSYS Workbench (2021 R1), and the differences in their values were around 0.2 mm. The first-order nodal line positions were approximately equivalent to those of the beam specimen. A schematic of the experimental setup is shown in Figure 3.
The specimen was thinned by approximately 1 mm at a time, supported by a triangular bracket at the first order node line of the specimen, and excitation was applied by tapping the end of the specimen with a blade to produce free vibration. The excitation was repeated ten times, and the average value was taken for each measurement. The microphone (MI-1233, Ono Sokki, Yokohama, Japan) captured the resulting vibration signals and transmitted them to a multi-channel Fast Fourier Transform (FFT) analyzer (CF-5220Z, Ono Sokki, Yokohama, Japan), which processed the signals into discrete data in both the time and frequency domains. The sampling frequency is 6400 Hz, the time of data acquisition is 0.1 s, and the number of samples is 2048. The sensitivity of the microphone is 316 mVr.
The analyzer identified the first six resonance frequencies and calculated the specimen’s logarithmic attenuation rate after each thinning, along with the frequency variation rate for each resonance mode.
The logarithmic attenuation rate (δ) quantifies the energy loss in wood caused by friction during free vibration as follows:
δ = l n A 1 A n + 1 ,
where A1 and An+1 are the amplitudes of two consecutive vibration cycles.
The rate of frequency change (Rn,i) can be defined as the relative amount of change in the nth order frequency after two adjacent specimen thinnings as follows:
R n , i = f n , i f n , i 1 f n , i 1 × 100 % ,
where fn,i and fn,i−1 are the nth order rates of change for arch heights i and i − 1, respectively.

2.2.2. Time-Domain Feature Extraction

MATLAB has a wide range of applications in signal processing, particularly in vibration signal analysis [29,30]. Its principle of calculating time-domain eigenvalues is based on classical mathematical definitions and statistical methods in signal processing, and the main eigenvalues of vibration signals are extracted by analyzing the input time series signals. These characteristic values reflect important information such as the energy distribution, waveform shape, and amplitude variation in the signals, providing reliable data support for the analysis of vibration signals [31]. Consequently, the vibration response data obtained through FFT was imported into MATLAB (R2023a) as numerical matrices to compute fundamental time-domain characteristic parameters, including the mean value and root mean square.
The relative change in arch height ΔH is defined as the ratio of the difference between the current arch height (Hi) and the initial arch height (H0) to the initial arch height as follows:
Δ H = H i H 0 H 0 .
The peak-to-peak value (Ppp) is the difference between the peaks and troughs of the vibration signal, indicating its amplitude as follows:
P p p = m a x ( x i ) m i n ( x i ) .
Kurtosis (K) is commonly used to detect shock components in vibration signals and indicates the degree of waveform smoothing, which is used to describe the distribution of the variable as follows:
K = 1 N i = 1 N ( x i μ M e a n ¯ ) 4       ( x R M S ) 4 .
Skewness (S) is commonly used to describe the symmetry of a signal as follows:
S = 1 N i = 1 N ( x i μ M e a n ¯ ) 3       ( x R M S ) 3

2.3. Finite Element Simulation

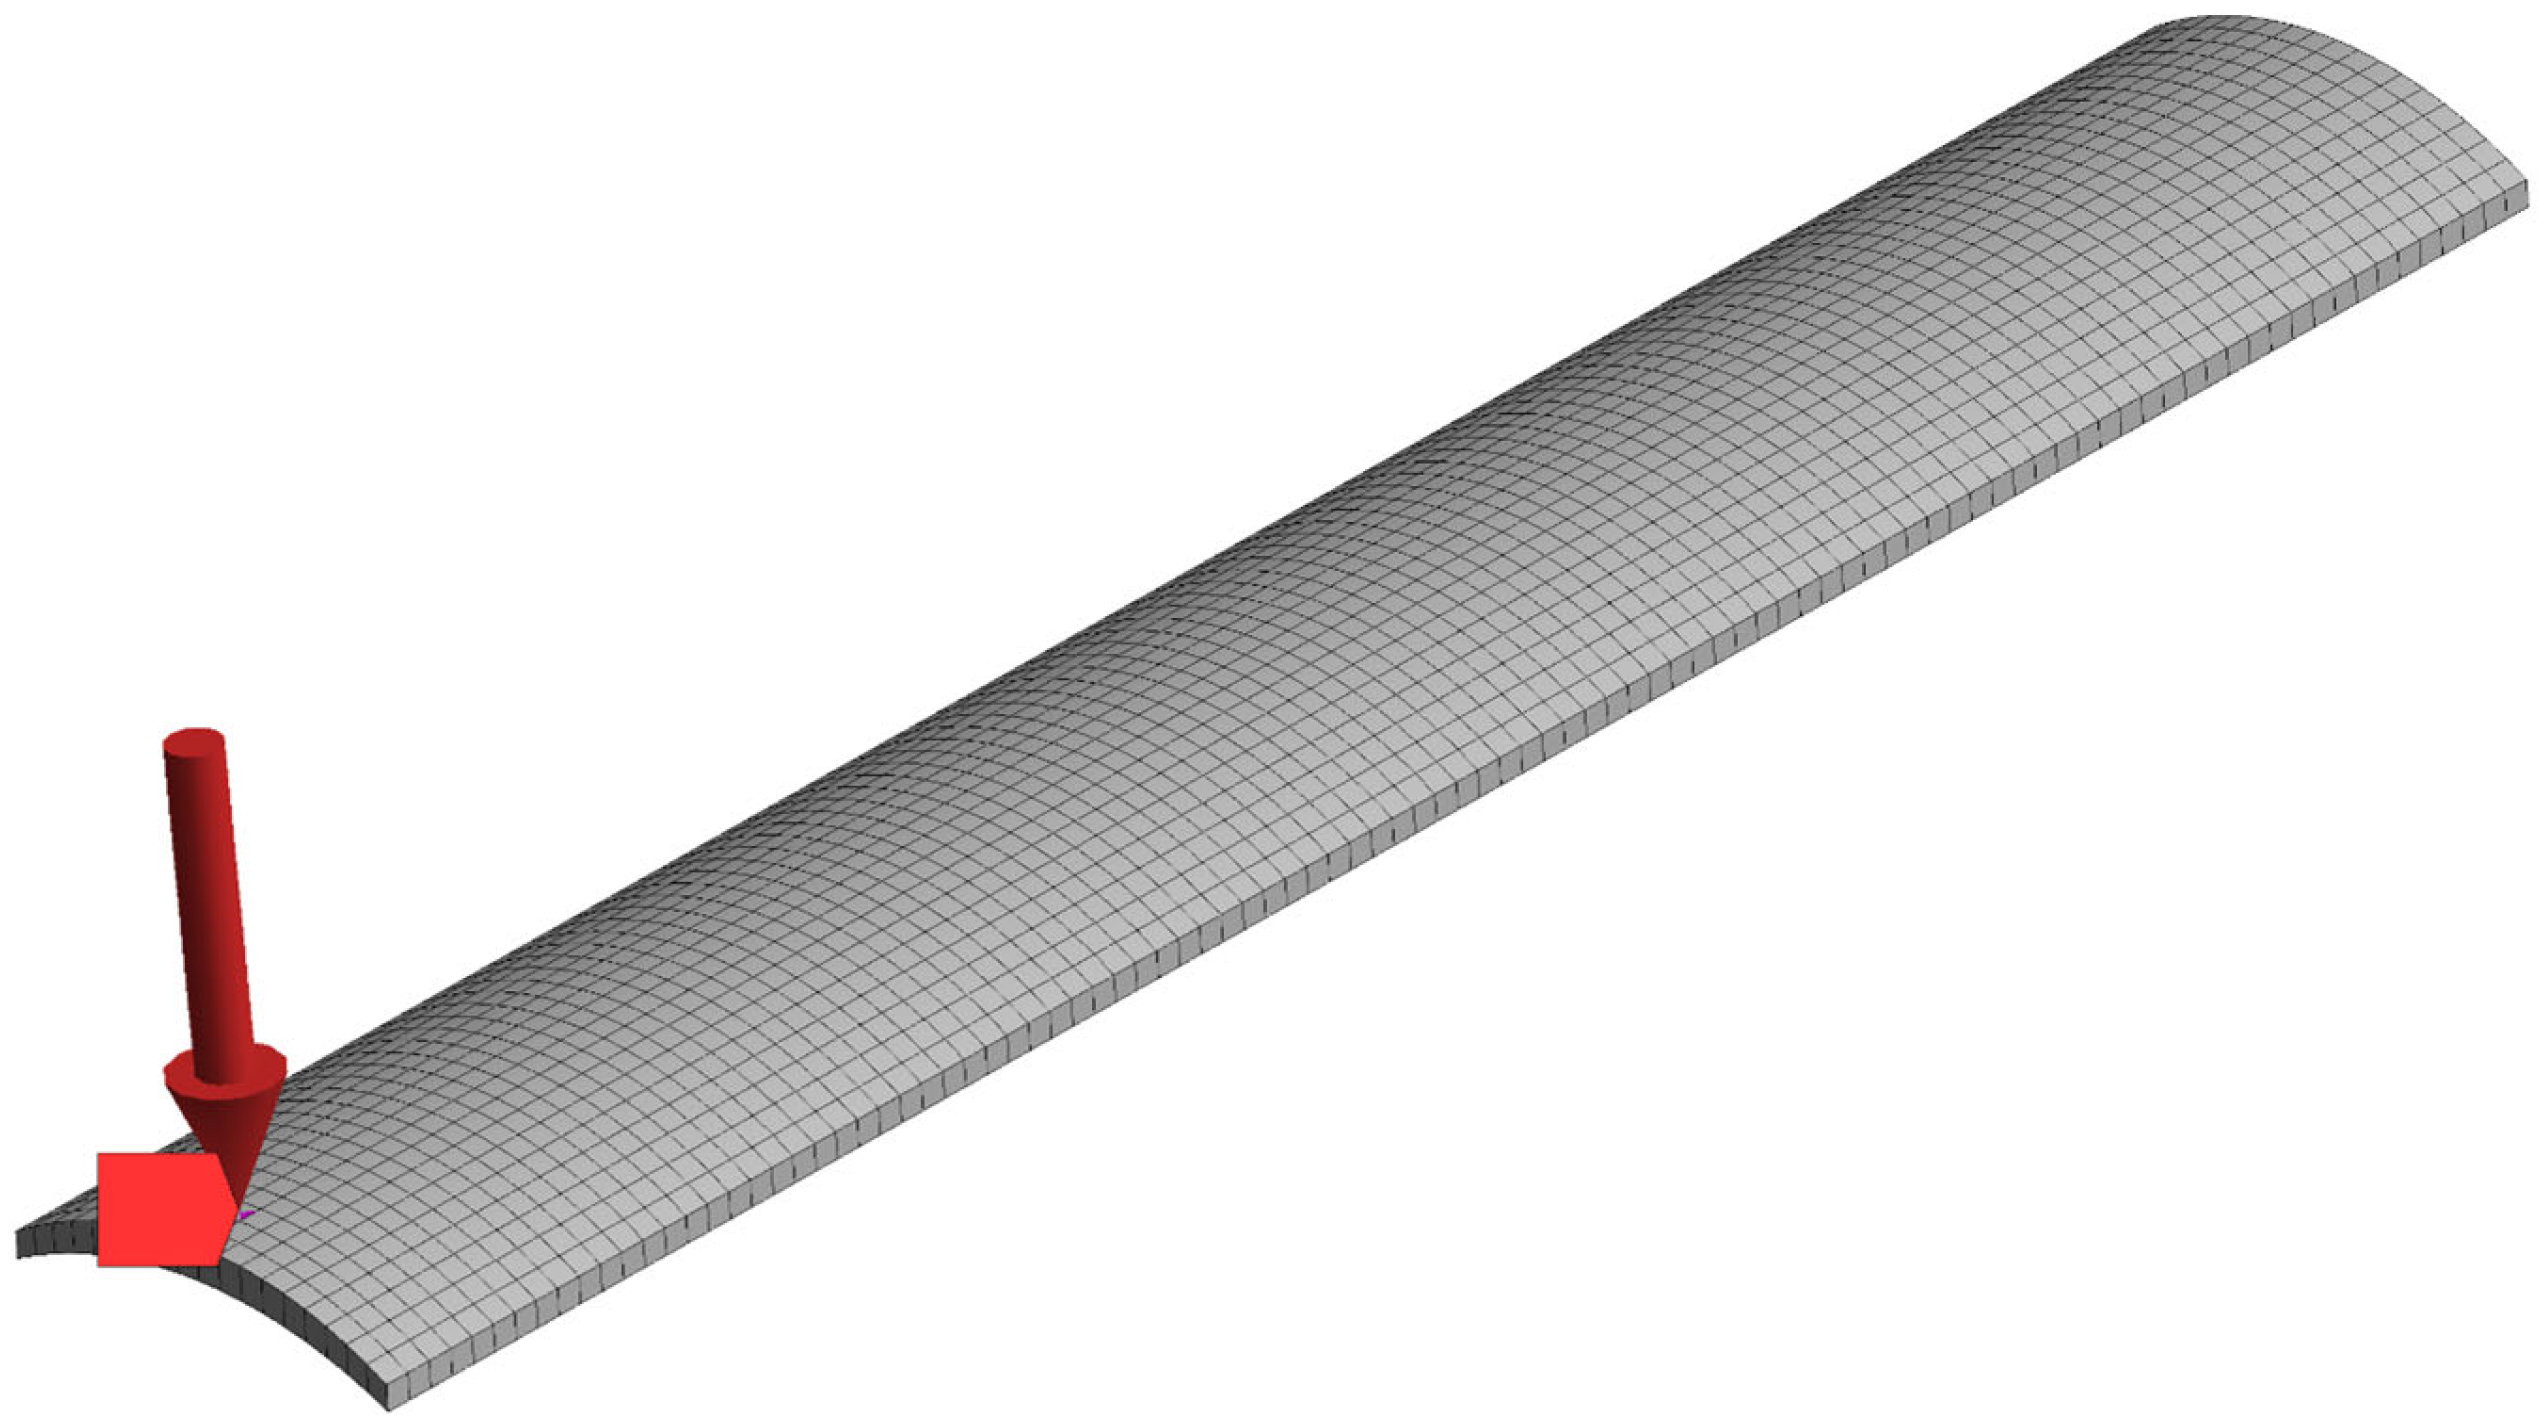
The overall dimensions of the model were set to 300 mm (L) × 50 mm (R) × 3 mm (T1 and T2) based on the specimen dimensions. To ensure the simulation model closely approximated the real material and minimized errors, material parameters such as density, elastic modulus, shear modulus, and Poisson’s ratio were assigned in ANSYS Workbench. The geometric model of the structure was meshed with an element size of 3 mm, and the solution order was set to 25. The transverse bending vibration tests were conducted under free–free boundary conditions in the laboratory, where the specimens were considered to approximate a free state during vibration. Consequently, no displacement constraints or external loading conditions were applied to the computational modal analysis model to ensure consistency with the experimental setup, and appropriate elements were selected to apply small pressures for solving the harmonic response of the structure.
One of the models generated in the ANSYS Workbench is shown in Figure 4. The arrow indicates the direction of pressure and the red marker indicates the stimulation point. Material parameters of the Paulownia samples used in this study are listed in Table 2, while analytical settings are shown in Table 3.

3. Results and Discussion

3.1. Results of the Experimental Tests

3.1.1. Frequency Domain

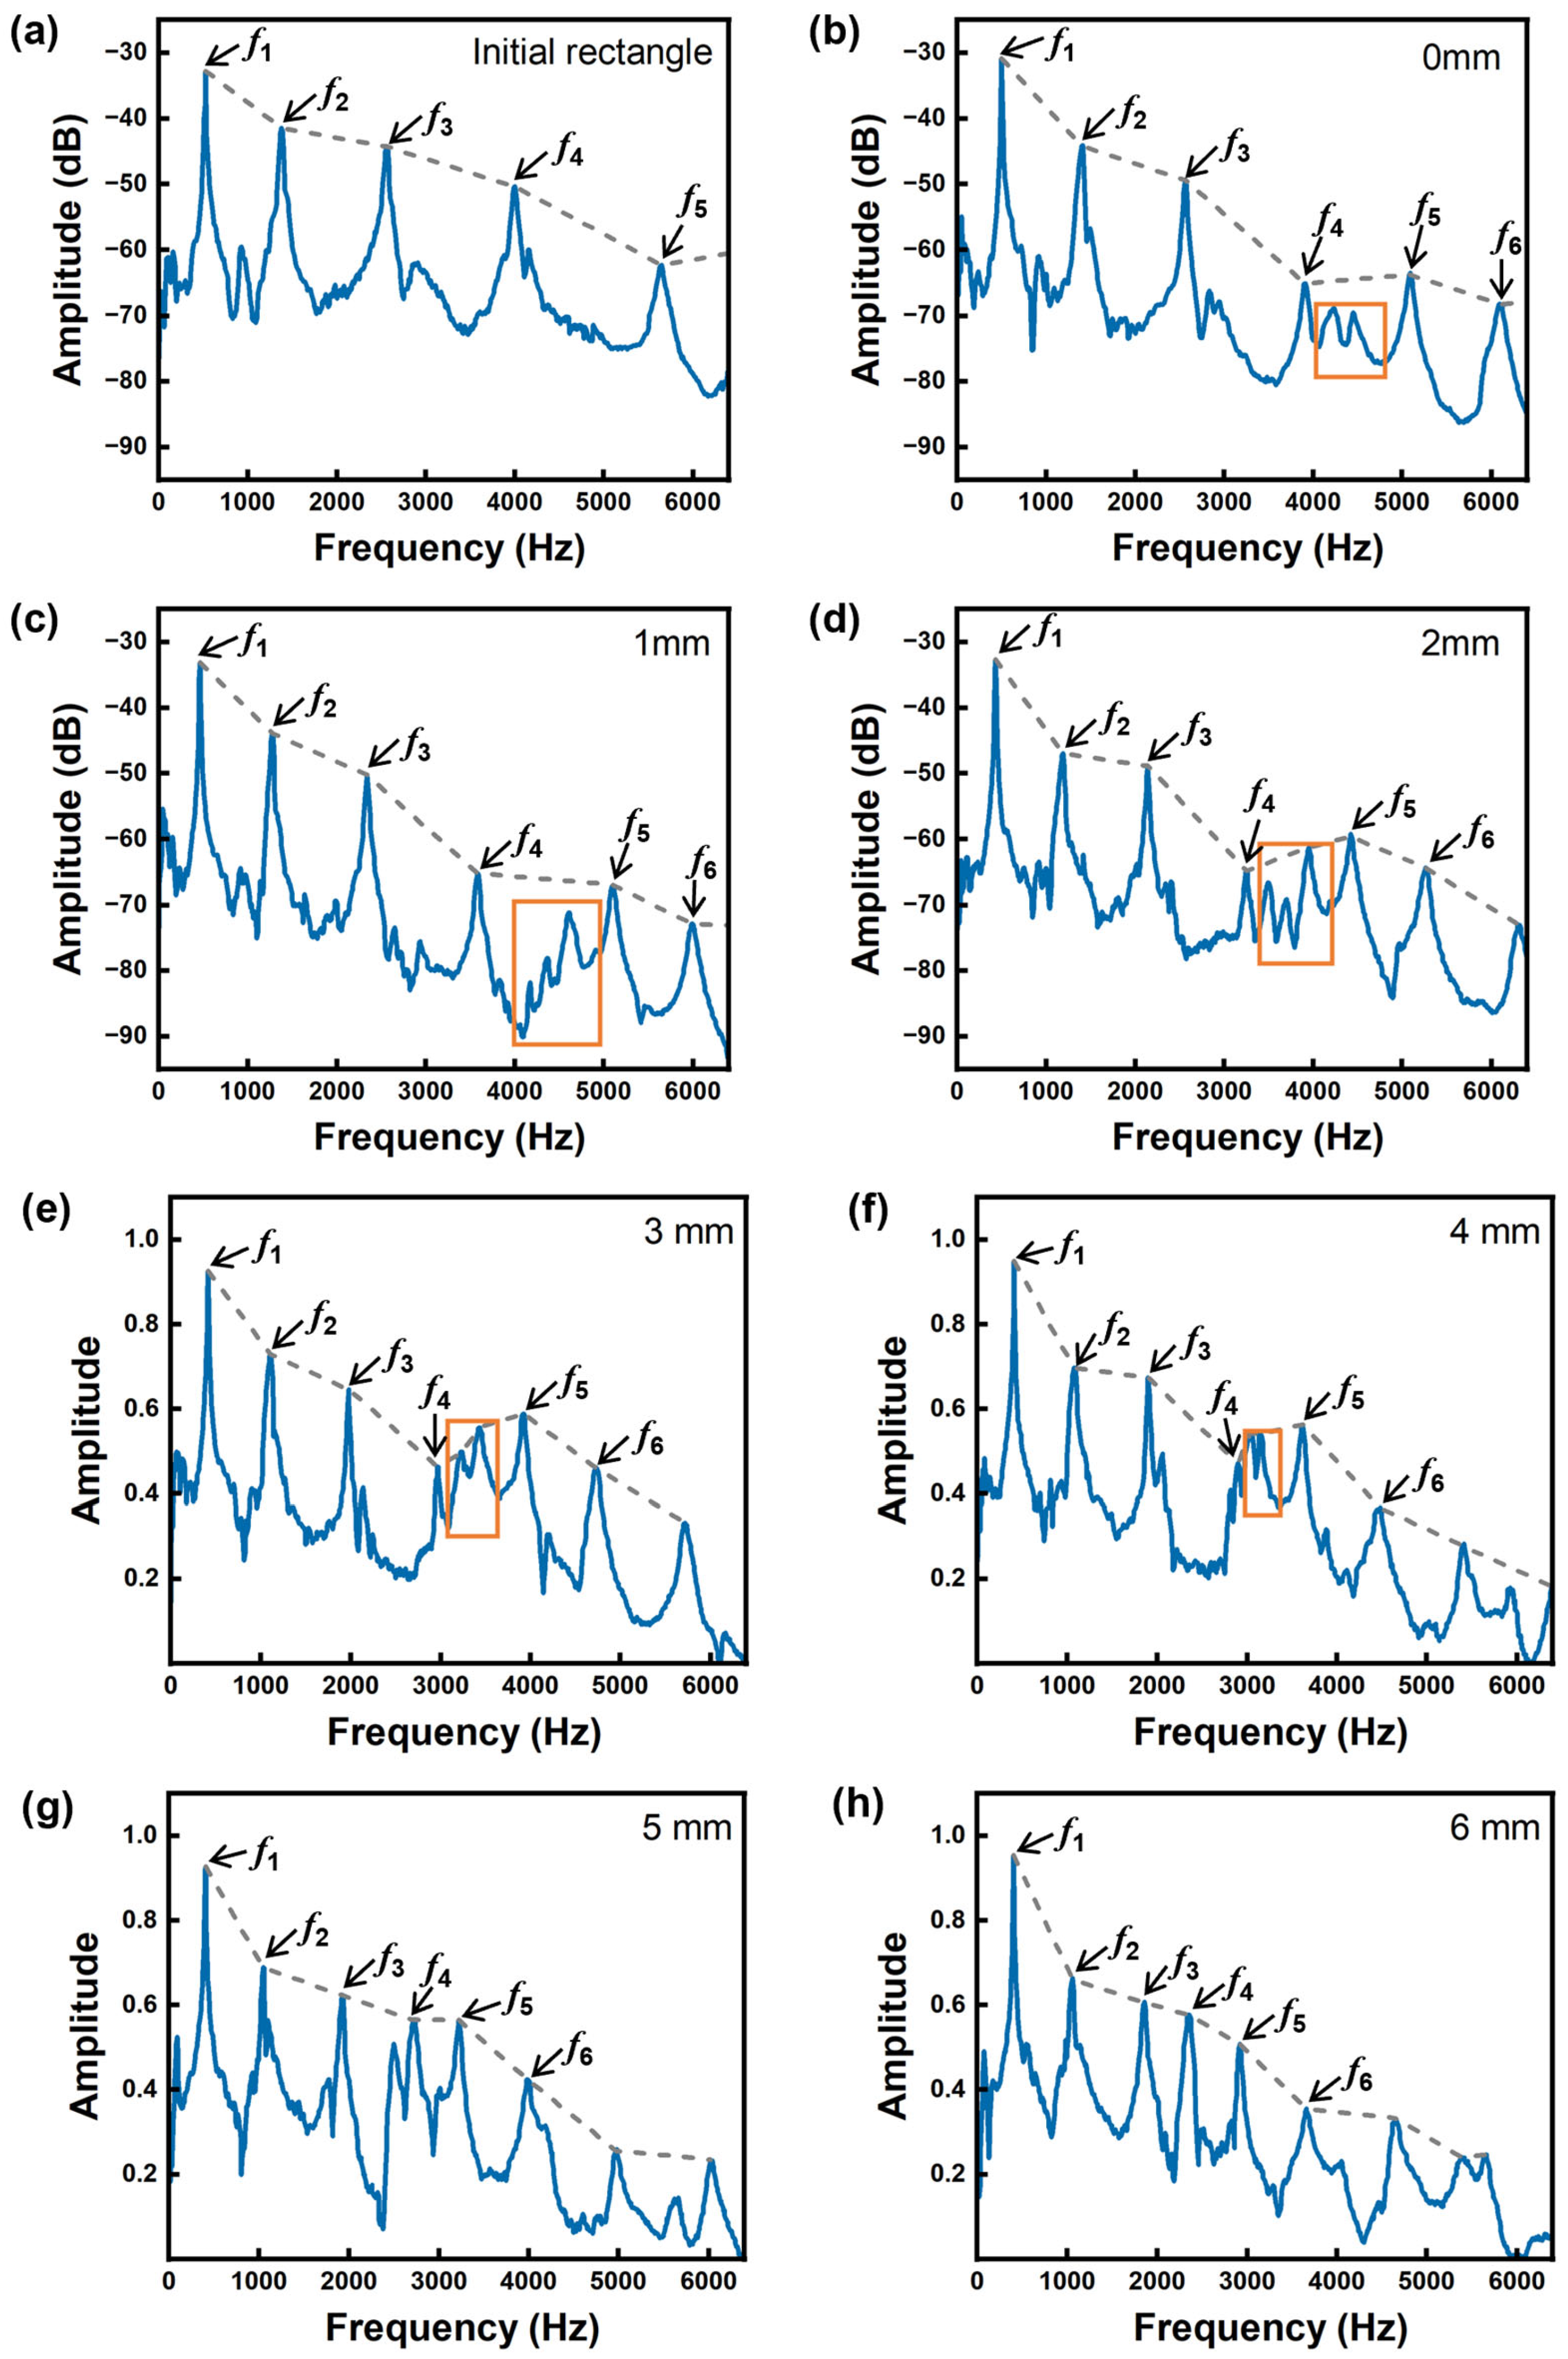
Changes in arch height alter the resonance frequency of wood by affecting its stiffness and mass distribution [29]. The spectrum reflects the frequency composition of the wood’s vibration signal and the distribution of vibration energy across its frequency components. The envelope, represented by the curve connecting the peaks of each spectral cycle, plays a crucial role in characterizing the steepness of the spectrum. The steepness of the envelope influences the transient characteristics of sound intensity [33]. Additionally, the resonant frequency is linked to the timbre of the wood, particularly the lower-order resonant frequencies. Comparing the rate of change in resonant frequencies provides insight into the sensitivity of different modes to adjustments in arch height. The study normalizes the data of the frequency spectrum, and the spectral envelopes of samples with varying arch heights are illustrated in Figure 4.
Changes in arch height resulted in the emergence of more peaks between f4 and f5, which became increasingly concentrated as the arch height increased, ultimately disappearing. When the specimen was initially rectangular, its envelope was the smoothest. When the top surface was machined into an arch shape while the bottom surface remained unthinned, the arch height was 0 mm (Figure 5b); several frequency components with similar amplitudes were observed between f4 and f5. After machining the specimen into an arch and adjusting the arch height to 1 mm (Figure 5c), these frequency components became concentrated at 4000–5000 Hz, and the spectral envelope appeared smooth compared to the 0 mm. This indicated that adjusting the arch height at this stage had less influence on the frequency distribution. When the arch height increased to 2 and 4 mm (Figure 5d–f), the peaks of f5 and f6 increased significantly. The spectra displayed a zigzag pattern. The peaks of f3 and f5 were higher, while the peak of f4 was lower. The spectral envelope was steep and zigzaggy, which indicated that the energy was unevenly distributed in the frequency domain. As the arch height was further increased to 5 mm (Figure 5g), the amplitude of the frequency spectral envelope curve decreased, and the overall envelope became smoother. The energy radiated more evenly across the frequency domain, improving the tonal performance of the sample. When the arch height was increased to 6 mm (Figure 5h), the peak patterns of the resonant frequencies of each order became sharper and relatively concentrated, and the frequency distribution was further concentrated in the middle and high-frequency bands, which significantly enhanced the energy radiation in the middle and high-frequency ranges. Meanwhile, the frequency component between f4 and f5 disappeared, which can be attributed to the increased arch height modifying the resonance pattern of the specimen.
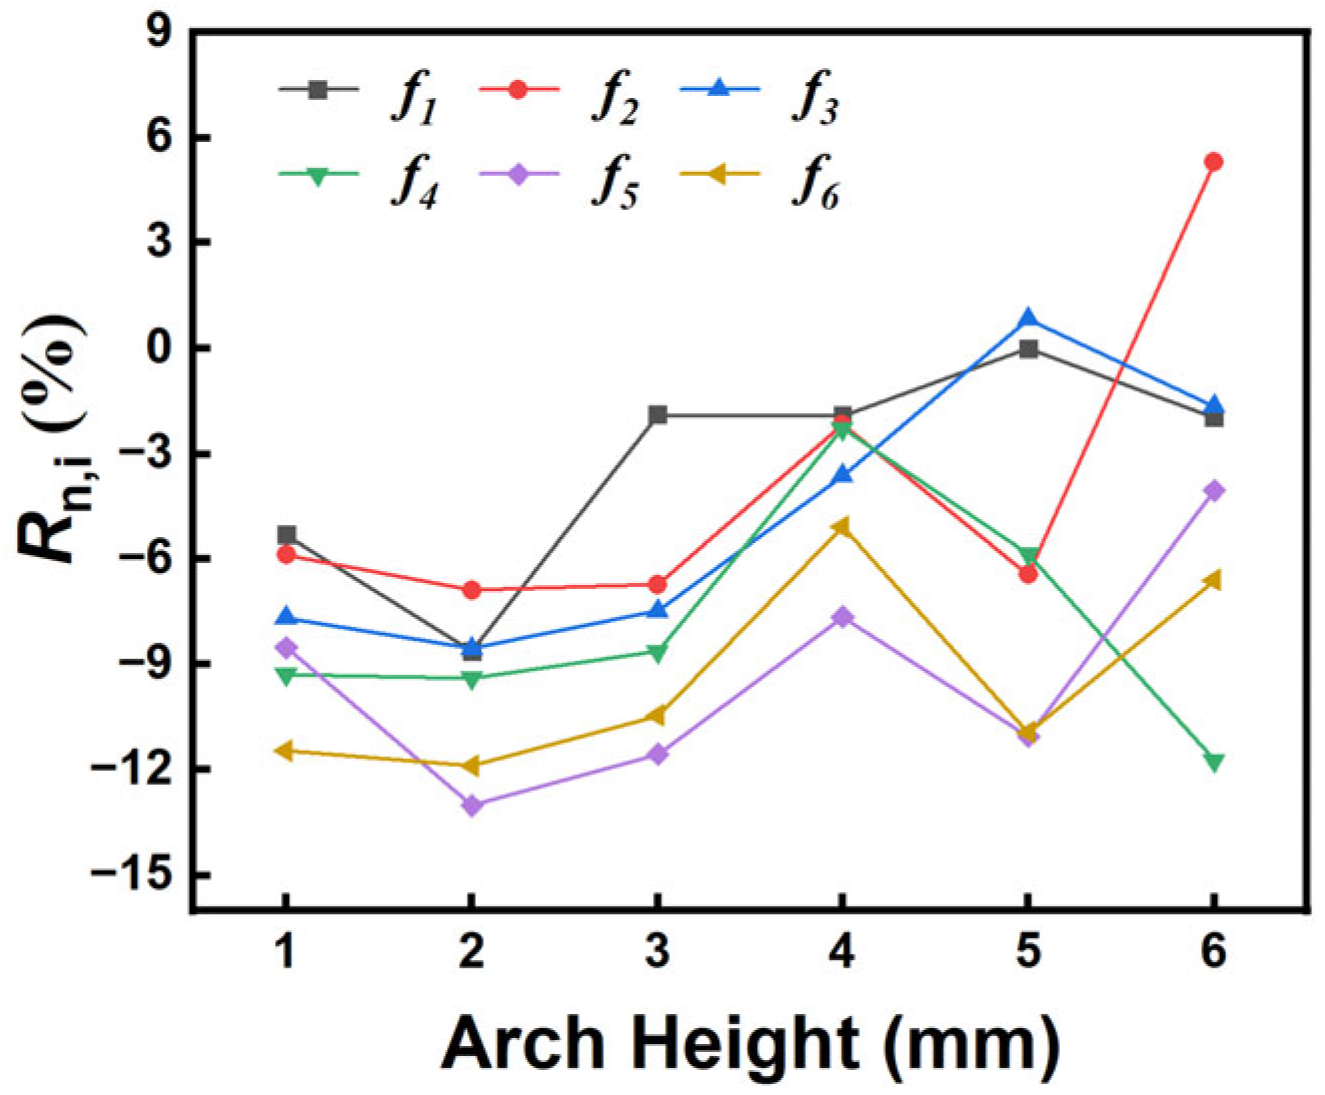
As shown in Figure 6, the natural frequency was more sensitive to structural changes when the arch height was 1 mm and 2 mm, with R1,1 and R1,2 being −5.31% and −8.62%, respectively. As the arch height increased, the rate of change in the fundamental frequency stabilized, with a decrease of approximately 2% after each thinning. This was because the fundamental frequency was primarily influenced by the overall stiffness of the specimen, and since Paulownia wood has relatively low rigidity, the increase in arch height had a smaller impact on its stiffness. The higher-order frequencies (f4, f5, f6) showed a higher sensitivity to changes in arch height, with f5 and f6 following the same trend. In the range of 1–3 mm, their rate of change was around 11%. At 4 mm, the relative changes in the frequencies were generally smaller. After thinning from 5 mm to 6 mm, the rate of change for each frequency, except for the fundamental frequency, fluctuated more significantly compared to the previous thinning. This model can serve as a reference for resonance plates with curved shapes and a certain thickness at the edges. By combining modal analysis results, the arch height can be appropriately adjusted to enhance energy radiation within the desired frequency range, thereby controlling the vibrational response characteristics of the resonance plate.

3.1.2. Time Domain

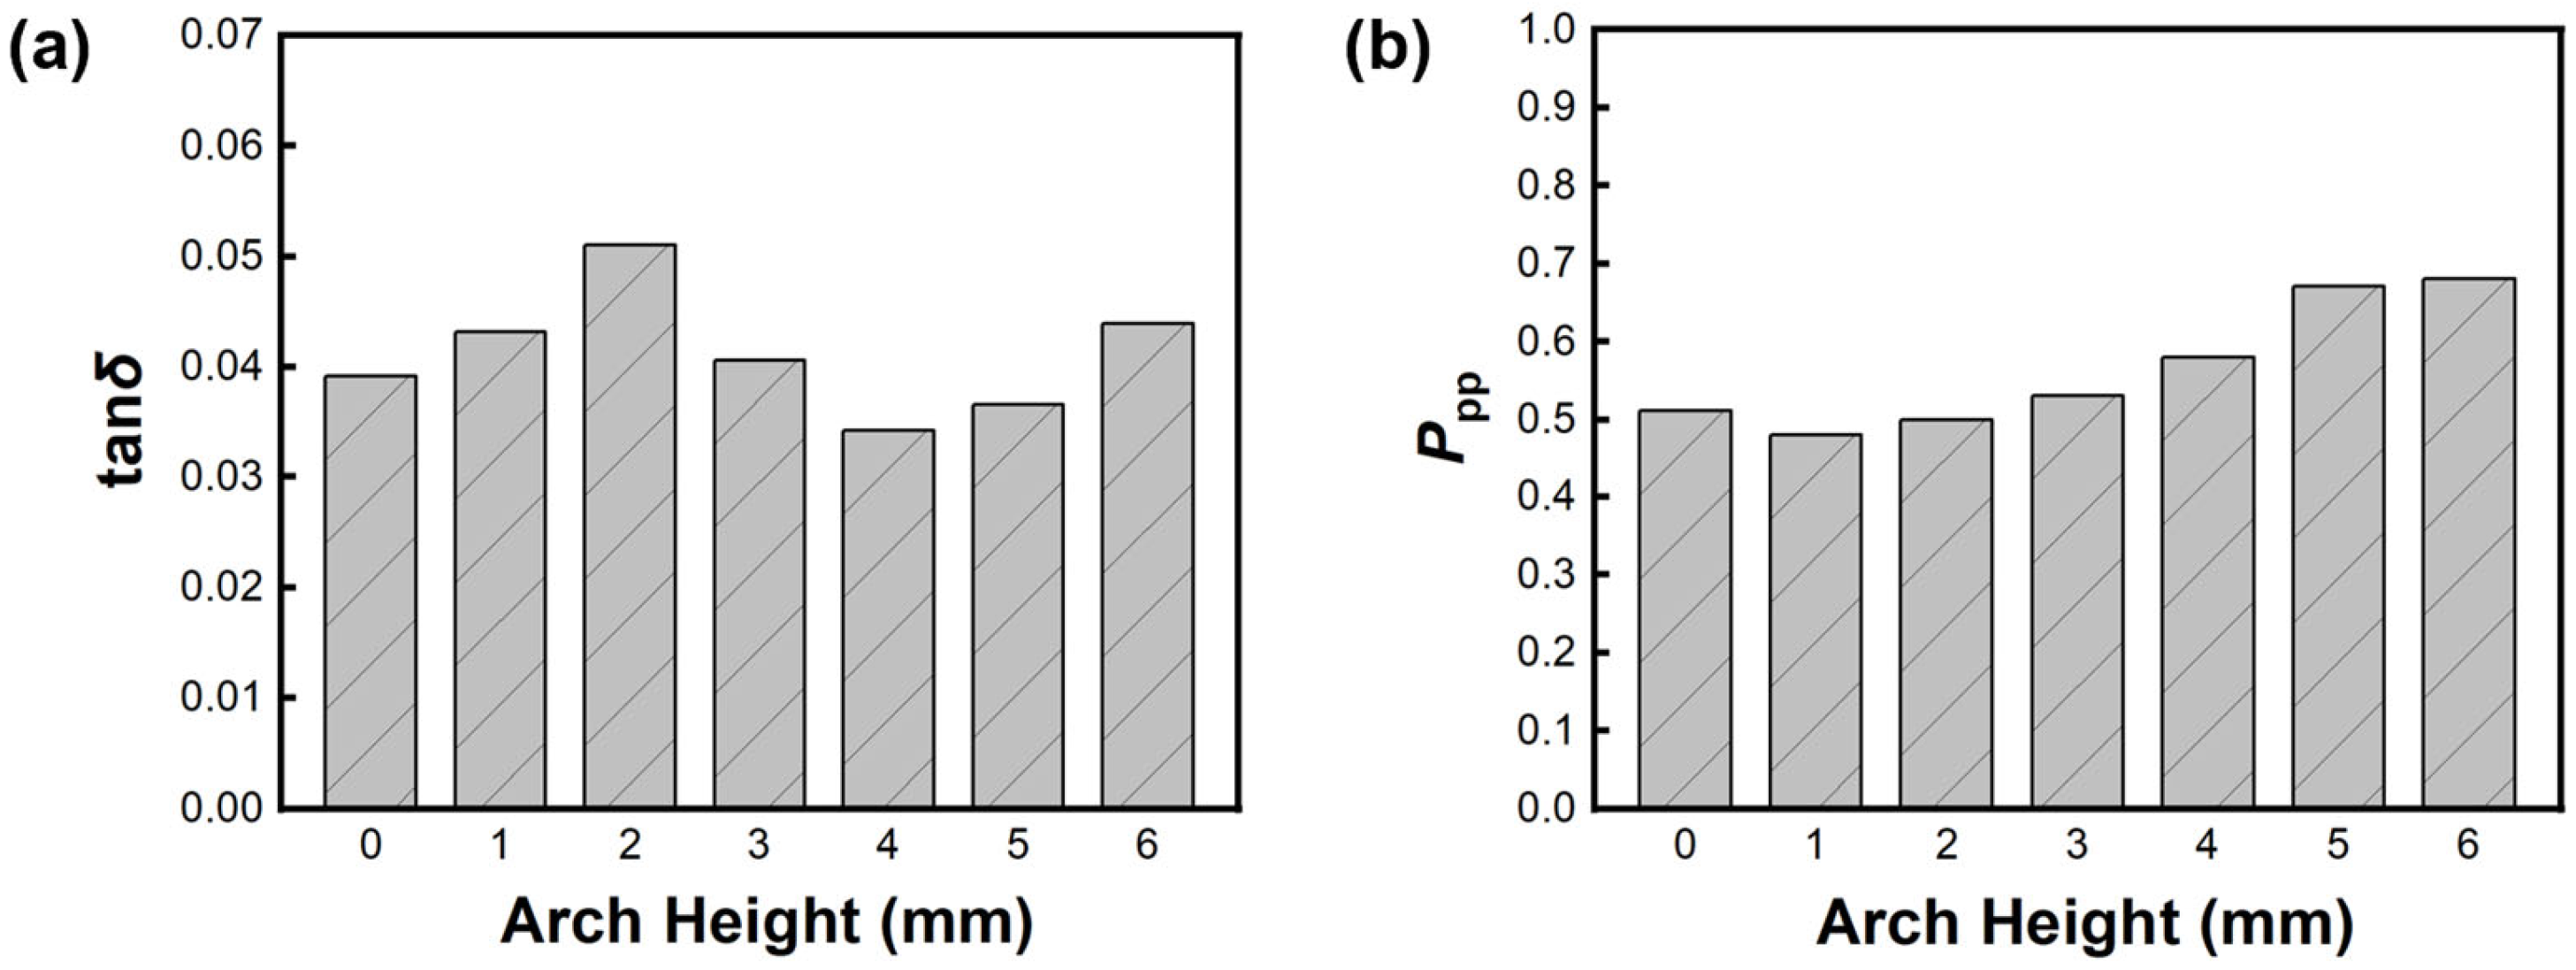
When wood is struck, the resulting sound does not fade away immediately but lingers for a period, creating a gradual decay effect. In acoustics, the duration of the sound and its decay process are often described and analyzed using the logarithmic decay rate [34]. Wood with a low logarithmic decay rate is ideal for constructing resonance plates for musical instruments, as the slower decay rate helps preserve a certain level of sustain, contributing to a fuller and richer sound. In this study, additional time-domain characteristic parameters of the acquired signals (Figure 7) were extracted using MATLAB and were analyzed and compared across various aspects (Figure 8 and Figure 9).
δ serves as a key measure of vibration signal decay. As the arch height increased, the logarithmic decay rate of Paulownia wood exhibited a fluctuating trend, while the peak-to-peak value gradually increased and then stabilized. When the arch heights were 4 mm and 5 mm, δ was relatively small, measuring 0.34 and 0.36, respectively. This indicated a slower energy decay rate in the vibration signals, suggesting minimal energy dissipation during the vibration process and resulting in a longer sound sustainment duration. This allowed the sound to travel further and sustain a longer period of sound quality (Figure 8a).
The peak-to-peak values reflect the elasticity and impact properties of the wood. Ppp increased gradually with increasing arch height, especially after the arch height of 3 mm, where the increase was more significant, indicating that ΔH greater than 3.06 caused specimens to release more vibrational energy (Figure 8b).
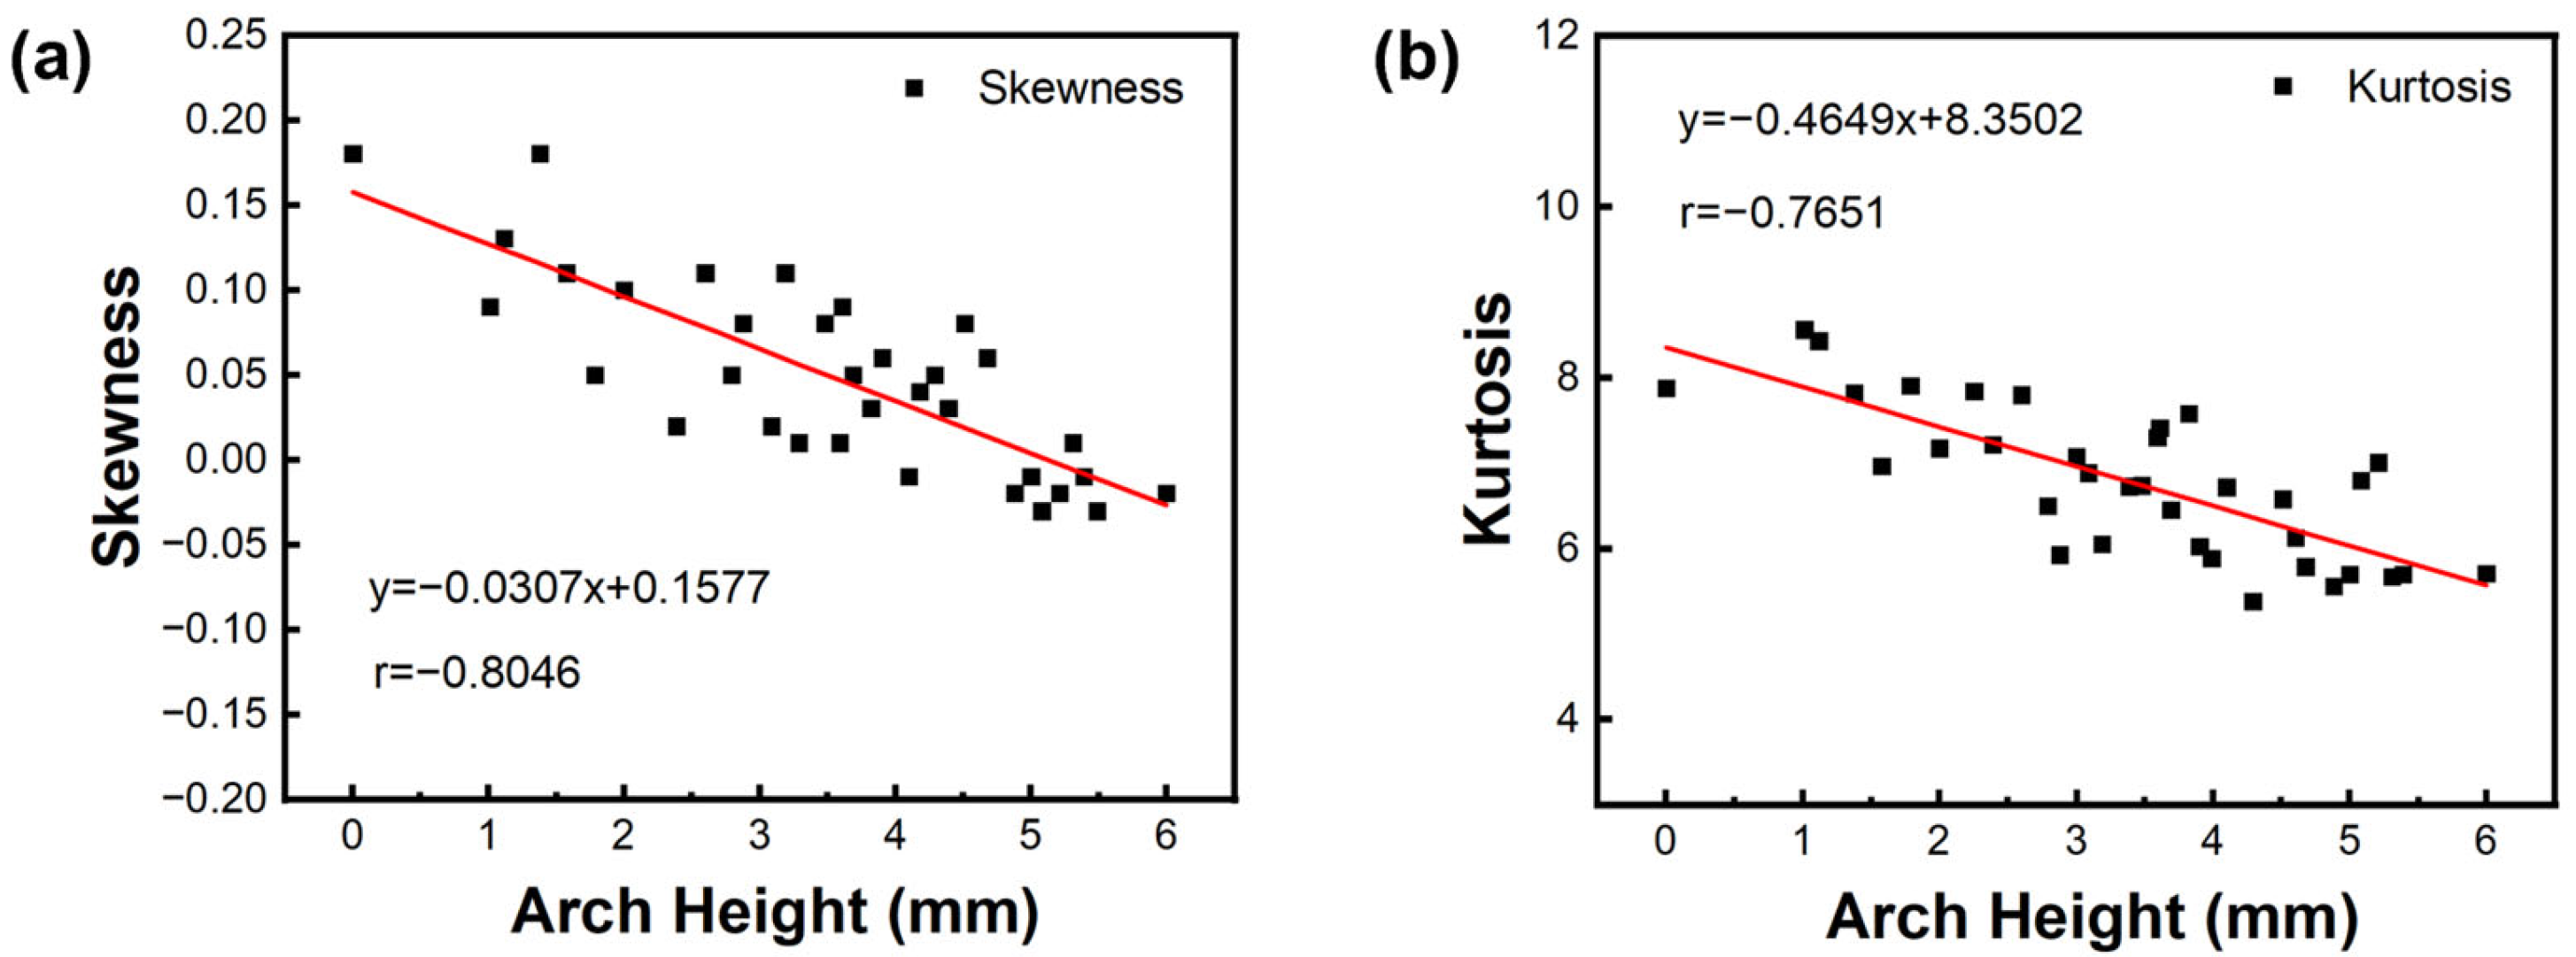
During the thinning process of the specimen, its vibration signals were measured multiple times [35]. These signals were used to analyze the relationship between skewness, kurtosis, and arch height. Both skewness and kurtosis were significantly and negatively correlated with bubonic arch height, with correlation coefficients of −0.8046 and −0.7651, respectively (Figure 9).
In Figure 9a, as the arch height increased, the skewness gradually decreased and approached zero at approximately 4.8 mm. This finding suggests that when ΔH was around 3.90, it facilitated energy transfer. Kurtosis, on the other hand, is a statistical metric that characterizes the distribution of a vibration signal and is used to evaluate the smoothness of the waveform and the concentration of vibrational energy in the wood. As shown in Figure 9b, kurtosis also exhibited a decreasing trend as arch height increased. As the arch height increased, kurtosis gradually decreased, indicating that the waveform became smoother, allowing for better transmission of signal energy.
Therefore, when adjusting the arch height of the resonance panel, it is advisable to select an arch height with a high Ppp, a low δ and K, and S close to zero to enhance the energy radiation of the resonance board. However, it should be noted that while a smaller δ can enhance sound sustain, it may result in overly prolonged residuals, potentially affecting clarity.

3.2. Results of Finite Element Simulation

3.2.1. Modal Shapes

Changes in vibration modes influence the performance and stability of the resonance panel’s tonal characteristics. By identifying the frequencies of each mode and their corresponding modal shapes, a deeper understanding of the energy distribution and vibration patterns of the wood under different modes can be achieved. In order to investigate the change in frequency components between f4 and f5 under different arch heights and their influence on the modal vibration patterns, only the vibration patterns between the fourth and fifth order frequencies need to be extracted (Figure 10).
When the specimen was machined from 0 mm to 1 mm, the natural frequency decreased by 3.8%. Torsional vibration and bending vibration on the side of the specimen (XZ plane) were observed between the fourth and fifth resonance frequencies. In the case of 0 mm arch height, side bending vibration was dominant, with torsional vibration appearing later. Conversely, at 1 mm arch height, torsional vibration appeared earlier.
When the arch height was between 2 mm and 6 mm, lateral bending vibrations no longer occurred. The increase in arch height significantly enhanced the stiffness-to-mass ratio, suppressing the occurrence of lateral bending vibrations. Once the arch height reached a level, the transverse bending resistance of the specimen became sufficiently strong, preventing this bending vibration mode from being further excited.
However, torsional vibrations depended more on the overall shape and mass distribution of the structure than on stiffness in a single direction. As a result, torsional vibrations were maintained even as the arch height increased. At lower arch heights (0 mm and 1 mm), there was a certain degree of coupling between the torsional vibration and the lateral bending vibration of the specimen. The coupling led to the inclusion of both vibration modes in the vibration pattern. As the arch height increased further, the contribution of bending vibration was gradually suppressed, while torsional vibration characteristics were retained. It indicated that higher arch heights imposed significant constraints on these vibration modes; the phenomenon fully reflects the role of arch height variation in regulating the vibration behavior of wood.

3.2.2. Harmonic Response

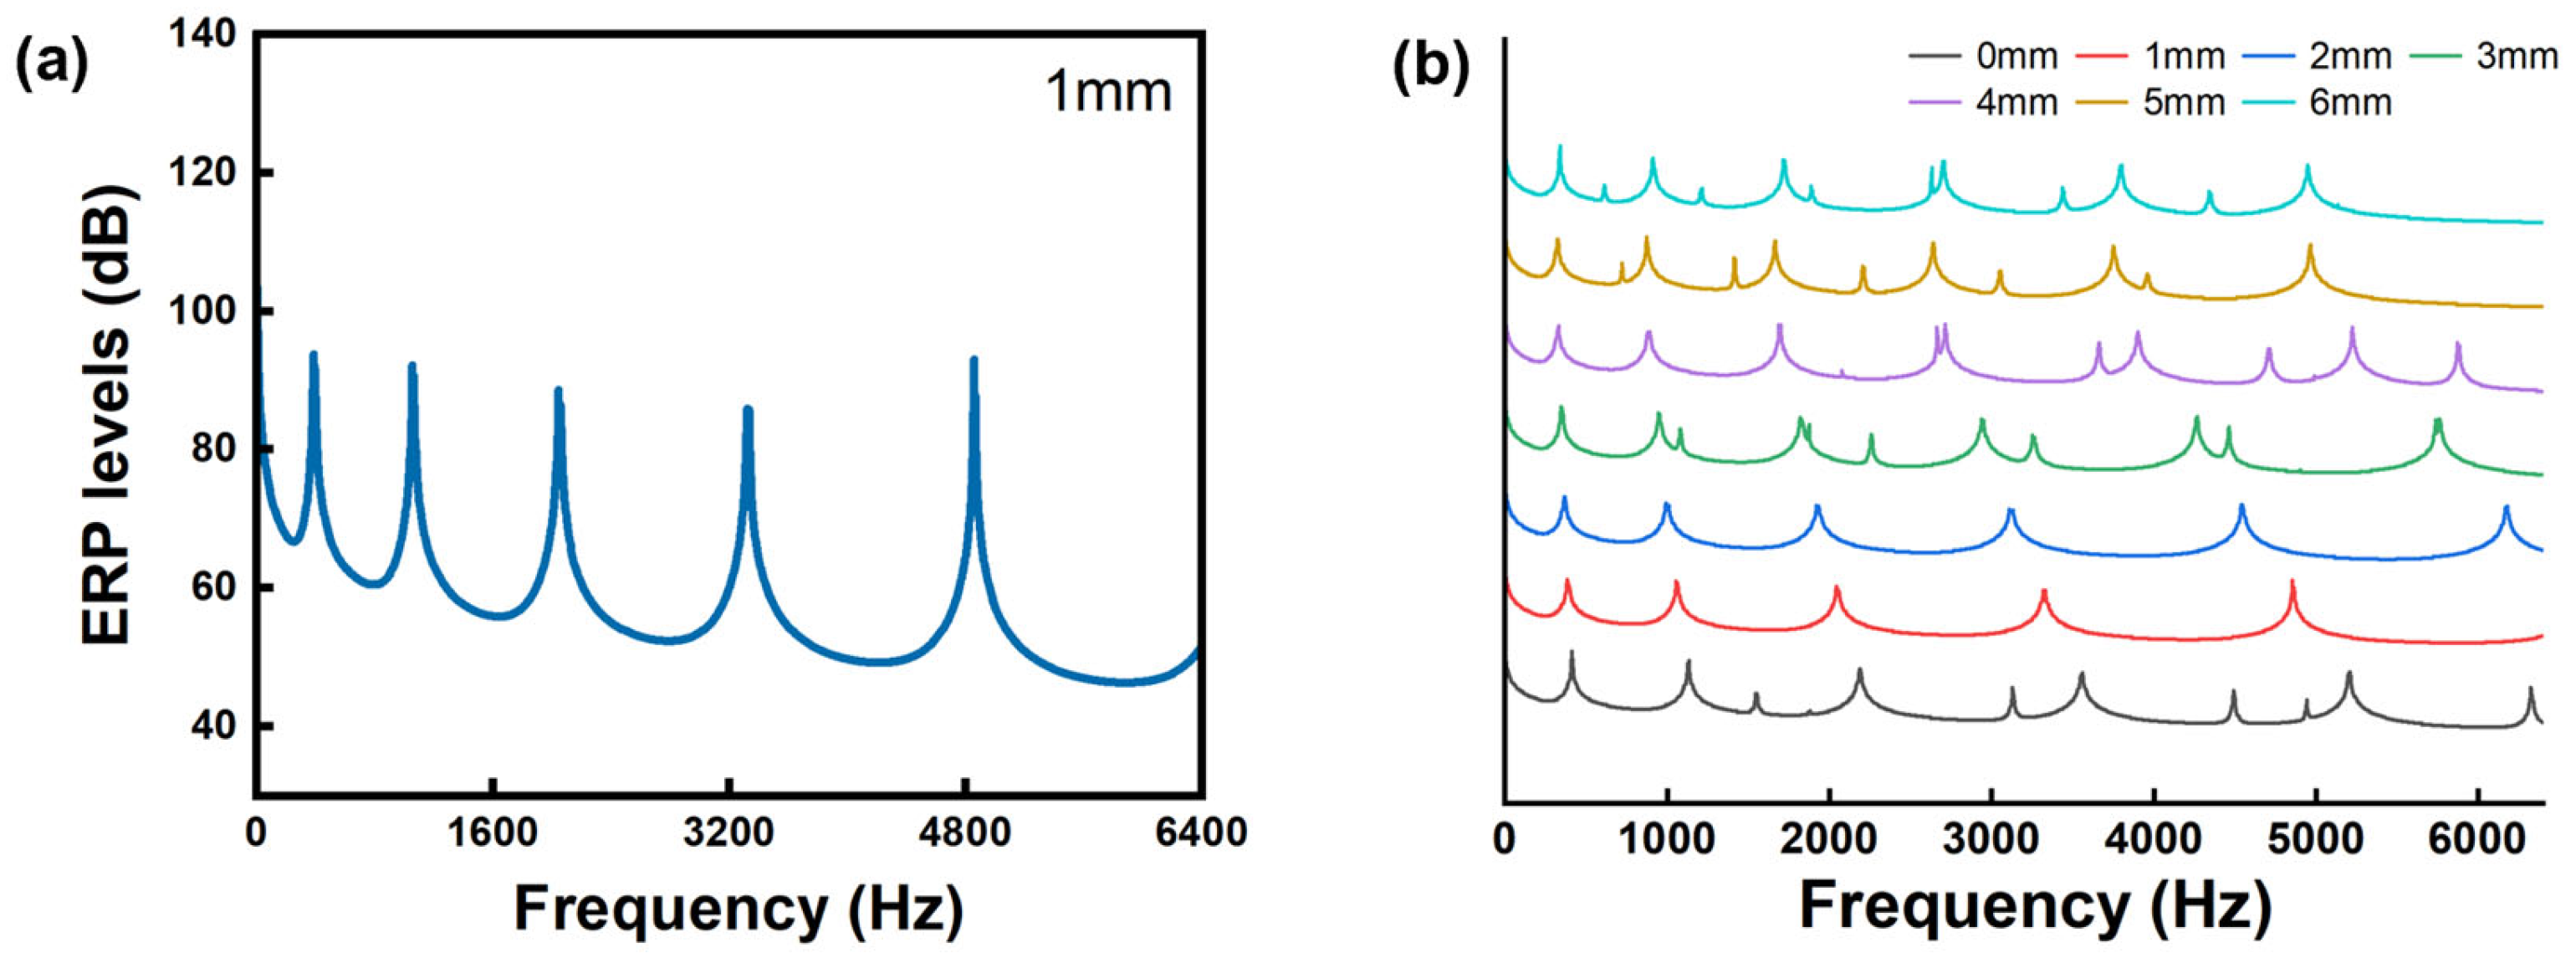
The equivalent radiation efficiency (ERP) levels of specimens with different arch heights were calculated using the harmonic response module in ANSYS and subsequently normalized. The results were presented in Figure 11.
In Figure 11b, as the arch height progressively increased from 0 mm to 5 mm, all modal resonance frequencies exhibited a systematic downward shift, with the fundamental frequency demonstrating the smallest variation while higher-order modes (f5 and f6) displayed more significant changes. These trends aligned with the frequency spectral analysis results. At arch heights exceeding 5 mm, minimal changes were observed in the resonance frequencies across different modes, whereas the emergence of new spectral peaks at distinct positions modified the acoustic radiation characteristics of the structure.
In addition, the number of peaks increases as the arch height increases to 3 mm, indicating that more energy in the frequency range is radiated. This is consistent with the results obtained from the peak-to-peak, skewness, and kurtosis in the time domain analysis.

3.2.3. Reliability Evaluation of the Finite Element Simulation Results

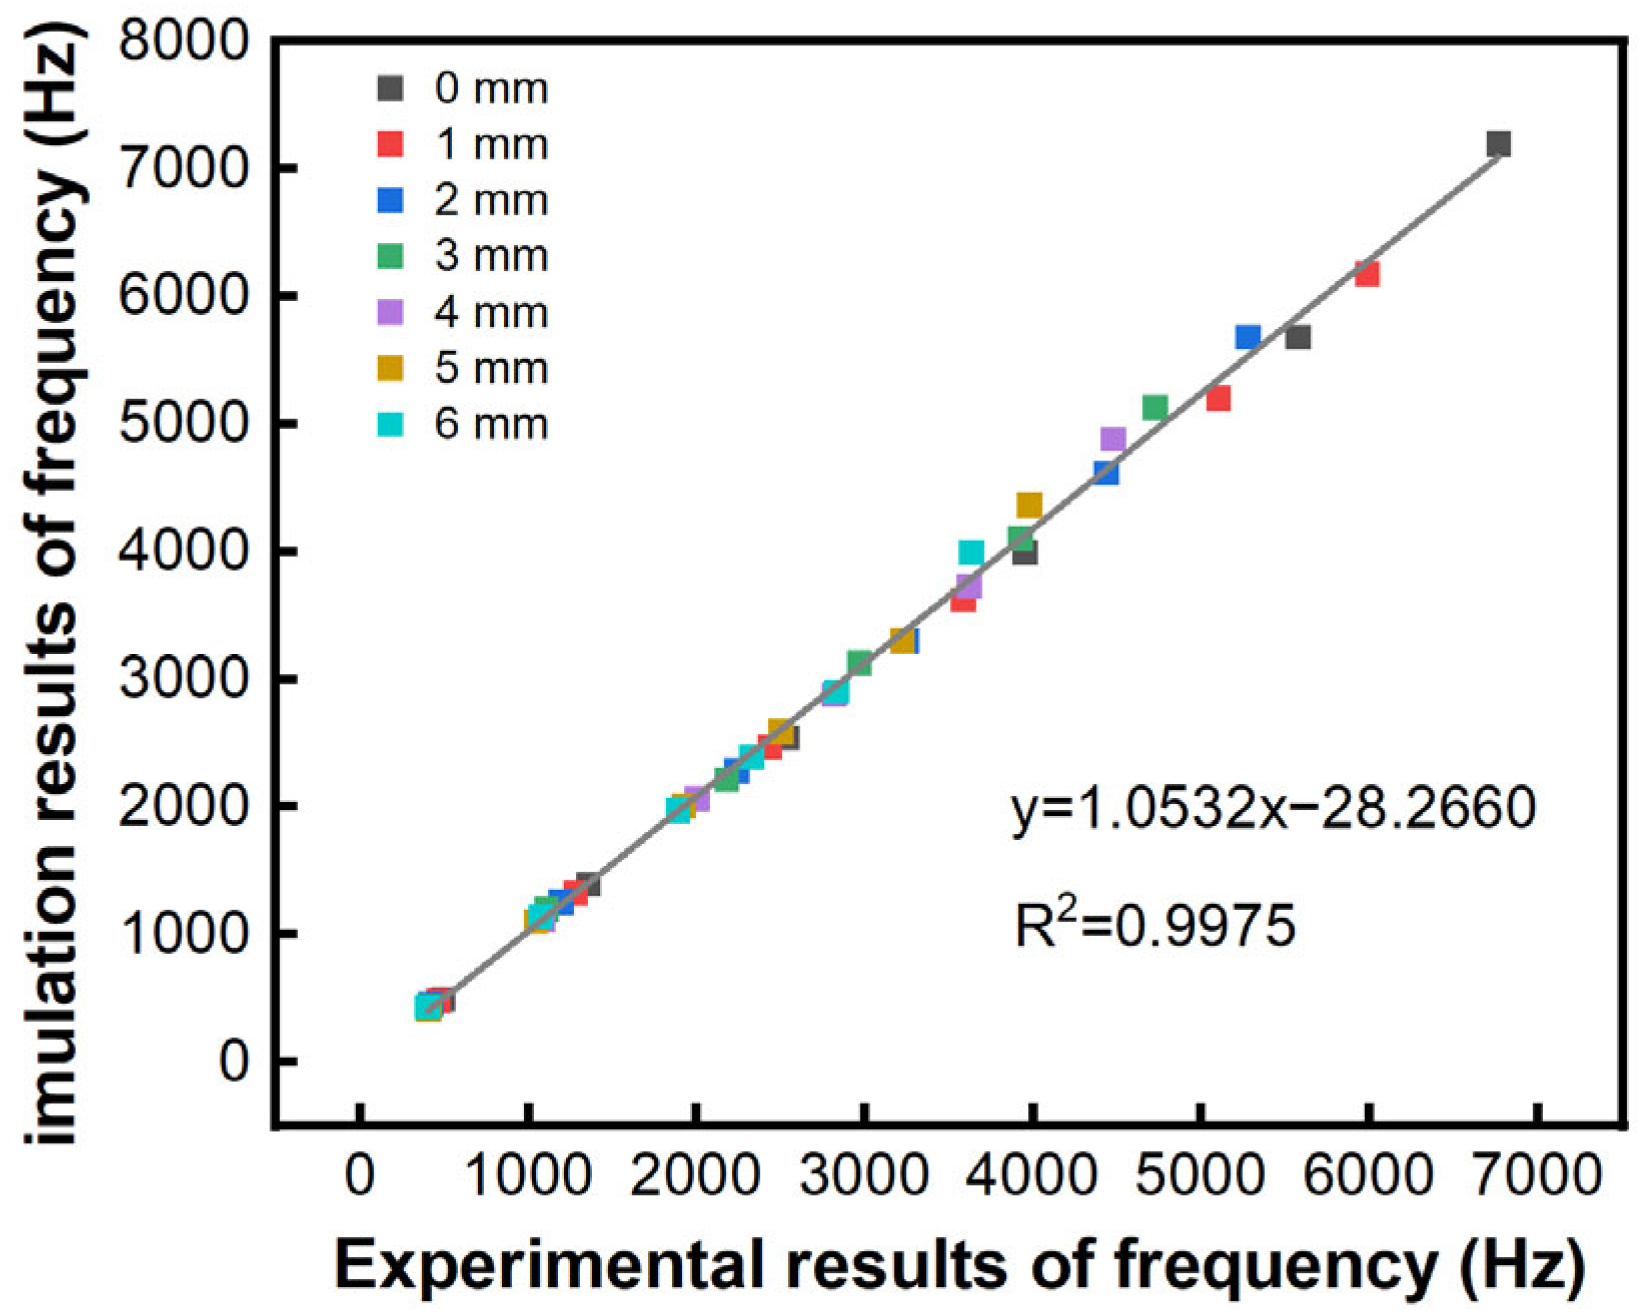
Using ANSYS Workbench, resonance frequencies of each order for specimens with varying arch heights were calculated and compared with the experimentally measured frequencies. The comparison results are presented in Table 4 and Figure 12.
In Table 4, most of the simulation results deviated from the experimental results by 1%–5%. The deviation of the higher-order (f6) frequencies was approximately 9%, which was larger compared to the lower-order frequencies. This discrepancy arose because higher-order modes typically involve more complex vibration patterns, are more sensitive to local structural details and material distribution, and are significantly influenced by the internal damping of the wood and interfacial energy dissipation effects. In contrast, the computational model simplified the material’s homogeneity, resulting in relatively larger errors in higher-order frequencies. Nonetheless, the overall deviation was less than 10%. As shown in Figure 12, the correlation coefficient between the experimental and simulation results was 0.9975, indicating a high degree of fit. This enabled a reliable analysis of the modal vibration patterns of arched specimens based on computational modal analysis.

4. Conclusions

This study investigated the influence of arch height on the acoustic vibration response of Paulownia timber through an integrated experimental and finite element approach. The vibrational frequency spectra and time-domain characteristic parameters of specimens with varying arch heights were experimentally measured. Subsequently, the modal shapes and harmonic responses of the arched structures were numerically simulated using ANSYS. The principal findings can be summarized as follows:
  • Variations in arch height influenced the frequency spectrum response of the vibrations of Paulownia wood. Changes in arch height resulted in the emergence of more peaks between f4 and f5, which became increasingly concentrated as the arch height increased, ultimately disappearing when the arch height reached 6 mm. The high arch (3–6 mm) has a small effect on the fundamental frequency, and the low arch (0–2 mm) has a large effect on the fundamental frequency, with R1,1 and R1,2 being 5.31% and 8.62%, respectively. As the arch height increases, the change in the fundamental frequency stabilizes, decreasing by approximately 2% after each 1 mm thinning. In contrast, adjustments to the arch height have a pronounced effect on the higher-order frequencies (f4, f5, f6), which decrease by approximately 9%–13% with each 1 mm thinning in the range of 1–3 mm.
  • The adjustment of arch height alters the acoustic radiation efficiency of resonance boards. There is a negative correlation between the skewness and kurtosis and the arch height of the wood. The vibration energy is released more when ΔH exceeds 3.06. The results of harmonic response also confirm this point. The number of peaks increases as the arch height increases to 3 mm, indicating that more energy in the frequency range is radiated.
  • Under free boundary conditions at both ends, the arch height significantly influenced the vibrational modes of the resonance board. Both frequency-domain and time-domain analyses demonstrated strong agreement with finite element simulation results. Experimental measurements exhibited high correlation with numerical predictions, validating the reliability of computational modal analysis for characterizing the modal vibration patterns of arched specimens. For future research, we suggest exploring a broader range of arch heights, as well as investigating the effects of different boundary conditions, such as clamped or simply supported edges. This could provide a more comprehensive understanding of how these factors interact with arch height to influence vibrational behavior.

Author Contributions

Conceptualization, X.L. and Z.L.; methodology, X.L. and Y.M.; software, X.L. and L.H.; validation, Y.G. and S.W.; formal analysis, X.L.; investigation, L.H. and S.W.; data curation, L.H. and J.Z. (Jing Zhou); writing—original draft preparation, X.L.; writing—review and editing, X.L., Y.M., Y.G. and J.Z. (Juncheng Zhang); visualization, X.L. and J.Z. (Juncheng Zhang); supervision, Y.M. and Z.L.; funding acquisition, Z.L. All authors have read and agreed to the published version of the manuscript.

Funding

This research was funded by the National Natural Science Foundation of China, grant numbers 32271781, and the Fundamental Research Funds for the Central Universities, grant number 2572021AW54.

Data Availability Statement

Data are contained within the article.

Conflicts of Interest

The authors declare no conflicts of interest.

References

  1. Castellanos, J.R.S.; Aguilar, J.M.V. Material properties and acoustic performance indexes of twenty-two Mexican woods. Measurement by ultrasound. Madera Bosques 2018, 24, e2431132. [Google Scholar] [CrossRef]
  2. Wegst, U.G.K. Bamboo and Wood in Musical Instruments. Ann. Rev. Mater. Res. 2008, 38, 323–349. [Google Scholar] [CrossRef]
  3. Jiang, Z.H.; Deng, L.P.; Song, R.Z.; Chen, F.M.; Liu, X.G. Research Progress on the Acoustic Vibration Performance of Wood and Bamboo. World For. Res. 2021, 34, 1–7. [Google Scholar] [CrossRef]
  4. Ke, W.; Jing, Z.; Yixin, Z.; Haiyang, Z.; Zhenbo, L.; Wenshuai, C. Effect of Crack Length on Acoustic Vibration Properties of Paulownia Wood-All Databases. J. For. Eng. 2023, 8, 55–62. [Google Scholar] [CrossRef]
  5. Fedyukov, V.; Saldaeva, E.; Chernova, M. Different Ways of Elastic Modulus Comparative Study to Predict Resonant Properties of Standing Spruce Wood. Wood Res. 2017, 62, 607–614. [Google Scholar]
  6. Stoel, B.C.; Borman, T.M. A Comparison of Wood Density between Classical Cremonese and Modern Violins. PLoS ONE 2008, 3, e2554. [Google Scholar] [CrossRef]
  7. Dinulica, F.; Stanciu, M.D.; Savin, A. Correlation between Anatomical Grading and Acoustic-Elastic Properties of Resonant Spruce Wood Used for Musical Instruments. Forests 2021, 12, 1122. [Google Scholar] [CrossRef]
  8. Gonzalez, S.; Salvi, D.; Baeza, D.; Antonacci, F.; Sarti, A. A Data-Driven Approach to Violin Making. Sci. Rep. 2021, 11, 9455. [Google Scholar] [CrossRef]
  9. LeBlanc, J.; Shukla, A. Underwater Explosion Response of Curved Composite Plates. Compos. Struct. 2015, 134, 716–725. [Google Scholar] [CrossRef]
  10. Ramteke, P.M.; Panda, S.K. Free Vibrational Behaviour of Multi-Directional Porous Functionally Graded Structures. Arab. J. Sci. Eng. 2021, 46, 7741–7756. [Google Scholar] [CrossRef]
  11. Danihelova, A.; Stafura, A.; Culik, M.; Gergel, T. Influence of Wood and Thickness of Back Wall of Wooden Organ Pipe and Air Pressure in Windchest on Sound. Appl. Sci. 2024, 14, 7897. [Google Scholar] [CrossRef]
  12. Bissinger, G. Structural Acoustics of Good and Bad Violins. J. Acoust. Soc. Am. 2008, 124, 1764–1773. [Google Scholar] [CrossRef] [PubMed]
  13. Fritz, C.; Curtin, J.; Poitevineau, J.; Borsarello, H.; Wollman, I.; Tao, F.-C.; Ghasarossian, T. Soloist Evaluations of Six Old Italian and Six New Violins. Proc. Natl. Acad. Sci. USA 2014, 111, 7224–7229. [Google Scholar] [CrossRef]
  14. Li, D.; Zhao, X.; Hu, X.; Ma, G.; Hu, K.; Ma, H. Influence of Sectional Dimension of Stabilizing Piles on Soil Arching Characteristics. J. Eng. Geol. 2018, 26, 484–493. [Google Scholar] [CrossRef]
  15. Li, D.; Hu, X.; Zhao, X.; Yue, Z. Variation of Horizontal Arch Height of Granite Residual Soil Slope in Vertical Direction. J. Southwest Jiaotong Univ. 2016, 51, 1024–1032. [Google Scholar] [CrossRef]
  16. Xue, W.; Yiping, G.; Wei, Z. Analysis on the Three-Dimensional Measurement of Panels Shapes of Guzheng. Print. Digit. Media Technol. Study 2023, 6, 30–37. [Google Scholar] [CrossRef]
  17. Miranda Valiente, P.; Squicciarini, G.; Thompson, D.J. Influence of Soundboard Modelling Approaches on Piano String Vibration. J. Acoust. Soc. Am. 2024, 155, 3213–3232. [Google Scholar] [CrossRef]
  18. Waltham, C.; Lan, Y.; Koster, E. An Acoustical Study of the Qin. J. Acoust. Soc. Am. 2016, 139, 1592–1600. [Google Scholar] [CrossRef]
  19. Ge, Y.; Zhang, Y.T.; Wan, K.; Miao, Y.Y.; Li, Y.X.; Tian, M.L.; Guo, L.G.; Liu, Z.B. Vibration Mode of Guzheng Resonance Panel with Whole Board Structure-All Databases. J. Beijing For. Univ. 2021, 43, 107–116. [Google Scholar] [CrossRef]
  20. Ege, K.; Boutillon, X.; Rebillat, M. Vibroacoustics of the Piano Soundboard: (Non)Linearity and Modal Properties in the Low- and Mid-Frequency Ranges. J. Sound Vibr. 2013, 332, 1288–1305. [Google Scholar] [CrossRef]
  21. Bissinger, G. Structural Acoustics Model of the Violin Radiativity Profile. J. Acoust. Soc. Am. 2008, 124, 4013–4023. [Google Scholar] [CrossRef] [PubMed]
  22. Zhang, L.; He, L.; Liang, Y.; Zhang, J.; Zhang, H.; Zhou, J.; Cui, H.; Li, M.; Miao, Y.; Liu, Z. Modulating the Acoustic Vibration Performance of Wood by Introducing a Periodic Annular Groove Structure. Forests 2023, 14, 2360. [Google Scholar] [CrossRef]
  23. Gonzalez, S.; Chacra, E.; Carreno, C.; Espinoza, C. Wooden Mechanical Metamaterials: Towards Tunable Wood Plates. Mater. Des. 2022, 221, 110952. [Google Scholar] [CrossRef]
  24. Gough, C.E. A Violin Shell Model: Vibrational Modes and Acoustics. J. Acoust. Soc. Am. 2015, 137, 1210–1225. [Google Scholar] [CrossRef]
  25. Gliga, V.G.; Stanciu, M.D.; Nastac, S.M.; Campean, M. Modal Analysis of Violin Bodies with Back Plates Made of Different Wood Species. BioResources 2020, 15, 7687–7713. [Google Scholar] [CrossRef]
  26. Zhang, Y.; Ge, Y.; Miao, Y.; Liu, Z.; Li, Y.; Tian, M.; Li, X.; Wang, C. Vibration Mode of Guzheng Soundboard with Composite Structure. J. Beijing For. Univ. 2022, 44, 132–141. [Google Scholar] [CrossRef]
  27. Salvi, D.; Gonzalez, S.; Antonacci, F.; Sarti, A. Modal Analysis of Free Archtop Guitar Top Plates. J. Acoust. Soc. Am. 2021, 150, 1505–1513. [Google Scholar] [CrossRef]
  28. Sun, L.; Miao, Y.; Zhai, X.; Li, M.; Liu, Z. Effect of Excitation Force on Wood Vibration Damping Coefficient. J. Northeast For. Univ. 2020, 48, 91–95. [Google Scholar] [CrossRef]
  29. Jia, N.; Guo, L.; Wang, R.; Liu, J. Design of Vibration and Noise Reduction for Ultra-Thin Cemented Carbide Circular Saw Blades in Woodworking Based on Multi-Objective Optimization. Forests 2024, 15, 1554. [Google Scholar] [CrossRef]
  30. Yang, Y. Research on GRNN Prediction Model for Acoustic Quality of Yueqin Based on Wood Vibration Characteristics. For. Eng. 2024, 40, 160–167. [Google Scholar] [CrossRef]
  31. Stanciu, M.D.; Dinulica, F.; Bucur, V.; Gliga, V.G.; Nastac, S.M.; Campean, M. Changing the Vibrational Behavior of the Wooden Thin Arched Plates-The Maestro Violins Experimental Study Case. Thin-Walled Struct. 2022, 174, 109042. [Google Scholar] [CrossRef]
  32. Deng, X.; Yu, Z.; Yao, W.; Chen, M. Simulation Analysis of Vibro-Acoustic Characteristics of Traditional Guzheng. J. Shanghai Jiaotong Univ. 2016, 50, 300–305. [Google Scholar] [CrossRef]
  33. Miao, Y.; Liu, Z.; Liu, Y.; Shen, J. Effect of Vibration Properties of a Resonance Board on Piano Timbre. For. Prod. J. 2016, 66, 126–133. [Google Scholar] [CrossRef]
  34. Mania, P.; Skrodzka, E. Modal Parameters of Resonant Spruce Wood (Picea abies L.) after Thermal Treatment. J. King Saud Univ. Sci. 2020, 32, 1152–1156. [Google Scholar] [CrossRef]
  35. Yin, Y.; Miao, Y.; Wan, K.; Wang, X.; Zhai, X.; Liu, Z. Analysis and Evaluation of Wood Acoustic Vibration Signal Based on Daubechies Wavelet Base. J. For. Eng. 2021, 6, 68–75. [Google Scholar] [CrossRef]
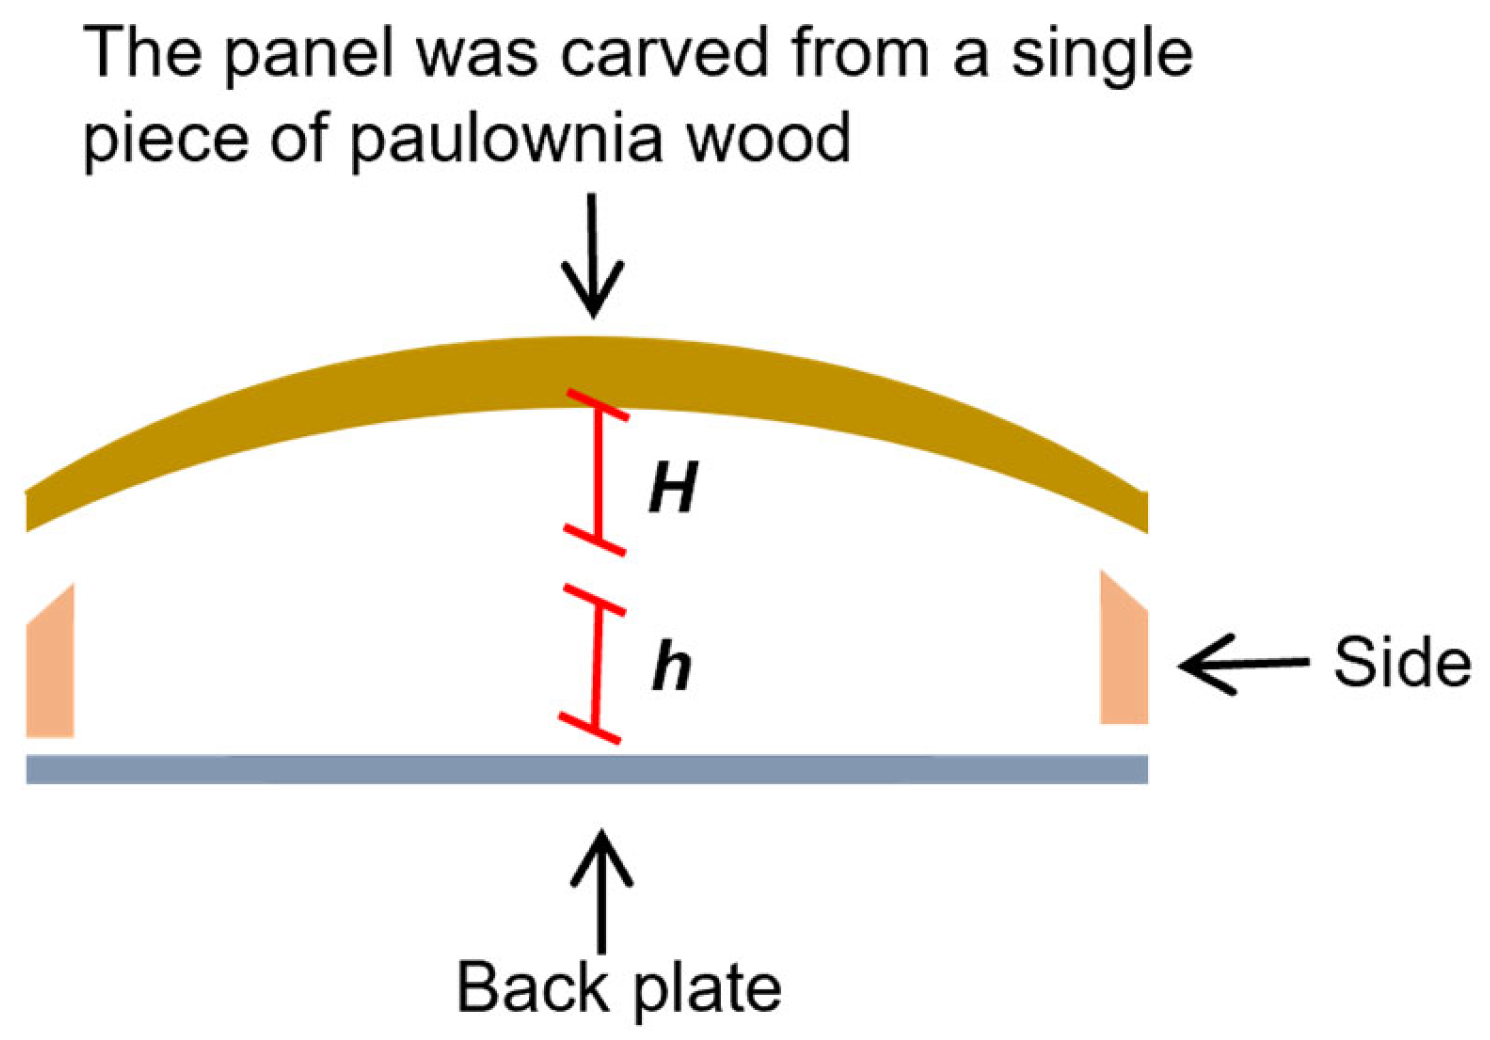
Figure 1. Schematic diagram of the structure of the face-dug Guzheng.
Forests 16 00545 g001
Figure 2. Structural changes in Paulownia wood: (a) initial shape and processed shape of Paulownia; (b) the method of adjusting the arch height; (c) the structure obtained in the experimental tests.
Forests 16 00545 g002
Figure 3. Principle of frequency spectral determination.
Forests 16 00545 g003
Figure 4. Structure model with an arch height of 3 mm.
Forests 16 00545 g004
Figure 5. Spectrum and envelope of wood at different arch heights: (a) initial rectangular sample; (b) arch height is 0 mm; (c) arch height is 1 mm; (d) arch height is 2 mm; (e) arch height is 3 mm; (f) arch height is 4 mm; (g) arch height is 5 mm; (h) arch height is 6 mm. The orange outline represents the variation of frequency peaks between f4 and f5.
Forests 16 00545 g005
Figure 6. Rate of frequency change in adjacent arch height.
Forests 16 00545 g006
Figure 7. Examples of input time-domain signals: (a) initial rectangular timber; (b) arch height of 0 mm.
Forests 16 00545 g007
Figure 8. Time-domain characteristic parameters of Paulownia wood with different arch heights: (a) logarithmic attenuation rate; (b) peak-to-peak value.
Forests 16 00545 g008
Figure 9. Relationship between arch height and skewness and kurtosis: (a) the correlation between arch height and skewness; (b) the correlation between arch height and kurtosis.
Forests 16 00545 g009
Figure 10. Mode shapes for different arch heights.
Forests 16 00545 g010
Figure 11. Equivalent radiation efficiency levels of specimens with different arch heights: (a) ERP level of the simulated structure for an arch height of 1 mm; (b) normalized ERP levels of the simulated structure for arch heights of 0–6 mm.
Forests 16 00545 g011
Figure 12. Correlation of frequency obtained from experiment and simulation.
Forests 16 00545 g012
Table 1. Basic structural parameters of Paulownia timber with different arch heights.
Design Arch Height
H (mm)
Measured Arch Height
H (mm)
Errors
(mm)
L × R
(mm)
T1
(mm)
T2
(mm)
Density
ρ (g·cm−3)
000300.01 × 50.203.093.050.27
10.98±0.02
22.01±0.01
33.00±0.01
43.99±0.01
55.04±0.04
66.01±0.01
Note: T1 and T2 are the chordwise heights of the two sides of the specimen, respectively.
Table 2. Material parameters of Paulownia used in the simulation model.
Density (g·cm−3)Damping RatioYoung’s Modulus (GPa)Shear Modulus (GPa)Poisson’s Ratio
ELETERGLTGLRGRTμLTμLRμRT
0.270.054.201.032.960.3000.2000.0330.150.020.08
Note: The data in the table are partly from reference [32], where L, R, and T represent the longitudinal, radial, and chordal directions of the wood, respectively.
Table 3. Analysis settings for harmonic response.
Range Minimum
(Hz)
Range Maximum
(Hz)
Solution IntervalsExcitation DirectionStress
(MPa)
080002048Z0.01
Table 4. Comparison of frequencies obtained by simulation and experiment.
Resonant OrderResults0 mm1 mm2 mm3 mm4 mm5 mm6 mm
f1Measured value/Hz490464424416408404400
Simulation value/Hz494485458437409406424
Errors/%0.824.337.424.810.240.495.66
f2Measured value/Hz1360128011921112108810481072
Simulation value/Hz1392132512501188111010961141
Errors/%2.353.524.876.832.024.586.44
f3Measured value/Hz2530243622362176200419201888
Simulation value/Hz2541246122802216206620021965
Errors/%0.431.031.971.843.094.274.07
f4Measured value/Hz3950358432482968281625002330
Simulation value/Hz3991362833013124287425892390
Errors/%1.041.221.635.262.063.562.58
f5Measured value/Hz5570509644323920361632202832
Simulation value/Hz5682520346164100372732942906
Errors/%2.012.104.154.603.072.302.61
f6Measured value/Hz6760598452724720447239803632
Simulation value/Hz7193617356835130487743653992
Errors/%6.413.147.808.679.109.679.91
Disclaimer/Publisher’s Note: The statements, opinions and data contained in all publications are solely those of the individual author(s) and contributor(s) and not of MDPI and/or the editor(s). MDPI and/or the editor(s) disclaim responsibility for any injury to people or property resulting from any ideas, methods, instructions or products referred to in the content.