Article

Quantitative Evaluation and Typology of Social Exposure Patterns to Urban Green Spaces: A Case Study of Seoul

1
Department of Geography, Kyung Hee University, Seoul 02447, Republic of Korea
2
Forest Human Service Division, Future Forest Strategy Department, National Institute of Forest Science, Seoul 02455, Republic of Korea
*
Authors to whom correspondence should be addressed.
Forests 2025, 16(3), 510; https://doi.org/10.3390/f16030510
Submission received: 4 February 2025 / Revised: 7 March 2025 / Accepted: 11 March 2025 / Published: 13 March 2025
(This article belongs to the Special Issue Forest Bathing and Forests for Public Health—Series II)

Abstract

:
(1) Research Highlights: Existing studies primarily focus on the supply-side evaluation of urban forest accessibility, emphasizing physical proximity while often overlooking real-time usage patterns and demographic-specific exposure. This study shifts the focus to social exposure, analyzing how diverse population groups interact with urban forests across different times of the day, integrating dynamic accessibility metrics. (2) Background and Objectives: Unlike previous research that predominantly assessed urban forest accessibility through conventional models based on static spatial proximity, this study incorporates spatiotemporal population distribution data to capture actual utilization patterns. By introducing a dynamic, exposure-based framework, this research aims to facilitate equitable and temporally sensitive access to green spaces across diverse demographic groups. (3) Materials and Methods: This study focuses on Seoul, South Korea, and applies the Gaussian-based Two-Step Floating Catchment Area (G2SFCA) methodology to assess urban forest accessibility. Living population data (2021–2024) from mobile telecommunications sources were used as demand indicators, while OpenStreetMap (OSM) green space data were utilized as supply indicators. Realistic travel distances were calculated using OSM pedestrian networks and Dijkstra’s algorithm, incorporating slope effects and distance decay functions. A K-means clustering algorithm was applied to classify four distinct exposure types based on demographic and temporal variations. (4) Results: The findings reveal significant disparities in urban forest exposure based on age group and time of day. Four major urban forest exposure patterns were identified: Type A—school-age children, with peak usage around midday; Type B—working-age adults, frequenting mid-sized urban forests during commuting and leisure hours; Type C—elderly individuals, utilizing large-scale urban forests and neighborhood parks mainly in the morning; Type D—young adults, engaging with small urban parks and rest areas at various times. (5) Conclusions: Urban forest management must move beyond the quantitative expansion of green spaces and instead implement customized policies that optimize accessibility and equitable distribution based on distinct temporal and demographic patterns of social exposure. By integrating real-time urban mobility data into urban forest planning, policies can better align green space supply with actual usage, fostering a more equitable, data-driven, and sustainable urban green infrastructure.

1. Introduction

Urban forests or green spaces are essential resources in urban environments, such as parks, gardens, and forests, and play a multi-functional role in modern cities. These green spaces provide numerous ecological and social benefits, such as enhancing air quality, supporting biodiversity, and fostering the mental and physical well-being of residents and visitors [1,2]. The sizes and types of green spaces range from street trees and private gardens to large parks and nature reserves. Additionally, exposure to green spaces, whether active or passive, positively influences human well-being [3]. In urban areas, green spaces serve as vital public resources accessible to everyone, but their limited availability often leads to competition among users [4,5]. The uneven distribution of green space resources has aggravated these problems, increasing the possibility that some population groups will be excluded from the benefits of green spaces. Existing studies have primarily focused on how easily urban residents can access green spaces, emphasizing accessibility [5]. However, to better understand the equity of urban forests, it is necessary to systematically analyze how diverse population groups are exposed to green spaces from a supply perspective.
Seoul, the location this study focuses on, is home to approximately 9.7 million people [6] and is characterized by a high population density and diverse demographic composition. Seoul includes urban forests, such as Namsan and Seoul Forest. Approximately 27% of the city’s total area is covered by green spaces [7]. Seoul’s “Green Space Expansion Plan for Living Areas” demonstrates a policy initiative aimed at ensuring that all citizens can access green spaces within a 10-min walk, providing an ideal setting for analyzing urban forest accessibility and social exposure patterns. Existing research emphasizes green space accessibility but often overlooks the complex relationship between individual mobility patterns and exposure to static and dynamic green spaces [8,9,10]. Mobility plays a key role in mediating the association between static and dynamic green space exposure. To address this gap, this study systematically analyzes the effects of mobility patterns on exposure and health outcomes.
Accessibility and social exposure to urban forests have emerged as important research topics worldwide. Policy efforts in the United States and Europe aim to reduce accessibility gaps and enhance urban residents’ quality of life [11,12]. The COVID-19 pandemic has further highlighted the positive impact of urban forests on mental health and well-being [13,14]. Against this international backdrop, this study analyzed the social exposure patterns of urban forests in Seoul to provide insights into equitable urban forest planning.
This study seeks to address the following questions:
  • How are urban forests in Seoul quantitatively distributed across different times of the day and among diverse population groups?
  • What insights can a Gaussian-based 2SFCA accessibility analysis offer for urban forest management and policymaking?
Based on the answers to these questions, this study proposes a novel approach for the scientific management of urban forest resources and promotion of equity.

2. Theory and Review of Previous Studies

2.1. Urban Forests and Social Exposure

Urban forests play a multifunctional role in modern urban environments and are essential resources for enhancing the mental and physical health of urban residents. Urban forests provide environmental benefits, such as mitigating the urban heat island effect, improving air quality, and enhancing biodiversity, while serving as vital spatial resources for quality of life improvement [15,16]. To assess the benefits urban forests provide, previous studies have frequently applied the Ecosystem Services (ES) framework to quantify and evaluate interactions between urban residents and green spaces [17,18]. The ES framework includes regulatory services (e.g., temperature regulation and air purification), provisioning services (e.g., oxygen production and water cycling), and cultural services (e.g., psychological stability and recreational activities). Many studies have leveraged the ES framework to analyze urban forest accessibility, focusing on how easily urban residents can reach green spaces [19,20]. These studies primarily assess physical accessibility and spatial distribution, aiming to identify disparities in green space availability.
However, these approaches predominantly focus on the provision of green spaces rather than analyzing their actual utilization patterns across different demographic groups. Most ES studies rely on static assessments (e.g., land use data and social media analytics) rather than capturing real-time interactions between individuals and urban forests [18]. While these methods provide insights into potential accessibility, they fail to account for actual utilization patterns, variations in user engagement, and the influence of temporal and spatial factors on urban forest use.
This study shifts the focus from static accessibility measures to a dynamic perspective of urban forest utilization by introducing the concept of social exposure. While previous studies have extensively utilized the ES framework to assess accessibility, they largely overlook how different demographic groups interact with urban forests under varying temporal and spatial conditions, thus limiting their ability to capture real-world usage dynamics.
By integrating a time-sensitive, demographic-driven analysis, this study introduces a novel framework that not only assesses physical accessibility but also captures real-world social exposure using the Gaussian-based Two-Step Floating Catchment Area (G2SFCA) method and clustering analysis. This approach provides a more comprehensive understanding of urban forest usage by aligning spatial accessibility with actual demographic-specific engagement patterns.
By adopting this perspective, this study contributes to a more nuanced understanding of urban forest planning, ensuring that urban green spaces are not only physically accessible but also effectively utilized by diverse population groups. This approach offers valuable insights for designing more equitable and sustainable green space policies that better align with actual urban forest usage patterns.

2.2. Accessibility and Patterns of Social Exposure

2.2.1. The Concept of Accessibility and the Methodology of 2SFCA (G2SFCA)

Accessibility refers to the ease of reaching specific resources or services and serves as a key measure for assessing resource equity and efficiency. Urban forest accessibility is regarded as a critical factor for improving the quality of life of urban residents and serves as a key component of urban planning and policymaking [21]. Previous studies have primarily evaluated urban forest accessibility from a demand-side perspective. In contrast, this study aims to assess the extent to which urban forests are distributed among various population groups from a supply-side perspective.
The 2SFCA (Two-Step Floating Catchment Area) methodology is a widely used technique for quantitatively evaluating accessibility [20]. The methodology consists of two steps. First, all the demand locations that can be accessed from each supply location are identified, and the amount of supply allocated to each demand location is calculated. In the second step, all the supply locations accessible from each demand location are aggregated to calculate the final accessibility index. This study applied the Gaussian-based 2SFCA (G2SFCA) method, which incorporates Gaussian-weighted distance decay into the traditional 2SFCA methodology [22,23]. The G2SFCA method employs a mechanism in which accessibility weights progressively decrease with increasing distance, enabling a more precise reflection of actual movement patterns and resource utilization behaviors. Additionally, this study conducted a detailed analysis of the interactions between urban forests and population groups by disaggregating accessibility based on the time of day and population characteristics.

2.2.2. Application of the K-Means Clustering Algorithm

The K-means clustering algorithm is an unsupervised learning technique that is widely used to identify and classify groups with similar characteristics within a dataset [24]. This algorithm initializes the cluster centroids, assigns each data point to the nearest cluster, and iteratively adjusts the centroids to form optimal clusters [25,26]. This study used the K-means algorithm to classify how urban forests are exposed across different time periods and population characteristics. In particular, we analyzed the real-time population distribution using big data-driven living population data and clustered the social exposure patterns of each urban forest. Through this, we identified which population groups are primarily exposed to particular urban forests and how these exposures vary by the time of day. These results provide foundational data for the efficient allocation and policy application of urban forest resources and serve as a scientific basis for balanced urban planning.

3. Methodology

To provide a clear overview of the research process, a workflow diagram has been included (Figure 1). This diagram summarizes the data sources, operational definitions, methodological steps, and key analytical processes used in this study.

3.1. Data Collection

This study integrated various data sources to quantitatively analyze urban forest exposure patterns, with an emphasis on enhancing the accuracy and reliability of the research. The primary data used in the analysis are detailed below.

3.1.1. Green Space Data

The analysis was conducted based on green space information collected from OpenStreetMap (OSM) (https://www.openstreetmap.org/, accessed on 10 March 2025). OSM is a publicly accessible map database updated by users in real time. It is useful for identifying urban forests and other green spaces that are primarily utilized or recognized from the perspective of citizen users and are accessible on foot.
In this study, green space data were collected from OpenStreetMap and used to quantitatively analyze the distribution and accessibility of green spaces within living areas in Seoul. For large green spaces, the actual accessibility can be underestimated or overestimated when calculated solely based on the central point. To address this, an approach was adopted that analyzed green spaces by dividing them into 1-hectare units. In addition, consistency was ensured by excluding green spaces far from roads with low accessibility and including only green spaces within 100 m of pedestrian paths in the analysis. By focusing solely on green spaces adjacent to pedestrian paths, the possibility of overestimation was minimized. This process accurately reflects the actual usability of urban forests.
Green space data were collected using the OSMnx (v2.0.1) library in Python 3.11. Objects with the land use attribute set to forest or the natural attribute set to wood were extracted from the attribute information of the individual objects. Among the collected data, objects unrelated to the analysis, such as Gimpo Airport in Seoul and the water surface of the Han River, were excluded. This was achieved by filtering the objects using the aeroway attribute set to aerodrome and the natural attribute set to water. Through this preprocessing step, more accurate green space data were obtained and utilized as supply indicators to evaluate the accessibility of forest welfare services.

3.1.2. Population Data: Pedestrian Network Data

Living population data collected for the Seoul metropolitan area over a 36-month period, from 12:00 a.m. on 1 August 2021 to 11:59 p.m. on 31 July 2024, were used in this study. Living population data estimate the number of people staying in specific locations at specific times, based on mobile phone signals collected from telecommunications company base stations. This de facto population dataset was developed through a collaboration between the Seoul Metropolitan Government and the KT Corporation by combining mobile communication data with public big data [27]. The data reflect the dynamic population distribution within the city by providing living population information categorized by day of the week, time of day, age group, and sex, segmented at the district level. These data offer valuable insights for analyzing urban forest accessibility across specific time periods and population groups.
The original living population data, provided in the form of aggregate districts, consisted of approximately 19,153 polygons in Seoul, representing a spatial range with an average area of 31,624 m2 and containing 26 buildings. However, the irregular size and shape of the aggregate districts impose limitations on the direct use of the data for analysis. This is because densely populated areas have compact districts, whereas sparsely populated areas encompass significantly larger regions. In addition, because a single aggregate district includes multiple buildings, it cannot be considered an accurate representation of the population at each building point. Therefore, as shown in the formula in Table 1 below, the total floor area of all buildings within a counting district was divided by the floor area of an individual building in the district, and this ratio was multiplied by the population of the district at that time to estimate the living population of a specific building. This method distributes the total population of an aggregate district to individual buildings within the district and assigns more of the population to buildings with larger total floor areas.
The building data were preprocessed based on the building geometry information from the road name address system provided by the Ministry of Public Administration and Security. Data on 541,590 buildings in Seoul were utilized, and the total floor area information was derived by integrating these data with the building register developed by the Ministry of Land, Infrastructure, and Transport.
To calculate realistic travel times between forest green space supply sites and population demand points, OSM pedestrian road networks and the Dijkstra path-finding algorithm were utilized. This was implemented using GIS technology via Python programming (see Table 2).
A distance decay weight based on the probability density function of a normal distribution was applied to account for the decrease in exposure opportunities with increasing distance between the demand and supply points. This method effectively captures the nonlinear relationship between distance and accessibility. The normal distribution function models realistic movement patterns by progressively reducing weights with increasing distance, enabling a more precise evaluation of actual accessibility compared with simple distance-based models. This improves the realism of the accessibility analysis by accounting for people’s preferences for nearby green spaces. A more realistic walking network was constructed by calculating the walking speed while accounting for the slope. Similar to the green space data collection process, data were collected using Python’s OSMnx library. Roads designated only for motor vehicles were excluded, and only pedestrian-friendly paths were included.
To account for changes in walking speed due to slope, 30 m (1 arc-second) resolution raster data from the USGS SRTM (US Geological Survey Shuttle Radar Topography Mission (https://earthexplorer.usgs.gov/, accessed on 10 March 2025)) were acquired and utilized. The elevation information for each node in the road network was sampled from the DEM, and the slope of each link segment between the nodes was calculated and appended as attribute information. This process improves the accuracy of green space accessibility analysis by constructing a road network grounded in realistic walking scenarios.

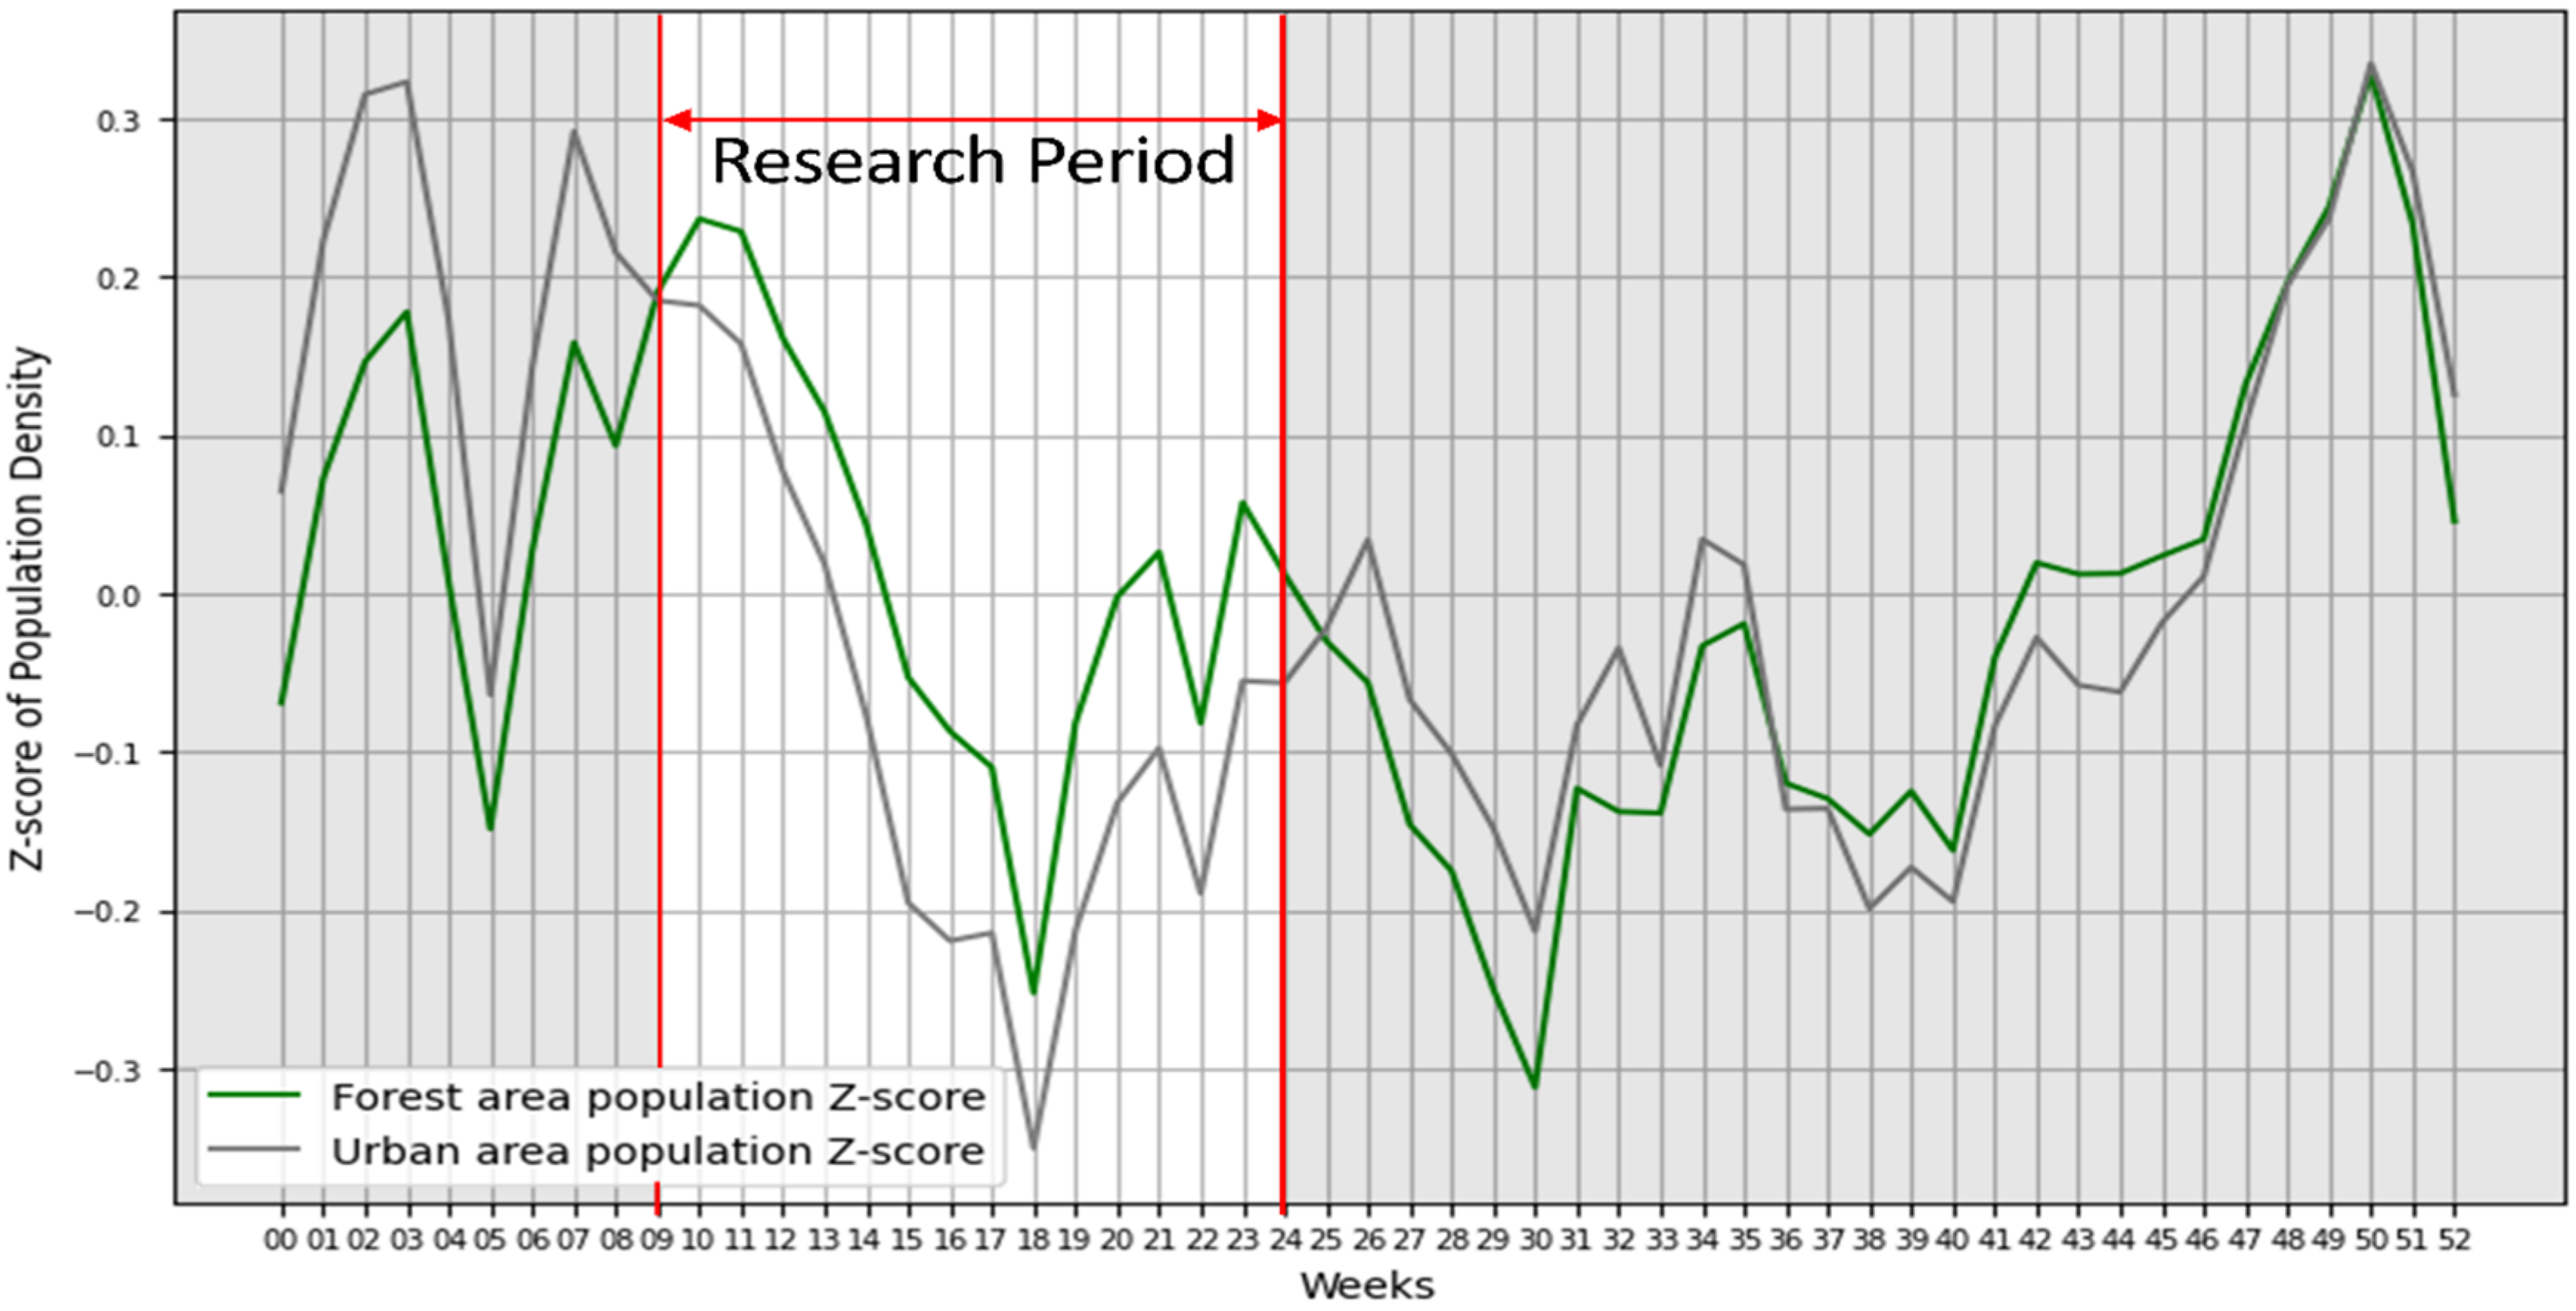
3.2. Analysis of Seasonal Variability in Urban Forest Social Exposure

The activities of urban residents vary significantly with seasonal factors, holidays, and time of day, influencing the social exposure patterns of urban forests. In this study, urban forest living and non-living zones in Seoul were classified, and the distribution of active populations was compared by season, week, and time. Based on this analysis, the periods of concentrated social exposure were identified.
Network-based walking times were used to define the boundaries of the urban forest living zones. This approach was designed to reflect urban residents’ accessibility accurately and yield realistic research outcomes. Subsequently, three years of population activity data were analyzed weekly to identify seasonal patterns in the annual population distribution and to determine periods of concentrated social exposure to urban forests.
The following procedure was used to analyze seasonal variations in urban forest social exposure. First, population volume was used as a demand indicator to construct living population data based on the assumption that areas with larger populations have a higher demand for green space use. The resident populations commonly used in previous studies have limitations in capturing urban mobility. To address this issue, dynamic data were employed to incorporate the time-of-day variations and actual usability. Distributions by time of day, sex, and age group were derived using mobile communication-based living population data provided by the Seoul Open Data Plaza.
Secondly, network analysis methods were applied to calculate the living zones accessible to urban residents on foot within a specified time frame. Network analysis accurately measures actual travel routes and times by incorporating factors that affect movement, such as road geometry and slope [19,28]. The calculated living zones enabled a more realistic evaluation of the distribution of forest welfare services and provided essential data for policy development.
Network analysis was conducted using a geographic information system (GIS), and the shortest path was calculated using Dijkstra’s algorithm. To reflect realistic travel scenarios, slope information was incorporated and a Gaussian density function-based distance decay weight was applied to account for the reduction in exposure opportunities with increasing distance. These methods enhanced the reproducibility and reliability of this study [29,30].
Thirdly, the population dynamics between the forest and urban zones were compared and analyzed. The forest area was estimated to house an average of 5,482,329 people across approximately 330,338 buildings, whereas the urban area was estimated to house an average of 4,215,075 people across approximately 211,252 buildings. Z-standardization was applied to normalize the data using the mean and standard deviation, emphasizing the relative change patterns over the absolute values. This method facilitated the comparison of population concentrations during specific periods and the analysis of seasonal variation factors.

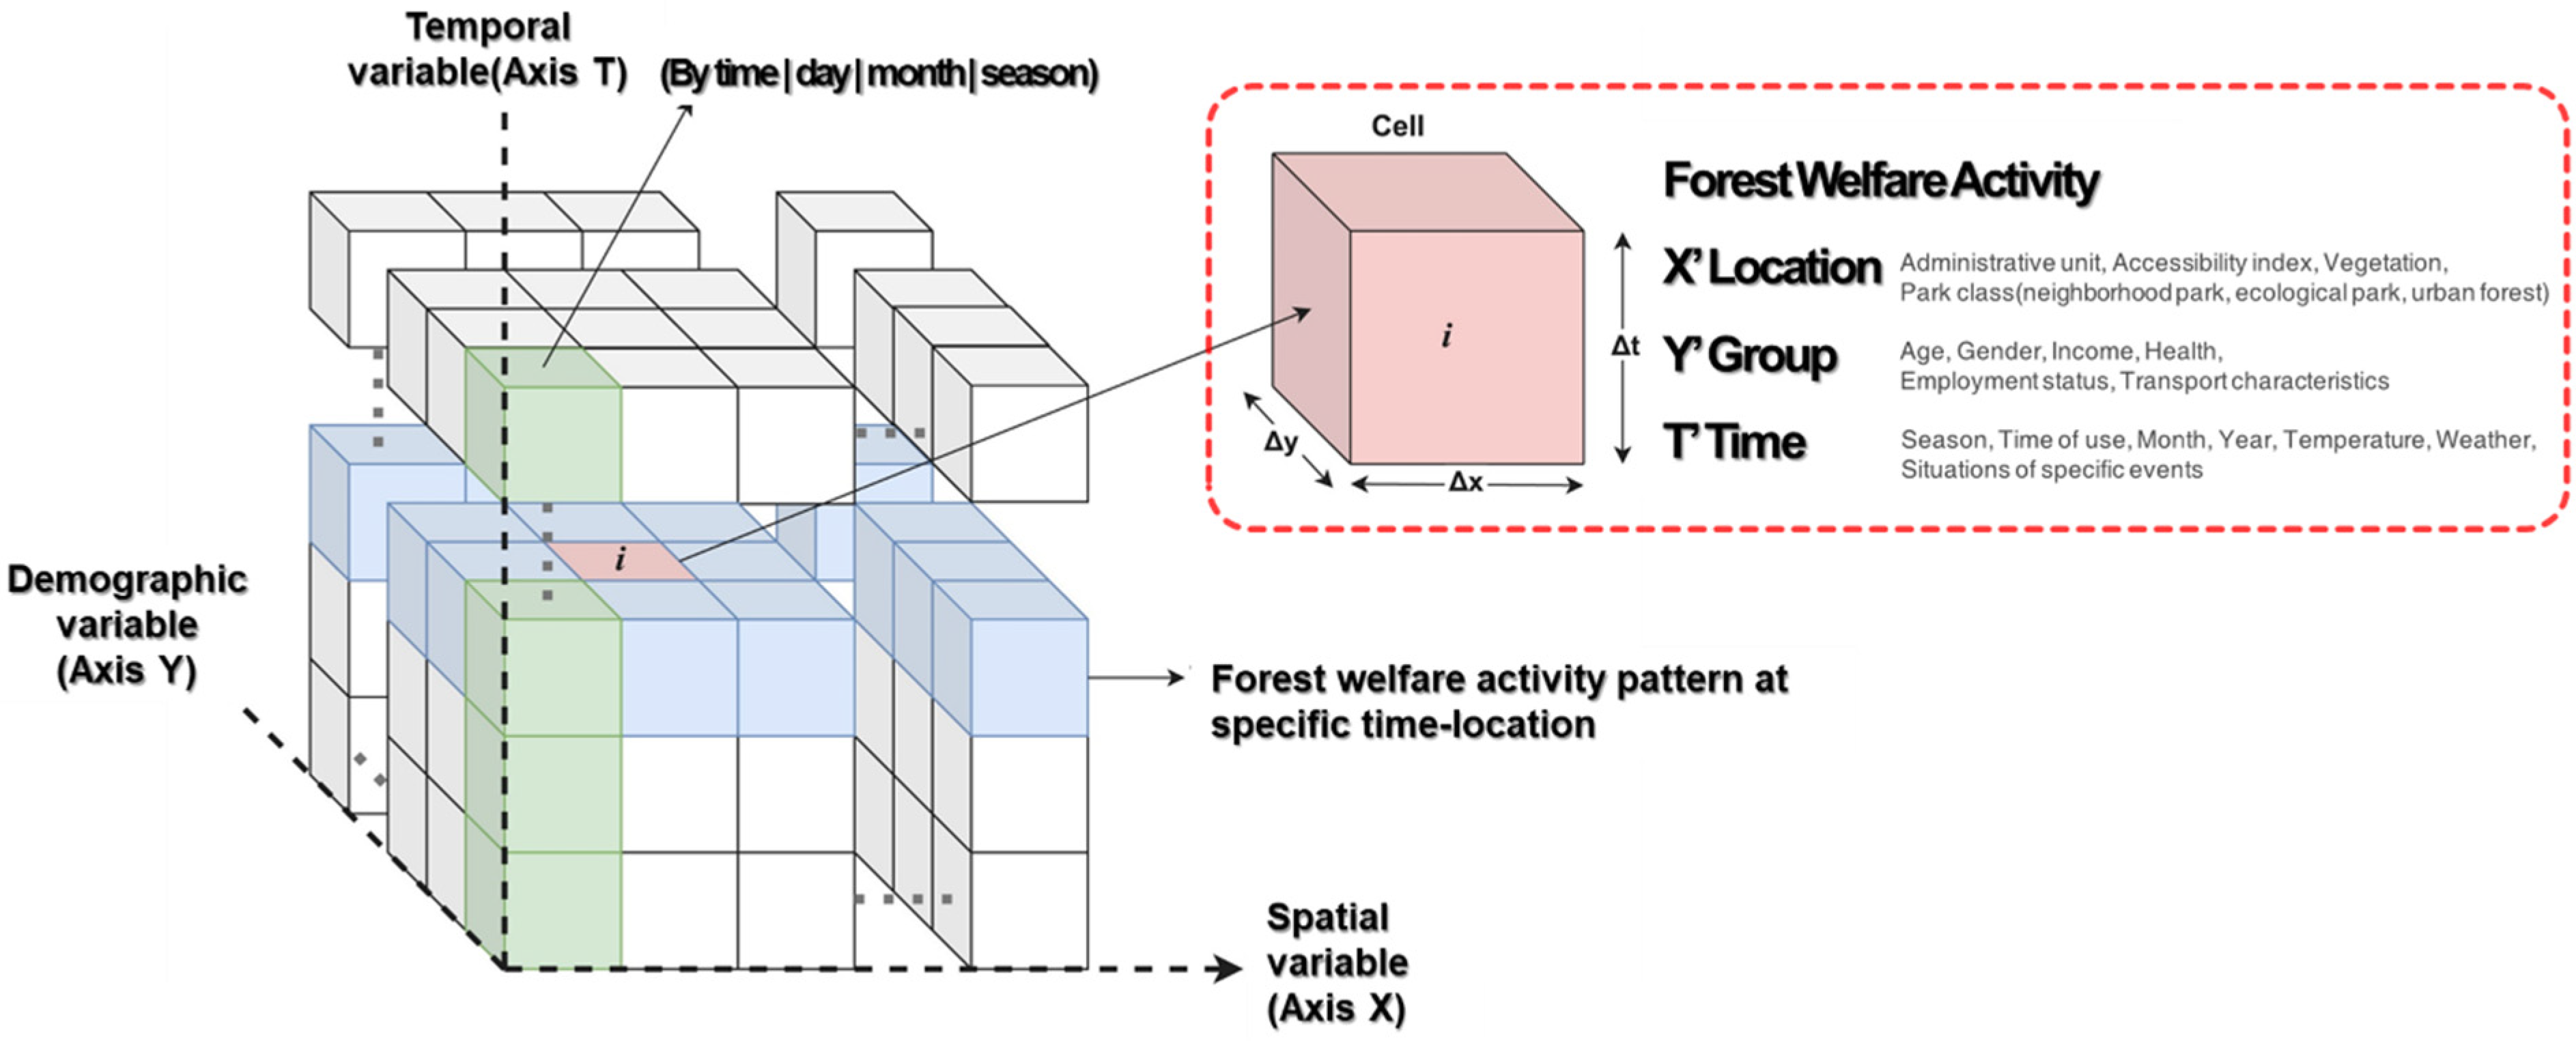
3.3. Typology and Characteristic Analysis of Social Exposure to Urban Forests

Based on periods of intensive social exposure to urban forests, forest welfare service accessibility was analyzed by precisely categorizing time units and population characteristics. This study identified periods of concentration observed through annual and seasonal time units and further analyzed accessibility on a daily and hourly basis. Temporal ranges encompass seasonal, monthly, and weekly variations and fluctuations during the morning, afternoon, and evening hours. Forest welfare service usage patterns were analyzed by applying a 30-min walking distance, and the K-means algorithm was utilized for typification.
First, the accessibility of forest welfare services was quantitatively evaluated using the Gaussian-based Two-Step Floating Catchment Area (G2SFCA) methodology. This method integrates the Gaussian density function with the traditional 2SFCA approach, incorporating the distance decay effect to precisely model the interactions between populations and green spaces [22]. Accessibility by time of day, age group, and sex was analyzed using the living population data from Seoul accumulated between 2021 and 2024. Green space data and road network information from OpenStreetMap (OSM) were used to reflect the actual feasibility of movement between buildings and green spaces.
Through this analysis, the patterns of exposure of individual green spaces to various population groups were examined, and forest welfare activities were categorized into three dimensions by integrating spatial (X), demographic (Y), and temporal (T) factors (see Figure 2). This approach enhances the equity and efficiency of urban green space resources and provides a framework for understanding the interactions between active populations and forest welfare services in urban spaces.
As shown in Algorithm 1, the G2SFCA algorithm used in this study consisted of the following two steps.
Step 1:
Calculate the building-level accessibility index.
First, reachable green spaces (supply areas) were identified for each building (demand area), and the area information for these green spaces was combined with Gaussian-based distance weights to compute a weighted sum. This process calculated the accessibility ratio (Rj) for each building. Gaussian weights (wij) were applied based on the network distance (dij) between buildings and green spaces, ensuring that nearby green spaces exert a greater influence than those farther away. The accessibility ratio (Rj) was determined by dividing the number of people residing in the building by the weighted sum of the green space area.
Step 2:
Calculate the green space-level accessibility index.
The accessibility ratios (Rj) of surrounding buildings, centered on each green space (supply area), were aggregated using Gaussian weighting. This process calculated the accessibility index (Ei) for each green space, enabling a quantitative evaluation of the population exposed to a specific green space. Finally, the calculation was performed by reapplying Gaussian weights (wij) based on the distance (dij) between green spaces and buildings.
The G2SFCA algorithm used in this study bidirectionally analyzed the interaction between green spaces and populations and is characterized by the following features:
  • It overcomes the limitations of simple distance-based accessibility evaluations by accurately incorporating the distance decay effect using a Gaussian density function.
  • It evaluates accessibility changes according to the time of day, age, and sex, allowing for a detailed analysis of social exposure patterns in urban forest usage.
  • Beyond traditional demand-oriented accessibility analyses, the algorithm assesses how each green space is exposed to diverse population groups from a supply-side perspective, thereby providing practical insights into urban forest management and resource allocation strategies.
The accessibility index derived using the G2SFCA methodology in this study was used to identify social exposure patterns based on specific times of day and population characteristics. This provides scientific evidence for efficient allocation and management strategies for urban forests.
Algorithm 1 Gaussian based 2SFCA for Supply Perspective
  Input: List of buildings P , List of green spaces S , Gaussian function parameters
  Output: Accessibility index for each building and green space
  Step 1: Calculate building-level accessibility index
  for each building j P  do
   Initialize weighted_green_area ← 0
   for each green space i S within catchment_area of j  do
       d i j ← distance between j and i
       w i j ← Gaussian weight for d i j
      weighted_green_areaweighted_green_area + (area of i × w i j )
   end for
   if weighted_green_area = 0 then
       R j ← 0 (No accessible green spaces)
   else
       R j population of j /weighted_green_area
   end if
  end for
  Step 2: Calculate green-space-level accessibility index
  for each green space i S  do
   Initialize total_accessibility ← 0
   for each building j P within catchment_area of i :
       d i j ← distance between i and j
       w i j ← Gaussian weight for d i j
      total_accessibilitytotal_accessibility + ( R j × w i j )
   end for
    E i total_accessibility
  end for
  Return: Accessibility index R j for all buildings and E i for all green spaces

4. Results

4.1. Analysis of Seasonal Variability in Social Exposure to Urban Forests

The results of the analysis showed a reversal in population dynamics between forest and non-forest areas, with the population in forest areas exceeding that of non-forest areas for approximately 16 weeks, from the 10th week (‘09’) to the 25th week (‘24’). This trend may have been influenced by seasonal factors, as green environments in forested areas become relatively more attractive or accessible during spring and early summer. Notably, this phenomenon was more pronounced on weekdays, reflecting the urban forest use patterns of active weekday populations, such as office workers and students. These findings have valuable implications for policy development aimed at enhancing urban residents’ quality of life by increasing their access to green spaces in urban areas. This trend was particularly noticeable on weekdays, indicating that green space use was relatively higher during the week.
Based on these results, this study analyzed the population exposure patterns in urban living zone green spaces using weekday data from week 10 to week 25. This analysis enhances our understanding of seasonal accessibility to forest welfare services and supports the development of policy responses in areas with high population concentrations during specific periods (see Figure 3).

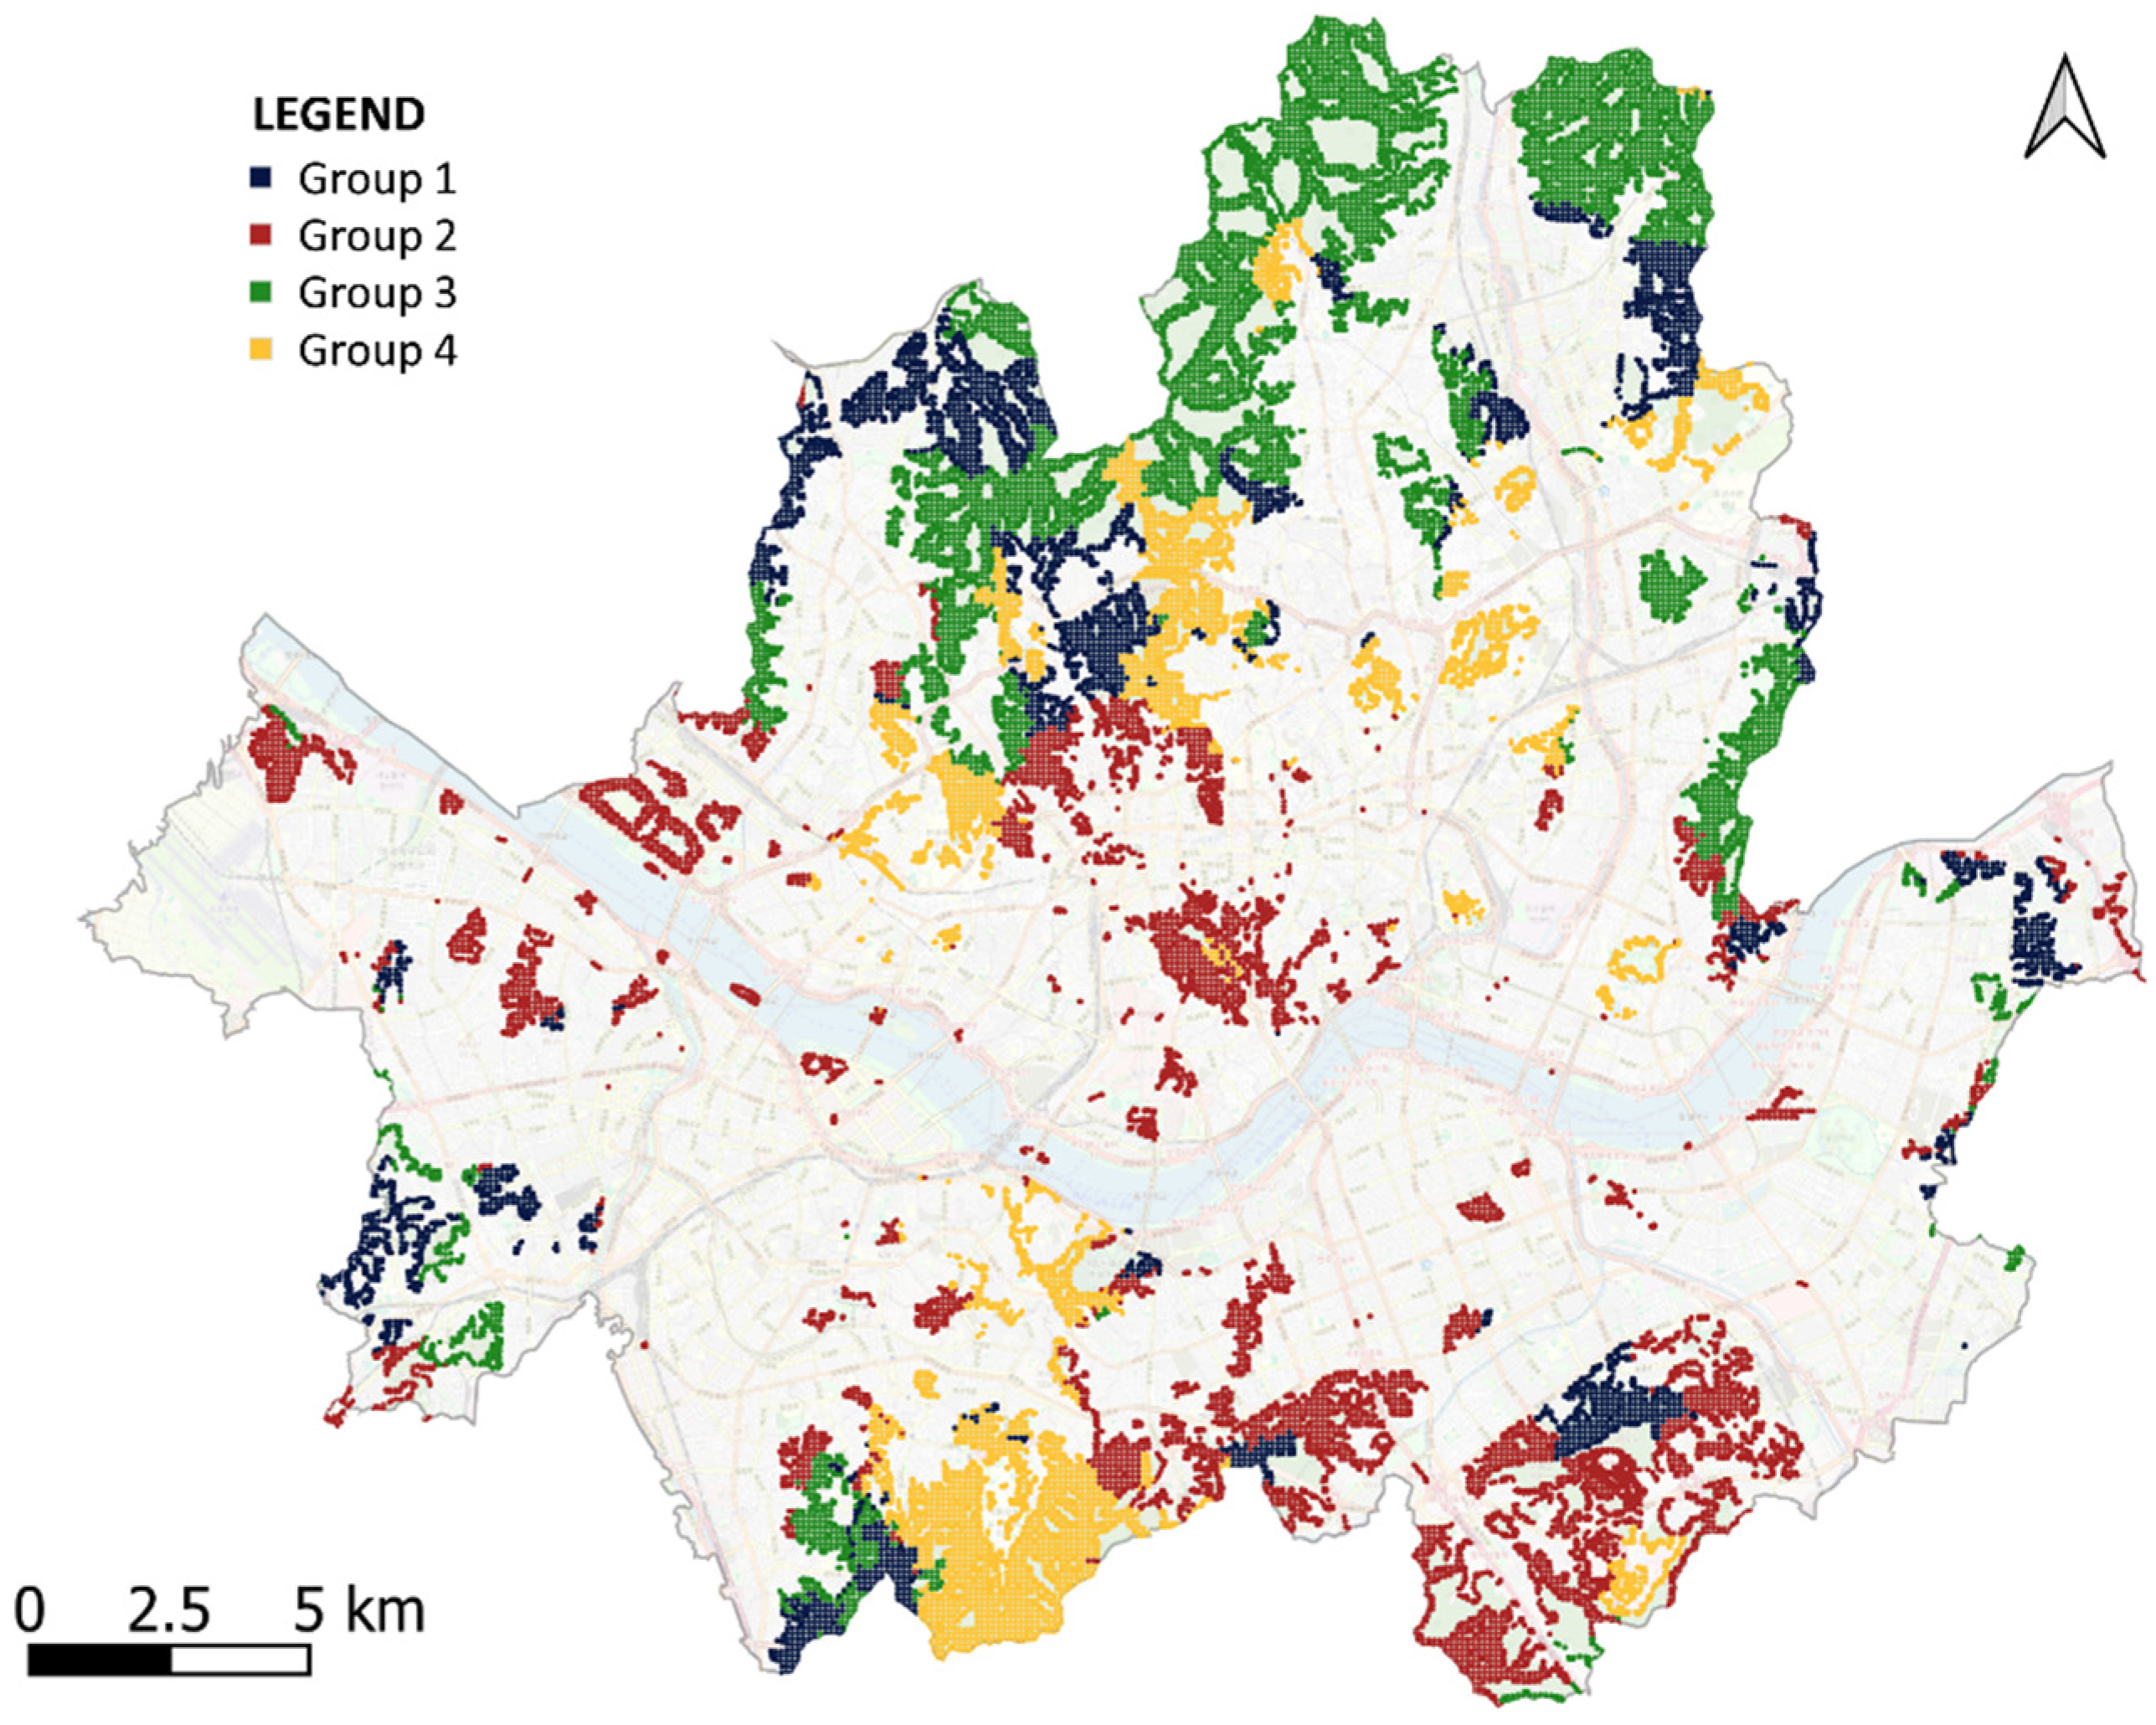
4.2. Quantitative Categorization of Social Exposure to Urban Forests Based on the G2SFCA Methodology

Based on the 2SFCA results, green space accessibility was segmented by the time of day (07:00–20:00, hourly intervals) and age group (15–69 years, in 5-year intervals). Each accessibility value was standardized using Z-standardization, enabling comparisons of population exposure patterns across different times of the day and age groups. The optimal number of clusters was determined using the elbow method, and K-means clustering was ultimately applied to classify the data into four clusters (K = 4). The K-means++ algorithm was utilized to efficiently initialize the cluster centroids.
The clustering results were visualized using elbow and silhouette plots (see Figure 4 and Figure 5), with an average silhouette score of 0.316. This was used to assess the quality of the clusters and the cohesion within each cluster. The elbow plot represents changes in the sum of squared errors (SSE) according to the number of clusters (K), and the optimal number of clusters was determined as K = 4, where the SSE reduction rate begins to plateau. The silhouette plot visually demonstrates the cohesion of data within each cluster and the separation between clusters. It confirmed that appropriate separation between clusters was achieved at K = 4.

4.3. Analysis of the Characteristics of Social Exposure Quantification by Type in Urban Forests Based on G2SFCA

The results of analyzing the exposure patterns of green space accessibility by time of day and age group are visualized below. The graph in Figure 6 shows the results after applying Z-standardization, illustrating the changes in exposure patterns according to type, time of day, and age group. The map in Figure 7 visualizes the spatial distribution by type, providing a clear view of the geographical characteristics of each type. This reveals the usage patterns and distribution of green spaces by type.
Group 1 (Type A): This group of green spaces is characterized by areas with high green space accessibility for school-aged adolescents (ages 15–19 years). This group mainly includes residential areas and regions with a strong presence of school districts, such as the Gangnam, Yangcheon, Eunpyeong, Nowon, and Gangdong districts. A key characteristic of this region is that social exposure opportunities to urban forests for the school-age population are highest during the morning hours (07:00–15:00). This trend is closely related to the distribution of schools and educational facilities and highlights the importance of green spaces within the commuting and activity radius of students. Afternoon hours (after 15:00) display increased accessibility for individuals aged 35–55. This is likely a reflection of parents and residents spending time with children after work. The map analysis shows that these areas are concentrated around schools and residential districts, indicating a strong connection between education and family life in the urban environment. These characteristics point to the potential benefit of developing strategies for green space usage to improve youth welfare and learning environments.
Group 2 (Type B): The primary users in this area are working individuals, aged 30–49. This group is concentrated in key commercial and business districts such as the Central Business District (CBD) of Seoul; the three districts of Gangnam, Yeongdeungpo, and Mapo; and the Gwanghwamun area. This area is primarily adjacent to office-dense regions and shows a slight increase in green space usage during lunch hours (12:00–14:00), which can be attributed to office workers’ breaks and short leisure activities. This type is characterized by a close connection between medium-sized green spaces and urban resting areas, serving as spaces to alleviate the stress of urban life and enhance productivity. The map analysis revealed that these areas are located in regions with excellent transportation accessibility, where both work and residential functions can be combined. This suggests the need for the development of medium-sized green spaces within the city and can contribute to planning that reflects the potential demand for green space usage during work hours.
Group 3 (Type C): This group is characterized by a high proportion of individuals over the age of 50 and is distributed in quiet residential areas on the outskirts of Seoul, near neighborhood parks. Notably, this group is found in mountainous regions with neighborhood parks, such as Dobong-gu, Gangbuk-gu, and Gwanak-gu. There is little variation by time of day, and the elderly population consistently has access to urban forests. This type is primarily associated with green spaces suitable for daily walking or leisure activities and can be interpreted as a result of considering the physical mobility and proximity of the elderly population. These areas can serve as key elements in urban design aimed at promoting health and supporting leisure activities. The map analysis revealed that the distribution of green spaces emphasizing natural elements on the outskirts of the city contributes to improving the quality of life of the elderly population.
Group 4 (Type D): This group is primarily composed of young adults in their 20s and is distributed around cultural and educational hubs as well as commercial centers, such as Hongdae, Seoul National University, Konkuk University, Daehangno, and Kyung Hee University. The green spaces in this area tend to be small parks and urban resting areas rather than large parks and are structured in a way that makes them easily accessible to the young population. In terms of the time of day, the usage was high across all hours, with a peak at lunchtime (12:00–14:00). This pattern is related to young adults’ tendency to use green spaces for academic and leisure activities. The map analysis showed that this type emphasizes the balance between the high population density in the city and small green spaces, suggesting the need for urban designs that reflect the lifestyles of the young population and the integration of leisure spaces.

5. Discussion

This study quantitatively assessed urban forest accessibility and population exposure patterns within urban living zones. By integrating the Gaussian-based Two-Step Floating Catchment Area (G2SFCA) method, the study identified disparities in accessibility based on age, gender, and time of day. These findings align with previous research highlighting the role of urban green spaces in reducing health disparities by ensuring equitable access [9,31]. However, unlike traditional static assessments, this study incorporates real-time population data, providing a more precise measurement of accessibility variations.
The results further reveal distinct social exposure patterns in urban forest utilization. The clustering analysis identified four primary user groups, each exhibiting different usage behaviors. Previous studies have emphasized the importance of green space accessibility for older adults [32]. The results of this study confirm that older adults (Type C users) predominantly prefer large-scale forests and neighborhood parks, reinforcing the need for mobility-friendly urban forest designs to accommodate aging populations. In contrast, young adults (Type D users) engage with urban green spaces in a more flexible manner, often utilizing small urban parks and rest areas. Research has shown that such environments offer restorative benefits and contribute to psychological well-being [33].
This study also shifts the analytical perspective from demand-side accessibility to supply-side exposure assessments, evaluating how urban forests are spatially distributed and utilized. Previous research has primarily focused on distance-based accessibility assessments [34], measuring the ease of reaching specific green spaces. However, this study expands upon previous models by incorporating exposure-based assessments to evaluate how urban forests function in real-world conditions. This approach supports the notion that resource allocation should be demand-responsive rather than purely supply-driven [35].
Methodologically, this study advances accessibility research by integrating real-time population data and pedestrian network analyses, overcoming the limitations of traditional Euclidean-based accessibility measures [36]. The effectiveness of the G2SFCA method in evaluating public service accessibility has been validated in prior studies [37]. This study further confirms its applicability in urban forest planning, demonstrating its potential to refine urban ecological service assessments.
Although this study provides meaningful insights into urban forest accessibility, it does not incorporate detailed ecological characteristics, such as forest type, species diversity, age, and health status, which can significantly influence urban residents’ preferences and usage behaviors [33]. Future research should integrate high-resolution ecological datasets, such as OpenStreetMap forest classification tags and governmental ecological surveys, to refine urban forest classification models. This will further enhance the applicability of exposure-based urban forest assessments in different environmental and social contexts.
By addressing spatiotemporal variations in forest accessibility, this study contributes to the development of evidence-based urban forest policies that promote equitable green space access and ensure sustainable urban ecosystem services.

6. Conclusions

This study quantitatively assessed urban forest accessibility and examined population exposure patterns in urban and suburban areas. Using the Gaussian-based Two-Step Floating Catchment Area (G2SFCA) method, this study identified four major social exposure types:
Type A:
School-age children using green spaces near schools (weekday daytime).
Type B:
Working-age adults utilizing urban forests during commuting and leisure hours.
Type C:
Older adults favoring large-scale green spaces and neighborhood parks (morning).
Type D:
Young adults frequenting small urban parks and rest areas at various times.
These findings support data-driven urban forest management strategies, particularly in addressing accessibility disparities among different demographic groups. Unlike previous studies that focused on distance-based accessibility, this research captures how different demographic groups interact with urban forests throughout the day.
This study underscores the necessity of customized urban forest management policies that prioritize social equity in accessibility. Ensuring equitable access to public resources is fundamental to reducing health disparities [38,39]. Rather than merely increasing the quantity of green spaces, a strategic and demand-responsive approach is required [35].
Additionally, previous research has highlighted that exposure to natural environments plays a crucial role in promoting human health through psychological restoration, stress reduction, and physiological benefits [40]. These mechanisms reinforce the significance of equitable access to urban forests, particularly for vulnerable populations such as older adults and individuals in high-stress environments. As our findings show that different demographic groups engage with urban green spaces in distinct ways, urban forest planning must integrate both spatial accessibility and ecological quality to maximize public health benefits.
However, this study does not incorporate detailed ecological characteristics of urban forests, such as forest type, species diversity, age, and health status, which could significantly influence urban residents’ preferences and usage behaviors [33]. Future research should integrate high-resolution ecological datasets to provide a more comprehensive understanding of urban forest functionality. Expanding the methodology to include ecological classification and forest condition assessments will further refine urban forest planning and policy-making, ensuring that green spaces maximize both equitable access and ecological benefits.

Author Contributions

Conceptualization, K.S. and J.L.; methodology, K.S. and J.L.; software, S.J.; validation, K.S. and J.L.; formal analysis, S.J.; investigation, S.K.; resources, J.L.; data curation, J.L.; writing—original draft preparation, S.J.; writing—review and editing, S.K.; visualization, S.J. and S.K.; project administration, K.S. All authors have read and agreed to the published version of the manuscript.

Funding

This research received no external funding.

Data Availability Statement

The data presented in this study are available upon request from the corresponding author.

Conflicts of Interest

The authors declare no conflicts of interest.

Abbreviations

The following abbreviations are used in this manuscript:
2SFCATwo-Step Floating Catchment Area
USGS SRTMUS Geological Survey Shuttle Radar Topography Mission

References

  1. Taylor, L.; Hochuli, D.F. Defining greenspace: Multiple uses across multiple disciplines. Landsc. Urban Plan. 2017, 158, 25–38. [Google Scholar] [CrossRef]
  2. Ekkel, E.D.; de Vries, S. Nearby green space and human health: Evaluating accessibility metrics. Landsc. Urban Plan. 2017, 157, 214–220. [Google Scholar] [CrossRef]
  3. Bratman, G.N.; Anderson, C.B.; Berman, M.G.; Cochran, B.; de Vries, S.; Flanders, J.; Folke, C.; Frumkin, H.; Gross, J.J.; Hartig, T.; et al. Nature and mental health: An ecosystem service perspective. Sci. Adv. 2019, 5, eaax0903. [Google Scholar] [CrossRef] [PubMed]
  4. Lafortezza, R.; Chen, J.; van den Bosch, C.K.; Randrup, T.B. Nature-based solutions for resilient landscapes and cities. Environ. Res. 2018, 165, 431–441. [Google Scholar] [CrossRef]
  5. Apparicio, P.; Cloutier, M.S.; Shearmur, R. The case of Montréal’s missing food deserts: Evaluation of accessibility to food supermarkets. Int. J. Health Geogr. 2007, 6, 4. [Google Scholar] [CrossRef]
  6. Statistics Korea. Seoul Population Statistics; Statistics Korea: Seoul, Republic of Korea, 2023. [Google Scholar]
  7. Seoul Metropolitan Government. Green Space Area and Urban Forest Status in Seoul; Seoul Metropolitan Government: Seoul, Republic of Korea, 2023.
  8. Rigolon, A. A complex landscape of inequity in access to urban parks: A literature review. Landsc. Urban Plan. 2016, 153, 160–169. [Google Scholar] [CrossRef]
  9. Mitchell, R.; Popham, F. Effect of exposure to natural environment on health inequalities: An observational population study. Lancet 2008, 372, 1655–1660. [Google Scholar] [CrossRef]
  10. Yoo, E.-H.; Roberts, J.E.; Eum, Y.; Li, X.; Konty, K. Exposure to urban green space may both promote and harm mental health in socially vulnerable neighborhoods: A neighborhood-scale analysis in New York City. Environ. Res. 2022, 204, 112292. [Google Scholar] [CrossRef]
  11. Haase, D.; Larondelle, N.; Andersson, E.; Artmann, M.; Borgström, S.; Breuste, J.; Gomez-Baggethun, E.; Gren, Å.; Hamstead, Z.; Hansen, R.; et al. A quantitative review of urban ecosystem service assessments: Concepts, models, and implementation. Ambio 2014, 43, 413–433. [Google Scholar] [CrossRef]
  12. Jennings, V.; Bamkole, O. The relationship between social cohesion and urban green space: An avenue for health promotion. Int. J. Environ. Res. Public Health 2019, 16, 452. [Google Scholar] [CrossRef]
  13. Grima, N.; Corcoran, W.; Hill-James, C.; Langton, B.; Sommer, H.; Fisher, B. The importance of urban natural areas and urban ecosystem services during the COVID-19 pandemic. PLoS ONE 2020, 15, e0243344. [Google Scholar] [CrossRef] [PubMed]
  14. Pouso, S.; Borja, Á.; Fleming, L.E.; Gómez-Baggethun, E.; White, M.P.; Uyarra, M.C. Contact with blue-green spaces during the COVID-19 pandemic lockdown beneficial for mental health. Sci. Total. Environ. 2021, 756, 143984. [Google Scholar] [CrossRef] [PubMed]
  15. Jung, J.-H.; Nam, J. Analysis of population activity types and regional characteristics using location-based big data in Seoul. J. Korea Plan. Assoc. 2019, 54, 75–90. [Google Scholar] [CrossRef]
  16. Korea Forest Research Institute. Evaluation Study on the Contribution of Forest Welfare Services to National Quality of Life; Korea Forest Research Institute: Seoul, Republic of Korea, 2023. [Google Scholar]
  17. Millennium Ecosystem Assessment. Ecosystems and Human Well-Being; Island Press: Washington, DC, USA, 2005. [Google Scholar]
  18. Choi, M.; Jo, J.; Kim, H.J.; Ji, S. Mapping the Unseen: Integrating Hiking Activities Into Spatially Explicit Cultural Ecosystem Service Assessment Through Agent-Based Modeling. Trans. GIS 2025, 29, e13285. [Google Scholar] [CrossRef]
  19. McGrail, M.R. Spatial accessibility of primary health care utilising the two step floating catchment area method: An assessment of recent improvements. Int. J. Health Geogr. 2012, 11, 50. [Google Scholar] [CrossRef]
  20. Luo, W.; Wang, F. Measures of spatial accessibility to health care in a GIS environment: Synthesis and a case study in the chicago region. Environ. Plan. B Plan. Des. 2003, 30, 865–884. [Google Scholar] [CrossRef]
  21. Apparicio, P.; Séguin, A.-M.; Naud, D. The quality of the urban environment around public housing buildings in montréal: An objective approach based on GIS and multivariate statistical analysis. Soc. Indic. Res. 2008, 86, 355–380. [Google Scholar] [CrossRef]
  22. Chen, X.; Jia, P. A comparative analysis of accessibility measures by the two-step floating catchment area (2SFCA) method. Int. J. Geogr. Inf. Sci. 2019, 33, 1739–1758. [Google Scholar] [CrossRef]
  23. Delamater, P.L. Spatial accessibility in suboptimally configured health care systems: A modified two-step floating catchment area (M2SFCA) metric. Health Place 2013, 24, 30–43. [Google Scholar] [CrossRef]
  24. MacQueen, J. Some Methods for Classification and Analysis of Multivariate Observations. In Proceedings of the 5th Berkeley Symposium on Mathematical Statistics and Probability, Berkeley, CA, USA, 21 June–18 July 1965 and 27 December 1965–7 January 1966; University of California Press: Oakland, CA, USA, 1967. [Google Scholar]
  25. Lloyd, S. Least squares quantization in PCM. IEEE Trans. Inf. Theory 1982, 28, 129–137. [Google Scholar] [CrossRef]
  26. Arthur, D.; Vassilvitskii, S. K-Means++: The Advantages of Careful Seeding. In Proceedings of the Eighteenth Annual ACM-SIAM Symposium on Discrete Algorithms, New Orleans, LA, USA, 7–9 January 2007; pp. 1027–1035. [Google Scholar]
  27. Seo, Y.; Lee, G. Estimation of the de Facto Population at the Building Scale Using a Dasymetric Mapping Method Based on GWR. J. Korean Cartogr. Assoc. 2023, 23, 21–34. [Google Scholar]
  28. Apparicio, P.; Abdelmajid, M.; Riva, M.; Shearmur, R. Comparing alternative approaches to measuring the geographical accessibility of urban health services: Distance types and aggregation-error issues. Int. J. Health Geogr. 2008, 7, 7. [Google Scholar] [CrossRef]
  29. Kang, J.; Hwang, C. Reproducibility and replicability of GIS and spatial analysis research: A case study of the Journal of the Korean Geographical Society. J. Korean Geogr. Soc. 2022, 57, 425–435. [Google Scholar]
  30. Goodchild, M.F.; Li, L. Assuring the quality of volunteered geographic information. Spat. Stat. 2012, 1, 110–120. [Google Scholar] [CrossRef]
  31. Thompson, C.W.; Aspinall, P.; Montarzino, A. The restorative benefits of nearby nature in urban settings. Environ. Behav. 2012, 40, 402–425. [Google Scholar]
  32. Neuvonen, M.; Sievänen, T.; Tönnes, S.; Koskela, T. Access to green areas and the frequency of visits—A case study in Helsinki. Urban For. Urban Green. 2007, 6, 235–247. [Google Scholar] [CrossRef]
  33. Walsh, J.A.; Warren, K.S. Selective primary health care: An interim strategy for disease control in developing countries. Soc. Sci. Med. Part C Med Econ. 1980, 14, 145–163. [Google Scholar] [CrossRef]
  34. Maas, J.; Verheij, R.A.; Groenewegen, P.P.; de Vries, S.; Spreeuwenberg, P. Green space, urbanity, and health: How strong is the relation? J. Epidemiol. Community Health 2006, 60, 587–592. [Google Scholar] [CrossRef]
  35. Starfield, B.; Shi, L.; Macinko, J. Contribution of primary care to health systems and health. Milbank Q. 2005, 83, 457–502. [Google Scholar] [CrossRef]
  36. Farber, S.; Morang, M.Z.; Widener, M.J. Temporal variability in transit-based accessibility to supermarkets. Appl. Geogr. 2014, 53, 149–159. [Google Scholar] [CrossRef]
  37. Kim, H.; Jeon, J. Evaluating public service accessibility using the G2SFCA method. Int. J. Geogr. Inf. Sci. 2021, 35, 267–290. [Google Scholar]
  38. Ivanova, N. Global Overview of the Application of the Braun-Blanquet Approach in Research. Forests 2024, 15, 937. [Google Scholar] [CrossRef]
  39. WHO. The World Health Report 2008: Primary Health Care—Now More Than Ever; World Health Organization: Geneva, Switzerland, 2008. [Google Scholar]
  40. Sugiyama, T.; Leslie, E.; Giles-Corti, B.; Owen, N. Associations of neighbourhood greenness with physical and mental health: Do walking, social coherence and local social interaction explain the relationships? J. Epidemiol. Community Health 2008, 62, e9. [Google Scholar] [CrossRef] [PubMed]
Figure 1. Research workflow illustrating data sources, methodology, and analysis process.
Forests 16 00510 g001
Figure 2. Forest welfare activity pattern—conceptual framework for analyzing forest welfare activity patterns.
Forests 16 00510 g002
Figure 3. Comparison of population density between urban and forest areas.
Forests 16 00510 g003
Figure 4. Elbow plot for determining the optimal number of clusters. The red box highlights the elbow point at K = 4.
Forests 16 00510 g004
Figure 5. Silhouette plot for K = 4. The red dashed line indicates the average silhouette score.
Forests 16 00510 g005
Figure 6. Time- and group-based population exposure patterns to green spaces by cluster.
Forests 16 00510 g006
Figure 7. Spatial distribution of green space clusters.
Forests 16 00510 g007
Table 1. Formula to estimate the living population of a specific building.
P o p x = P i × W x P o p x : Living population at point x
P i : Living population in census block i
W x : Population weight at point x (floor area of an individual building/total floor area of aggregation zone i)
Table 2. Green space accessibility analysis.
Data TypeOSM Tags (Predefined OSM Queries for Data Extraction)Geometry Type
Green Spacelanduse = “forest”
OR natural = “wood”
Excluded geometries: aeroway = “aerodrome” OR natural = “water”
Polygon
Road Networkhighway = *
AND highway NOT IN [“motorway”, “trunk”, “busway”]
Line
Disclaimer/Publisher’s Note: The statements, opinions and data contained in all publications are solely those of the individual author(s) and contributor(s) and not of MDPI and/or the editor(s). MDPI and/or the editor(s) disclaim responsibility for any injury to people or property resulting from any ideas, methods, instructions or products referred to in the content.

