Communication

Forest Soil Fungal Diversity in Stands of Norway Spruce (Picea abies (L.) Karst.) of Different Ages

1
Latvian State Forest Research Institute Silava, Rigas Str. 111, LV-2169 Salaspils, Latvia
2
Faculty of Forest and Environmental Sciences, Latvia University of Life Sciences and Technologies, Akademijas Str. 11, LV-3001 Jelgava, Latvia
*
Author to whom correspondence should be addressed.
Forests 2025, 16(3), 500; https://doi.org/10.3390/f16030500
Submission received: 20 January 2025 / Revised: 26 February 2025 / Accepted: 6 March 2025 / Published: 12 March 2025
(This article belongs to the Section Forest Biodiversity)

Abstract

:
Fungal communities can be used as indicators of various environmental processes in forest ecosystems. The diversity of these communities is linked to aboveground plants and soil properties. We assessed fungal diversity at four Norway spruce sampling sites that were growing on fertile mineral soils (Oxalidosa) in northwestern Latvia. Three sites were managed—a three-year-old clear-cut and fifty- and eighty-five-year-old stands; one site was unmanaged—a naturally regenerated site after wind damage in 1969. For metabarcoding, we used a fungal internal transcribed spacer (ITS2) and high throughput sequencing with the Ion Torrent platform. Our results showed high operational taxonomic unit richness in the samples, with notable variation in community composition between individual plots both within and among sites, with the highest being in managed, middle-aged stands and the lowest in unmanaged. Significant differences in the diversity of soil fungal communities were not detected between the sites. Redundancy analysis indicated that pH, soil organic matter, organic carbon, and nitrogen were the most important soil variables that explained the variation in fungal communities. The unmanaged stand differed notably by community composition. This study highlights the importance of monitoring forest soil environmental parameters and fungal communities to gain a more comprehensive assessment of forestry management regimes.

1. Introduction

Fungi play essential roles in forest ecosystems as symbionts and decomposers [1,2]; therefore, fungi can be used as indicators of environmental processes [3]. Soil fungi support almost all higher life forms and facilitate biogeochemical cycling in ecosystems [4]. Forest soil fungi function as mutualistic symbionts, saprotrophs, and pathogens [5], and their biodiversity is closely tied to soil health and carbon cycling [6,7]. Soil fungal diversity is regulated by biotic (e.g., plants, animals) and abiotic (e.g., pH, soil moisture and structure) factors [8,9]. It is estimated that 2.2 to 3.8 million fungi species exist, vastly exceeding the richness of plant species, yet only 3%–8% have been formally described [10].
Forest disturbances, both natural and anthropogenic, alter the soil microbiome [4,11]. Forest management practices, especially clear-cutting, impact biodiversity and ecosystem functioning [12,13], including soil fungal diversity [14]. Changes in forest structure, biomass amounts, and dead wood volume trigger a chain of effects for environments above and below ground [15]. Additionally, forest management affects forest soil carbon-to-nitrogen (C:N) ratios [16,17], which are important for soil microbial communities [18].
Intensive forest management can homogenize the biota [19,20], often leading to biodiversity loss. However, retention forest management and other practices can mitigate these impacts while maintaining demanding timber production goals [21,22]. Continuous cover forestry, for example, is reported to retain fungal communities similar to those in unmanaged forests [23]. Soil microbiomes have shown notable recovery patterns during forest ecosystem restoration [24]. Latvia, which is a part of the Nordic–Baltic region, practices intensive forest management, modeled after Scandinavian forestry methods [25]. Harvested volumes have increased over recent decades and reach on average 45%–50% of increment [26,27].
This study is an initial assessment of fungal biodiversity and soil parameters in hemiboreal Norway spruce stands with various management histories. Advances in DNA sequencing techniques have enabled a rapid expansion of research in soil microbial communities [4], offering valuable insights into fungal diversity and its environmental drivers [28,29]. Cataloging and monitoring belowground fungal communities and environmental parameters in forest soils will enable a more thorough assessment of the effects of various forestr management regimes [30].

2. Materials and Methods

2.1. Study Sites and Sampling

The climate in Latvia is cool and moist; according to the Latvian Environment, Geology and Meteorology Centre data, the mean annual temperature is 7.1 °C, and the annual amount of precipitation reaches 683 mm [31]. The terrain of Latvia is mostly flat, with several hilly glacial uplands and wide plains, lowlands, and river valleys.
Forests cover 54% of Latvia’s terrestrial area. Clear-cuts are the dominant method for timber harvesting [32]. Almost half of the forests are state-owned, and the rest are private—commercial, family, church, and municipal forests [33]. Dominant tree species include Scots pine (Pinus sylvestris L.), silver and downy birch (Betula pendula Roth and Betula pubescens Ehrh.), and Norway spruce (Picea abies (L.) H. Karst.).
Samples (n = 16) were collected in June 2017 from four sites in northwestern Latvia (Figure 1). Each site represented different forest management history (type) and age for Norway spruce growing on fertile mineral soils (Oxalidosa type according to Bušs [34]): (1) 50-year-old managed stand (50); (2) 85-year-old managed stand (85); (3) 3-year-old clear-cut (CC); and (4) unmanaged forest (naturally regenerated site after wind damage in 1969) (UM) (Table 1).
At each site, four composite samples were collected, with each composite consisting of seven soil cores taken from four circle (d = 2 m) plots arranged in a square with an edge length of 50 m (Figure 1). After removing the litter and organic layers, soil cores (0–10 cm depth) were collected from the topsoil at each circle using a sterile stainless-steel pipe (10 × 5 cm), pooled into clean zip-lock bags, and homogenized by hand. Samples were stored on ice, transported to the laboratory within 12 h, sieved (1 mm mesh), divided into two subsamples, and then stored at −80 °C before DNA extraction or at room temperature before physicochemical analysis.

2.2. Environmental Variables

Soil samples were analyzed at the Soil Analytical Laboratory of the Latvian State Forest Research Institute Silava. Soil pH was measured using a glass electrode in a 1:5 (v/v) suspension of soil in water. Total phosphorus content was measured using colorimetry (Jenway 6300 (Cole-Parmer Ltd., Stone, UK)) in HNO3 extract, prepared by reflux method with a Behr SMA-12 (Behr GmbH, Düsseldorf, Germany). Total carbon was measured with an ELTRA CS-530 (ELTRA GmbH, Haan, Germany) after dry combustion, by oxidizing C to CO2 at 1340 °C. Soil organic matter (SOM) was measured by ashing the sample in a muffle furnace (Nabertherm P330 (Nabertherm GmbH, Lilienthal, Germany)) at 450 °C. Total nitrogen was measured using the modified Kjeldahl method with a Bloc Digest 12 (J.P. Selecta, Barcelona, Spain) and Pro Nitro I (J.P. Selecta, Barcelona, Spain).

2.3. DNA Extraction and High-Throughput Sequencing

Total genomic DNA was extracted from 250 mg sieved and homogenized soil using the PowerSoil DNA Isolation kit (MO-BIO Laboratories, Carlsbad, CA, USA) and bead-beating homogenization (MM400 (Retsch GmbH, Haan, Germany)) for 2 × 5 min at full power (30 Hz). The extracted DNA was visualized in 1% agarose gel, and its concentration was measured using a Qubit BR kit (Life Technologies, Paisley, UK). One-step PCR amplification was performed with a set of 10 barcoded primers targeting the ribosomal internal transcribed spacer region ITS2, designed specifically for the Ion Torrent sequencing platform. The forward primer had the following structure: 5′-Ion Torrent adapter sequence A-Key sequence-Tag barcode (IonXpress 080-089)-GAT-template specific primer (gITS7)-3′ (5′-CCATCTCATCCCTGCGTGTCTCCGAC-TCAG-xxxxxxxxxxxx-GAT-GTGARTCATCGARTCTTTG-3′). The reverse primer had the following structure: 5′-Ion Torrent adapter sequence P1-template specific primer (ITS4)-3′ (5′-CCTCTC-TATGGGCAGTCGGTGAT-TCCTCCGCTTATTGATATGC-3′). PCR conditions were set up as follows: 5× HOT FIREPol Blend Master Mix (Solis BioDyne OÜ, Tartu, Estonia), 5 ng of DNA, and 0.5 µM of each forward and reverse primer in a 30 µL reaction volume. Thermocycling included an initial denaturation at 95 °C for 12 min, followed by 35 cycles of 30 s at 95 °C, 30 s at 57 °C, and 30 s at 72 °C, with a final elongation for 10 min at 72 °C.
Pooled PCR duplicates were purified and size selected using the NucleoMag NGS Clean-up and Size Select kit (Macherey-Nagel, Düren, Germany), following the manufacturer’s instructions. The cleaned samples were analyzed using an Agilent 2100 Bio-analyzer (Agilent, Santa Clara, CA, USA), equimolarly pooled and sequenced on an Ion PGM sequencer with an Ion 318 Chip (Thermo Fisher Scientific, Waltham, MA, USA) for read length—400 bp. Amplicon sequencing was performed in two separate runs at the Latvian Biomedical Research and Study Centre.

2.4. Bioinformatics and Statistical Analyses

Raw sequences were demultiplexed and filtered in Torrent Suite Software (v5.6.0) (Thermo Fisher Scientific, Waltham, MA, USA). Demultiplexed sequences were processed using the PipeCraft2 [35] pipeline in the following steps. Second quality filtration was performed using trimmomatic (v0.39) [36] with parameters: sliding window—10, average quality per window—Q22, minimal length—200 bp, resulting on average 182,000 reads per sample. Chimeric sequences were removed with vsearch (v2.23.0) uchime de novo algorithm [37] with default settings. ITS2 region was extracted using ITSx (v1.1.3) [38] with an e-value threshold 1 × 10⁻² and clustered using vsearch at 97% similarity level, resulting in an OTU (Operational Taxonomical Units) table with 2342 features. Taxonomy to OTUs was assigned using BLAST (v2.14.0) [39] with default settings (e-value = 1 × 10⁻¹⁰, word size = 11, reward = 2, penalty = −3, gap open = 5, gap extend = 2) and the UNITE v10.0 database [40]. The representative sequences of OTUs with similarity <70% to any taxon or BLASTn e-value > ×10−50 were considered unidentified at the phylum level.
Fungal communities were analyzed in R software, version 4.4.0 [41], using the packages vegan (v2.6-8) [42], phyloseq (v1.48.0) [43], microeco (v1.9.1) [44], and ampvis2 (v2.8.9) [45]. OTUs with a total read count of fewer than 10 were excluded from the dataset to minimize the potential effects of PCR artifacts and sequencing errors on diversity estimates. To ensure comparability across samples, the dataset was rarefied to the lowest read count of 17,748. Alpha diversity was estimated with the microeco package and compared using a Dunn’s Kruskal–Wallis Multiple Comparison test. The overall taxonomic composition among the samples was characterized using the Bray–Curtis dissimilarity matrix and non-metric Multi-Dimensional Scaling (NMDS), and differences between the sites were tested with a PERMANOVA test (999 permutations, adonis2 function in the vegan package). For the PERMANOVA test, the assumption of group homogeneity was tested with the betadisper function in the vegan package. Fungal functional traits were assigned with FungalTraits, implemented through the microeco R package) [46]. Pearson correlations were calculated between diversity values and environmental variables. Relationships between the composition of fungal genera and environmental variables were visualized with redundancy analysis (RDA) using the microeco package in R.

3. Results

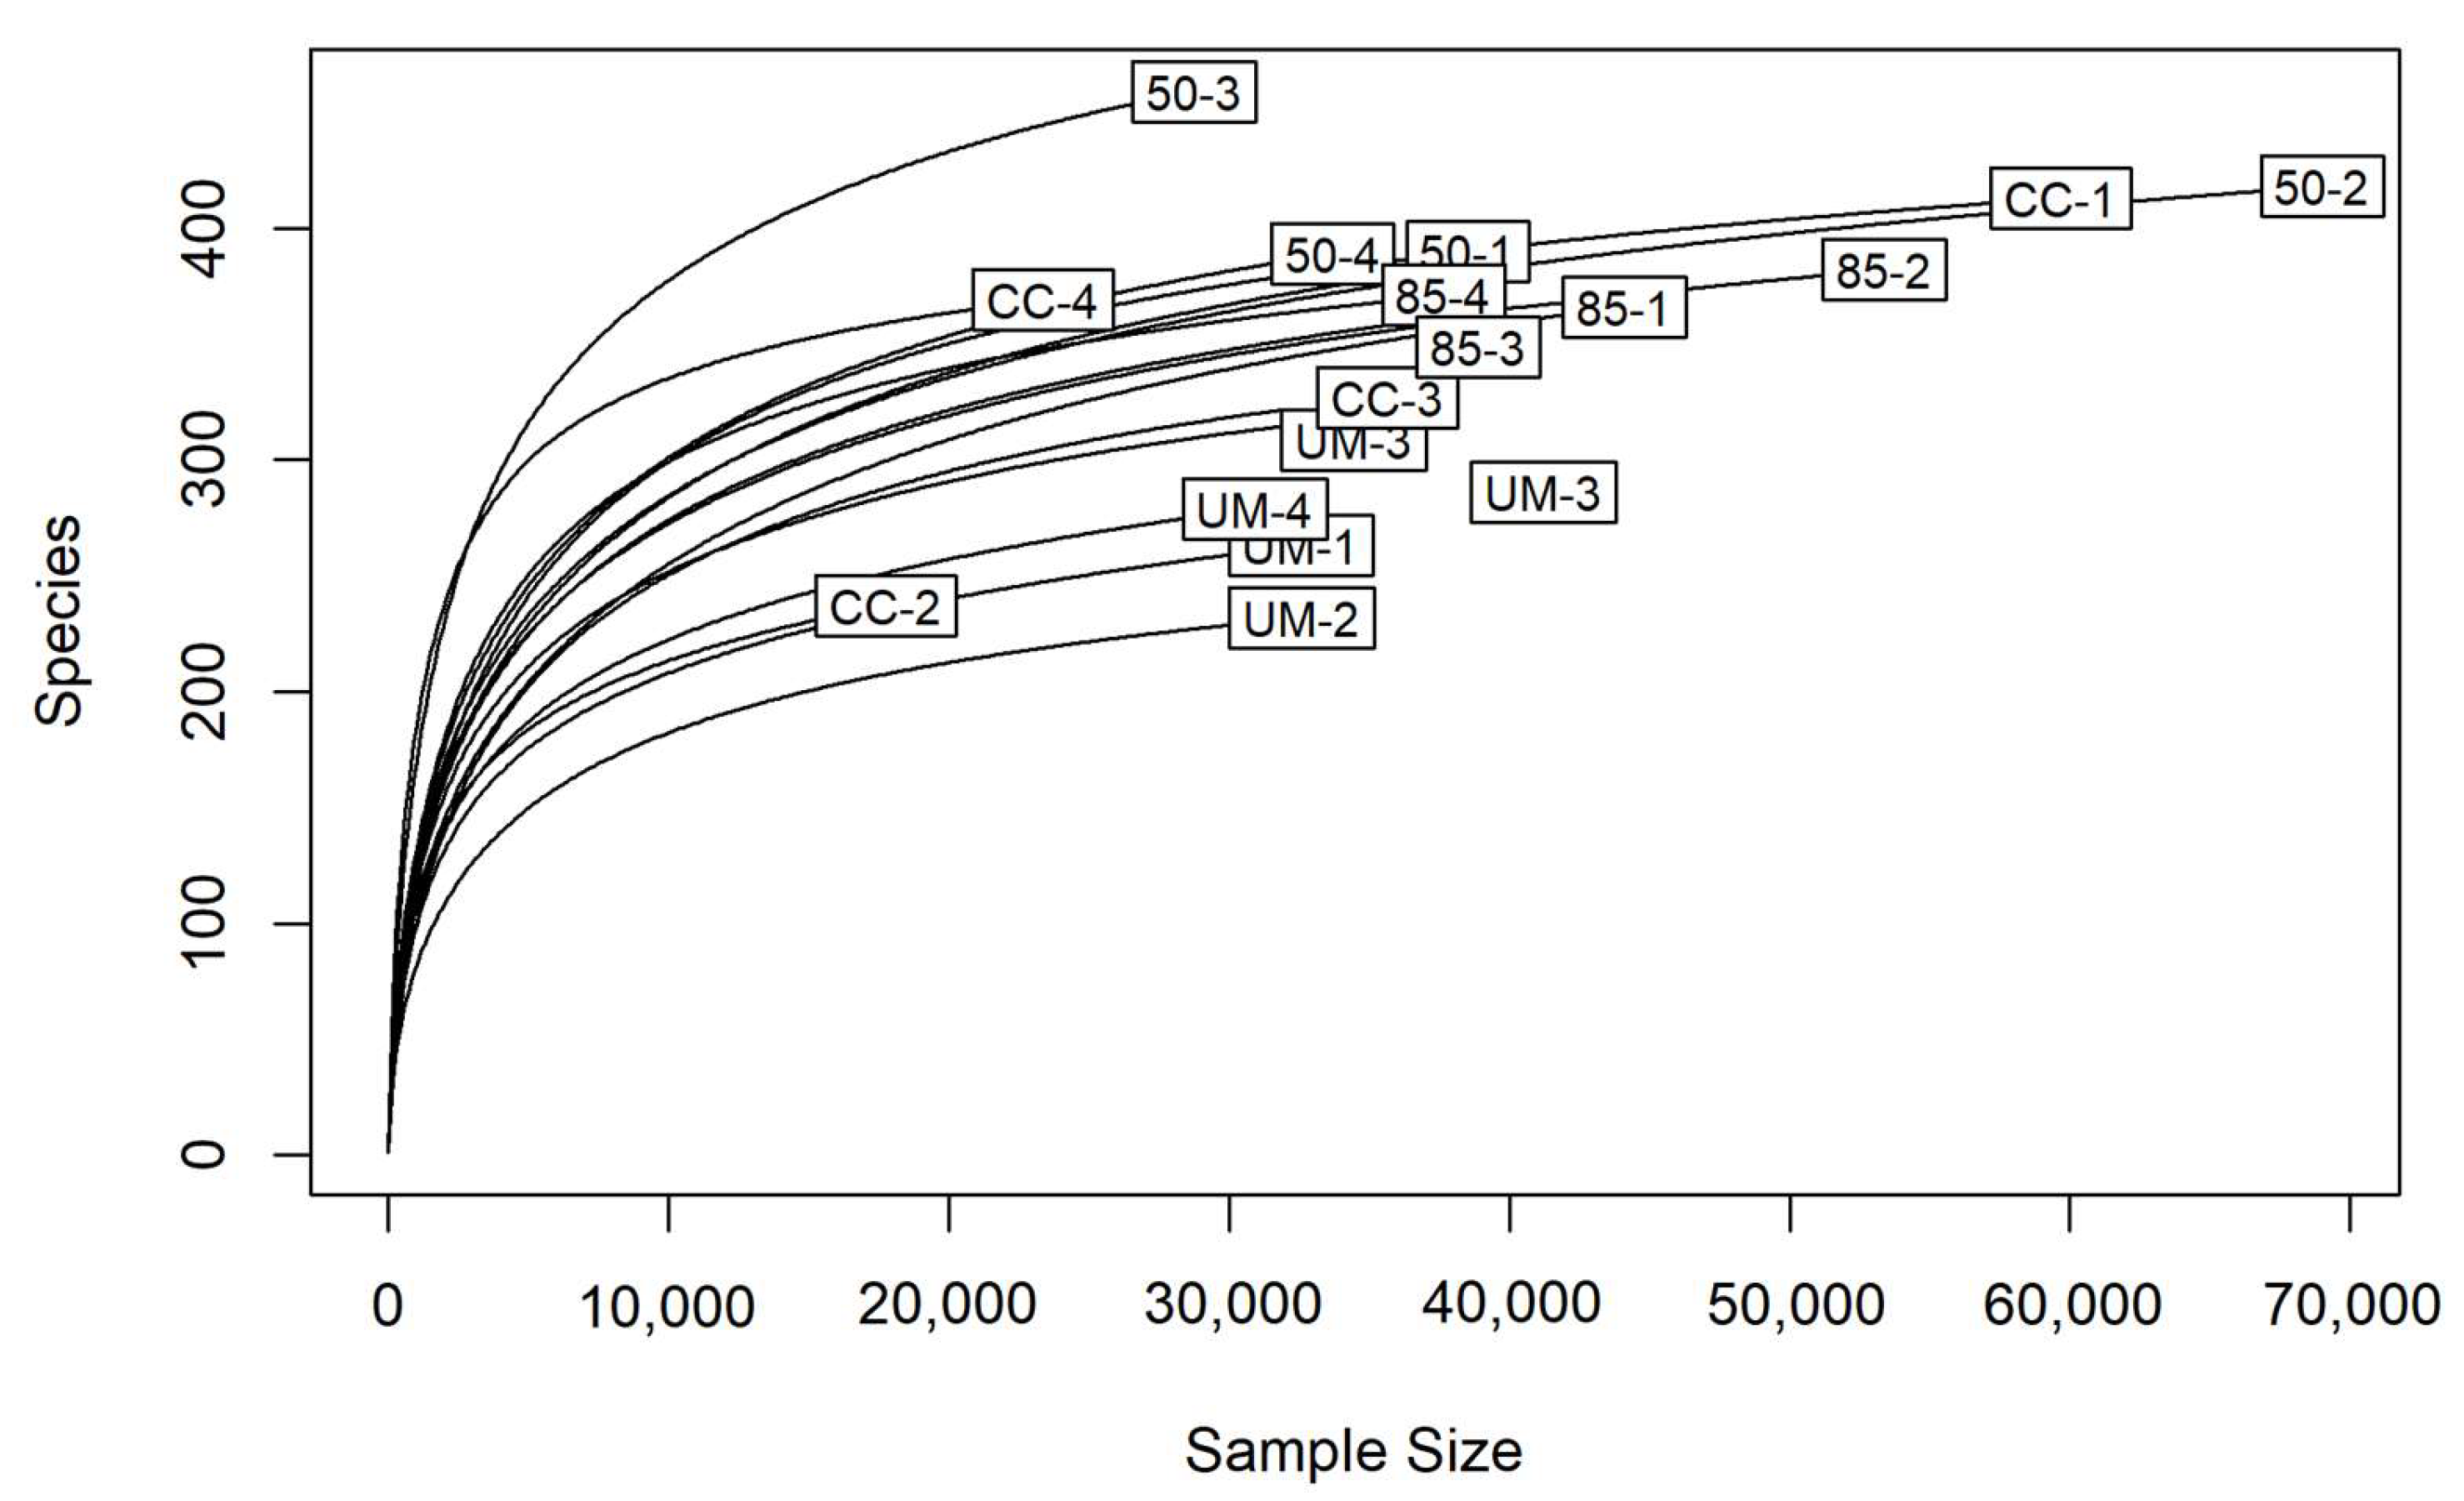
3.1. Sequence Analysis

A total of 9,394,676 sequencing reads were obtained, with an average of 417,225 barcoded reads per sample. After quality filtering, chimera removal, and ITS2 region extraction, 617,765 reads were used for the generation of an OTU table with 2341 OTUs. Applying a minimal read count threshold of 10 reduced the OTU table to 1160 OTUs. The rarefaction curves indicated that the sequencing depth was sufficient for capturing the diversity within the samples (Figure 2).
The proportions of taxonomic assignments for phylum, class, order, family, genus, and species were 0.89, 0.82, 0.75, 0.62, 0.55, and 0.31 respectively.

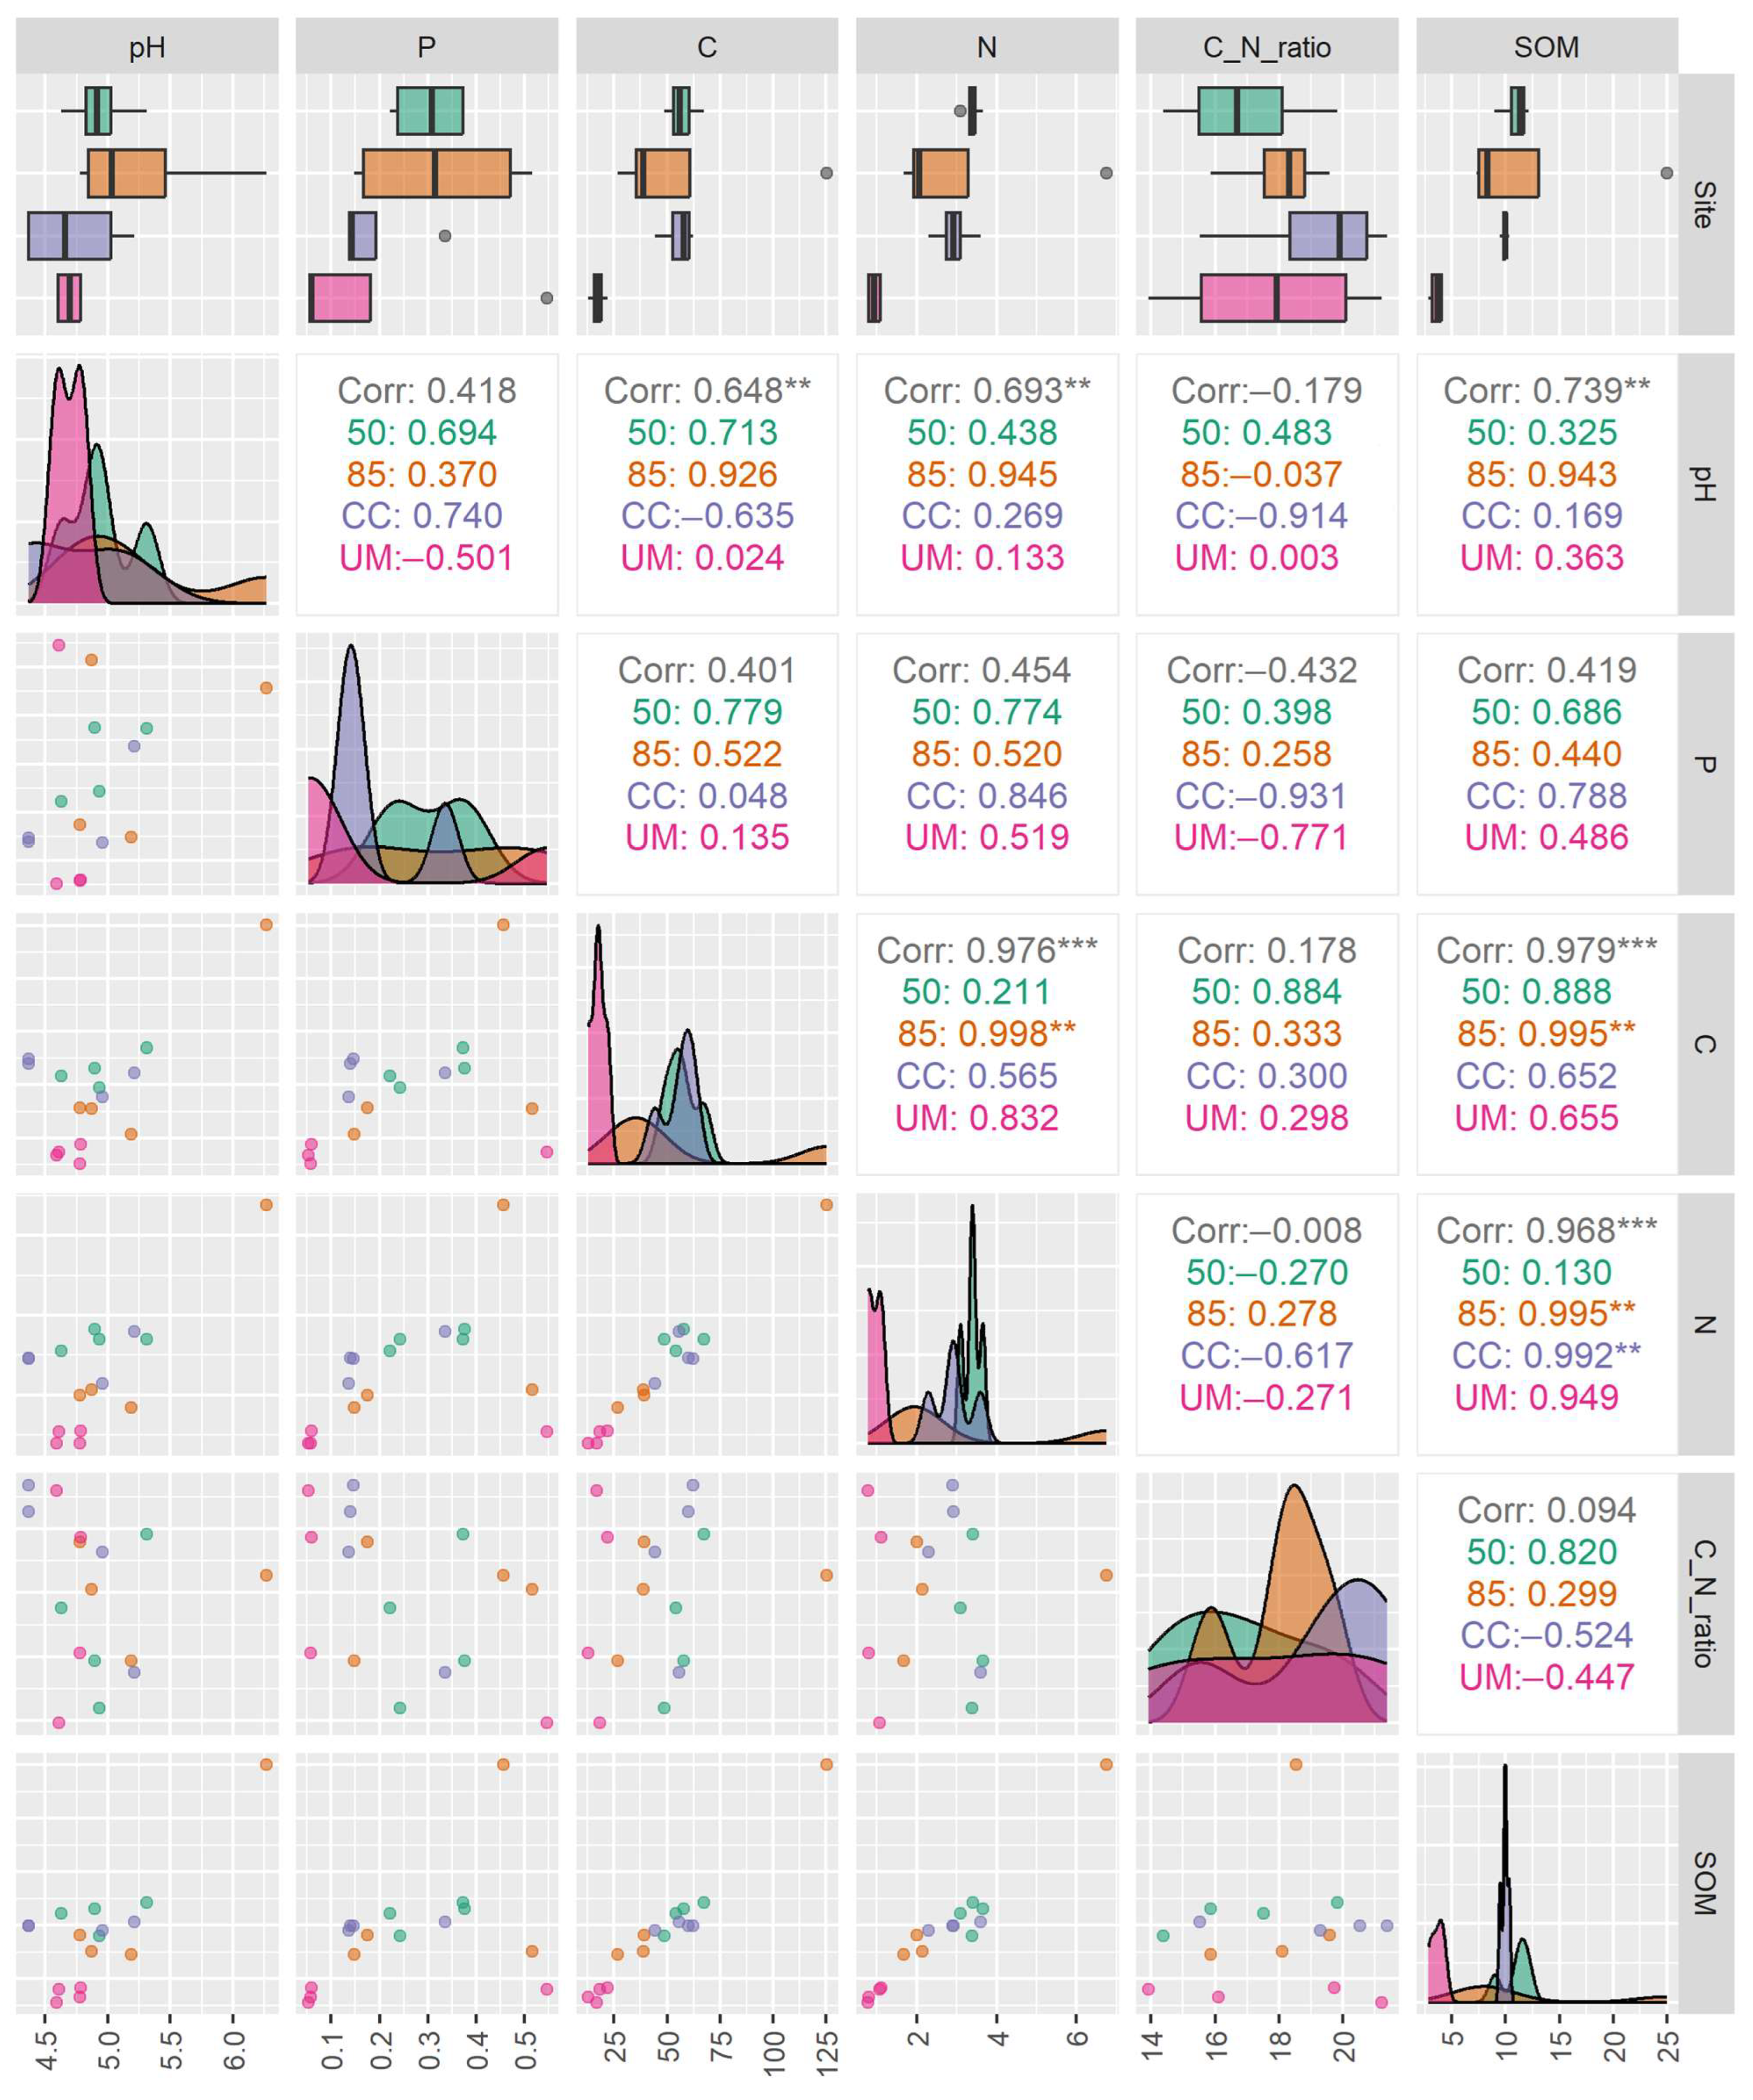
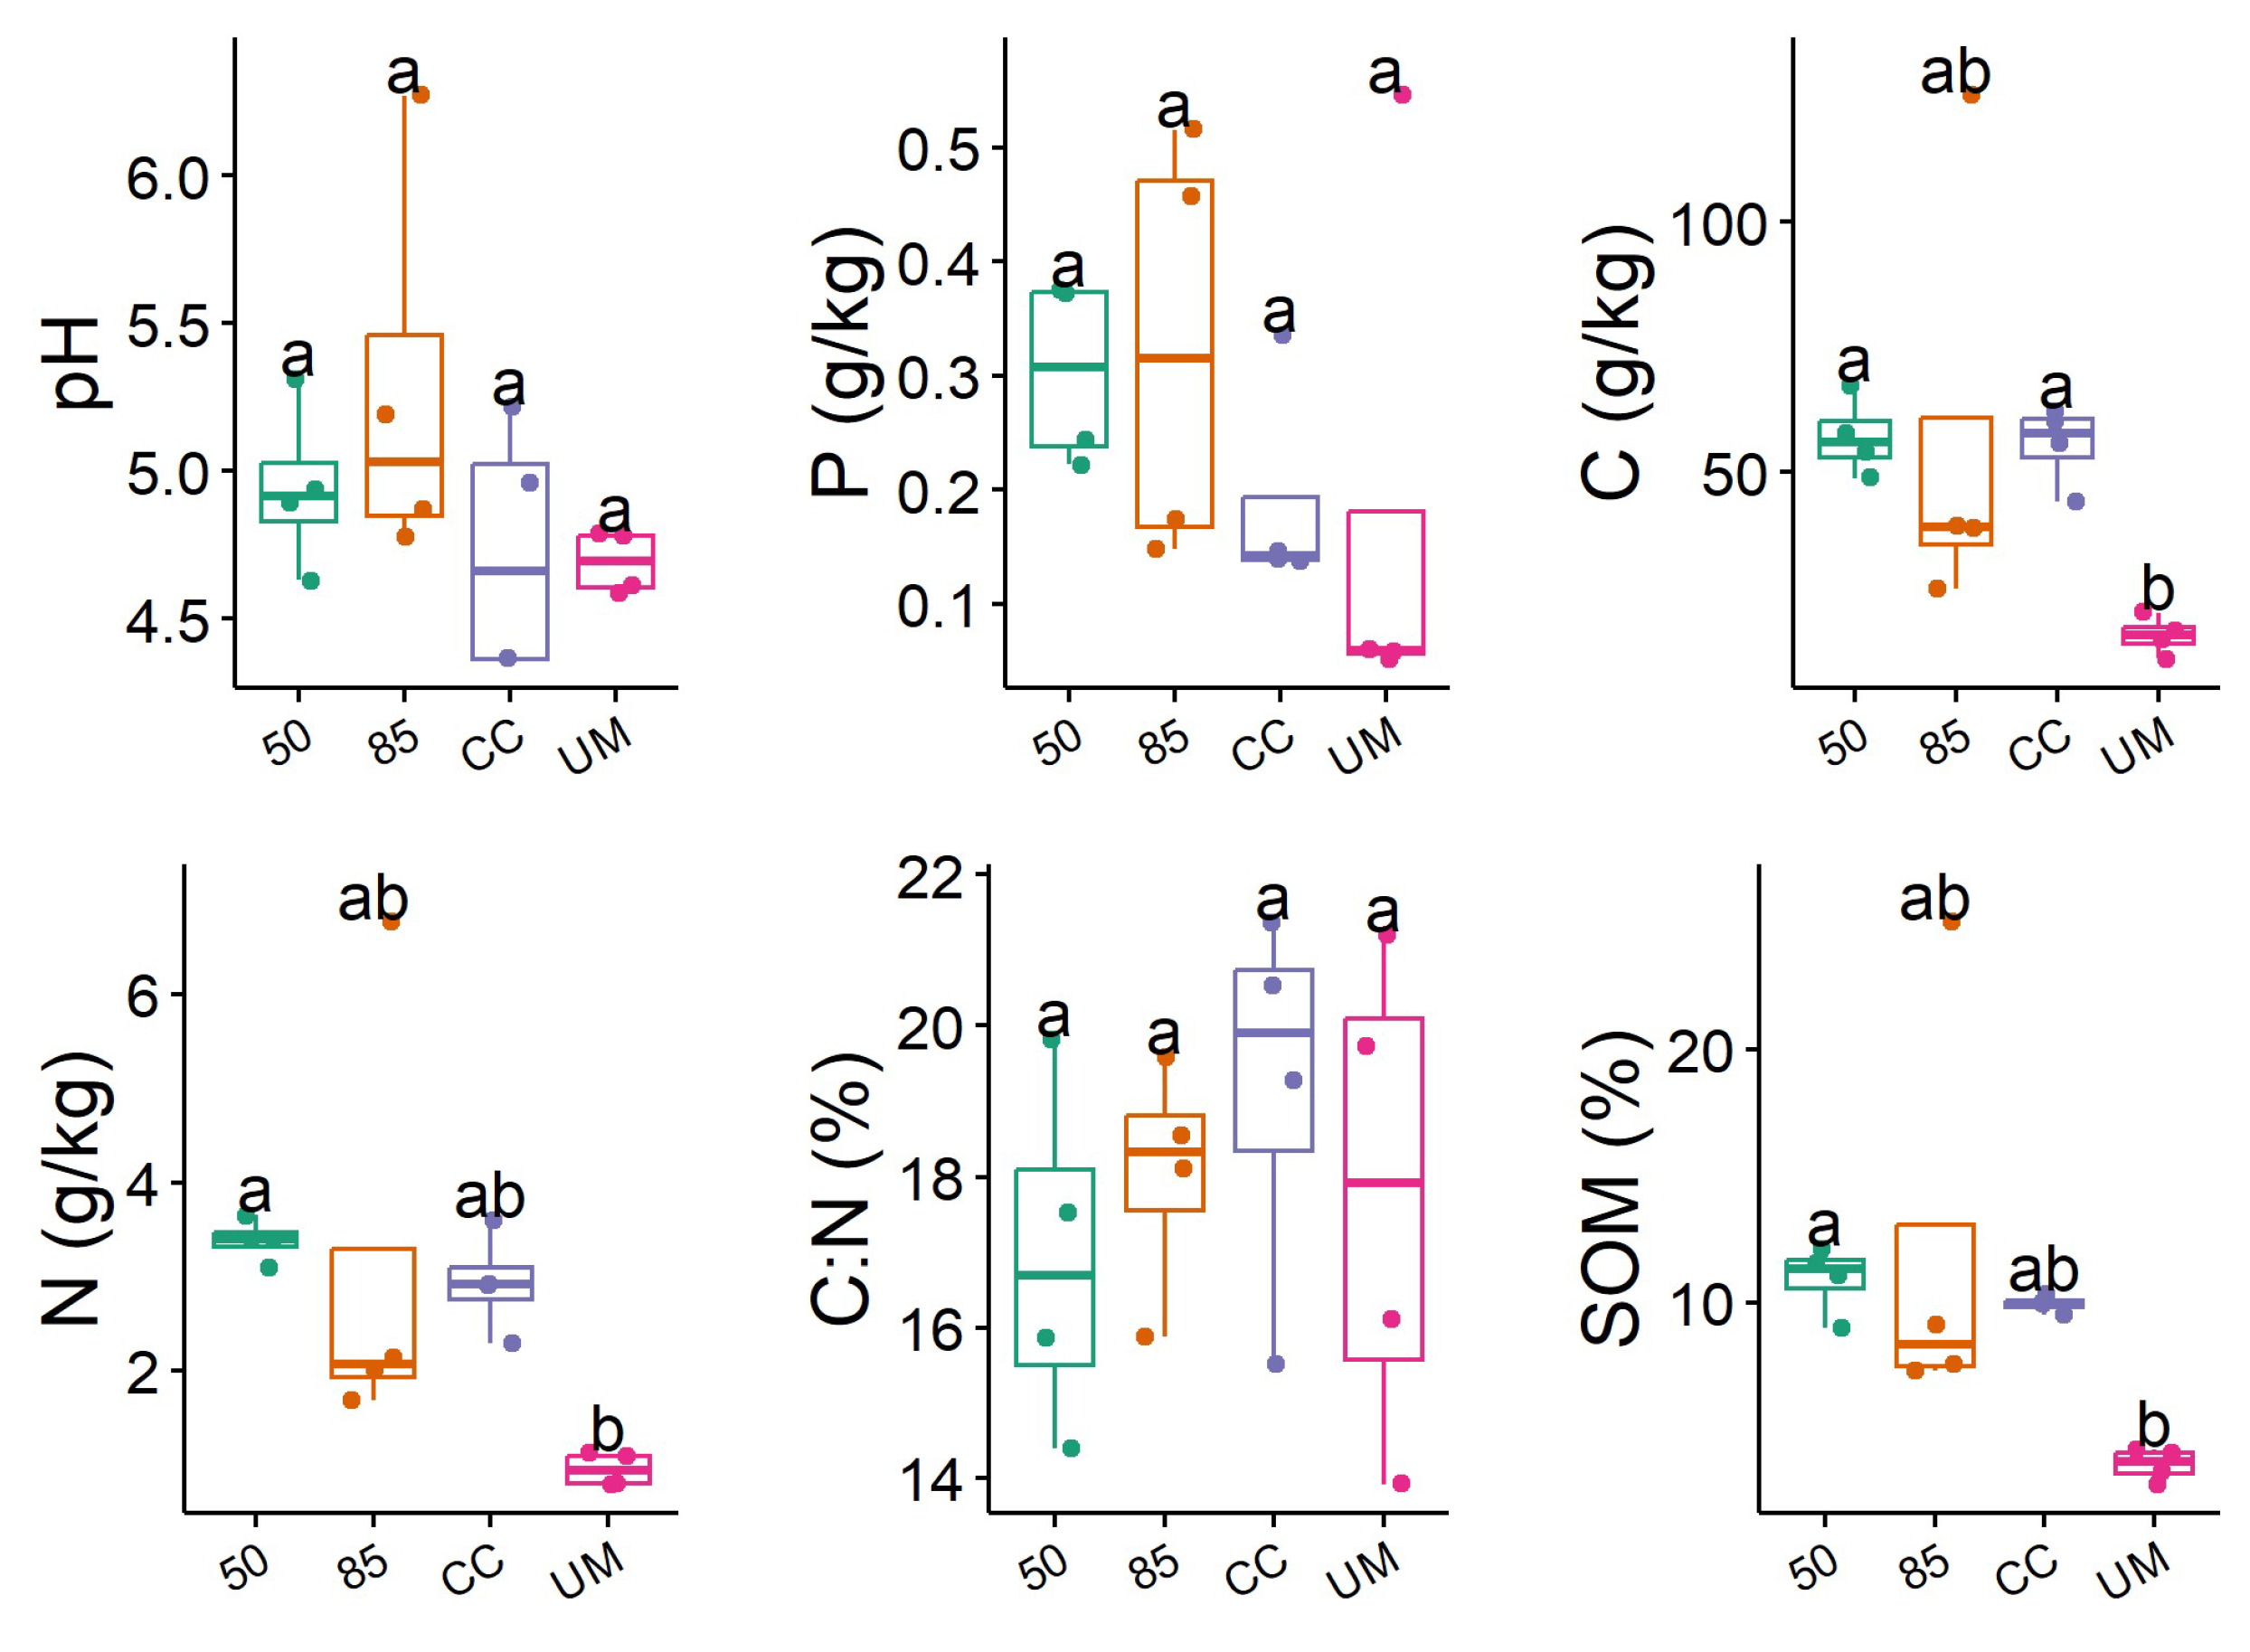
3.2. Soil Chemical Characteristics

Soil chemical analyses showed pronounced differences in soil properties between the four sampled sites (Figure 3 and Figure A6). The unmanaged forest (UM) site was the most distinct, having the lowest concentrations of total carbon, total phosphorus, SOM, and nitrogen. Additionally, the UM site demonstrated the least variation in measured environmental values.
The clear-cut (CC) site had the lowest median pH, the highest total carbon, and second-lowest total phosphorus content. Among the managed forest sites, the 85-year-old forest site showed the highest median pH value and total phosphorus concentration, but it also displayed the highest variability in soil properties compared to the other sites.

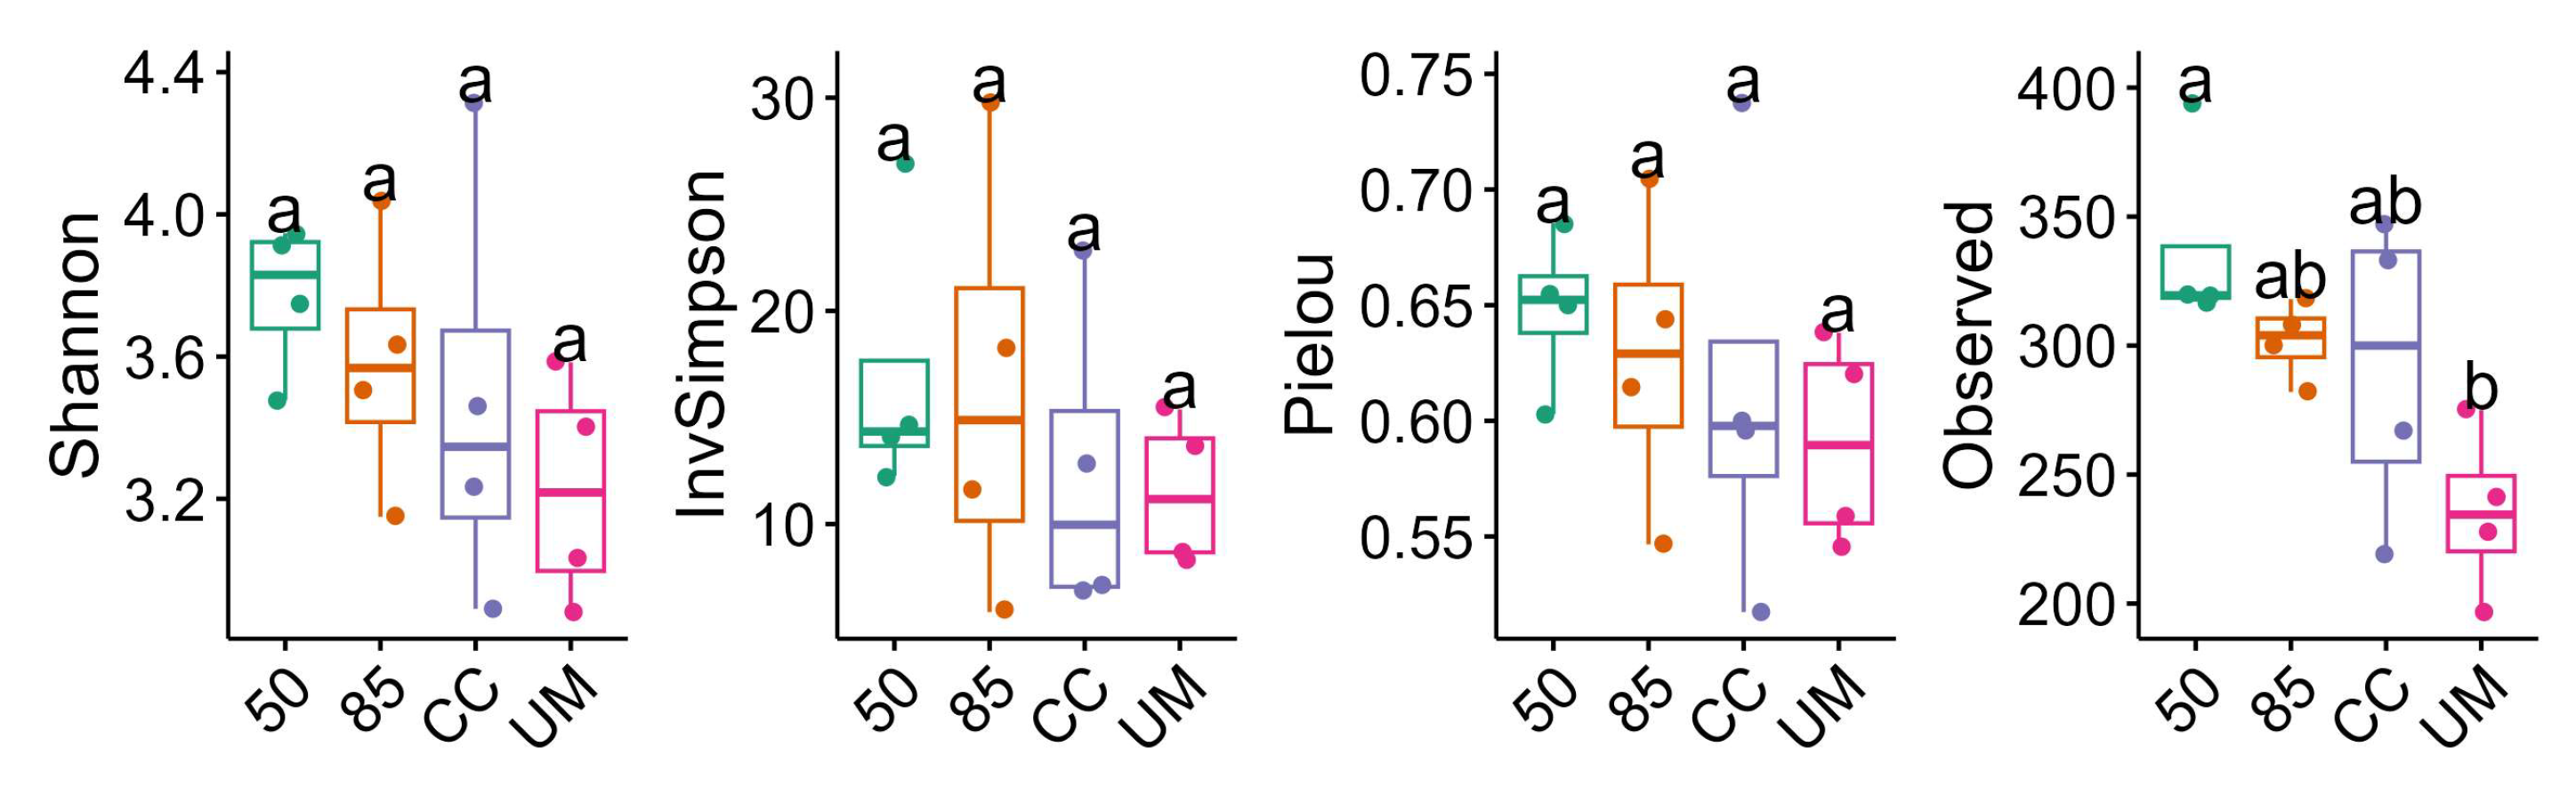
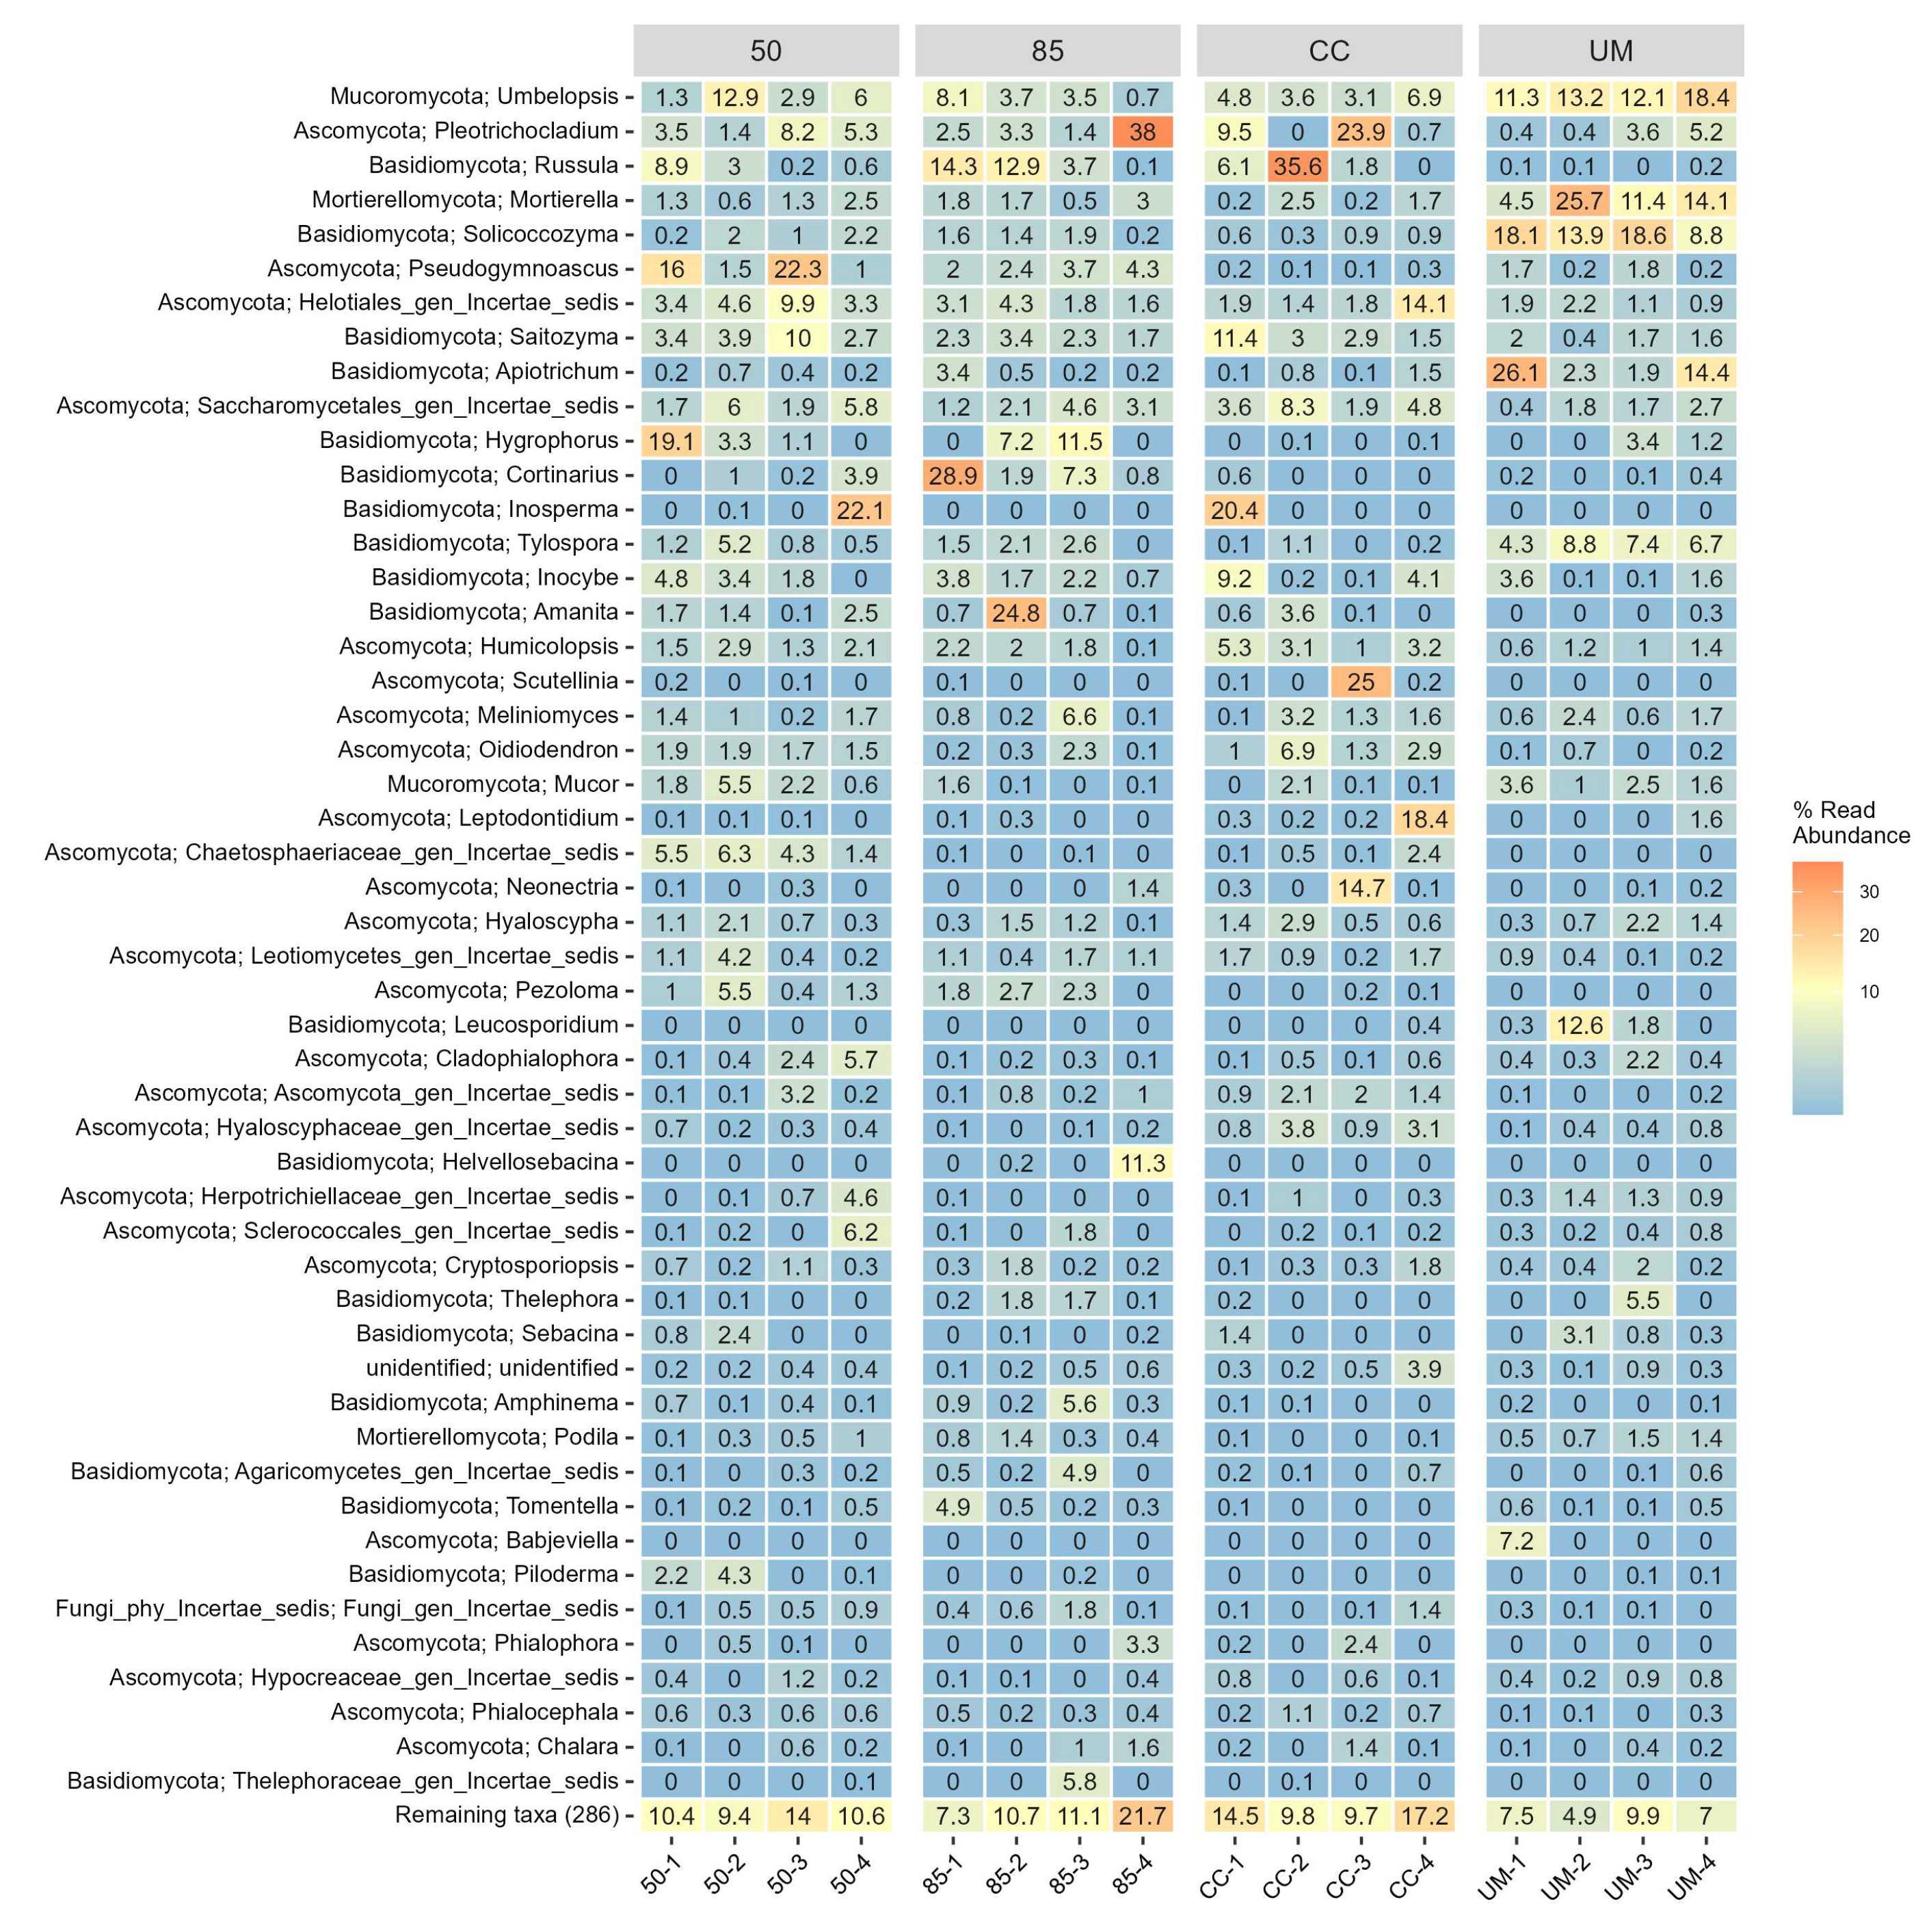
3.3. Taxonomic Assignments and Diversity of Fungal Communities

Venn diagrams (Figure A1) are commonly used to visualize unique and shared OTUs. The analysis revealed that 152 OTUs (or 13.1% of the total number) were shared across all four sites. The site with the highest number of unique OTUs was the 85-year-old stand (128), followed by the CC site (118). In contrast, the UM site had the fewest shared OTUs with other sites: 30 with the 50-year-old stand, 40 with the 85-year-old stand, and 46 with the CC site.
The alpha diversity of fungal communities varied moderately between the sampled sites (Figure 4); however, these differences were not statistically significant. The highest median Shannon diversity values were observed in the 50-year-old forest site. The CC site had the highest variation in Shannon index and species richness, whereas the Inverse Simpson index showed higher variation for the 85-year-old site. The Pielou index, which is calculated from the Shannon index, indicates that all sites have similar levels of species evenness. Overall, the 50-year-old and 85-year-old stands had the highest median Shannon diversity, while the 50-year-old and UM sites showed the least variation in diversity values. A significant difference in species richness was observed only between the UM and 50-year-old sites.
The composition of forest soil fungal communities was visualized at the levels of class, order, genus, and species using heatmaps (Figure 5, Figure A2, Figure A3 and Figure A4, respectively).
Agaricomycetes was the most abundant class by relative abundance, followed by Leotiomycetes (50-year-old, 85-year-old, and CC sites). The UM site showed a more even distribution of Agaricomycetes, Tremellomycetes, and Mortierellomycetes compared to the other three sites (Figure A2).
Community composition at the order level (Figure A3) was generally similar between studied sites, with a few exceptions. The UM site showed a relatively low abundance of Russulales. The proportions of Umbelopsidales, Trichosporonales, Mortierellales, Filobasidiales, and Atheliales varied notably between the sites—the highest proportions were in the UM site. The Thelebolales order was the most abundant in the 50-year-old site. At the genus level (Figure 5), the UM site was the most distinct, with only 4–6 genera accounting for ~50% of the total abundance. The genus Russula was relatively low in abundance at the UM site but was abundant in all other sites. The relative abundance of Umbelopsis, Mortierella, and Soliccocozyma was notably higher in the UM site.
NMDS ordination of the OTU-level Bray–Curtis dissimilarity matrix revealed clustering of samples by site (Figure A5). This observation was further supported by an overall PERMANOVA test that showed significant differences in fungal community composition among the four sites (R2 = 0.3924903, F = 2.584257, p = 0.001). However, the betadisper test indicated significant differences in dispersion among sites (p = 0.021), which could influence the PERMANOVA results. None of the pairwise comparisons between the sites are significant after adjustment (Table 2).

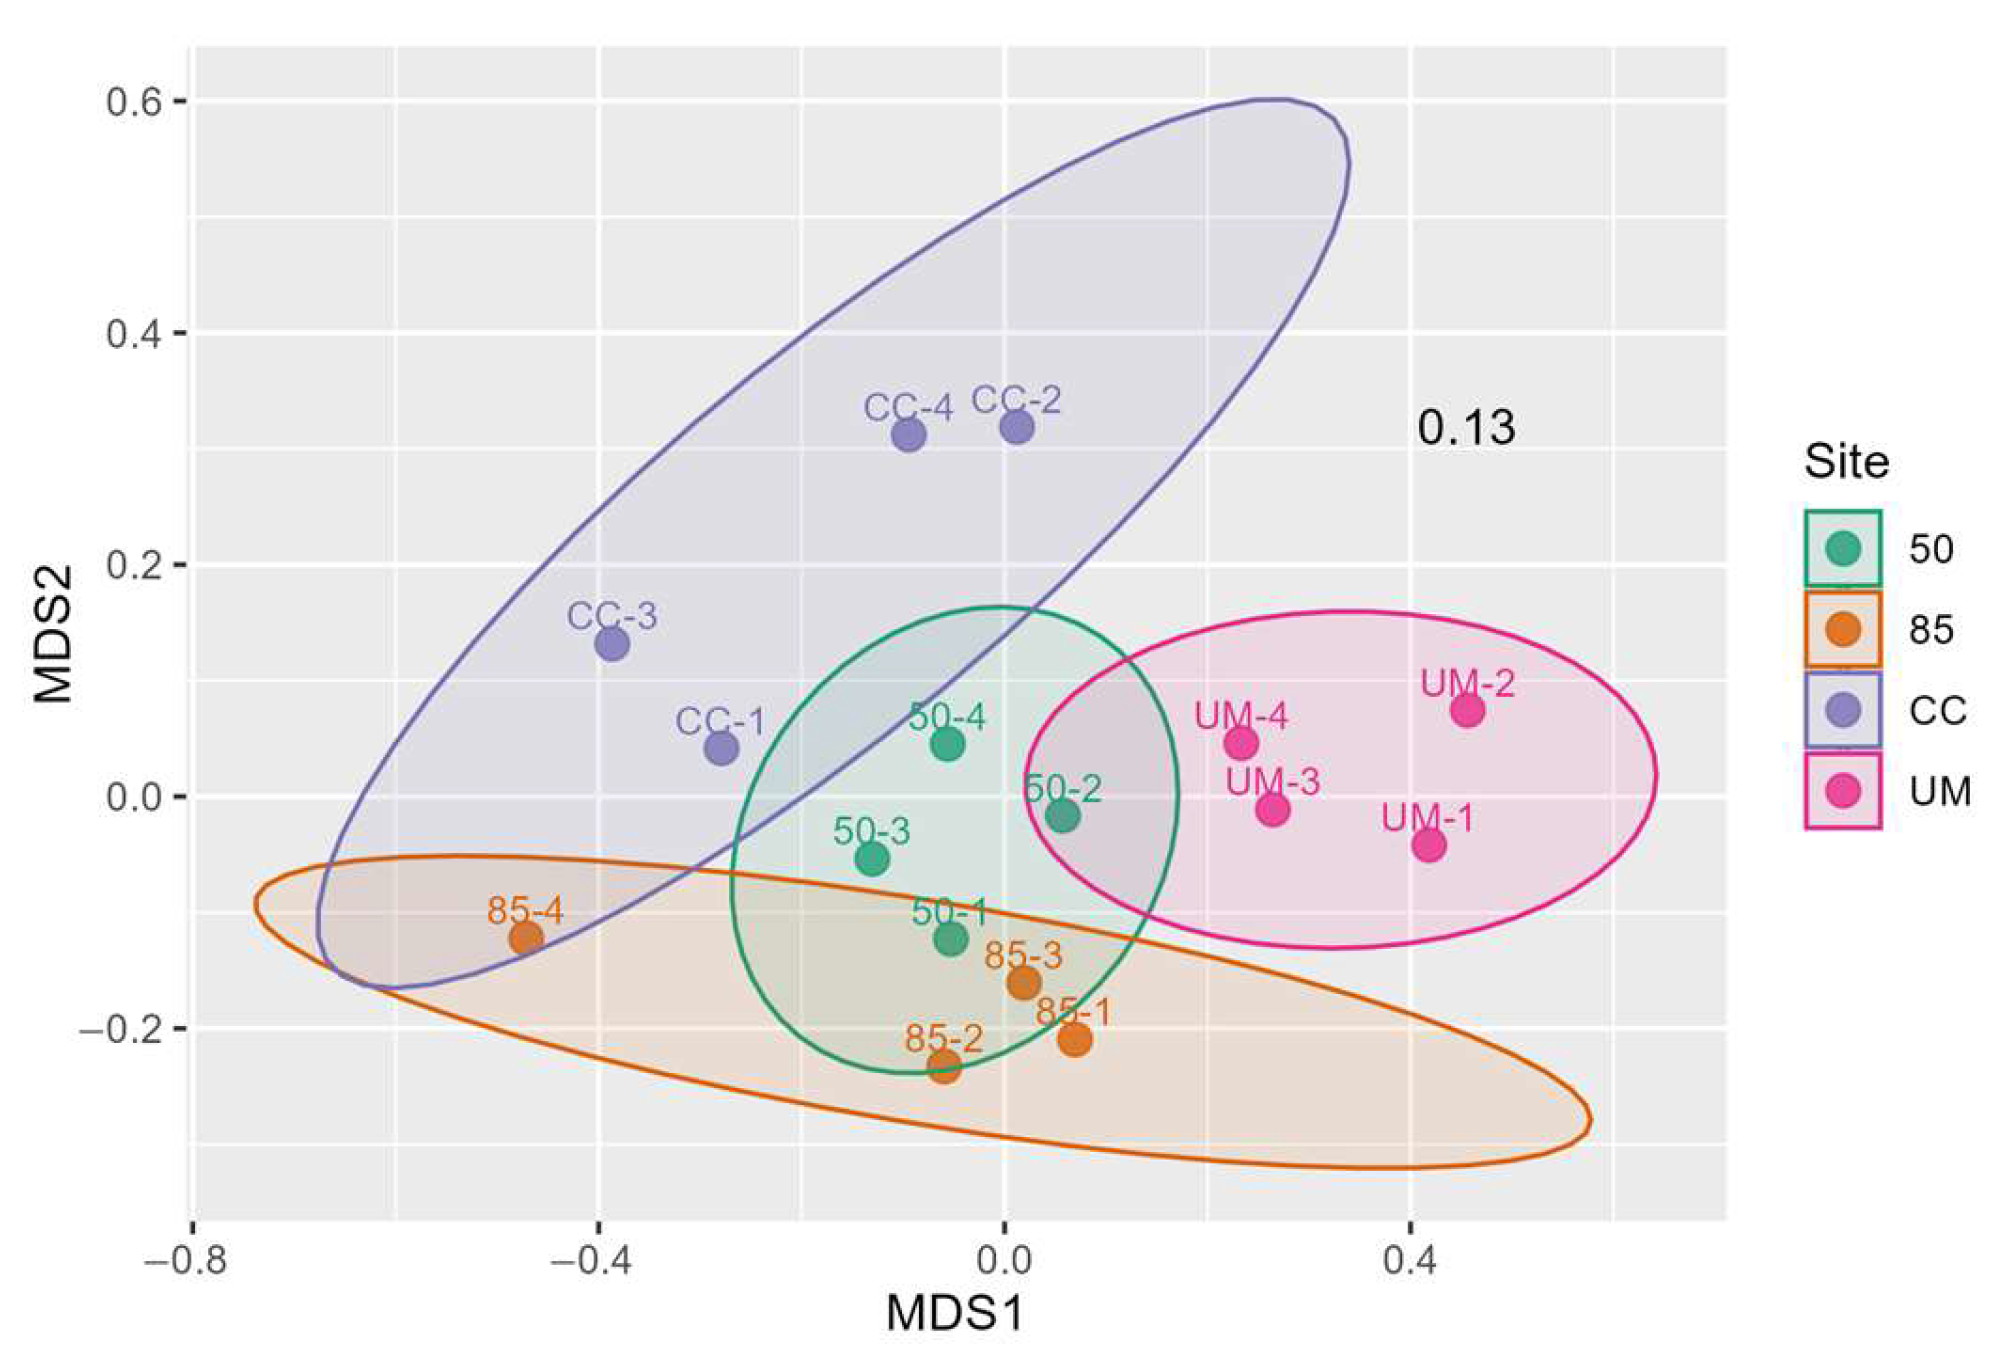
3.4. Relationships Between Fungal Communities and Environmental Variables

Redundancy Analysis (RDA) showed distinct clustering for the UM sites (Figure 6). The two mature stands (50- and 85-year-old) were the most similar in relation to the measured environmental variables. The CC sample plots largely overlapped in clusters that were clearly distinct from the mature stands. Inosperma, Russula, and Amanita genera were best explained by the C:N ratio; Pleotrichicladium and Helvellosebacina were associated with soil pH, and the remaining genera were primarily associated with soil organic matter, carbon, total phosphorus, and nitrogen.
RDA results indicated that SOM, carbon, nitrogen, and pH were the most influential soil variables in explaining the variation in fungal communities. In contrast, phosphorus and C:N ratio were less important soil variables in this regard.
The most consistent correlations were observed between the Shannon index and carbon and soil organic matter (Figure 7). The C:N ratio showed the weakest correlations among the analyzed soil variables (0.07 on average). Among all variables, pH had the most consistent negative correlation with multiple diversity measures, including Pielou (−0.37) evenness index, Inverse Simpson index (−0.34), and Shannon index (−0.19). Key soil variables such as nitrogen and carbon had a low correlation with the Shannon index (0.13 and 0.15, respectively). Species richness had a high correlation with all soil variables (from 0.33 to 0.59) except for the C:N ratio. All Pearson correlations between soil variables and four alpha diversity metrics were non-significant after adjusted for multiple testing.

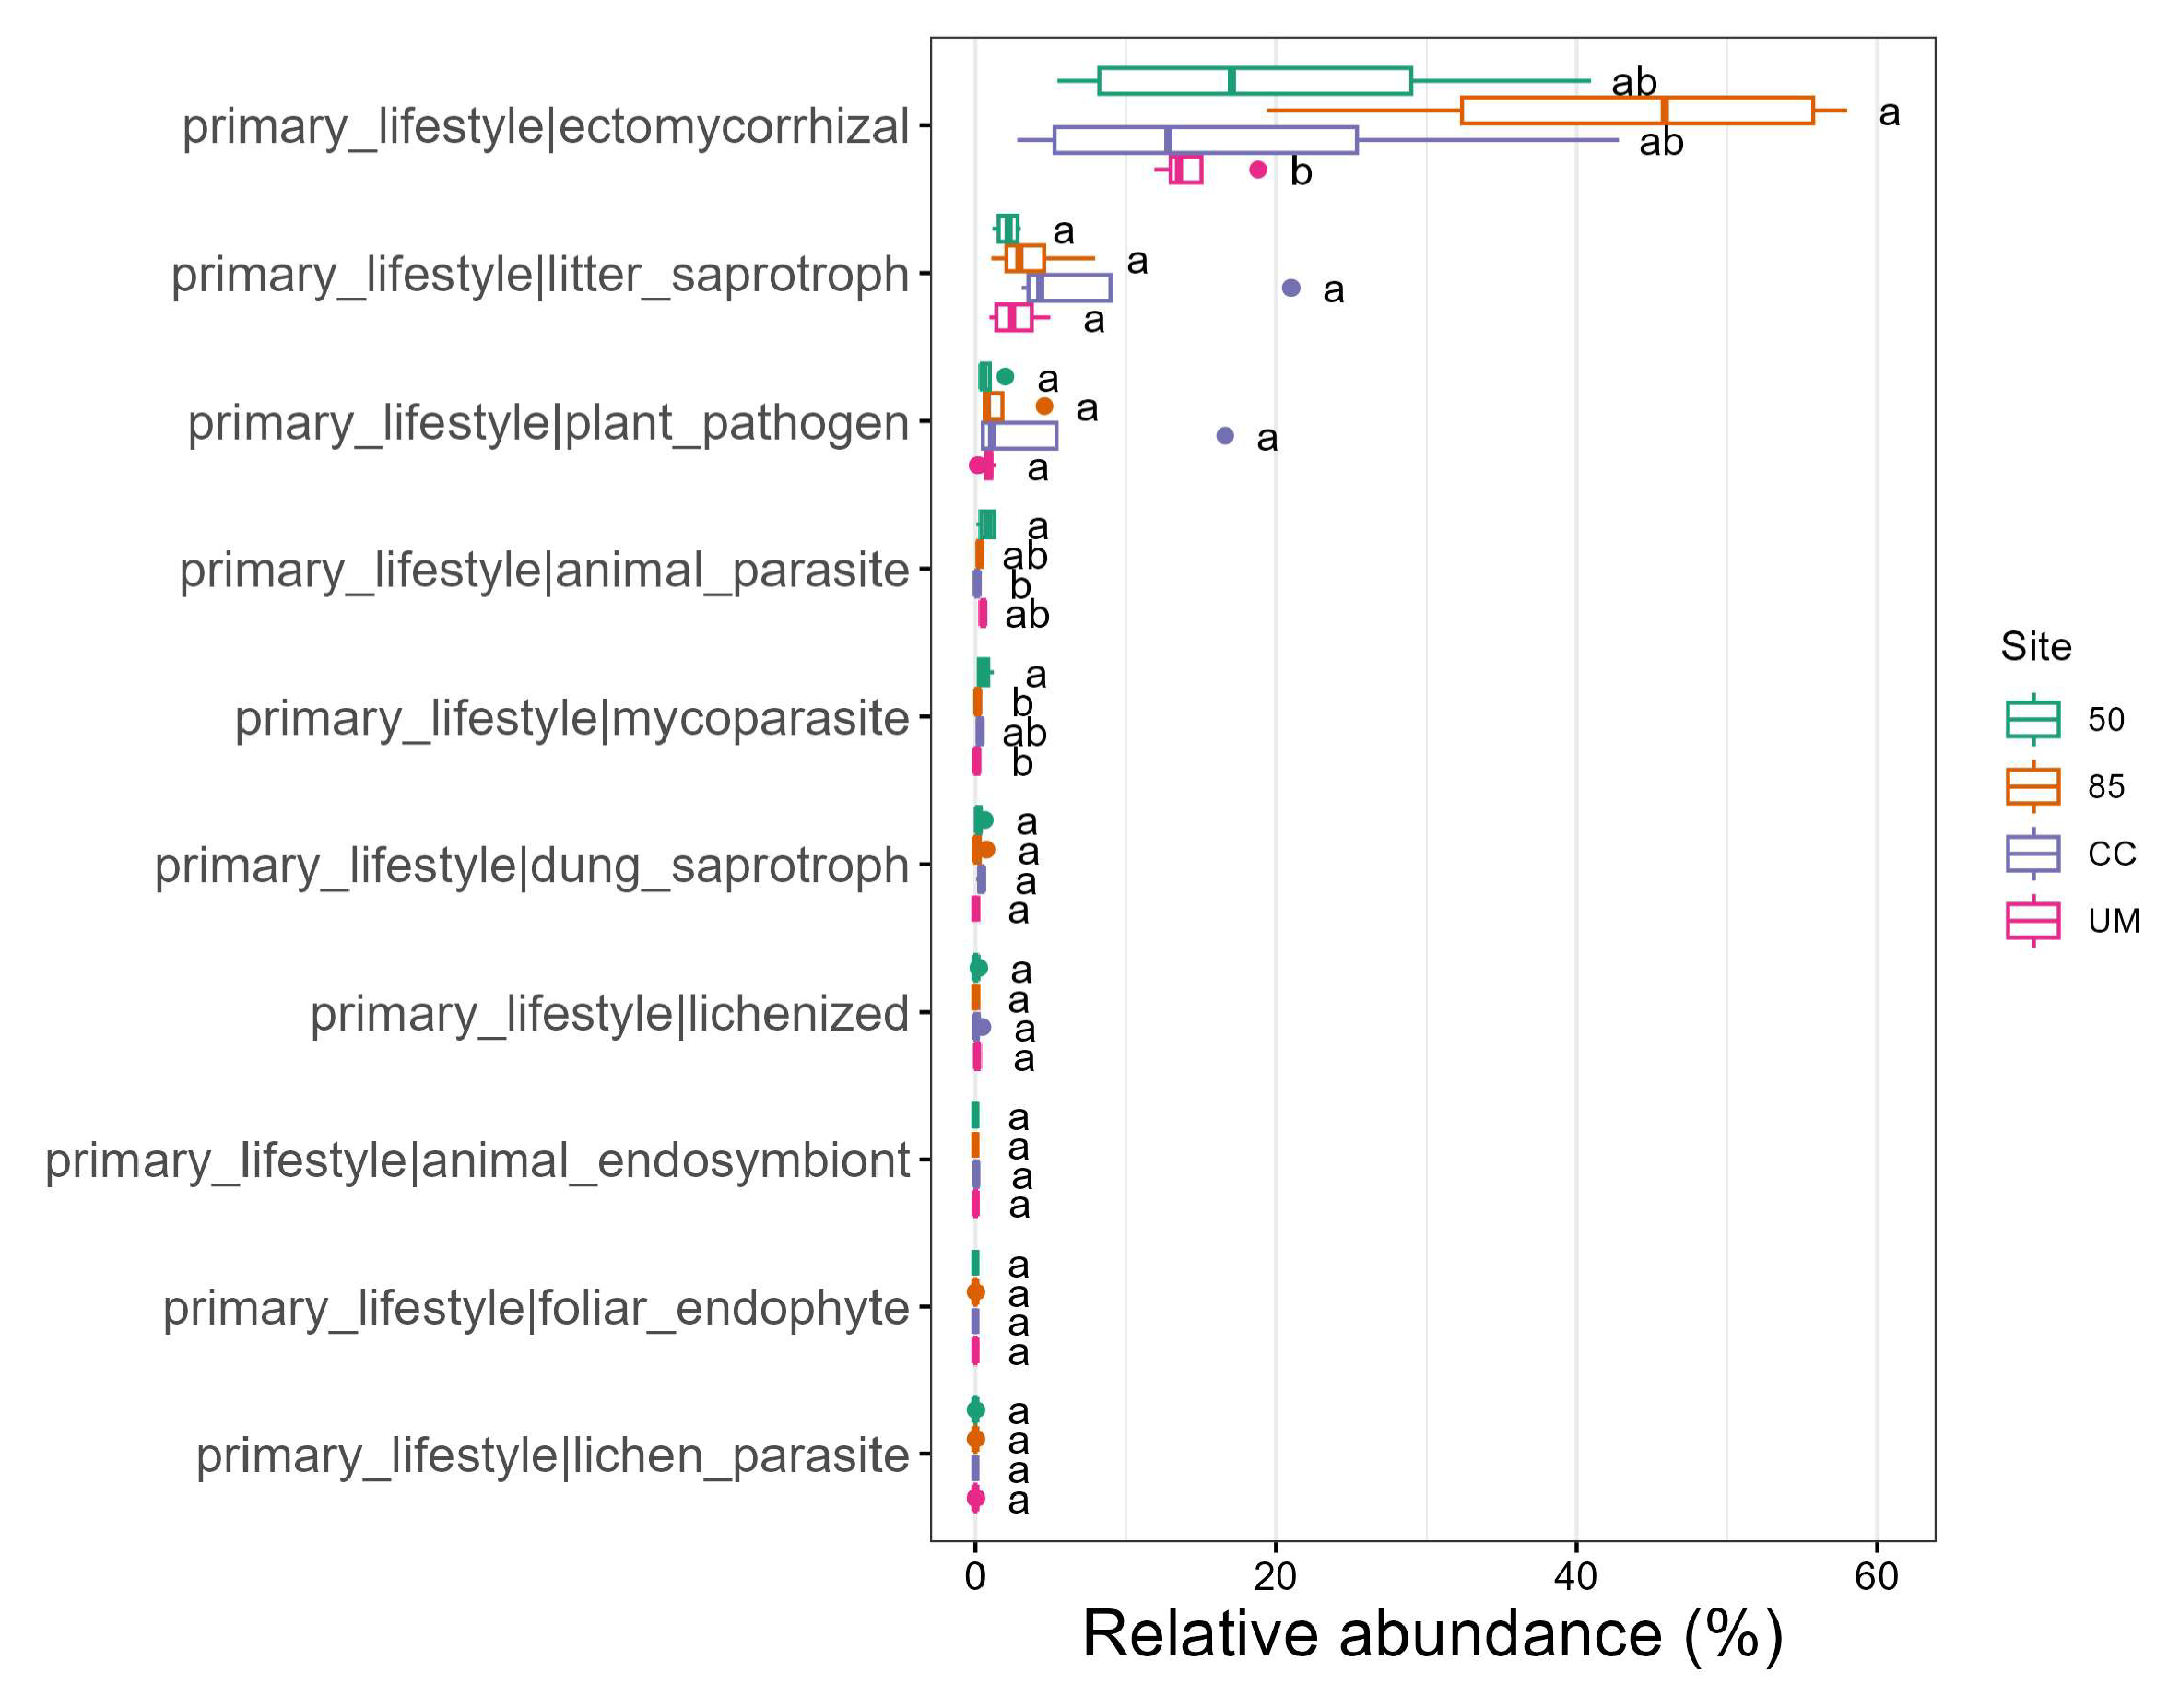
3.5. Ecological Traits of Fungi

The analyses of the ecological traits of soil fungi (Figure 8) showed that fungal communities were generally dominated by ectomycorrhizal fungi and litter saprotrophs.

4. Discussion

Our results demonstrate that fungal communities in the UM and CC forest sites are generally different compared to those in the 50-year-old and the 85-year-old managed stands in terms of community composition, particularly at the order level. A total of 152 fungal OTUs were shared among all the sites, and the unmanaged and 50-year-old stands had the smallest number of unique OTUs. This observation may be attributed to their similar age and close geographical proximity.
In general, soil variables showed low correlations with the alpha diversity of fungal communities. However, our analysis showed that higher alpha diversity is observed in managed middle-aged and mature stands. These observations align with previous studies conducted in the hemiboreal region [47,48].
According to the ecological niche theory, specific genera and families have adapted to specific sets of soil habitats, forming distinct clusters.

4.1. Diversity of Fungal Communities

The results showed high operational taxonomic unit (OUT) richness in the samples. However, the community composition varied considerably between the individual plots within each site. The unmanaged and 50-year-old stands stood out, having the most consistent sample plots in terms of composition (Figure A5). Diversity, whether observed or measured by the Shannon index or the Inverse Simpson index, was the highest in the managed stands compared to the clear-cut and unmanaged stands.
Redundancy Analysis (RDA) showed that only the UM samples formed a distinct cluster. The first canonical axis (RD1) explained 38.5% of the variation in fungal communities, while the second axis (RD2) explained 18.2%. However, the limited sample size in this study is insufficient to make far-reaching conclusions about the impact of management practices on fungal communities in forest soils.
From the most commonly occurring fungal orders identified in our study, Agaricales, Atheliales, Russulales, and Thelephorales were also found to be dominant in studies conducted in Southern Finland [49] and Latvia [50]. The uneven distribution of certain genera among the four plots at each site (Figure 5) suggests that factors such as biased PCR amplification (which could potentially be mitigated with a reference sample) or an insufficient sampling strategy in these heterogeneous environments may have contributed to the observed patterns. Notable examples include—Babjeviella, Theleophora, Leucosporidium, Apiotrichum, and Pleotrichocladium in the unmanaged stand, Russula, Pleotrichocladium, Helotiales, Saitozyma, Inosperma, Scutellinia, Leptodontidium, Neonectri in the clear-cut stand, Pleotrichocladium, Russula, Cortinarius, Amanita in the 85-year-old stand, and Umbelopsis, Pseudogymnoascus, Helotiales, Hygrosphorus, Inosperma, and other genera in the 50-year-old stand.
Regarding ecological traits, fungal communities from our study were dominated by ectomycorrhizal and saprotrophic fungi, which is common in findings from similar studies [10]. Previous studies have [11,51] reported that the distribution of ectomycorrhizal fungi was significantly influenced by forest management, with soil pH and C:N ratios identified as the primary drivers of ectomycorrhizal fungal community composition. In contrast, our findings suggest that the C:N ratio has a weak correlation with alpha diversity. Instead, pH, nitrogen, carbon, and soil organic matter showed stronger positive or negative correlations with fungal diversity.
Due to the study design, it was not possible to determine how quickly the effects of clear-cutting on soil fungal community composition would dissipate. Rähn et al. [47] reported that in hemiboreal forests, soil fungal communities began to recover relatively rapidly, assisted by the remaining (or retained) patches of trees and sites adjacent to clear-cuts. Post-disturbance shifts in community composition could be influenced by specific types of forest and, consequently, by different management regimes [11]. Tedorsoo et al. [52] reported that tree species diversity is positively correlated with the diversity of mycorrhizal fungi. A comprehensive multi-year, regional-scale study has found that management (thinning, selective harvesting, occurring a few years to a few decades ago) has neutral to slightly negative impacts on most fungal taxonomic and functional groups, with some groups (namely opportunistic human pathogens, dimorphic yeasts, yeasts, and animal parasites) being negatively affected and some being strongly positively affected. Moreover, the effect of management was negligible in comparison to soil pH, which seems to be governing the taxonomic and functional distribution of much of the fungal kingdom [52].
Other studies have made a similar observation, where old-growth forests have lower alpha diversity, particularly the Shannon index and Inverse Simpson index [53]. The latter could indicate a higher specialization at N-limiting environments, which is typical for boreal forests [2]. A higher diversity is not necessarily better [54], although it is often associated with increased functional capabilities [55].

4.2. The Influence of Forest Management

According to Tomao et al. (2020) [56], “the higher is the management intensity, the lower is the diversity of ectomycorrhizal and wood-inhabiting species, at least in the short term”. It was not surprising that the CC and UM sites differed in soil fungal community composition compared to the managed sites. However, the redundancy analysis showed that only the samples from the UM site formed a distinct cluster when environmental variables were taken into account.
Forest management affects soil fungal communities in numerous ways; for instance, thinning can expose the soil, leading to altered temperature and moisture regimes [57], while soil compaction and nutrient dynamics may also negatively influence fungal communities [58]. To detect and disentangle such influences, scaling up ectomycorrhizal fungi monitoring is important, providing data to inform and improve forest management decisions [59].
Clear-cutting represents the most severe form of forest management, causing dramatic changes to forest habitats. A study by Bowd et al. [4] reported a decline in the diversity of ectomycorrhizal fungi following clear-cut logging. Clear-cutting has also been reported to significantly reduce microbial biomass. The effect can potentially last for several decades [60,61]. Similarly, in our study, the fungal diversity in the clear-cut stand was lower compared to middle-aged and mature stands.
Forest fragmentation resulting from clear-cuts can further negatively affect fungal communities [62,63] with specific consequences, including the loss of host trees and the disruption of mycorrhizal networks [64,65]. However, the landscape context was not addressed in this study.
Since each forest management type is represented by a single site in this study (with four plot replicates per site), the effects of site and management are completely confounded. Consequently, differences among sites in fungal community composition detected by PERMANOVA may reflect both inherent site variability and the impact of management practices. Additionally, the unmanaged stand could not be considered a completely undisturbed old-growth forest due to its age and the unknown history prior to the wind damage in 1969. Its soil characteristics, which differ from the other three stands, remain unexplained by any specific reason.
Previously, indicator species associated with diverse old-growth pine forests have been proposed (citation). Moreover, the potential use of these indicators or key species to facilitate restoration has been suggested (citation). However, it remains largely unresolved how destructive and long-lasting the effects of current forestry practices are on microbial communities and which strategies might mitigate these impacts. While several studies have employed a chronostudy approach, only a few have examined these effects using a before–after, control–treatment design [66].

5. Conclusions

Our results showed that the highest diversity of soil fungal communities was observed in the managed middle-aged stand. However, differences between the sites were not statistically significant. The unmanaged stand differed notably by community composition, particularly at the fungal genus level. However, the long-term management of this stand prior to wind damage, which occurred approximately 60 years ago, is not known. Analysis of additional sites, including managed and unmanaged stands, as well as older stands (>200 years), will provide additional information on the relationship between stand properties and fungal community structure. The spatial variation in fungal communities presents a significant challenge for the assessment of community composition across larger sampling sites. This study highlights the importance of monitoring forest soil environmental parameters and fungal communities to gain a more comprehensive understanding of the effects of forestry management regimes in the hemiboreal region.

Author Contributions

Conceptualization, Ā.J. and D.E.R.; methodology, D.E.R. and K.B.; formal analysis, D.E.R., K.B. and J.K.; data curation, J.K., K.B. and B.J.; writing—original draft preparation, J.K. and K.B.; writing—review and editing, D.E.R., B.J. and Ā.J.; visualization, K.B.; supervision, D.E.R.; project administration, Ā.J.; funding acquisition, Ā.J. All authors have read and agreed to the published version of the manuscript.

Funding

This research was funded by JSC Latvia’s State Forests research program “Support for Forest Tree Seed Production” (No. 5-5.9.1_0080_101_21_86) and Forest Development Fund project “The role of old-growth forests in mitigating climate change: information for forest and related sector policymakers in Latvia and the European Union” (No. 24-00-SOINZ03-000032).

Data Availability Statement

Data will be available upon request.

Conflicts of Interest

The authors declare no conflicts of interest. The funders had no role in the design of the study; in the collection, analyses, or interpretation of data; in the writing of the manuscript; or in the decision to publish the results.

Appendix A

Figure A1. Venn diagram comparing the number of shared and unique soil fungal operational taxonomic units (OTUs) between the four sites: 50-year-old stand (50), 85-year-old stand (85), clear-cut (CC), and unmanaged stand (UM).
Forests 16 00500 g0a1
Figure A2. A heatmap of all 40 fungal classes across four sampling sites: 50-year-old stand (50), 85-year-old stand (85), clear-cut (CC), and unmanaged stand (UM). Within-stand differences are shown for individual sampling plots. For each taxon, the number represents the percentage of total OTU counts in a given sample. Each class is annotated with its corresponding phylum name.
Forests 16 00500 g0a2
Figure A3. A heatmap of the 50 most common fungal orders across four sampling sites: 50-year-old stand (50), 85-year-old stand (85), clear-cut (CC), and unmanaged stand (UM). Within-stand differences are shown for individual sampling plots. For each taxon, the number represents the percentage of total OTU counts in a given sample. Each order is annotated with its corresponding phylum name.
Forests 16 00500 g0a3
Figure A4. A heatmap of the 50 most common fungal species across four sampling sites: 50-year-old stand (50), 85-year-old stand (85), clear-cut (CC), and unmanaged stand (UM). Within-stand differences are shown for individual sampling plots. For each taxon, the number represents the percentage of total OTU counts in a given sample. Some OTUs were identified only to the genus level and is annotated with its corresponding order name.
Forests 16 00500 g0a4
Figure A5. An NMDS ordination plot, based on Bray–Curtis dissimilarity matrix. The plot stress value is 0.13. The ellipses indicate 95% confidence for group (site) dispersions.
Forests 16 00500 g0a5
Figure A6. Spearman’s rank correlation among environmental factors in the 50-year-old stand (50), 85-year-old stand (85), clear-cut (CC), and unmanaged stand (UM). The asterisks (**, ***) indicate statistically significant correlations at p ≤ 0.01, and p ≤ 0.001, respectively.
Forests 16 00500 g0a6

References

  1. Dighton, J. Fungi in Ecosystem Processes; CRC Press: Boca Raton, FL, USA, 2018; p. 434. [Google Scholar]
  2. Li, X.; Qu, Z.; Zhang, Y.; Ge, Y.; Sun, H. Soil fungal community and potential function in different forest ecosystems. Diversity 2022, 14, 520. [Google Scholar] [CrossRef]
  3. Heilmann-Clausen, J.; Barron, E.S.; Boddy, L.; Dahlberg, A.; Griffith, G.W.; Nordén, J.; Ovaskainen, O.; Perini, C.; Senn-Irlet, B.; Halme, P. A fungal perspective on conservation biology. Conserv. Biol. 2015, 29, 61–68. [Google Scholar] [CrossRef] [PubMed]
  4. Bowd, E.J.; Banks, S.C.; Bissett, A.; May, T.W.; Lindenmayer, D.B. Disturbance alters the forest soil microbiome. Mol. Ecol. 2022, 31, 419–447. [Google Scholar] [CrossRef]
  5. Maron, J.L.; Marler, M.; Klironomos, J.N.; Cleveland, C.C. Soil fungal pathogens and the relationship between plant diversity and productivity. Ecol. Lett. 2011, 14, 36–41. [Google Scholar] [CrossRef]
  6. Frąc, M.; Hannula, S.E.; Bełka, M.; Jędryczka, M. Fungal biodiversity and their role in soil health. Front. Microbiol. 2018, 9, 707. [Google Scholar] [CrossRef] [PubMed]
  7. López-Bucio, J.; Pelagio-Flores, R.; Herrera-Estrell, A. Trichoderma as biostimulant: Exploiting the multilevel properties of a plant beneficial fungus. Sci. Hortic. 2015, 196, 109–123. [Google Scholar] [CrossRef]
  8. Rouphael, Y.; Franken, P.; Schneider, C.; Schwarz, D.; Giovannetti, M.; Agnolucci, M.; De Pascale, S.; Bonini, P.; Colla, G. Arbuscular mycorrhizal fungi act as biostimulants in horticultural crops. Sci. Hortic. 2015, 196, 91–108. [Google Scholar] [CrossRef]
  9. Shi, L.; Dossa, G.G.; Paudel, E.; Zang, H.; Xu, J.; Harrison, R.D. Changes in fungal communities across a forest disturbance gradient. Appl. Environ. Microbiol. 2019, 85, e00080-19. [Google Scholar] [CrossRef]
  10. Hawksworth, D.L.; Lücking, R. Fungal Diversity Revisited: 2.2 to 3.8 Million Species. Microbiol. Spectr. 2017, 5, 10.1128. [Google Scholar] [CrossRef]
  11. Goldmann, K.; Schöning, I.; Buscot, F.; Wubet, T. Forest management type influences diversity and community composition of soil fungi across temperate forest ecosystems. Front. Microbiol. 2015, 6, 1300. [Google Scholar] [CrossRef]
  12. Paillet, Y.; Berges, L.; Hjalten, J.; Odor, P.; Avon, C.; Bernhardt-Romermann, M.; Bijlsma, R.J.; De Bruyn, L.U.C.; Fuhr, M.; Grandin, U.L.F.; et al. Biodiversity differences between managed and unmanaged forests: Meta-analysis of species richness in Europe. Conserv. Biol. 2010, 24, 101–112. [Google Scholar] [CrossRef]
  13. Foote, J.A.; Boutton, T.W.; Scott, D.A. Soil C and N storage and microbial biomass in US southern pine forests: Influence of forest management. For. Ecol. Manag. 2015, 355, 48–57. [Google Scholar] [CrossRef]
  14. James, J.; Harrison, R. The effect of harvest on forest soil carbon: A meta-analysis. Forests 2016, 7, 308. [Google Scholar] [CrossRef]
  15. Ramirez, K.S.; Craine, J.M.; Fierer, N. Consistent effects of nitrogen amendments on soil microbial communities and processes across biomes. Glob. Chang. Biol. 2012, 18, 1918–1927. [Google Scholar] [CrossRef]
  16. Colombo, F.; Macdonald, C.A.; Jeffries, T.C.; Powell, J.R.; Singh, B.K. Impact of forest management practices on soil bacterial diversity and consequences for soil processes. Soil. Biol. Biochem. 2016, 94, 200–210. [Google Scholar] [CrossRef]
  17. Chen, J.; Chazdon, R.L.; Swenson, N.G.; Xu, H.; Luo, T. Drivers of soil microbial community assembly during recovery from selective logging and clear-cutting. J. Appl. Ecol. 2021, 58, 2231–2242. [Google Scholar] [CrossRef]
  18. Sun, S.; Li, S.; Avera, B.N.; Strahm, B.D.; Badgley, B.D. Soil bacterial and fungal communities show distinct recovery patterns during forest ecosystem restoration. Appl. Environ. Microbiol. 2017, 83, e00966-17. [Google Scholar] [CrossRef]
  19. Baldrian, P. The known and the unknown in soil microbial ecology. FEMS Microbiol. Ecol. 2019, 95, fiz005. [Google Scholar] [CrossRef]
  20. Küffer, N.; Senn-Irlet, B. Influence of forest management on the species richness and composition of wood-inhabiting basidiomycetes in Swiss forests. Biodivers. Conserv. 2005, 14, 2419–2435. [Google Scholar] [CrossRef]
  21. Brukas, V.; Weber, N. Forest management after the economic transition—At the crossroads between German and Scandinavian traditions. For. Policy Econ. 2009, 11, 586–592. [Google Scholar] [CrossRef]
  22. Brukas, V.; Felton, A.; Lindbladh, M.; Sallnäs, O. Linking forest management, policy and biodiversity indicators–A comparison of Lithuania and Southern Sweden. For. Ecol. Manag. 2013, 291, 181–189. [Google Scholar] [CrossRef]
  23. Levers, C.; Verkerk, P.J.; Müller, D.; Verburg, P.H.; Butsic, V.; Leitão, P.J.; Lindner, M.; Kuemmerle, T. Drivers of forest harvesting intensity patterns in Europe. For. Ecol. Manag. 2014, 315, 160–172. [Google Scholar] [CrossRef]
  24. Tērauds, A.; Brūmelis, G.; Nikodemus, O. Seventy-year changes in tree species composition and tree ages in state-owned forests in Latvia. Scand. J. For. Res. 2011, 26, 446–456. [Google Scholar] [CrossRef]
  25. Lim, Y.W.; Kim, B.K.; Kim, C.; Jung, H.S.; Kim, B.S.; Lee, J.H.; Chun, J. Assessment of soil fungal communities using pyrosequencing. J. Microbiol. 2010, 48, 284–289. [Google Scholar] [CrossRef] [PubMed]
  26. Allison, S.D.; Treseder, K.K. Climate change feedbacks to microbial decomposition in boreal soils. Fungal Ecol. 2011, 4, 362–374. [Google Scholar] [CrossRef]
  27. Dutta, H.; Dutta, A. The microbial aspect of climate change. Energy Ecol. Environ. 2016, 1, 209–232. [Google Scholar] [CrossRef]
  28. Shi, L.L.; Mortimer, P.E.; Ferry Slik, J.W.; Zou, X.M.; Xu, J.; Feng, W.T.; Qiao, L. Variation in forest soil fungal diversity along a latitudinal gradient. Fungal Divers. 2014, 64, 305–315. [Google Scholar] [CrossRef]
  29. Linares, J. Evaluating the Effectiveness of the Internal Transcribed Sequences (ITS) as DNA Barcodes to Estimate Fungal Diversity. Master’s Thesis, Nova Southeastern University, Fort Lauderdale, FL, USA, 2023. [Google Scholar]
  30. Leckie, S.E. Methods of microbial community profiling and their application to forest soils. For. Ecol. Manag. 2005, 220, 88–106. [Google Scholar] [CrossRef]
  31. The Climate of Latvia. Latvian Environment, Geology and Meteorology Centre. 2024. Available online: https://latlit.eu/thepartners/latvian-environment-geology-and-meteorology-centre/ (accessed on 6 December 2024).
  32. National Forest Inventory. Latvian State Forest Research Institute Silava. 2023. Available online: https://www.silava.lv/petnieciba/nacionalais-meza-monitorings (accessed on 15 December 2024).
  33. State Forest Register. State Forest Service. 2024. Available online: https://data.gov.lv/dati/eng/dataset/meza-valsts-registra-meza-dati (accessed on 3 December 2024).
  34. Bušs, K. Forest ecosystem classification in Latvia. Proc. Latv. Acad. Sci. Sect. B Nat. Exact. Appl. Sci. 1997, 51, 204–218. [Google Scholar]
  35. Anslan, S.; Bahram, M.; Hiiesalu, I.; Tedersoo, L. PipeCraft: Flexible open-source toolkit for bioinformatics analysis of custom high-throughput amplicon sequencing data. Mol. Ecol. Resour. 2017, 17, e234–e240. [Google Scholar] [CrossRef]
  36. Bolger, A.M.; Lohse, M.; Usadel, B. Trimmomatic: A flexible trimmer for Illumina sequence data. Bioinformatics 2014, 30, 2114–2120. [Google Scholar] [CrossRef] [PubMed]
  37. Rognes, T.; Flouri, T.; Nichols, B.; Quince, C.; Mahé, F. VSEARCH: A versatile open source tool for metagenomics. PeerJ 2016, 4, e2584. [Google Scholar] [CrossRef]
  38. Bengtsson-Palme, J.; Ryberg, M.; Hartmann, M.; Branco, S.; Wang, Z.; Godhe, A.; De Wit, P.; Sanchez-Garcia, M.; Ebersberger, I.; Dousa, F.; et al. Improved software detection and extraction of ITS1 and ITS2 from ribosomal ITS sequences of fungi and other eukaryotes for analysis of environmental sequencing data. Methods Ecol. Evol. 2013, 4, 914–919. [Google Scholar] [CrossRef]
  39. Camacho, C.; Coulouris, G.; Avagyan, V.; Ma, N.; Papadopoulos, J.; Bealer, K.; Madden, T.L. BLAST+: Architecture and applications. BMC Bioinform. 2009, 10, 421. [Google Scholar] [CrossRef]
  40. Abarenkov, K.; Zirk, A.; Piirmann, T.; Pöhönen, R.; Ivanov, F.; Nilsson, R.H.; Kõljalg, U. UNITE General FASTA Release for Fungi; UNITE Community: London, UK, 2024. [Google Scholar] [CrossRef]
  41. R Core Team. R: A Language and Environment for Statistical Computing; R Foundation for Statistical Computing: Vienna, Austria, 2024; Available online: http://www.R-project.org/ (accessed on 3 December 2024).
  42. Oksanen, J.; Simpson, G.L.; Blanchet, F.G.; Kindt, R.; Legendre, P.; Minchin, P.P.; O’Hara, R.B.; Solymos, P.; Stevens, M.H.H.; Szoecs, E.; et al. Package ‘Vegan’. Community Ecology Package, Version, 2(9). Available online: https://cran.r-project.org/web/packages/vegan/index.html (accessed on 3 December 2024).
  43. McMurdie, P.J.; Holmes, S. Phyloseq: An R package for reproducible interactive analysis and graphics of microbiome census data. PLoS ONE 2013, 8, e61217. [Google Scholar] [CrossRef] [PubMed]
  44. Liu, C.; Cui, Y.; Li, X.; Yao, M. Microeco: An R package for data mining in microbial community ecology. FEMS Microbiol. Ecol. 2020, 97, fiaa255. [Google Scholar] [CrossRef]
  45. Andersen, K.S.; Kirkegaard, R.H.; Karst, S.M.; Albertsen, M. Ampvis2: An R package to analyse and visualise 16S rRNA amplicon data. bioRxiv 2018. [Google Scholar] [CrossRef]
  46. Põlme, S.; Abarenkov, K.; Nilsson, R.H.; Lindahl, B.D.; Clemmensen, K.E.; Kauserud, H.; Nguyen, N.; Kjøslev, G.; Adojaa, K.; Vizzini, A.; et al. FungalTraits: A User-Friendly Traits Database of Fungi and Fungus-Like Stramenopiles. Fungal Divers. 2021, 105, 1–16. [Google Scholar] [CrossRef]
  47. Rähn, E.; Tedersoo, L.; Adamson, K.; Drenkhan, T.; Sibul, I.; Lutter, R.; Anslan, S.; Pritsch, K.; Drenkhan, R. Rapid shift of soil fungal community compositions after clear-cutting in hemiboreal coniferous forests. For. Ecol. Manag. 2023, 544, 121211. [Google Scholar] [CrossRef]
  48. Kujawska, M.B.; Rudawska, M.; Wilgan, R.; Leski, T. Similarities and differences among soil fungal assemblages in managed forests and formerly managed forest reserves. Forests 2021, 12, 353. [Google Scholar] [CrossRef]
  49. Hui, N.; Jumpponen, A.; Niskanen, T.; Liimatainen, K.; Jones, K.L.; Koivula, T.; Romantschuk, M.; Strömmer, R. EcM fungal community structure, but not diversity, altered in a Pb-contaminated shooting range in a boreal coniferous forest site in Southern Finland. FEMS Microbiol. Ecol. 2011, 76, 121–132. [Google Scholar] [CrossRef] [PubMed]
  50. Klavina, D.; Tedersoo, L.; Agan, A.; Adamson, K.; Bitenieks, K.; Gaitnieks, T.; Drenkhan, R. Soil fungal communities in young Norway spruce-dominant stands: Footprints of former land use and selective thinning. Eur. J. For. Res. 2022, 141, 503–516. [Google Scholar] [CrossRef]
  51. Ampoorter, E.; Barbaro, L.; Jactel, H.; Baeten, L.; Boberg, J.; Carnol, M.; Castagneyrol, B.; Charbonnier, Y.; Dawud, S.M.; Deconchat, M.; et al. Tree diversity is key for promoting the diversity and abundance of forest-associated taxa in Europe. Oikos 2020, 129, 133–146. [Google Scholar] [CrossRef]
  52. Tedorsoo, L.; Anslan, S.; Bahram, M.; Drenkhan, R.; Pritsch, K.; Buegger, F.; Padari, A.; Hagh-Doust, N.; Mikryukov, V.; Gohar, D.; et al. Regional-Scale In-Depth Analysis of Soil Fungal Diversity Reveals Strong pH and Plant Species Effects in Northern Europe. Front. Microbiol. 2020, 11, 1953. [Google Scholar] [CrossRef]
  53. Sterkenburg, E.; Bahr, A.; Brandström Durling, M.; Clemmensen, K.E.; Lindahl, B.D. Changes in fungal commu-nities along a boreal forest soil fertility gradient. New Phytol. 2015, 207, 1145–1158. [Google Scholar] [CrossRef]
  54. Shade, A. Diversity is the question, not the answer. ISME J. 2017, 11, 1–6. [Google Scholar] [CrossRef]
  55. Bittleston, L. Connecting microbial community assembly and function. COMIRC 2024, 80, 10212. [Google Scholar] [CrossRef] [PubMed]
  56. Tomao, A.; Bonet, J.A.; Castano, C.; de-Miguel, S. How does forest management affect fungal diversity and community composition? Current knowledge and future perspectives for the conservation of forest fungi. For. Ecol. Manag. 2020, 457, 117678. [Google Scholar] [CrossRef]
  57. Wang, T.; Xu, Q.; Gao, D.; Zhang, B.; Zuo, H.; Jiang, J. Effects of thinning and understory removal on the soil water-holding capacity in Pinus massoniana plantations. Sci. Rep. 2021, 11, 13029. [Google Scholar] [CrossRef]
  58. Kara, Ö.; Bolat, İ. Influence of soil compaction on microfungal community structure in two soil types in Bartin Province, Turkey. J. Basic Microbiol. 2007, 47, 394–399. [Google Scholar] [CrossRef]
  59. Suz, L.M.; Barsoum, N.; Benham, S.; Cheffings, C.; Cox, F.; Hackett, L.; Jones, A.G.; Mueller, G.M.; Orme, D.; Seidling, W.; et al. Monitoring ectomycorrhizal fungi at large scales for science, forest management, fungal conservation and environmental policy. Ann. For. Sci. 2015, 72, 877–885. [Google Scholar] [CrossRef]
  60. Bååth, E. Soil fungal biomass after clear-cutting of a pine forest in central Sweden. Soil. Biol. Biochem. 1980, 12, 495–500. [Google Scholar] [CrossRef]
  61. Parladé, J.; Queralt, M.; Pera, J.; Bonet, J.A.; Castaño, C.; Martínez-Peña, F.; Piñol, J.; Senar, M.A.; De Miguel, A.M. Temporal dynamics of soil fungal communities after partial and total clear-cutting in a managed Pinus sylvestris stand. For. Ecol. Manag. 2019, 449, 117456. [Google Scholar] [CrossRef]
  62. Vannette, R.L.; Leopold, D.R.; Fukami, T. Forest area and connectivity influence root-associated fungal communities in a fragmented landscape. Ecology 2016, 97, 2374–2383. [Google Scholar] [CrossRef] [PubMed]
  63. Grilli, G.; Longo, S.; Huais, P.Y.; Pereyra, M.; Verga, E.G.; Urcelay, C.; Galetto, L. Fungal diversity at fragmented landscapes: Synthesis and future perspectives. Curr. Opin. Microbiol. 2017, 37, 161–165. [Google Scholar] [CrossRef]
  64. Boeraeve, M.; Honnay, O.; Jacquemyn, H. Effects of host species, environmental filtering and forest age on community assembly of ectomycorrhizal fungi in fragmented forests. Fungal Ecol. 2018, 36, 89–98. [Google Scholar] [CrossRef]
  65. Willing, C.E.; Pierroz, G.; Guzman, A.; Anderegg, L.D.; Gao, C.; Coleman-Derr, D.; Taylor, J.W.; Bruns, T.D.; Dawson, T.E. Keep your friends close: Host compartmentalisation of microbial communities facilitates decoupling from effects of habitat fragmentation. Ecol. Lett. 2021, 24, 2674–2686. [Google Scholar] [CrossRef]
  66. Clemmensen, K.E.; Finlay, R.D.; Dahlberg, A.; Stenlid, J.; Wardle, D.A.; Lindahl, B.D. Carbon sequestration is related to mycorrhizal fungal community shifts during long-term succession in boreal forests. New Phytol. 2015, 205, 1525–1536. [Google Scholar] [CrossRef]
Figure 1. The location of study sites and sampling site design. Each site was sampled with four composite subsamples, each consisting of seven soil cores.
Forests 16 00500 g001
Figure 2. Rarefaction curves of filtered sequences, showing sequencing depth across sample sites: 50-year-old stand (50), 85-year-old stand (85), clear-cut (CC) and unmanaged stand (UM). Individual plots within each site (1–4) are also identified.
Forests 16 00500 g002
Figure 3. Distributions of measured forest soil properties across the four study sites: managed forests (clear-cut (CC), 50- and 85-year-old) and unmanaged (UM) forest sites. Letters indicate significant differences between the sites based on Dunn’s Kruskal–Wallis Multiple Comparison test. The box represents 25th and 75th percentile, median (horizontal line), and whiskers show the interquartile range.
Forests 16 00500 g003
Figure 4. Alpha diversity distributions (Shannon, Inverse Simpson, Pielou, and Observed values) for fungal communities in the 50-year-old stand (50), 85-year-old stand (85), clear-cut (CC), and unmanaged stand (UM). Letters indicate significant differences between the sites based on Dunn’s Kruskal–Wallis Multiple Comparison test. The box shows 25th and 75th percentile, median (horizontal line), whiskers show the interquartile range.
Forests 16 00500 g004
Figure 5. A heatmap of the 50 most common fungal genera across four sampling sites: 50-year-old stand (50), 85-year-old stand (85), clear-cut (CC), and unmanaged stand (UM). Within-stand differences are shown for individual sampling plots. For each taxon, the number represents the percentage of total OTU counts in a given sample. Each genus is annotated with its corresponding phylum name.
Forests 16 00500 g005
Figure 6. Ordination biplot from the Redundancy Analysis at the genus level, based on rarefied data (95% confidence). The arrows indicate the lengths and angles between explanatory and response variables, illustrating their correlations. CC—clear-cut, UM—unmanaged stand, 50—50-year-old stand, and 85—85-year-old stand.
Forests 16 00500 g006
Figure 7. Pearson correlations between alpha diversity and soil variables.
Forests 16 00500 g007
Figure 8. A primary lifestyle of fungal groups, measured by relative abundance. CC—clear-cut, UM—unmanaged stand, 50—50-year-old stand, and 85—85-year-old stand. After data filtration, 107 features were used for fungal trait analysis. Letters indicate significant differences between the sites based on Anova test.
Forests 16 00500 g008
Table 1. The location of study sites. Sample sites: 50-year-old stand (50), 85-year-old stand (85), clear-cut (CC), and unmanaged stand (UM).
SiteStand AgeStatusLocation
Site #1 (50)50Managed57°28′15.2″ N, 22°28′26.6″ E
Site #2 (85)85Managed57°28′01.9″ N, 22°27′43.4″ E
Site #3 (CC)3Managed, clear-cut57°28′09.7″ N, 22°28′33.1″ E
Site #4 (UM)58Unmanaged57°38′26.7″ N, 22°18′28.6″ E
Table 2. Results of pairwise PERMANOVA.
GroupsMeasureFR2p-Valuep-Adjusted
50 vs. 85Bray–Curtis1.210.170.2800.2800
50 vs. CCBray–Curtis1.470.200.0980.1176
50 vs. UMBray–Curtis4.640.440.0310.0720
85 vs. CCBray–Curtis1.620.210.0870.1176
85 vs. UMBray–Curtis4.060.400.0360.0720
CC vs. UMBray–Curtis3.920.400.0250.0720
Disclaimer/Publisher’s Note: The statements, opinions and data contained in all publications are solely those of the individual author(s) and contributor(s) and not of MDPI and/or the editor(s). MDPI and/or the editor(s) disclaim responsibility for any injury to people or property resulting from any ideas, methods, instructions or products referred to in the content.

