Article

Stand States Drive Disparities in the Carbon Storage Within a Masson Pine Forest Ecosystem

1
College of Forestry, Guizhou University, Guiyang 550025, China
2
College of Ecology, Lanzhou University, Lanzhou 730000, China
*
Author to whom correspondence should be addressed.
Forests 2025, 16(3), 499; https://doi.org/10.3390/f16030499
Submission received: 13 February 2025 / Revised: 5 March 2025 / Accepted: 7 March 2025 / Published: 12 March 2025

Abstract

:
Forest ecosystems are important for carbon storage but vary in their ability to do so. Here, we examined the relationship between stand state and ecosystem carbon storage in Pinus massoniana forests, pinpointed key stand state indicators affecting carbon storage, and provided a basis for management to enhance ecosystem carbon storage. We selected nine indicators representing structure (diameter at breast height (DBH) distribution, tree height distribution, stand density), vitality (stand dominance, stand growth, and tree health), and diversity (species composition, species diversity, and species evenness) to evaluate the stand state. Multivariate statistical analyses, specifically the Mantel test and Canonical Correspondence Analysis (CCA), were employed to explore the complex relationships between the stand states of P. massoniana forests and their carbon storage. We found that (1) stand state has a strong influence on carbon storage, but there is autocorrelation among the indicators of stand states; (2) stand structural attributes have a stronger association with ecosystem carbon storage than vitality and diversity. The primary stand state indicators associated with ecosystem carbon storage are DBH distribution (H), tree growth (B), stand density (K), tree height distribution (V), and species evenness (P); (3) the stand density (K) significantly affects the carbon storage in the vegetation layer, while the DBH distribution (H) significantly affects the carbon storage in the soil layer. None of the nine stand-state indicators, however, has a major influence on the carbon storage in the litter layer. Our results indicate that important stand-state indicators can be managed to improve forest quality and carbon storage in P. massoniana forests.

1. Introduction

Forests are one of the largest carbon (C) reservoirs in terrestrial ecosystems, containing around two-thirds of the total annual terrestrial C production [1,2]. This underscores the pivotal role played by forests in the terrestrial C cycle. It is, thus, important to bolster the study of C stocks within forested ecosystems to better understand global C dynamics [3,4]. However, there are significant differences in the C storage capacities of different forest ecosystems, and such differences are comprehensively influenced by a variety of factors [5]. A deep understanding of the influencing factors of C storage in forest ecosystems is crucial for optimizing forest management strategies and enhancing the C sink function of forests [6,7,8].
Forest stand state encapsulates the natural characteristics of the stand, principally encompassing elements such as stand structure, diversity, and vitality. It can effectively mirror the quality condition of the stand, which plays a guiding role in forest management [9]. Moreover, it is highly likely to exert a significant impact on C storage [10,11,12,13]. Stand structure reflects the physical composition and arrangement of the forest, including tree density, diameter distribution, tree height, and canopy structure. Stand structure influences forest ecosystem functions like C storage, biodiversity maintenance, and hydrological regulation [14]. Stand diversity, including species richness, composition, and evenness, describes the biodiversity within a stand that influences forest ecological services and functions such as disease resistance and ecological resilience [15,16]. Stand vitality refers to the growth and health of a forest, including the growth rate of trees, crown condition, the number of dead trees, and the occurrence of diseases and pests, which can be assessed through indicators such as tree vigor, health, and dominance [17]. In light of the foregoing, to augment the C storage capacity of forests, forest management strategies can attain this objective by judiciously regulating the stand state [9]. Evidently, a profound exploration of the intricate interaction mechanisms between stand state and C storage within forest ecosystems, along with an in-depth analysis of the potential regulatory mechanisms for enhancing C storage therein, is of incalculable significance for realizing scientific forest management and bolstering C storage efficacy.
Pinus massoniana (Masson pine) is the most widely distributed native afforestation tree species in southern China’s subtropical regions. It is not only a vital economic timber forest but also plays an irreplaceable ecological role in soil and water conservation, C sequestration, C sink enhancement, and biodiversity maintenance [18]. However, most P. massoniana forests are plantations, suffering from common issues like a simple forest stand structure, a high proportion of pure forests, and extensive management practices [19,20]. These problems have hindered the full realization of its C storage potential. Research shows that the C storage in the P. massoniana forest ecosystem is mainly in the soil layer (about 50%–60%), followed by the tree layer (20%–30%) and the litter layer (5%–10%) [21,22,23]. Moreover, the forest stand’s developmental stage (young, middle-aged, or near-mature) affects the C pool’s dynamic balance by changing biomass accumulation rates and litter input amounts. For instance, in close-to-nature management, the vegetation layer’s C storage in the middle-aged forest stage is significantly higher than that in traditional control stands. In near-mature forests, the soil layer’s C storage increases due to more efficient litter decomposition [21]. Experiments in P. massoniana mixed and pure forests have shown that forest stand density, age, and their interactions influence the trends of soil organic C storage in different soil layers. This further confirms that appropriately regulating forest stand density at specific developmental stages can optimize the forest soil’s C sequestration potential [24]. Clearly, the stand state of P. massoniana forest significantly impacts the spatial distribution and long-term stability of C storage. Despite existing research, there are still uncertainties about how forest stand states exactly cause differences in C storage within the P. massoniana forest ecosystem.
Here, we investigate the influence of the stand state on C storage. To do so, we used multivariate statistical analyses (Mantel test and Canonical Correspondence Analysis (CCA)) to investigate the interconnectedness between the stand states of the P. massoniana forest and its C storage. Specifically, we addressed the following questions: (1) Does the stand state play a role in the variation in C storage among the forests? (2) Which factor, forest structure, vitality, or diversity, plays a bigger role in determining C storage? (3) Which specific stand state indicators are best for understanding variation in C storage among forests? Through this investigation, we aspired to gain an in-depth understanding of the correlation between ecosystem C storage and stand state, thereby offering new theoretical support for enhancing the C-sequestration capacity of forests and promoting their sustainable management.

2. Materials and Methods
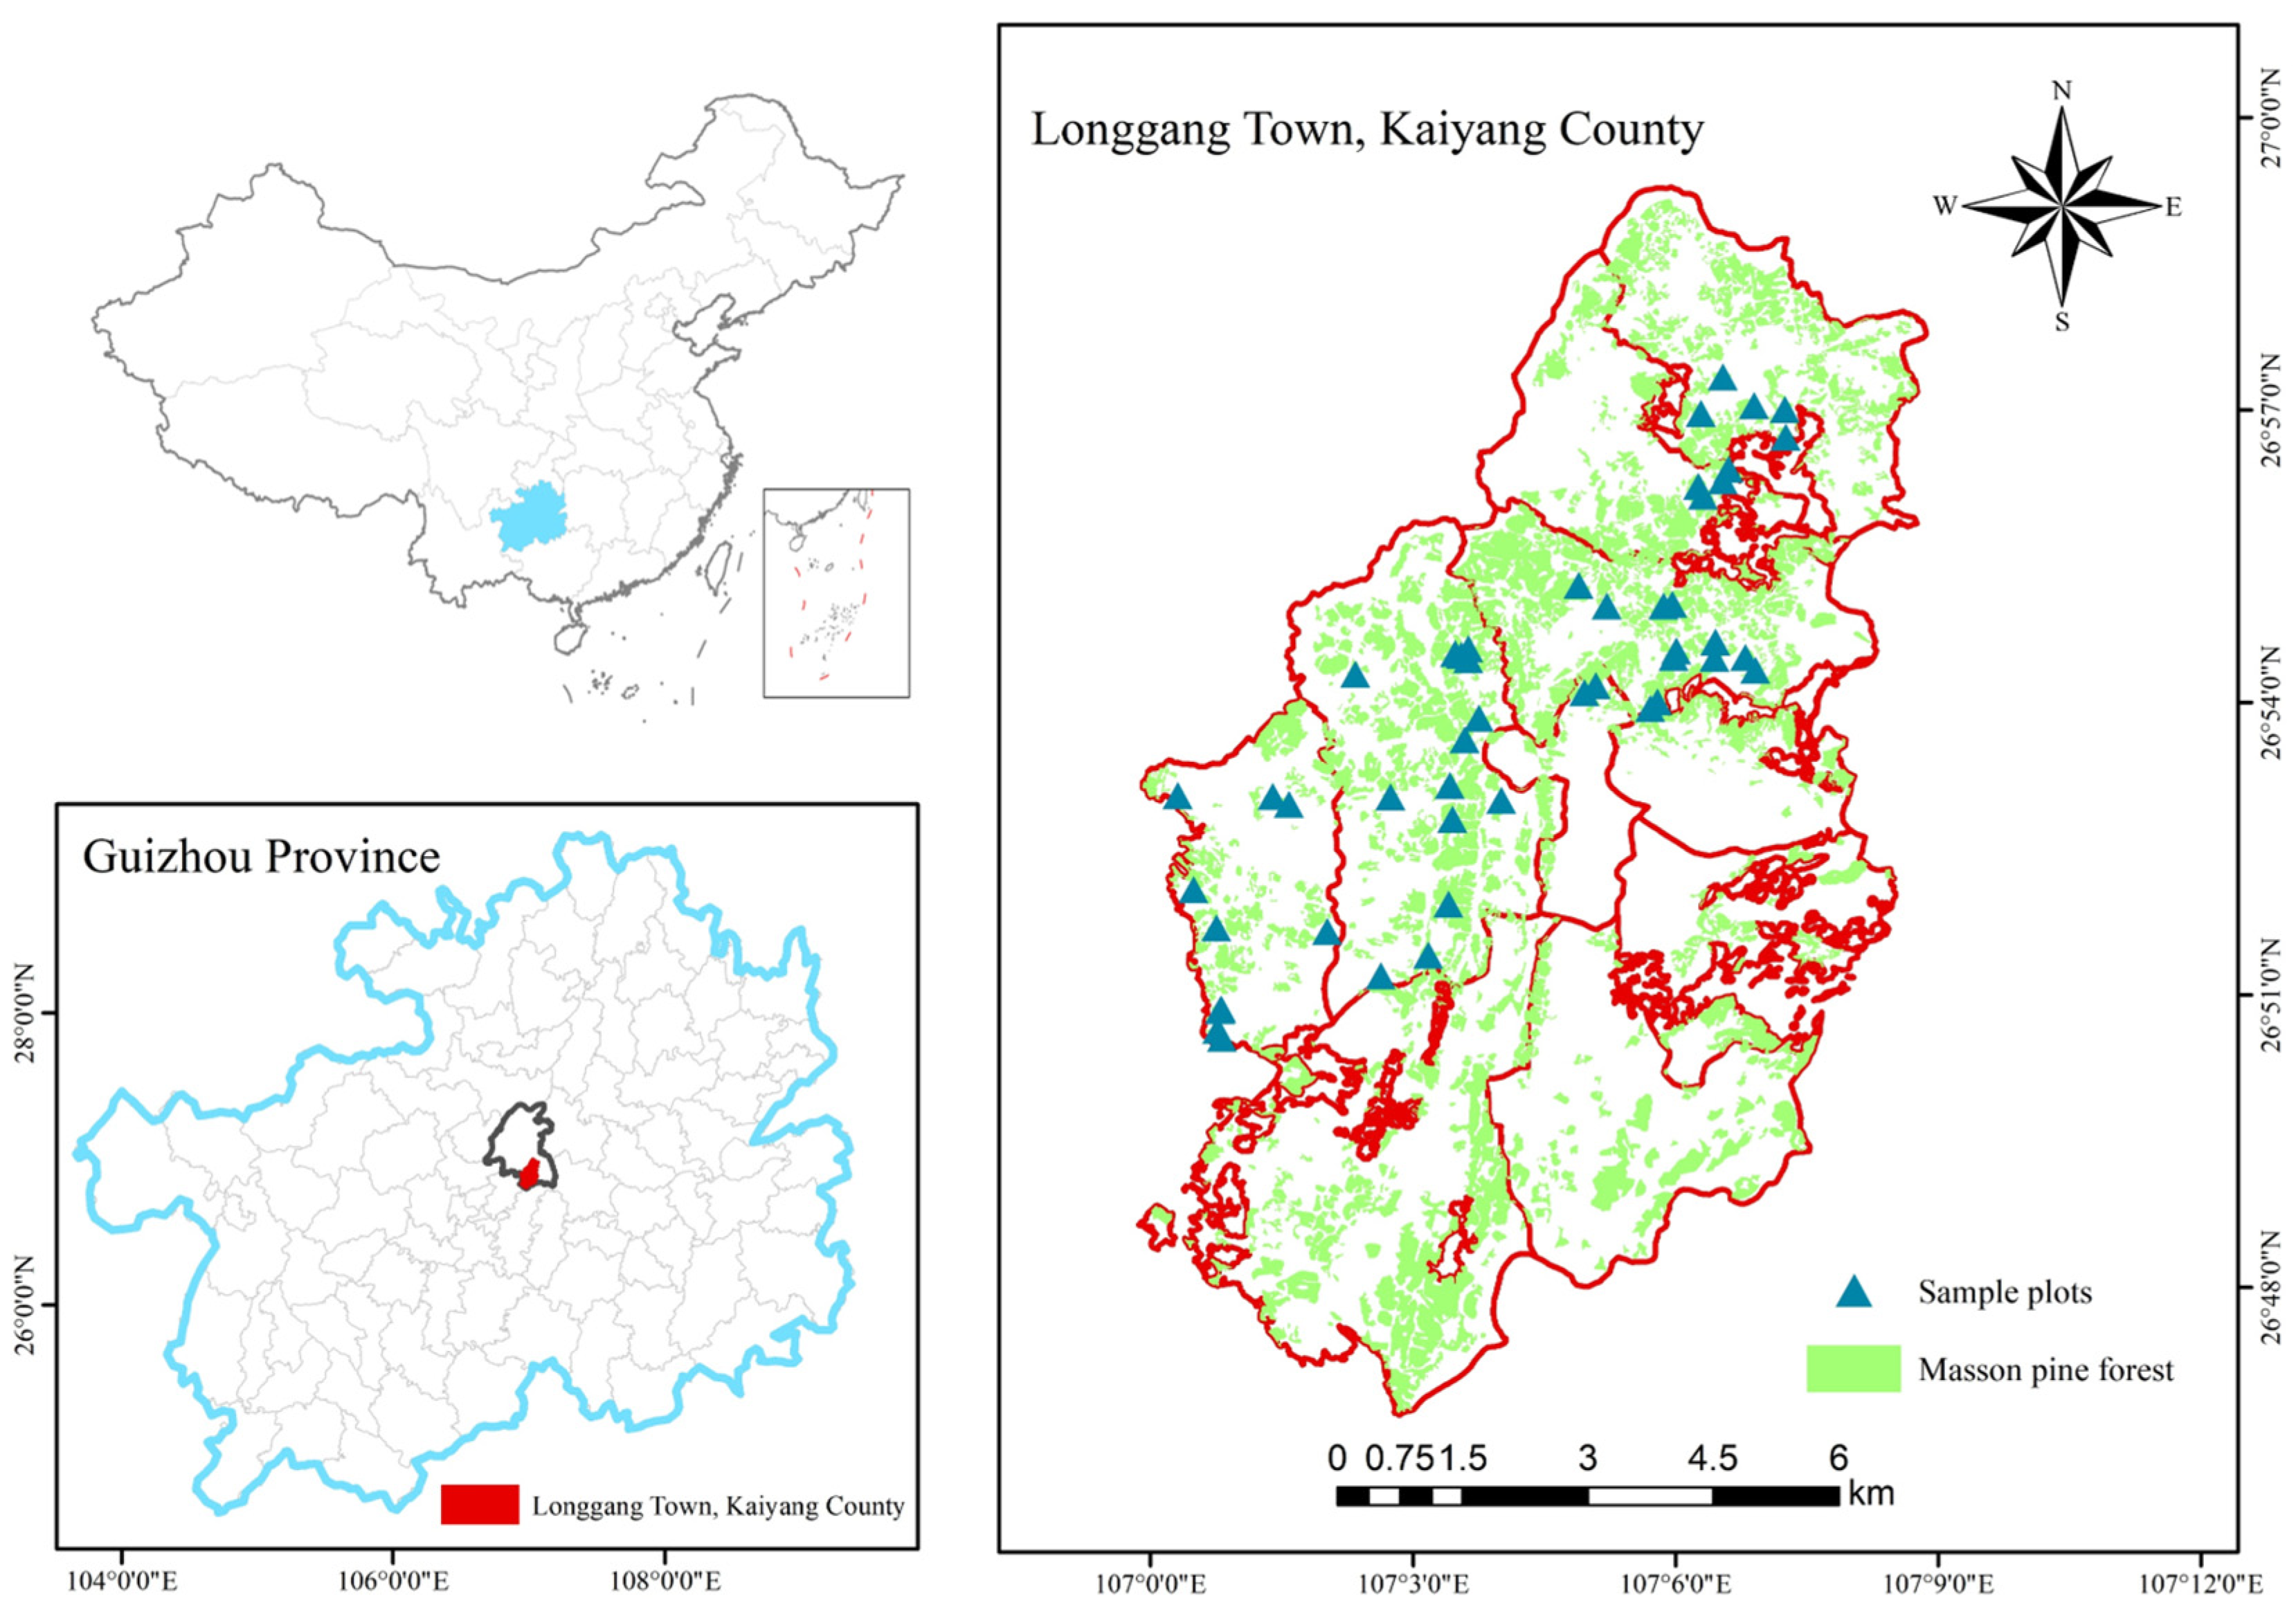
2.1. Study Area

The study area was situated in Longgang Town, Kaiyang County, Guizhou Province, China (107°6′55” N, 26°52′49” E). The altitude in the region ranges between 602.2 m to 1537.3 m, and the climate is subtropical with 70–80% humidity, with an annual average temperature of ~14 °C (maximum of 37.3 °C, minimum of −8.0 °C). The frost-free period exceeds 300 days on average, and the annual precipitation is 1139 mm. The soil parent materials are predominantly limestone, dolomite, and sand shale, with mainly acidic yellow soil. The forest type is predominantly composed of artificial coniferous forests, such as P. massoniana and Cunninghamia lanceolata, along with broadleaf species, including Liquidambar formosana, Quercus fabri, and Q. acutissima. The P. massoniana forests in this region predominantly consist of artificial stands, spanning a vast area with concentrated distribution patterns. These forests encompass various age classes, thereby demonstrating remarkable representativeness within the P. massoniana forest ecosystems of the mid-subtropical region of southern China [18,21].

2.2. Plot Establish and Survey

A total of 48 circular plots, each with an area of 667 m2 (corresponding to a radius of 14.57 m), were established along a forest–age gradient. All surveyed forest stands were P. massoniana plantations, with stand ages spanning from 15 to 50 years. During the sample–plot establishment process, comprehensive considerations were given to the terrain of the study area, forest age, management history, and stand conditions. The selected sample plots were capable of fully representing the main types of P. massoniana plantations in the study area (Figure 1). Within these plots, we placed nine evenly spaced concentric samples five meters apart in the four cardinal directions. The 4 m2 plots were used to survey shrubs and regeneration, while the 2 m2 plots were used to survey herbaceous plants. In addition, four 1 m2 plots were set up to measure soil and litter (Figure 2). For a basic overview of the surveyed sample plots, please refer to Table 1. We used a total station [TOPCON-GTS-602AF, Topcon (Beijing) Technology Development Co., Ltd., Beijing, China] to precisely locate each tree with a DBH (diameter at breast height) ≥ 5 cm within the plots and measured their DBH, tree height, crown height, height under the branches, crown width, tree quality (classified as “good”, “medium” or “poor” according to the straightness of the trees), pest and disease status (recorded as “yes” or “no” by whether the trees had been attacked by pests and diseases). In the 4 m2 and 2 m2 sample plots for shrubs and herbaceous plants, we recorded the tree species and measured the height, number of plants, area coverage, and pest status [21].

2.3. Sample Collection and Processing

We selected four concentric circles at the same distance from the center for sampling; within the 4 m2 circles, we measured the biomass of shrubs; within the 2 m2 circles, we measured the biomass of herbaceous plants. To do so, we collected and weighed the aboveground and belowground parts of all shrubs and herbaceous plants in each plot. For shrubs, we collected 400–500 g of material, and for herbaceous plants, we collected 150–250 g, which we used to measure C content in the laboratory. Within the 1 m2 circles, we first collected all the litter, weighed it in total, and then selected a sample of approximately 500 g to be taken to the laboratory for C content analyses. We sampled the soil from 0 to 20 cm, 20 to 40 cm, and 40 to 60 cm using a soil core sampler. Plant samples were placed in an oven and dried at a temperature of 85 °C until they reached a constant weight. After weighing, they were ground using a plant pulverizer through a 60-mesh screen (0.2 mm aperture) and stored in plastic bags. For soil samples, we removed all biological residues and gravel. After air-drying them naturally indoors, we sieved the samples through a 60-mesh sieve and, finally, stored them in plastic bags. To measure the organic C content of plants, litter, and soil, we used the potassium dichromate oxidation–external heating technique, with each sample measured three times. We estimated the soil bulk density using the ring knife method [18,21].

2.4. Evaluation Index Measuring Forest Stand State

Drawing on the previous research regarding stand state evaluation [25,26,27,28], in our recent investigation centered on the short-term influence of logging intensity on the stand state of Masson pine plantations, a robust stand state indicator system was established [9]. This system was founded upon three fundamental tenets: rationality, comprehensiveness, and operational feasibility. From the three dimensions of structure, vitality, and diversity, nine representative indicators were selected. For stand structure, we estimated the distribution of DBH (H), the distribution of tree height (V), and the overall stand density (K). For vitality, we evaluated stand dominance (U), stand growth (B), and stand health (Q). For stand diversity, we evaluated species composition (Z), species diversity (D), and species evenness (P). Details for how we calculated each of these metrics were computed are presented in the Supplementary File. In this study, we use the above-mentioned stand state evaluation indicator system to conduct a comprehensive assessment of P. massoniana stands.

2.5. Calculation of C Storage in Forest Ecosystems

For the tree layer, the biomass models and C content rates of tree species from the official guidelines for C sink assessment in Guizhou Province were used to estimate the C storage of sample plots [29]. The C storage of shrubs, herbs, and litter was calculated according to the biomass per unit area of forest land, the C content rate, and the area of sample plots. The formulas are as follows:
C = B × S × C F
In the formula, B represents the average biomass per unit area in the stand (t/hm2), S represents the sample plot area (m2), C represents the C storage of the sample plot (t), and CF represents the C content rate (%).
The C storage of the soil was estimated using the following formula:
C S o i l = D S O C × S
D S O C = i = 1 n B i × C i × D i / 10
In Equations (2) and (3): Csoil is the soil C storage in the sample plots (t), DSOC is the density of soil organic C in different forest types (t/hm2), Bi is the bulk density of the ith layer of soil (g/cm3), Ci is the organic C content of the ith layer of soil (g/kg), Di is the thickness of the ith layer of soil (cm) [21].

2.6. Mantel Test and Canonical Correspondence Analysis (CCA)

In light of the intricate nature of the relationship between stand state and C storage within P. massoniana forests, the selection of appropriate research methodologies assumes paramount significance. Multivariate statistical analyses, specifically the Mantel test and Canonical Correspondence Analysis (CCA), were opted for based on several cogent rationales.
The Mantel test is eminently suitable as it can efficaciously evaluate the degree of correlation between two matrices. In our research, one matrix encompasses the stand state indicators, incorporating an extensive array of structural, vitality, and diversity indicators. The other matrix pertains to C storage data. This approach enables us to ascertain whether an overarching relationship exists between stand state and carbon storage, thereby addressing the first research query. It furnishes a broad-spectrum perspective on the interconnectedness, which is fundamental for comprehending the general impact of stand state on the variation in carbon storage across diverse forests [30].
Canonical Correspondence Analysis (CCA) was chosen owing to its capacity to concurrently analyze the relationships between multiple response variables (C storage in disparate components of the forest ecosystem) and multiple explanatory variables (stand state indicators). This is pivotal for resolving the second and third research questions. Through the application of CCA, we can discern which subset of stand state factors—structure, vitality, or diversity—exerts a more pronounced influence on C storage. Moreover, it empowers us to precisely identify the specific stand state indicators that are most closely associated with carbon storage variation. CCA is particularly potent in handling intricate ecological data involving multiple interacting variables, as is manifest in our study of forest stand states and C storage [31].

2.7. Statistical Analyses

To assess the relationship between stand state and C storage in P. massoniana forests, Mantel’s test was employed to examine the correlation between stand state and C storage. These tests were carried out using the “linkET” package [30]. Canonical correspondence analysis (CCA) ordination was utilized to analyze the coupling relationship between stand status and C stock, and this was conducted using the “vegan” package [31]. The graphical analysis was conducted using the “ggplot2” package [32]. All statistical analyses were performed with R language (Version 4.4.2, Vienna, Austria).

3. Results

3.1. Characteristics of Stand State and C Storage in P. massoniana Forests

In our research on various indicators of forest structure, we found that the difference between the maximum and minimum values of species diversity (D) was the largest, with a difference of 0.704, while the difference between the maximum and minimum values of tree height distribution (V) was the smallest, only 0.202. Furthermore, the coefficient of variation in each indicator had a relatively large range, from 6.09% to 62.66%. Among them, the stand dominance (U) had the highest coefficient of variation, which was 62.66%, and the stand density (K) had the lowest coefficient of variation, which was 6.09%. Similarly, the coefficient of variation in C stocks in each layer was between 26.21% and 57.74%. The soil layer had the smallest coefficient of variation, the herb layer had the largest coefficient of variation, and the C storage in each soil layer exhibited a clear-cut trend. In particular, with the increase in soil depth, the C storage diminishes gradually. Moreover, the total C storage of the ecosystem ranges from 9.880 to 19.283 t, with an average value of 13.462 and a coefficient of variation of 17.69%, indicating relatively small variation (Table 2).

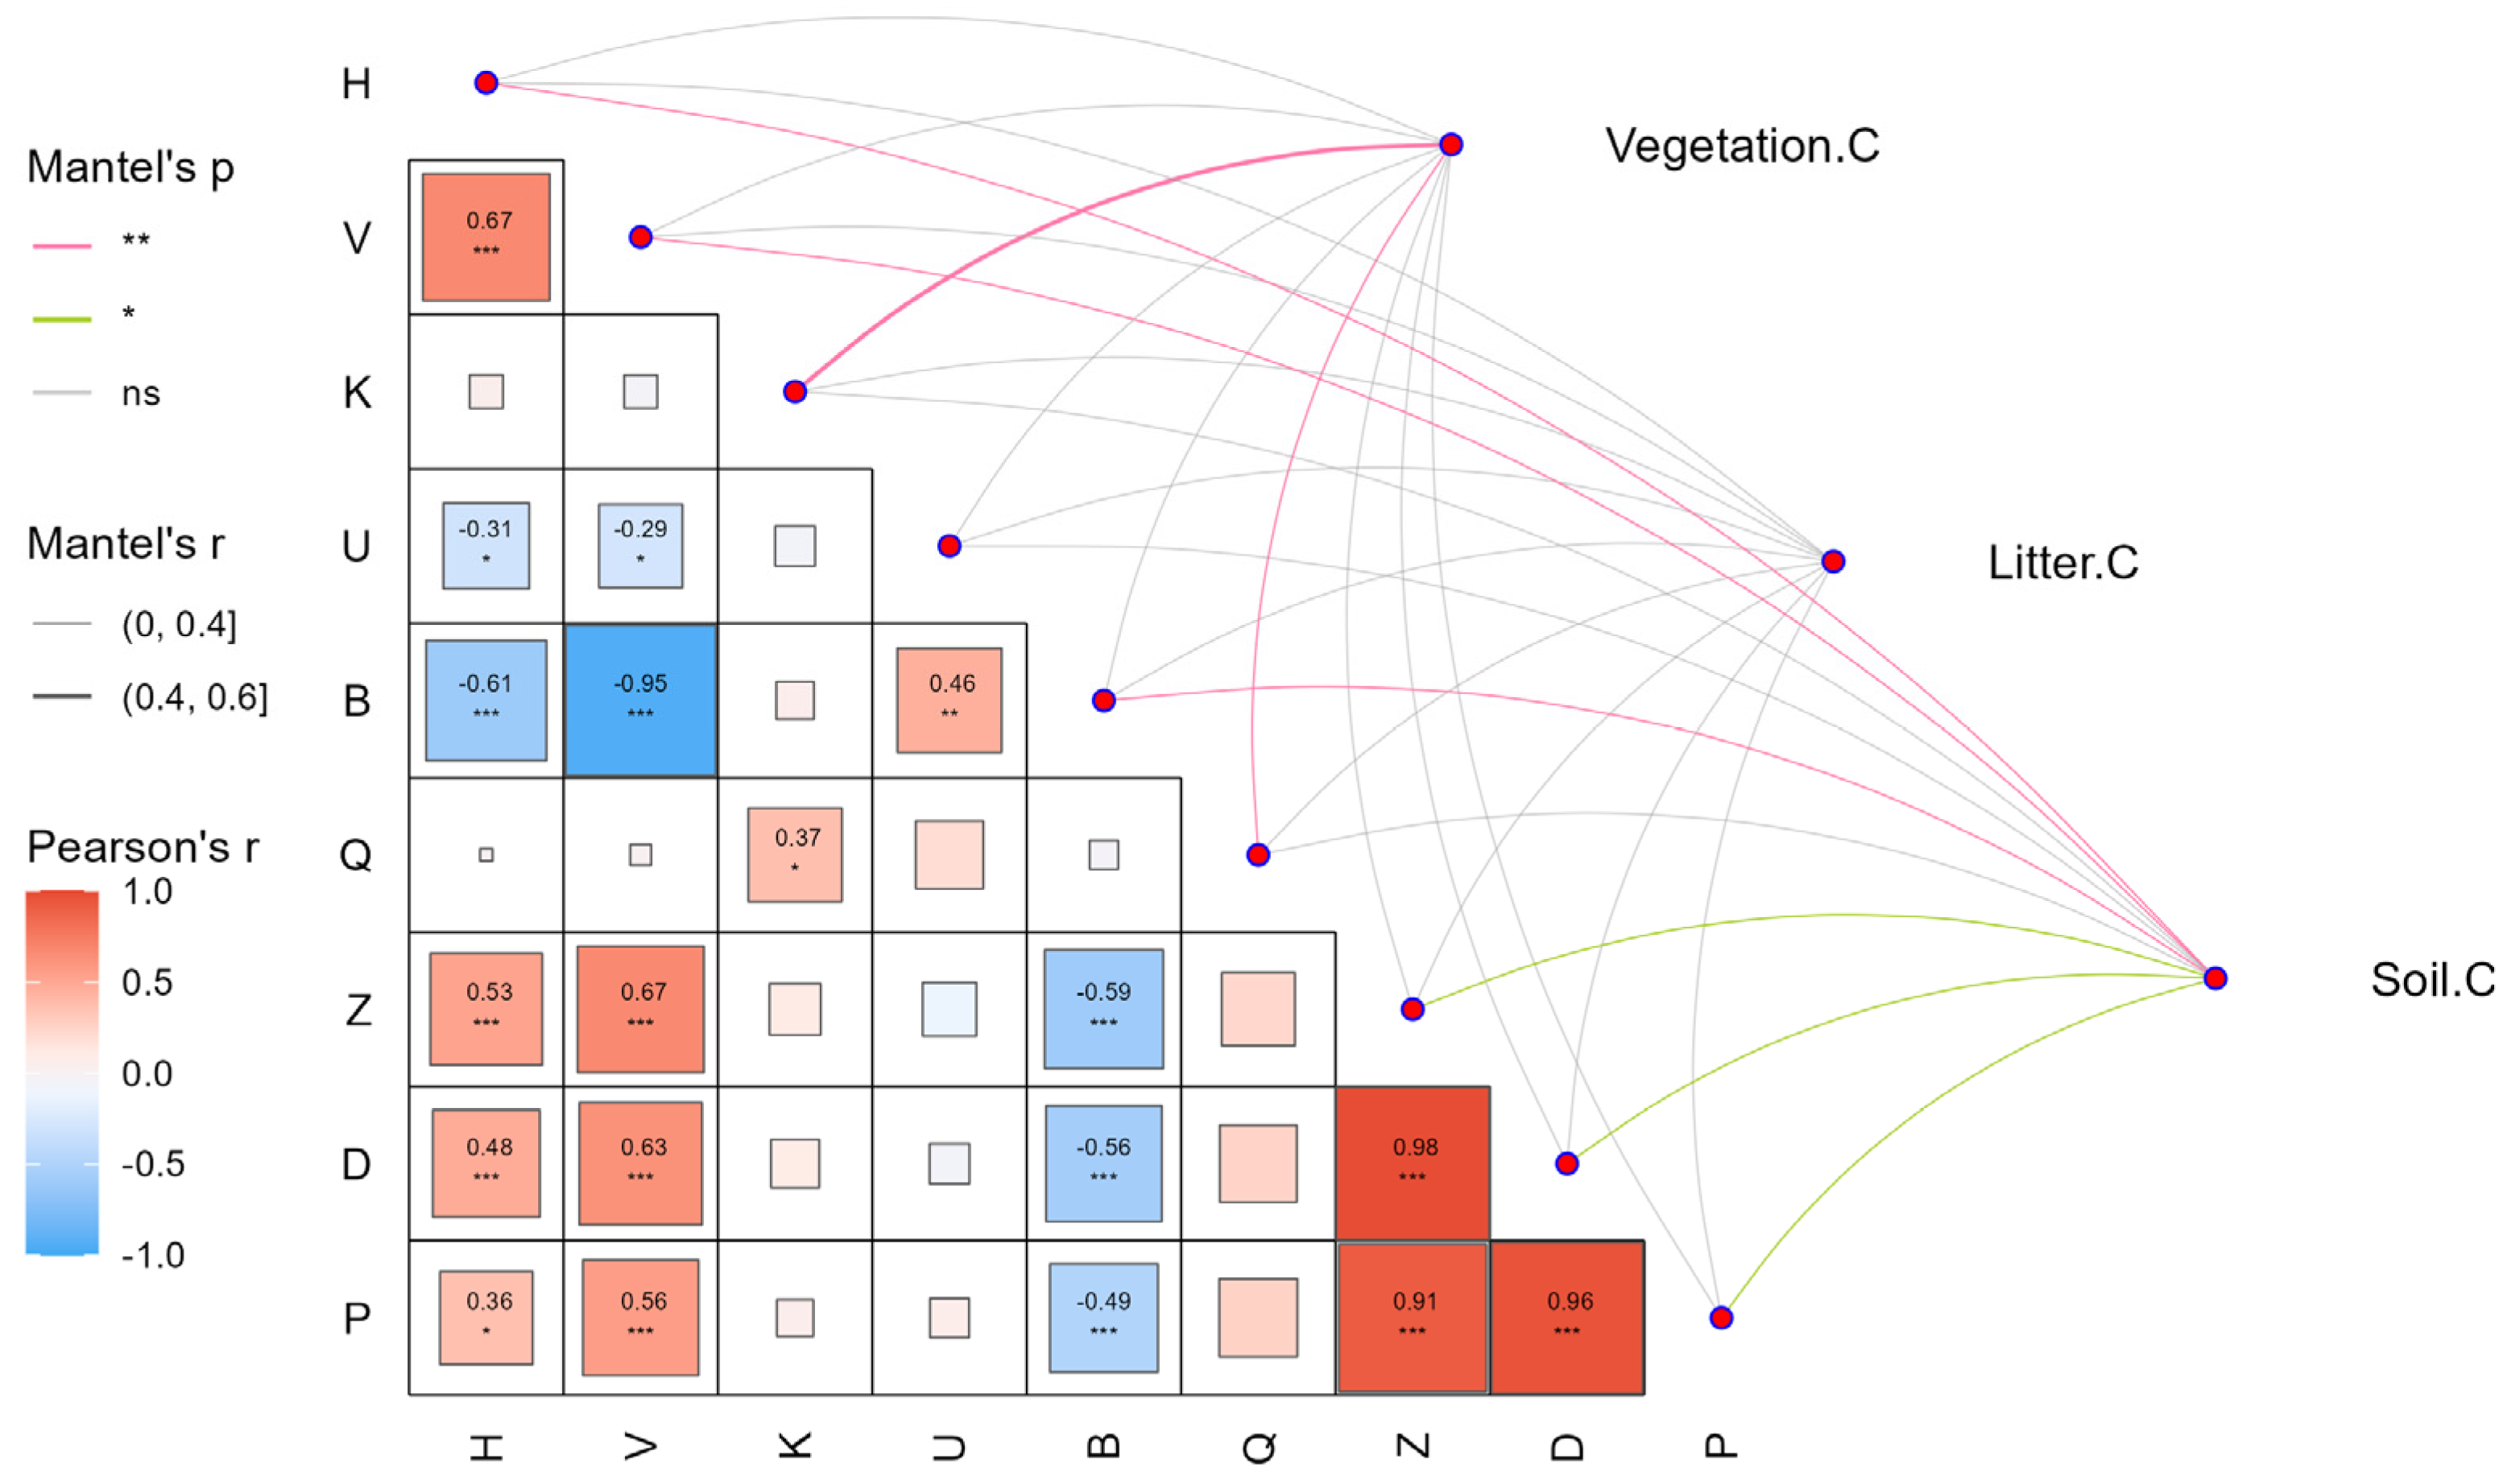
3.2. The Correlation Between Stand State and C Storage in P. massoniana Forests

Through Mantel tests (Figure 3), we found correlations between vegetation C storage and forest condition indicators. Firstly, the connection between vegetation C storage and stand density (K) is relatively strong (0.4 < r < 0.5) (p < 0.01). However, the correlation between vegetation C storage and tree health (Q) is comparatively weak (0 < r < 0.4) (p < 0.01). There is no notable association between litter layer C storage and any indicators of forest condition. Soil layer C storage is weakly correlated (0 < r < 0.4) with DBH distribution (H), tree height distribution (V), stand growth (B), species composition (Z), species diversity (D), and species evenness (P) (p < 0.05). We found no correlation between stand dominance (U) and C storage in any layers.
In addition, we also found some associations among the forest indicators and conditions. For example, we found that DBH distribution (H) and tree height distribution (V) are positively correlated with species composition (Z), species diversity (D), and species evenness (P). Stand density (K) is positively correlated with stand health (Q). Stand dominance (U) is positively correlated with stand growth (B). Stand growth (B) is negatively correlated with tree composition (Z), species diversity (D), and species evenness (P). Species composition (Z) is positively correlated with species diversity (D) and species evenness (P), and species diversity (D) is positively correlated with species evenness (P). Overall, the most significant negative correlations are between tree height distribution (V) and stand growth (B), and the most significant positive correlation is between species composition (Z) and species diversity (D).

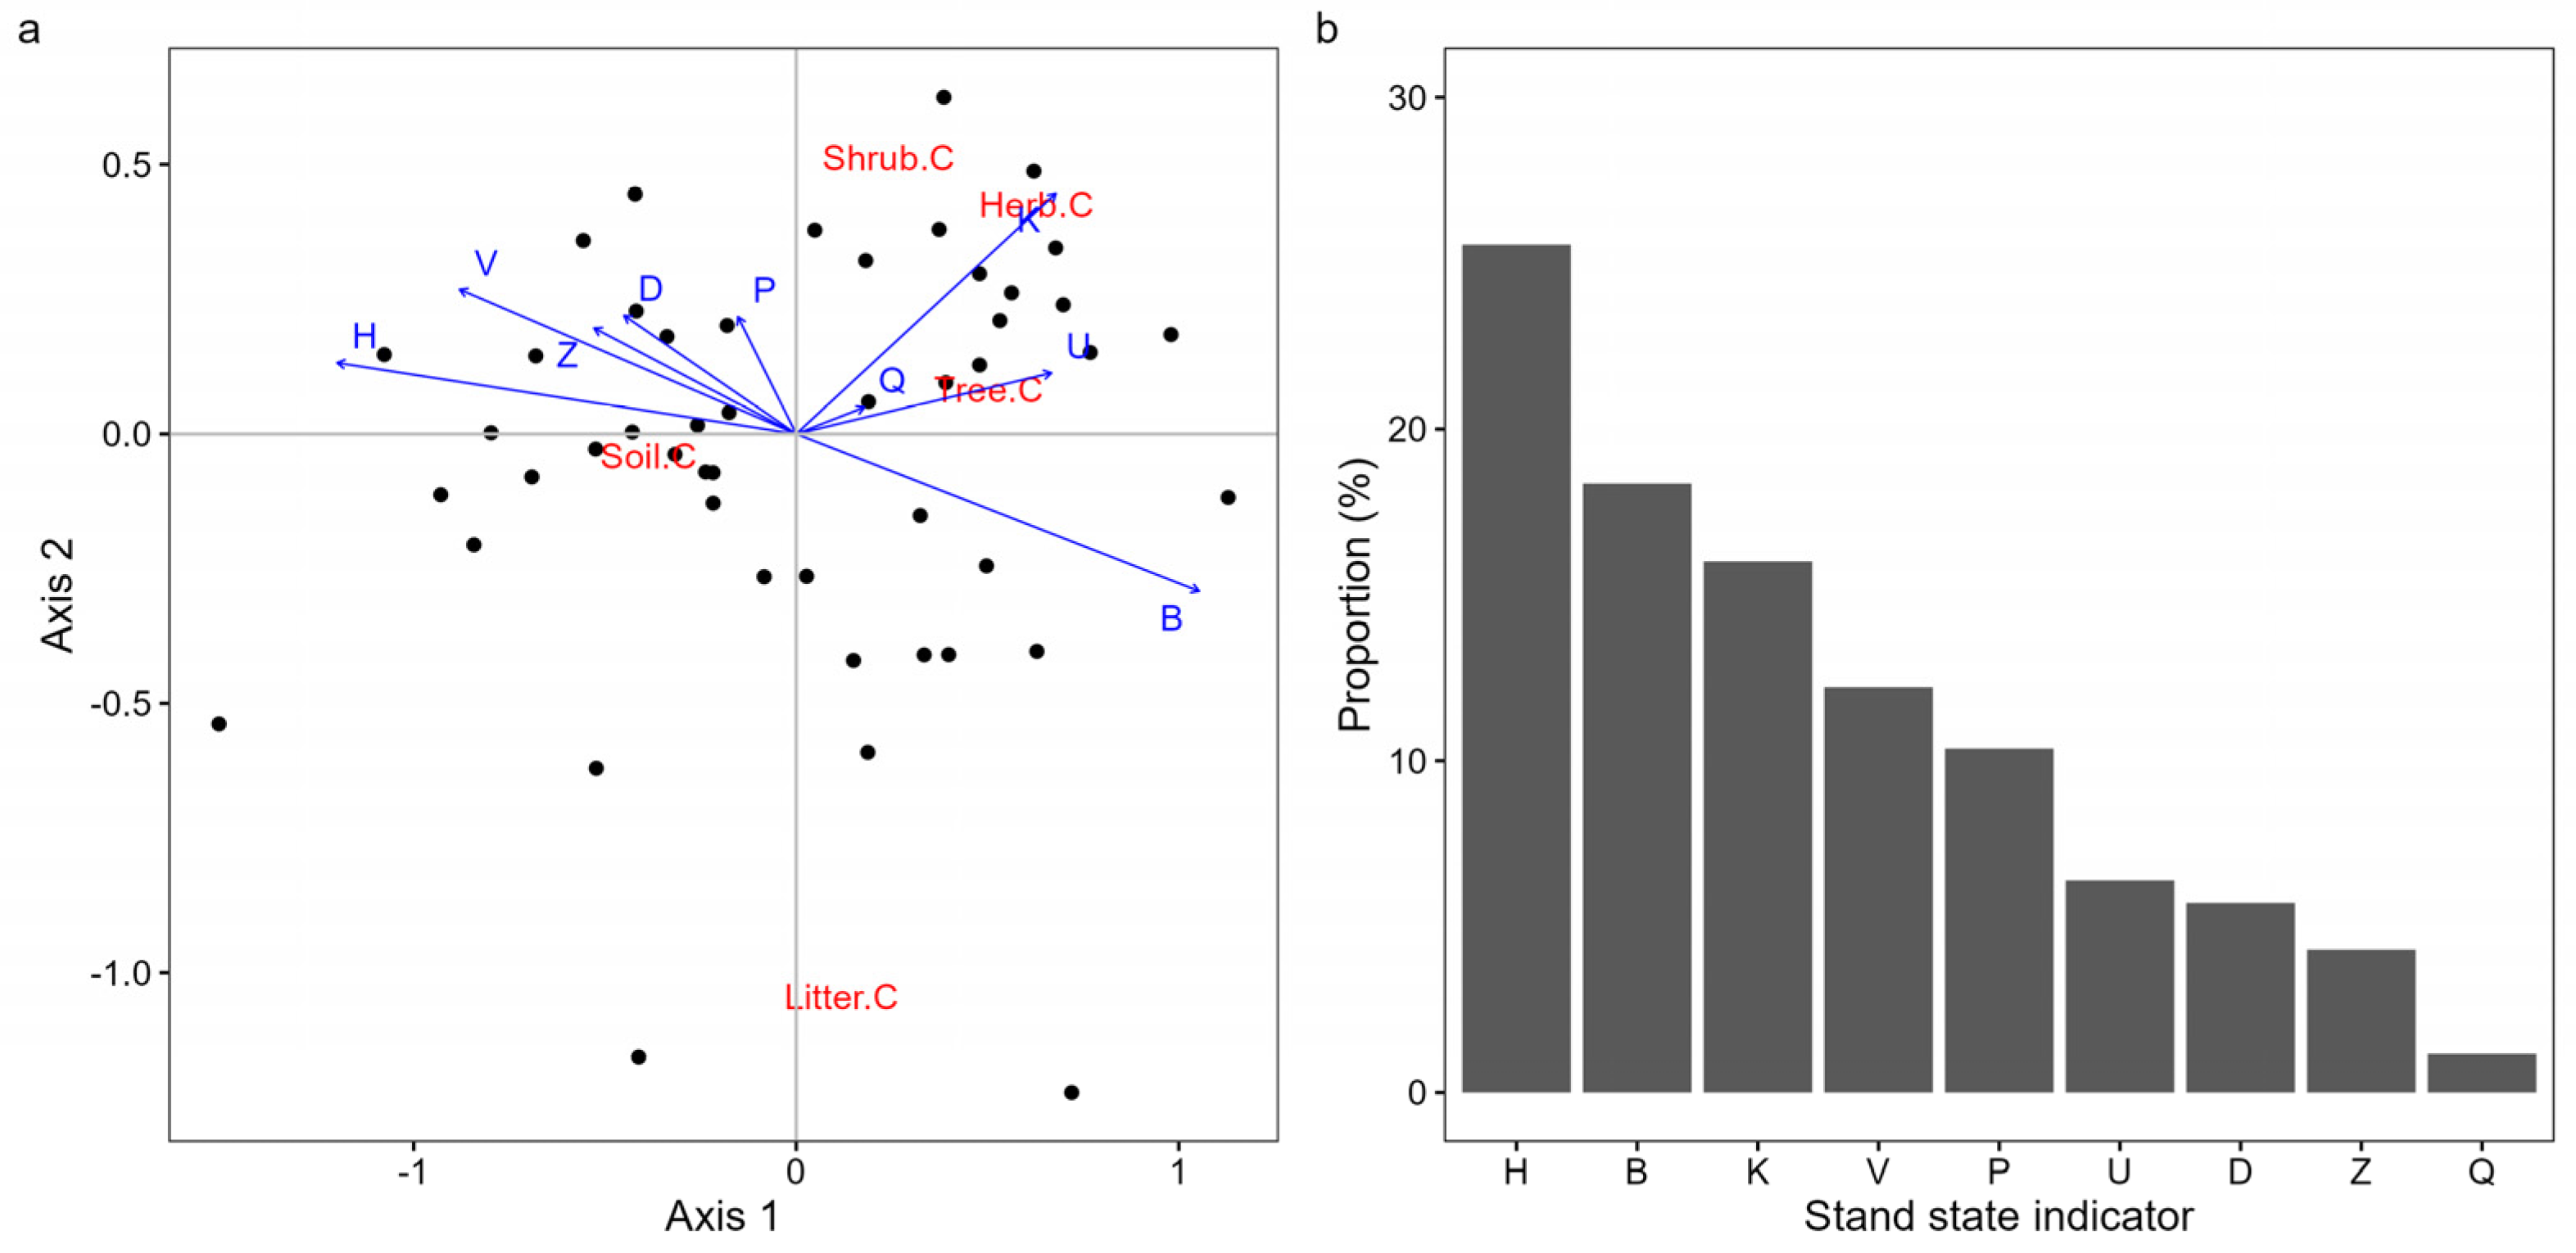
3.3. The Coupling Correlation Between the Stand State and C Storage in P. massoniana Forests

The four canonical axes in the CCA ordination cumulatively accounted for 38.34% of the relationship between the stand state and ecosystem C storage (p <0.01) (Table 3). The cumulative explanatory power of the first two axes was 37.53%, indicating that these primary two axes of the CCA could effectively capture the relationship between stand state and ecosystem C storage. Among the nine stand state indicators, the highest correlation coefficient with Axis 1 was stand dominance (U) (0.9944), followed by a negative correlation with DBH distribution (H) (−0.9851). The stand state indicator with the strongest correlation with Axis 2 was species evenness (P) (0.7733), and stand density (K) also had a relatively high positive correlation (0.5535). Overall, this suggests that the ecosystem C storage in these forests is primarily influenced by stand dominance (U), DBH distribution (H), species evenness (P), and stand density (K).
When we plotted a two-dimensional ordination based on the first two axes (Figure 4a), we found that the influence of stand dominance (U) gradually from left to right, while the DBH diminishes in this direction. In parallel, the species evenness (P) and the density of the stand (K) both increase along axis 2. Moreover, C storage in the tree layer was strongly influenced by stand dominance (U), and C storage in the shrub and herbaceous layer was mostly influenced by forest density (K). The distribution of DBH (H) and the proportionality of species evenness (P) influence C storage in the soil layer. The C storage within the litter layer differs from the vegetation characteristics conventionally used as indicators of forest condition, suggesting that the C content within the litter layer may be governed by factors beyond those of forest state indicators.
In Figure 4b, we present hierarchical ordering of the explanatory values for the nine indicators of stand state, with the strongest influence of DBH distribution (H), stand growth (B) and stand density (K), tree height distribution (V), and species evenness (P), but weaker influence of species diversity (D), species composition (Z), and stand health (Q). When we aggregated explanatory rates, we found that those related to structure explained the most variation (53.79%) compared to those related to vitality (25.83%) and variety (20.40%). Among the structural attributes, we found that the diameter at breast height (DBH) distribution (H) can better explain the variation in ecosystem C storage and exert a substantial influence on soil layer C storage. Both stand density (K) and tree height distribution (V) also have explanatory rates >10% of ecosystem C storage. Regarding vitality characteristics, tree growth (B) contributes considerably more to ecosystem C storage than stand dominance (U) and stand health (Q). The explanatory rates of stand dominance (U) and stand health (Q) are both <10%. Although stand dominance (U) significantly affects vegetation C storage, its influence is not as pronounced as that of stand density (K) among the structural attributes. Among the diversity characteristics, species evenness (P) has a greater impact compared to the other two indicators for soil layer C storage. However, its contribution is smaller than the diameter distribution (H) for structural characteristics. The explanatory rates of species diversity (D) and species composition (Z) are both <10%.

4. Discussion

The structure of P. massoniana forest stands played a critical role in determining C storage in our study. This is consistent with several previous studies in different systems. For example, Zhang et al. [33] investigated the effects of stand structure and topography on the C density of forest vegetation and found that the interplay between stand structure and topography on C density plays an important role in the augmentation of forest vegetation C stock. Likewise, He et al. [34] found that stand growth and site quality, average stand age, density, basal area, and average tree height are strongly linked to stand C storage, while Li et al. [35] showed that stand spatial structure and species diversity are key indicators governing C storage. Importantly, forest management, such as selective thinning, can strongly influence C storage. For example, thinning primarily affects tree growth and C storage by optimizing stand structure or state [11,36]. Our study confirmed this by showing that forest C storage can be effectively augmented by optimizing forest structure during forest management processes.
Of the importance of stand characteristics related to C storage, we found that structure > vitality > diversity. This is most likely attributable to the direct influence of structural attributes on biomass accumulation and distribution. A stand with a high density, multi-layered canopy, and intricate architecture will typically amass greater biomass and foliage cover, thereby augmenting its C storage capacity [37]. Indeed, alterations to the age structure of Cunninghamia lanceolata stands can directly modulate C stocks [38]. We suggest that parameters associated with vitality have a greater influence on forest C storage than diversity because these measures lead to increased C cycling and enhanced storage capacity. Conversely, diversity has a more indirect influence on C storage by shaping tree photosynthesis and reflecting soil fertility and moisture. However, diversity can be more important for ecosystem resilience than just C storage [39,40]. Tree species diversity can not only increase soil C storage but can also enhance the stability of the soil C pool.
In terms of the explanatory power of stand state indicators for C storage, the key variables are DBH distribution (H), stand growth (B), stand density (K), tree height distribution (V), and species evenness (P). This is largely because these parameters directly or indirectly influence forest biomass, growth rate, and ecosystem structure, thereby influencing C accumulation and storage. Among these, several are structural characteristics. All these structural attributes modulate light availability and water cycling within the forest, thus influencing C fixation and accumulation capacity [41,42]. Specifically, DBH distribution (H) and tree height distribution (V) are important parameters for biomass estimation and are positively correlated with vegetation biomass [43]. Stand density (K) affects environmental factors within the forest (e.g., light, temperature, and moisture), which in turn influence the C density of forest ecosystems; as stand density increases, the C storage in the tree layer increases accordingly [41]. Furthermore, the vertical spatial distribution of C density is related to stand density, where high-density stands favor an increased allocation of C density in trunks, bark, and roots. Stand growth (B) directly influences the C storage potential of forests through tree growth rates and biomass accumulation, which is linked to the age composition of the forests. On the other hand, species evenness (P) can diversify the distribution of plant root systems. This leads to an increase in the soil C pool through turnover and sequestration while also improving soil structure. Furthermore, species diversity affects the activity of soil microorganisms through the provision of a variety of substrates, which indirectly influences the C cycle and storage. This contributes to the productivity of ecosystems and the C cycle [44].
We found that C storage in the tree layer is primarily associated with stand dominance, and stand density is associated with C storage in the shrub and herbaceous layers. Soil C storage was associated with the stand’s horizontal distribution, vertical distribution, and tree species distribution. Finally, for litter, the stand state had little to do with its C storage. Stand dominance is an indicator that encompasses not only the abundance and growth status of trees but also the interrelationships and spatial arrangement among them. It is strongly associated with C storage in the arboreal stratum. Stand density is likely associated with the biomass accumulation of the shrub and herbaceous layers by influencing environmental conditions such as light and water availability, thereby impacting C storage in these layers. C storage in the soil layer is mainly influenced by the horizontal distribution of DBH. A larger average DBH promotes better stand growth, leading to increased soil C storage [45]. In the vertical dimension, the distribution of tree height, together with diversity, is associated with soil C storage through their impact on biomass accumulation and litter input [46]. Notably, the associations we observed with C storage in the litter layer may be confounded by the comparatively slow decomposition process and the limited time scale. Instead, other factors may exert a more substantial influence on C storage in the litter layer, obscuring the correlation with stand-state indicators.
We suggest that stand density can be regulated through selective logging to enhance the growth and distribution of undergrowth shrubs, herbs, and natural regeneration. We also suggest adopting the principles of “taking the weak, leaving the strong” and “taking the bad, leaving the good” during logging operations to enhance tree dominance and effectively augment C storage in the arboreal stratum [47]. Furthermore, the structure of tree species, as well as the horizontal and vertical structural complexity, can be managed by replanting broad-leaved species in the understory, with the aim of enhancing C stock in the soil layer, thereby enhancing the potential for soil to be a C sink. Finally, interactions between forest structure, diversity, and C storage should be considered in forest management. This will help us achieve multifunctionality and sustainability of forest ecosystems. Through scientific management and silvicultural practices, we can enhance the C sequestration potential of forests while also protecting and enhancing biodiversity.
Currently, our research on the impact of forest ecosystem C storage predominantly focuses on single-scale analysis at the stand level, overlooking the multi-scale (tree–stand–landscape) interactions that significantly influence C storage. Moreover, due to reliance on static data, these studies are unable to capture the dynamic changes in stand states and C storage over time. In addition, only a few key stand-related variables are considered in the research, leaving the complex interactions among climatic, soil, biological factors, and C storage insufficiently explored [15,22]. Future research should adopt a multi-scale approach, integrating the analyses at the tree, stand, and landscape scales to better understand the comprehensive mechanisms governing C storage. Long-term monitoring programs are essential for tracking the dynamic changes in stand states and C storage [10,11]. Furthermore, by applying more advanced modeling techniques to incorporate a broader range of environmental factors and their interactions, it will be possible to more accurately predict the C storage in Masson pine forest ecosystems under diverse stand states, thus facilitating the formulation of more refined forest management and C sequestration strategies [5,8].

5. Conclusions

We selected nine indicators representing three aspects of stand states, structure, vitality, and diversity, to assess the condition of P. massoniana forests and capacity for C storage. We found associations between the stand state and ecosystem C storage. There were significant correlations between the stand conditions and ecosystem C storage. Vegetation layer C storage was significantly correlated with stand density (K), while soil layer C storage was weakly correlated with DBH distribution (H), tree height distribution (V), and stand growth (B). However, there was no significant correlation between litter C storage and any of the stand state indicators. Stand-state characteristics could explain the variation in ecosystem C storage better than measures of vitality and diversity. DBH distribution (H), stand growth (B), stand density (K), tree height distribution (V), and species evenness (P) were the key stand state indicators influencing ecosystem C storage. Among them, stand density (K) significantly influenced vegetation layer C storage, while DBH distribution (H) significantly influenced soil layer C storage. Nevertheless, these nine stand condition indicators did not have a significant impact on litter layer C storage. We suggest that these key stand-state indicators associated with ecosystem C storage can be managed to enhance forest quality and achieve C storage goals. Future research should use a multi-scale approach, integrating tree, stand, and landscape analyses to better understand C storage mechanisms. Long-term monitoring is vital for tracking stand state and C storage changes. Advanced modeling, considering more environmental factors and their interactions, will more accurately predict C storage in Masson pine forests. This will help develop better forest management and C sequestration strategies.

Supplementary Materials

The following supporting information can be downloaded at: https://www.mdpi.com/article/10.3390/f16030499/s1.

Author Contributions

Data curation, J.H. and Z.C.; investigation, J.H. and Z.C.; methodology, J.H., W.W. and Z.C.; writing—original draft, J.H.; writing—review and editing, W.W. and Z.C. All authors have read and agreed to the published version of the manuscript.

Funding

The study was funded by the following grants: Guizhou Province Forestry Science Project, grant number: QLKH [2023]10; National Natural Science Foundation of China, grant number: 32001314; Guizhou Provincial Basic Research General Program (Natural Science), grant number: ZK [2025]639.

Data Availability Statement

Data will be made available upon request.

Conflicts of Interest

The authors declare that they have no known competing financial interests or personal relationships that could have appeared to influence the work reported in this paper.

References

  1. Ruiz–Benito, P.; Madrigal–Gonzalez, J.; Ratcliffe, S.; Coomes, D.A.; Kaendler, G.; Lehtonen, A.; Wirth, C.; Zavala, M.A. Stand Structure and Recent Climate Change Constrain Stand Basal Area Change in European Forests: A Comparison Across Boreal, Temperate, and Mediterranean Biomes. Ecosystems 2014, 17, 1439–1454. [Google Scholar] [CrossRef]
  2. Food and Agriculture Organization of the United Nations (FAO). Global Forest Resources Assessment 2020: Main Report; FAO: Rome, Italy, 2021. [Google Scholar] [CrossRef]
  3. Ahtikoski, A.; Ahtikoski, R.; Haapanen, M.; Hynynen, J.; Karkkainen, K. Economic Performance of Genetically Improved Reforestation Material in Joint Production of Timber and Carbon Sequestration: A Case Study from Finland. Forests 2020, 11, 847. [Google Scholar] [CrossRef]
  4. Ouimette, A.P.; Ollinger, S.V.; Lepine, L.C.; Stephens, R.B.; Rowe, R.J.; Vadeboncoeur, M.A.; Tumber–Davila, S.J.; Hobbie, E.A. Accounting for Carbon Flux to Mycorrhizal Fungi May Resolve Discrepancies in Forest Carbon Budgets. Ecosystems 2020, 23, 715–729. [Google Scholar] [CrossRef]
  5. Straus, H.; Podvinsek, S.; Klopcic, M. Identifying Optimal Forest Management Maximizing Carbon Sequestration in Mountain Forests Impacted by Natural Disturbances: A Case Study in the Alps. Forests 2023, 14, 947. [Google Scholar] [CrossRef]
  6. Nilsen, P.; Strand, L.T. Carbon stores and fluxes in even- and uneven- aged Norway spruce stands. Silva Fenn. 2013, 47, 1024. [Google Scholar] [CrossRef]
  7. Sharma, A.; Bohn, K.K.; Jose, S.; Dwivedi, P. Even-Aged vs. Uneven-Aged Silviculture: Implications for Multifunctional Management of Southern Pine Ecosystems. Forests 2016, 7, 86. [Google Scholar] [CrossRef]
  8. Magnani, F.; Dewar, R.C.; Borghetti, M. Leakage and spillover effects of forest management on carbon storage: Theoretical insights from a simple model. Tellus Ser. B Chem. Phys. Meteorol. 2009, 61, 385–393. [Google Scholar] [CrossRef]
  9. Tu, J.; Zhao, Z.; Chai, Z. The Short-Term Impact of Logging Intensity on the Stand State of Middle-Aged Masson Pine (Pinus massoniana Lamb.) Plantations. Forests 2025, 16, 183. [Google Scholar] [CrossRef]
  10. Jagodzinski, A.M.; Dyderski, M.K.; Gesikiewicz, K.; Horodecki, P.; Cysewska, A.; Wierczynska, S.; Maciejczyk, K. How do tree stand parameters affect young Scots pine biomass?—Allometric equations and biomass conversion and expansion factors. For. Ecol. Manag. 2018, 409, 74–83. [Google Scholar] [CrossRef]
  11. Thom, D.; Keeton, W. Stand structure drives disparities in carbon storage in northern hardwood-conifer forests. For. Ecol. Manag. 2019, 442, 10–20. [Google Scholar] [CrossRef]
  12. Takagi, K.; Hirayama, K.; Hayashi, M.; Makoto, K.; Okada, K.; Oguma, H.; Saigusa, N. Forest structure explains spatial heterogeneity of decadal carbon dynamics in a cool–temperate forest. Environ. Res. Lett. 2024, 19, 114022. [Google Scholar] [CrossRef]
  13. Penne, C.; Ahrends, B.; Deurer, M.; Boettcher, J. The impact of the canopy structure on the spatial variability in forest floor carbon stocks. Geoderma 2010, 158, 282–297. [Google Scholar] [CrossRef]
  14. Feng, Q.; Chen, C.; Qin, L.; He, Y.; Wang, P.; Duan, Y.; Wang, Y.; He, Y. Effects of Different Management Models on Stand Structure and Plant Diversity of Natural Secondary Forests of Quercus Mongolica. Sci. Silvae Sin. 2018, 54, 12–21. [Google Scholar]
  15. Rota, E.; Caruso, T.; Bargagli, R. Community structure, diversity and spatial organization of enchytraeids in Mediterranean urban holm oak stands. Eur. J. Soil Biol. 2014, 62, 83–91. [Google Scholar] [CrossRef]
  16. Aussenac, R.; Bergeron, Y.; Ghotsa, M.C.; Gravel, D.; Pilch, K.; Drobyshev, I. Intraspecific variability in growth response to environmental fluctuations modulates the stabilizing effect of species diversity on forest growth. J. Ecol. 2017, 105, 1010–1020. [Google Scholar] [CrossRef]
  17. Haq, S.M.; Waheed, M.; Khoja, A.A.; Amjad, M.S.; Bussmann, R.W.; Ali, K.; Jones, D.A. Measuring forest health at stand level: A multi–indicator evaluation for use in adaptive management and policy. Ecol. Indic. 2023, 150, 110225. [Google Scholar] [CrossRef]
  18. Chai, Z.; Zhu, J.; Zhao, Z. Close-to-nature management alleviated microbial P limitation in middle–aged Masson pine plantations: Evidence derived from ecoenzymatic stoichiometry. For. Ecol. Manag. 2025, 580, 122543. [Google Scholar] [CrossRef]
  19. Fang, X.; Tan, W.; Gao, X.; Chai, Z. Close-to-nature management positively improves the spatial structure of Masson pine forest stands. Web Ecol. 2021, 21, 45–54. [Google Scholar] [CrossRef]
  20. Chai, Z.; Tan, W. Impacts of close-to-nature management on the stand states of Masson pine forests. Ecosyst. Health Sustain. 2020, 6, 1846461. [Google Scholar] [CrossRef]
  21. Zou, F.; Chai, Z. Effects of Close-to-Nature Management on Carbon Storage of Pinus massoniana Plantation Ecosystem. Guangxi Sci. 2024, 31, 405–415. [Google Scholar]
  22. Li, Y.; Mo, Y.; Qin, J.; Ma, J. Carbon Storage and Distribution Pattern of Pinus massoniana Plantations Ecosystem in Different Forest Ages in Guangxi. Guangxi Sci. 2024, 31, 346–356. [Google Scholar]
  23. Wei, M.; Wang, C.; Yang, Z.; Huang, Z.; Wang, H.; He, B. Carbon storage and distribution of Pinus massoniana plantation ecosystem in northwest Guangxi. Subtrop. Agric. Res. 2019, 15, 152–156. [Google Scholar]
  24. Zhang, K.; Gao, D.; Guo, H.; Zeng, J.; Liu, X. Forest structure characteristics on soil carbon and nitrogen storage of Pinus massoniana plantations in southern subtropic region. Front. For. Glob. Change 2022, 5, 1022221. [Google Scholar] [CrossRef]
  25. Hui, G.; Zhang, G.; Zhao, Z.; Yang, A. Methods of Forest Structure Research: A Review. Curr. For. Rep. 2019, 5, 142–154. [Google Scholar] [CrossRef]
  26. Wei, H.; Zhang, Y.; Dong, L.; Liu, Z.; Chen, Y. Comprehensive evaluation of spatial structure state for the main forest types in Maoershan mountain. J. Cent. South Univ. For. Technol. 2021, 41, 131–139. [Google Scholar]
  27. Zhang, G.; Hui, G.; Zhang, G.; Hu, Y.; Zhao, Z. A Novel Comprehensive Evaluation Method of Forest State Based on Unit Circle. Forests 2019, 10, 5. [Google Scholar] [CrossRef]
  28. Zhao, Z.; Hui, G.; Liu, W.; Hu, Y.; Zhang, G. A Novel Method for Calculating Stand Structural Diversity Based on the Relationship of Adjacent Trees. Forests 2022, 13, 343. [Google Scholar] [CrossRef]
  29. Guizhou Provincial Department of Natural Resources and Planning. Guizhou Province Individual Tree Carbon Sink Project Methodology (No. 201712–V1); Guizhou Provincial Department of Natural Resources and Planning: Guiyang, China, 2017. [Google Scholar]
  30. Huang, H. Everything Is Linkable, R Package Version 0.0.3. 2021. Available online: https://github.com/Hy4m/linkET (accessed on 1 September 2024).
  31. Oksanen, J.; Simpson, G.L.; Blanchet, F.G.; Kindt, R.; Legendre, P.; Minchin, P.R.; O’Hara, R.; Solymos, P.; Stevens, M.H.H.; Szoecs, E.; et al. Vegan: Community Ecology Package, R Package Version 2.6-5. 2024. Available online: https://CRAN.R-project.org/package=vegan (accessed on 1 September 2024).
  32. Wickham, H. Ggplot2: Elegant Graphics for Data Analysis; Springer: New York, NY, USA, 2016; ISBN 978-3-319-24277-4. Available online: https://ggplot2.tidyverse.org (accessed on 1 September 2024).
  33. Zhang, C.; Deng, Q.; Liu, A.; Liu, C.; Xie, G. Effects of Stand Structure and Topography on Forest Vegetation Carbon Density in Jiangxi Province. Forests 2021, 12, 1483. [Google Scholar] [CrossRef]
  34. He, X.; Zhou, C.; Lei, X.; Li, H. Stand carbon stock growth model system for Larix olgensis plantation. J. Beijing For. Univ. 2021, 43, 1–10. [Google Scholar]
  35. Li, T.; Wu, X.; Wu, Y.; Li, M. Forest Carbon Density Estimation Using Tree Species Diversity and Stand Spatial Structure Indices. Forests 2023, 14, 1105. [Google Scholar] [CrossRef]
  36. Duan, M.; Wang, G.; Shi, J.; Zhou, H. Long-term Effects of Thinning on Carbon Storage in Pinus Tabulaeformis Plantations. J. Soil Water Conserv. 2018, 32, 190–196. [Google Scholar]
  37. Liu, X.; Wang, C.; Gao, J.; Yuan, J.; Huang, Y.; Wang, B.; Peng, Y. Approaches to carbon sequestration enhancement in China’s plantation ecosystem for carbon peaking and carbon neutrality goals. Acta Ecol. Sin. 2023, 43, 5662–5673. [Google Scholar]
  38. Li, X.; Ramos, A.; Wu, D.; Lie, Z.; Xu, W.; Tang, X.; Liu, J. Carbon sequestration and storage capacity of Chinese fir at different stand ages. Sci. Total Environ. 2023, 904, 166962. [Google Scholar] [CrossRef]
  39. Denis, V. The Role of Biodiversity in Ecosystem Resilience. IOP Conf. Ser. Earth Environ. Sci. 2022, 1072, 012012. [Google Scholar]
  40. Dymond, C.; Tedder, S.; Spittlehouse, D.; Raymer, B.; Hopkins, K.; McCallion, K.; Sandland, J. Diversifying managed forests to increase resilience. Can. J. For. Res. 2014, 44, 1196–1205. [Google Scholar] [CrossRef]
  41. Dai, L.; Zhou, L.; Wu, L.; Liu, L.; Huang, Y.; Peng, T.; Qiu, J.; He, Z.; Cao, G. Carbon density and vertical spatial distribution characteristics of Cunninghamia lanceolata forest ecosystem with different stand density. Acta Ecol. Sin. 2022, 42, 710–719. [Google Scholar]
  42. Hu, H.; Luo, B.; Wei, S.; Wei, S.; Sun, L.; Luo, S.; Ma, H. Biomass carbon density and carbon sequestration capacity in seven typical forest types of the Xiaoxing’an Mountains. Chin. J. Plant Ecol. 2015, 39, 140–158. [Google Scholar]
  43. Lan, X.; Du, H.; Song, T.; Zeng, F.; Peng, W.; Liu, Y.; Fan, Z.; Zhang, J. Vegetation carbon storage in the main forest types in Guangxi and the related influencing factors. Acta Ecol. Sin. 2019, 39, 2043–2053. [Google Scholar]
  44. Chen, X.; Taylor, A.; Reich, P.; Hisano, M.; Chen, H.; Chang, S. Tree diversity increases decadal forest soil carbon and nitrogen accrual. Nature 2023, 618, 94–101. [Google Scholar] [CrossRef]
  45. Zhao, F.; Ouyang, X. Assessing relative contributions of various influencing factors to soil organic carbon in aerially–seeded Pinus massoniana plantations. Acta Ecol. Sin. 2016, 36, 2637–2645. [Google Scholar]
  46. Güner, Ş.; Güner, D. Changes in carbon stocks of soil and forest floor in black pine plantations in Turkey. J. For. Res. 2020, 32, 339–347. [Google Scholar] [CrossRef]
  47. Murdiyarso, D.; Sasmito, S.D.; Sillanpää, M.; MacKenzie, R.; Gaveau, D. Mangrove selective logging sustains biomass carbon recovery, soil carbon, and sediment. Sci. Rep. 2021, 11, 12325. [Google Scholar] [CrossRef]
Figure 1. Sample plots distribution in the study area.
Forests 16 00499 g001
Figure 2. Schematic diagram of plot layout.
Forests 16 00499 g002
Figure 3. Mantel test analysis of the coupling relationship between the forest stand state of P. massoniana forests and ecosystem C storage. Note: *** means that there is a very significant interaction between them (p < 0.001); ** means that there is a very significant interaction between them (p < 0.01); * means that there is a significant interaction between them (0.01 < p < 0.05); ns means that there is no significant interaction between them (p > 0.05).
Forests 16 00499 g003
Figure 4. CCA for relationship stand state and C storage indicators of P. massoniana forest. (a) Based on CCA, the correlation between stand state and C storage indicators. (b) Based on CCA, the ranking of stand state indicator weights.
Forests 16 00499 g004
Table 1. Basic overview of the surveyed sample plots.
IndicatorsMinMaxMax−MinMeanSDCV (%)
Stand density (trees · hm−2)43519651530987.188 387.337 39.24
Average tree height (m)11.24021.47310.23315.7382.63416.74
Average DBH (cm)11.84327.93916.09618.9054.31322.81
Shrub height (m)0.0941.3471.2530.5280.27752.53
Shrub cover (%)0.31334.45034.13713.1008.12662.03
Herb height (m)0.0691.1671.0980.4080.21452.36
Herb cover (%)0.24238.52138.27917.3178.85451.13
Table 2. Descriptive statistical analysis of the stand state and carbon storage indicators in P. massoniana forests.
ItemIndicatorsMinMaxMax−MinMeanSDCV (%)
Stand stateDBH distribution (H)0.1300.6050.4750.2070.09646.25
Tree height distribution (V)0.1020.3040.2020.1980.04120.95
Stand density (K)0.7351.0000.2650.9630.0596.09
Stand dominance (U)0.0090.6900.6810.2520.15862.66
Stand growth (B)0.5220.7400.2180.6100.0467.53
Stand health (Q)0.4121.0000.5880.8160.15919.54
Species composition (Z)0.0370.7320.6950.2980.17157.54
Species diversity (D)0.0330.7370.7040.3300.19559.03
Species evenness (P)0.0530.3510.2980.1890.08042.26
Carbon storage (t)Tree1.2978.7057.4085.3851.64730.58
Shrub0.0100.0580.0480.0330.01441.25
Herb0.0060.0700.0640.0320.01857.74
Litter0.1200.6290.5090.2900.09331.96
Soil (0–20 cm)2.2916.2513.9603.8400.95424.85
Soil (20–40 cm)1.3785.2823.9042.2030.69431.51
Soil (40–60 cm)0.7363.7883.0521.6790.61536.63
Soil (0–60 cm)4.67714.76010.0837.7232.02426.21
Total9.88019.2839.40313.4622.38217.69
Table 3. CCA axis correlation coefficients.
Stand VariablesCCA1CCA2R2p
DBH distribution (H)−0.98510.17190.18980.020 *
Tree height distribution (V)−0.94210.33540.12650.054
Stand density (K)0.83290.55350.10410.072
Stand dominance (U)0.99440.10530.05600.269
Stand growth (B)0.9493−0.31430.17480.018 *
Stand health (Q)0.97660.21520.00430.908
Species composition (Z)−0.92340.38380.04990.322
Species diversity (D)−0.88830.45920.04310.374
Species evenness (P)−0.63410.77330.01790.667
Note: * 0.01 < p < 0.05.
Disclaimer/Publisher’s Note: The statements, opinions and data contained in all publications are solely those of the individual author(s) and contributor(s) and not of MDPI and/or the editor(s). MDPI and/or the editor(s) disclaim responsibility for any injury to people or property resulting from any ideas, methods, instructions or products referred to in the content.

