Article

Accuracy of Measuring Methods of Pile Volume of Forest Harvesting Residues and Economic Impacts

1
Department of Engineering, Faculty of Forestry and Wood Technology, Mendel University in Brno, 613 00 Brno, Czech Republic
2
Department of Forest Management and Applied Geoinformatics, Faculty of Forestry and Wood Technology, Mendel University in Brno, 613 00 Brno, Czech Republic
3
Department of Forest and Wood Product Economics and Policy, Faculty of Forestry and Wood Technology, Mendel University in Brno, 613 00 Brno, Czech Republic
*
Author to whom correspondence should be addressed.
Forests 2025, 16(3), 498; https://doi.org/10.3390/f16030498
Submission received: 9 February 2025 / Revised: 3 March 2025 / Accepted: 7 March 2025 / Published: 12 March 2025
(This article belongs to the Section Forest Inventory, Modeling and Remote Sensing)

Abstract

:
The accurate measurement of logging residue volume is essential for efficient resource management and economic planning in the biomass supply chain. This study compares 3D laser scanning using a mobile ZEB-HORIZON™ scanner and conventional manual measurement with a measuring tape and staff rod. Measurements were conducted at three locations in the Czech Republic, covering a representative sample of logging residue piles. The results indicate that manual measurement systematically overestimates biomass volume by approximately 35%, leading to potential inaccuracies in biomass trade and logistics. The average conversion coefficient was 0.35 for laser scanning and 0.23 for manual measurement, confirming the higher precision of 3D scanning. Statistical analysis, including the Shapiro–Wilk test for normality and a paired t-test, confirmed that the differences between methods were statistically significant (p < 0.0001). Economic analysis suggests that adopting 3D laser scanning can enhance logistics planning, optimize transport capacities, and improve fairness in business transactions. Compared to manual measurement, laser scanning reduces measurement time by approximately two-thirds while preventing overestimation errors that can lead to discrepancies exceeding three times the actual biomass revenues. Unlike manual methods, laser scanning eliminates measurement inconsistencies caused by pile irregularities, terrain conditions, and human error. The study recommends prioritizing 3D laser scanning for measuring logging residue volumes, particularly for larger and irregularly shaped piles, and incorporating moisture content analysis in economic assessments to improve pricing accuracy and transparency.

1. Introduction

Growing concerns about climate change have led many countries to adopt ambitious targets in the field of renewable energy, with biomass playing a key role due to its availability and ability to reduce greenhouse gas emissions [1,2]. The European Union has established specific strategies to promote the use of biomass for energy purposes [3]. Recent global events, such as the COVID-19 pandemic, geopolitical conflicts, and shifts in energy policies, have highlighted the need to enhance energy security and diversify energy sources [4,5]. In this context, there is an increasing emphasis on the efficient utilization of woody biomass [6].
Logging residues represent a significant source of biomass, whose volume is often difficult to determine accurately [7]. The proper quantification of woody biomass volume is crucial for optimizing logistics processes and energy yield planning [8]. Accurately determined biomass volume enables more efficient deployment of transportation resources and minimizes economic losses [9]. Previously used manual methods are time-consuming and exhibit greater variability in results, whereas modern technologies, such as 3D laser scanning, provide higher measurement accuracy and reproducibility [10].
In recent years, there has been significant progress in biomass volume measurement methods. Modern approaches include the use of unmanned aerial vehicles (UAVs) with photogrammetric analysis, allowing for rapid and detailed measurements of woody material volume [11]. Another significant advancement is the application of advanced LiDAR technologies, which provide high measurement accuracy even in inaccessible terrain [12]. Recent studies have also demonstrated the effectiveness of combined methods, such as the integration of UAVs with LiDAR scanning, further increasing accuracy and reducing operational costs [13]. A growing number of research efforts are also focusing on automated data processing algorithms, enabling faster analysis and interpretation of results [14]. These innovative methods are increasingly being implemented in practice as they help reduce costs and enhance the efficiency of the entire biomass processing logistics chain.
This study focuses on comparing two methods for measuring the volume of logging residues intended for energy processing: modern 3D laser scanning and the traditional manual method based on measuring pile dimensions. The objective is to evaluate the accuracy, time efficiency, and economic impacts of these methods to identify the most effective approach for assessing biomass volume [11,12]. The need for accurate volume measurement of logging residues is therefore crucial for effective resource management, economic planning, and meeting the growing demand for renewable energy [10]. Traditional manual methods using measuring tapes and rods are time-consuming and prone to errors, especially with irregularly shaped biomass piles [11]. Technological advancements have introduced methods such as photogrammetry, where photo-optical systems are used for measuring stacked wood [10,12].
Laser scanning is capable of accurately capturing irregular structures, producing a very dense point cloud, and detecting details even between branches. However, it comes with high acquisition costs. Photogrammetry has lower costs and provides high-resolution textures, but it is less precise in reconstructing complex structures. It often requires a significant overlap of images, which increases data volume and makes processing more time-consuming. If accuracy is the primary concern, laser scanning is the preferable option. Additionally, when comparing the time efficiency of manual laser scanning and terrestrial photogrammetry, including data collection and processing, laser scanning performs slightly better. Laser scanning technologies, including terrestrial laser scanning (TLS) and mobile laser scanning (MLS), offer high accuracy in creating detailed 3D models of biomass piles [13,14,15].

2. Material and Methods

The research compares the actual volume of wood chips, used as a reference value, with the volumes of logging residue piles intended for energy use, measured by two different methods. The first method, 3D laser scanning using a mobile scanner, utilizes LiDAR technology to quickly and accurately create 3D models of the logging residue piles. The second method, a traditional manual measurement using a measuring tape and rods, determines the dimensions of the piles, followed by calculating their volume using geometric formulas. The results of this study allow for the evaluation of the accuracy and reliability of both methods and an assessment of their economic aspects.

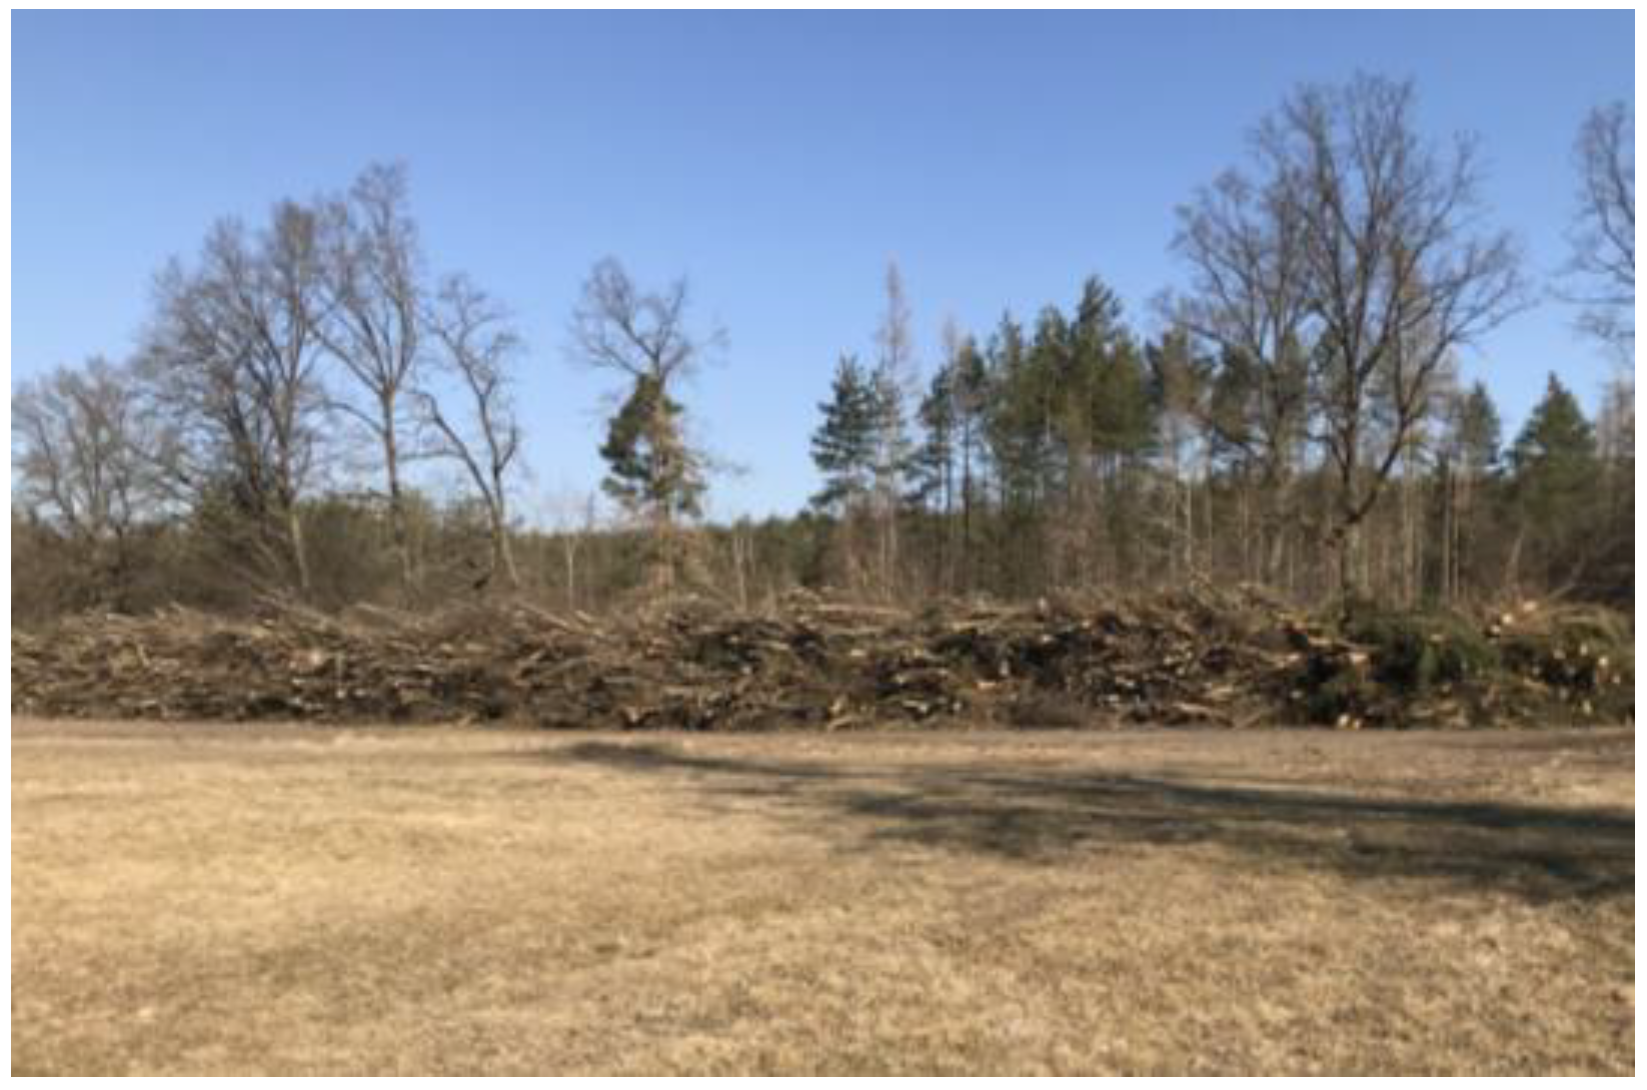
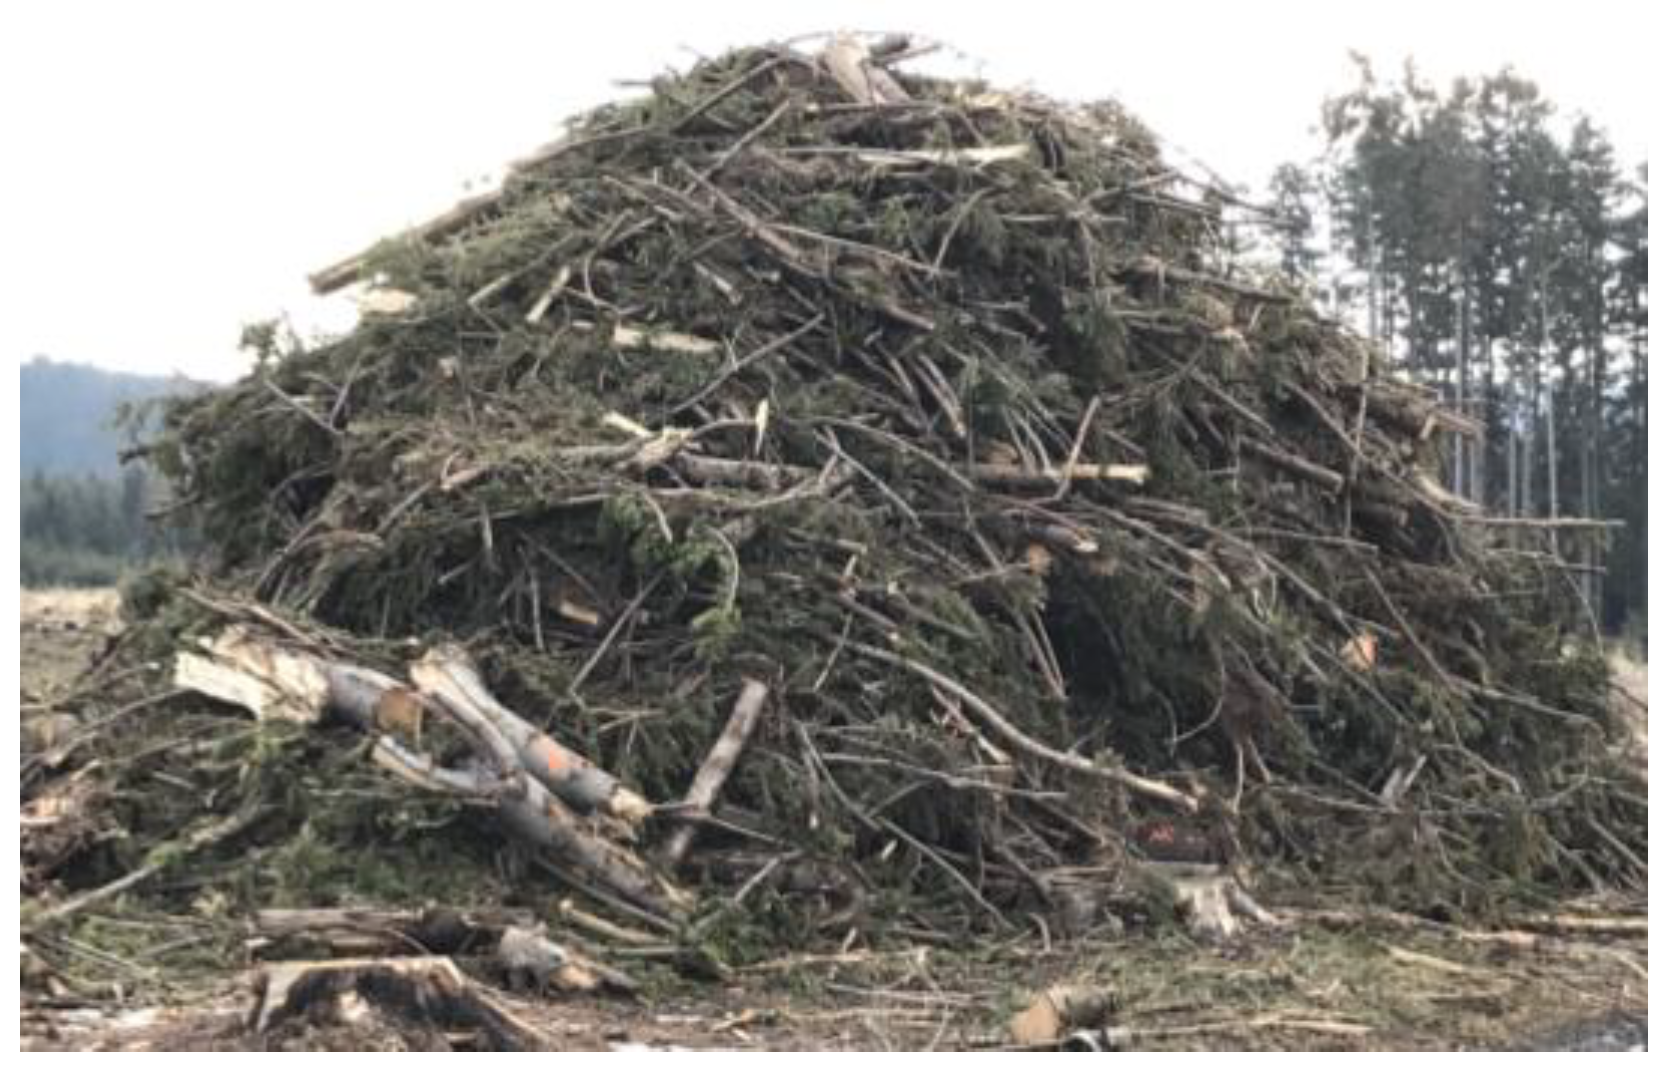
2.1. Characteristics of Sites and Identification of Logging Residues

The measurements were carried out at three locations in the Czech Republic, each with a different number of logging residue piles:
Location 1—Žďárná: Eight irregularly shaped piles, consisting mainly of branches and small wood from stands of Norway spruce (Picea abies) and Scots pine (Pinus sylvestris).
Location 2—Brodek u Prostějova (Figure 1): One large pile, approximately 100 m long, slightly curved, and irregular in both width and height. The material consisted of logging residues from broadleaved species, mainly English oak (Quercus robur) and European ash (Fraxinus excelsior).
Location 3—Boskovice (Figure 2): Three medium-sized piles, composed of branches and small wood from Norway spruce (Picea abies) and European larch (Larix decidua).
The piles consisted mainly of small branches and fine wood (non-roundwood), without the inclusion of stumps or other logging residues. The shapes of the piles were irregular, influenced by the method of material stacking and the terrain conditions. Each pile was assigned a unique identification number, which was also linked to the corresponding batch of produced wood chips.

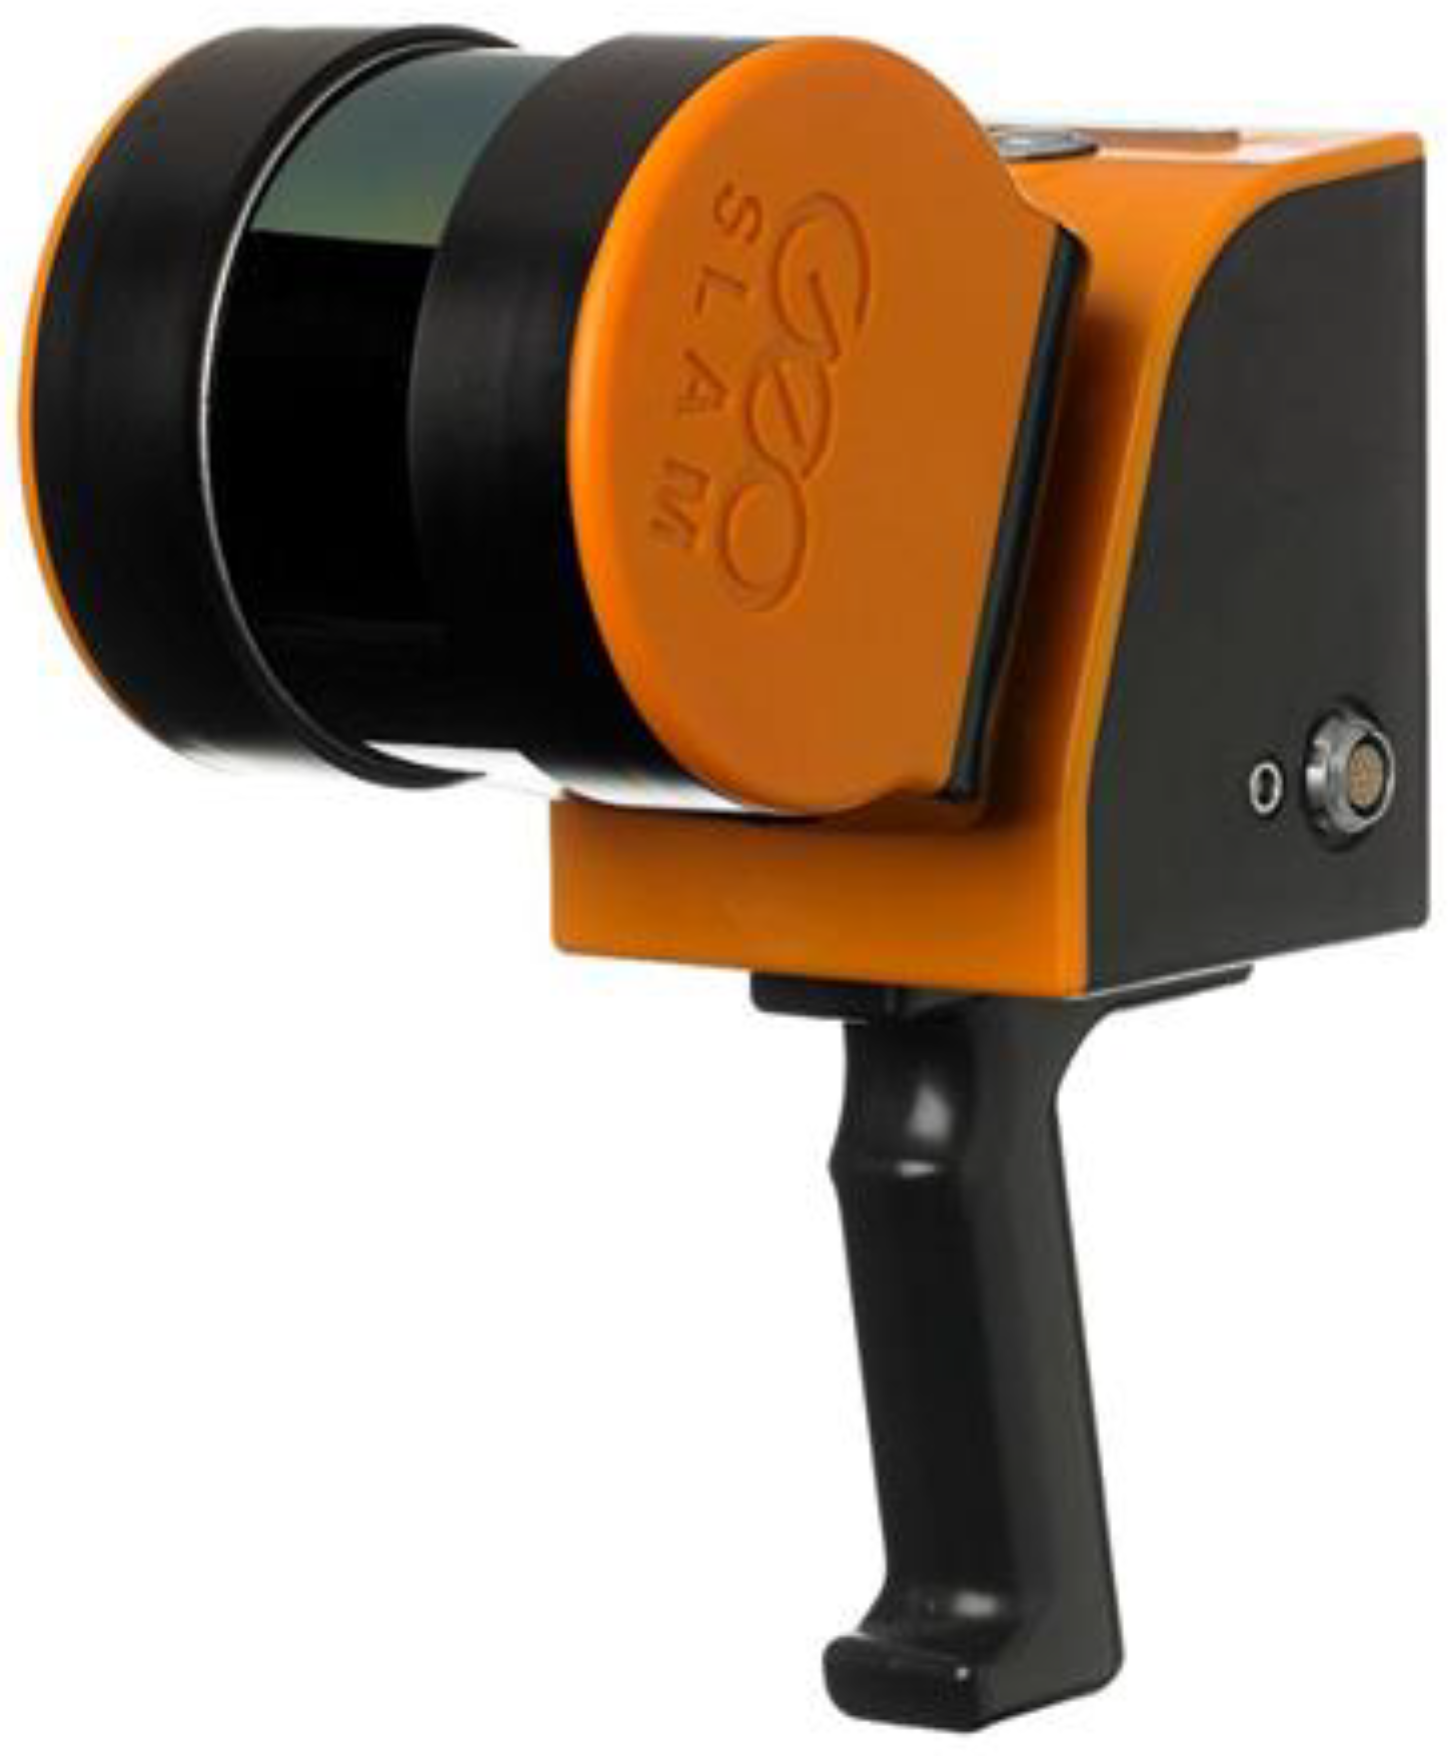
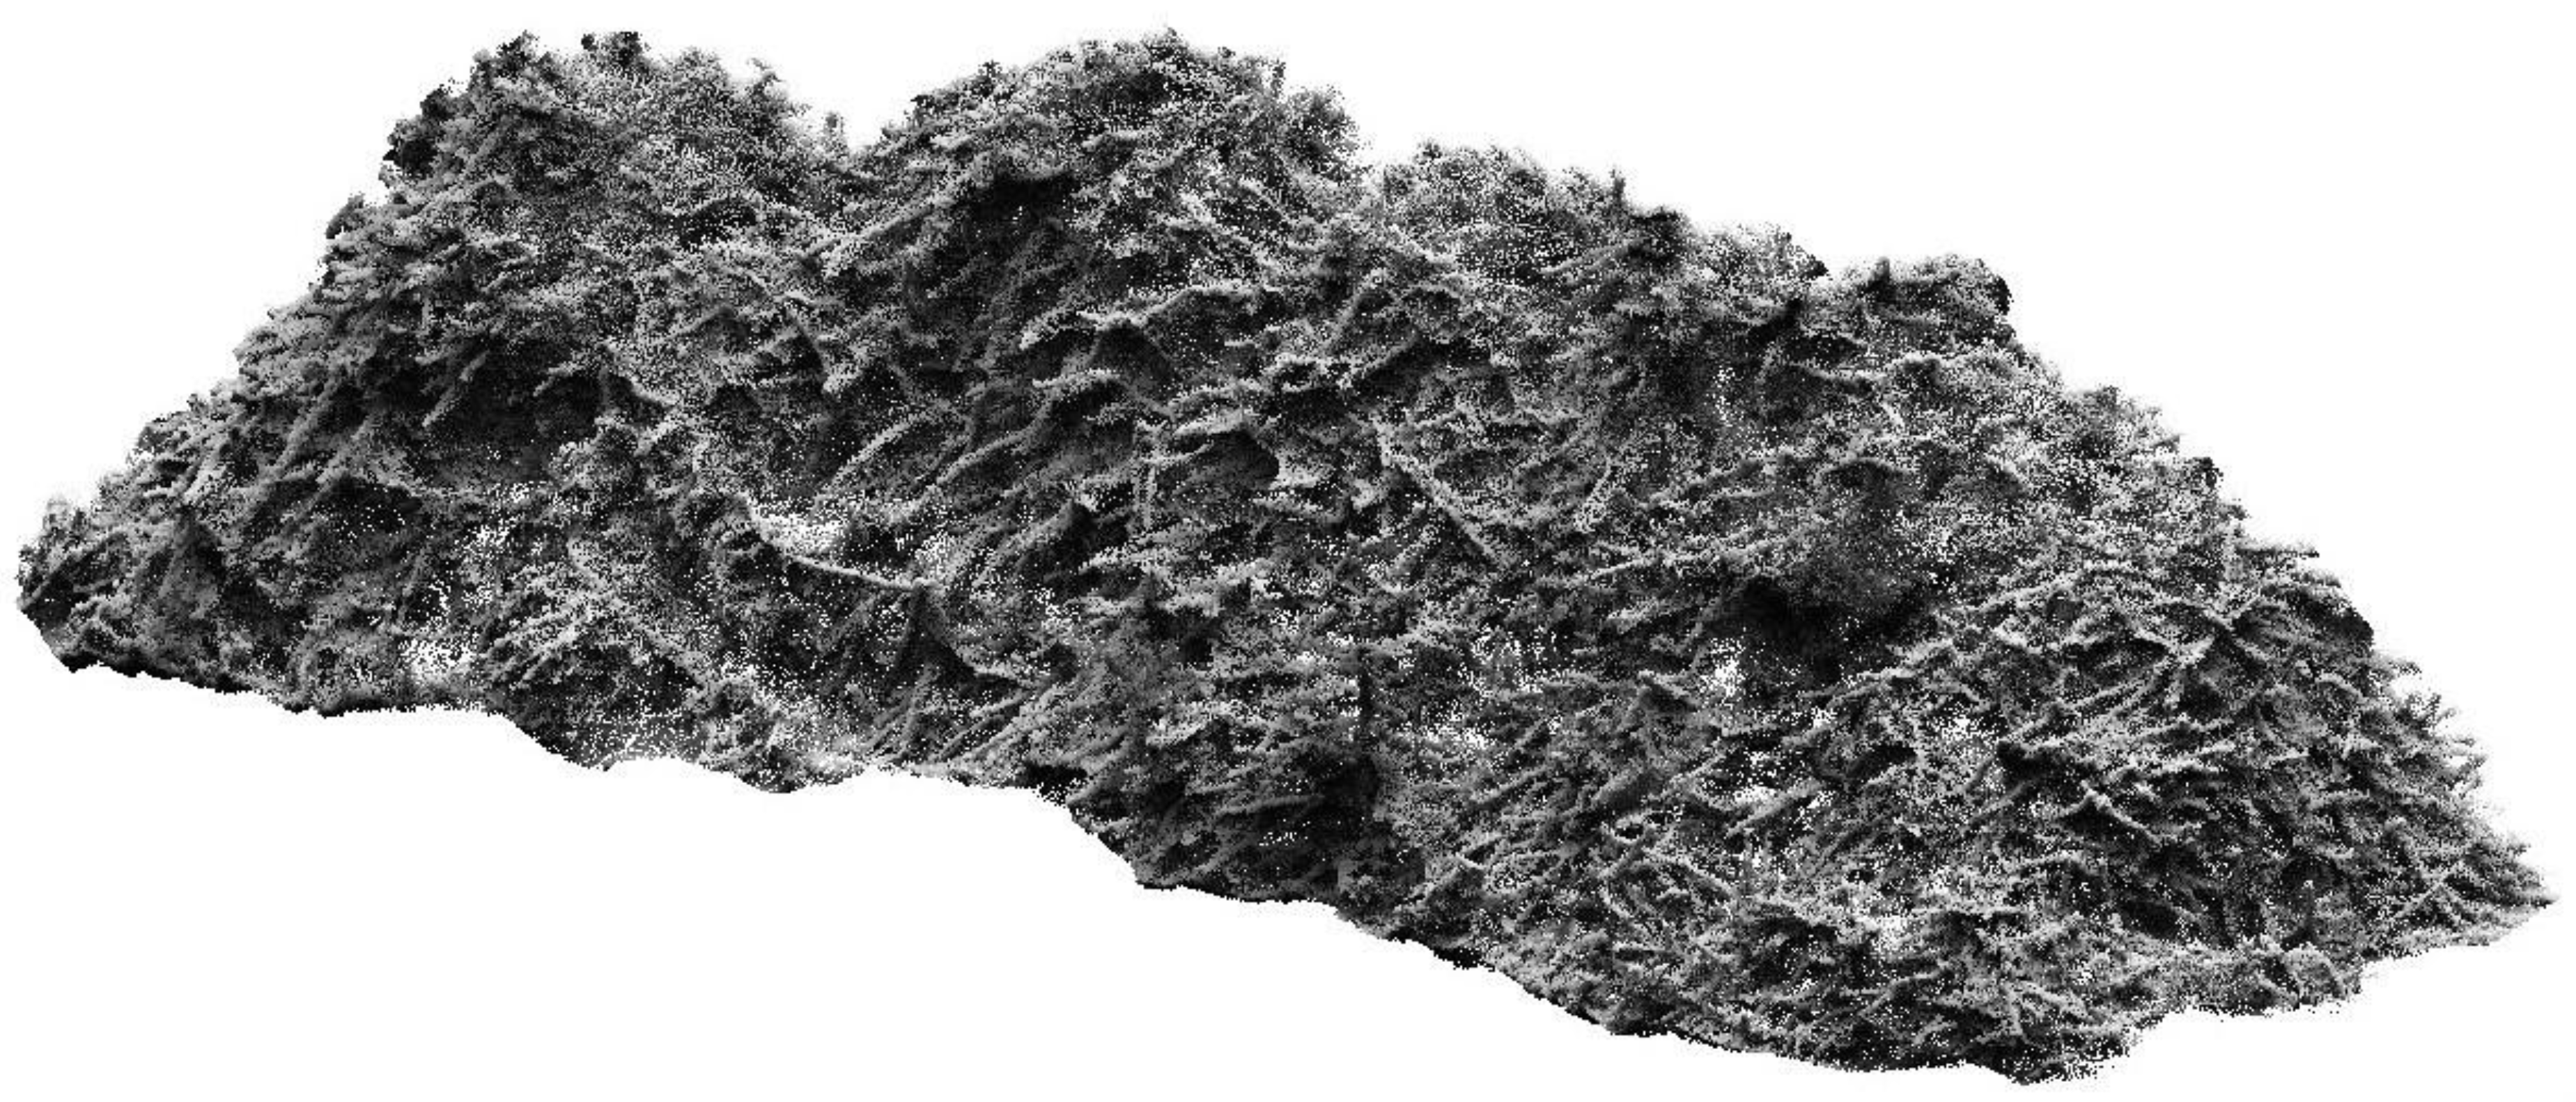
2.2. Terrestrial 3D Laser Scanning Method

For measuring the volume of the piles, the handheld mobile laser scanner ZEB-HORIZON™ (Figure 3) was used. This modern device is based on the process of 3D data collection and utilizes pulsed laser technology, LiDAR (Light Detection and Ranging), which allows for rapid data collection of the surrounding environment in the form of point clouds. These point clouds consist of hundreds of thousands to millions of points with precise spatial coordinates (x, y, z). The ZEB-HORIZON™ mobile scanner is composed of a 2D laser sensor connected to an inertial measurement unit (IMU). The rotational part of the scanner, independent of the sensor’s spatial position, determines the external angular orientation elements relative to the received coordinate reference system. The movement of the scanning head on a rotational drive ensures the capture of the third dimension required for generating 3D information.

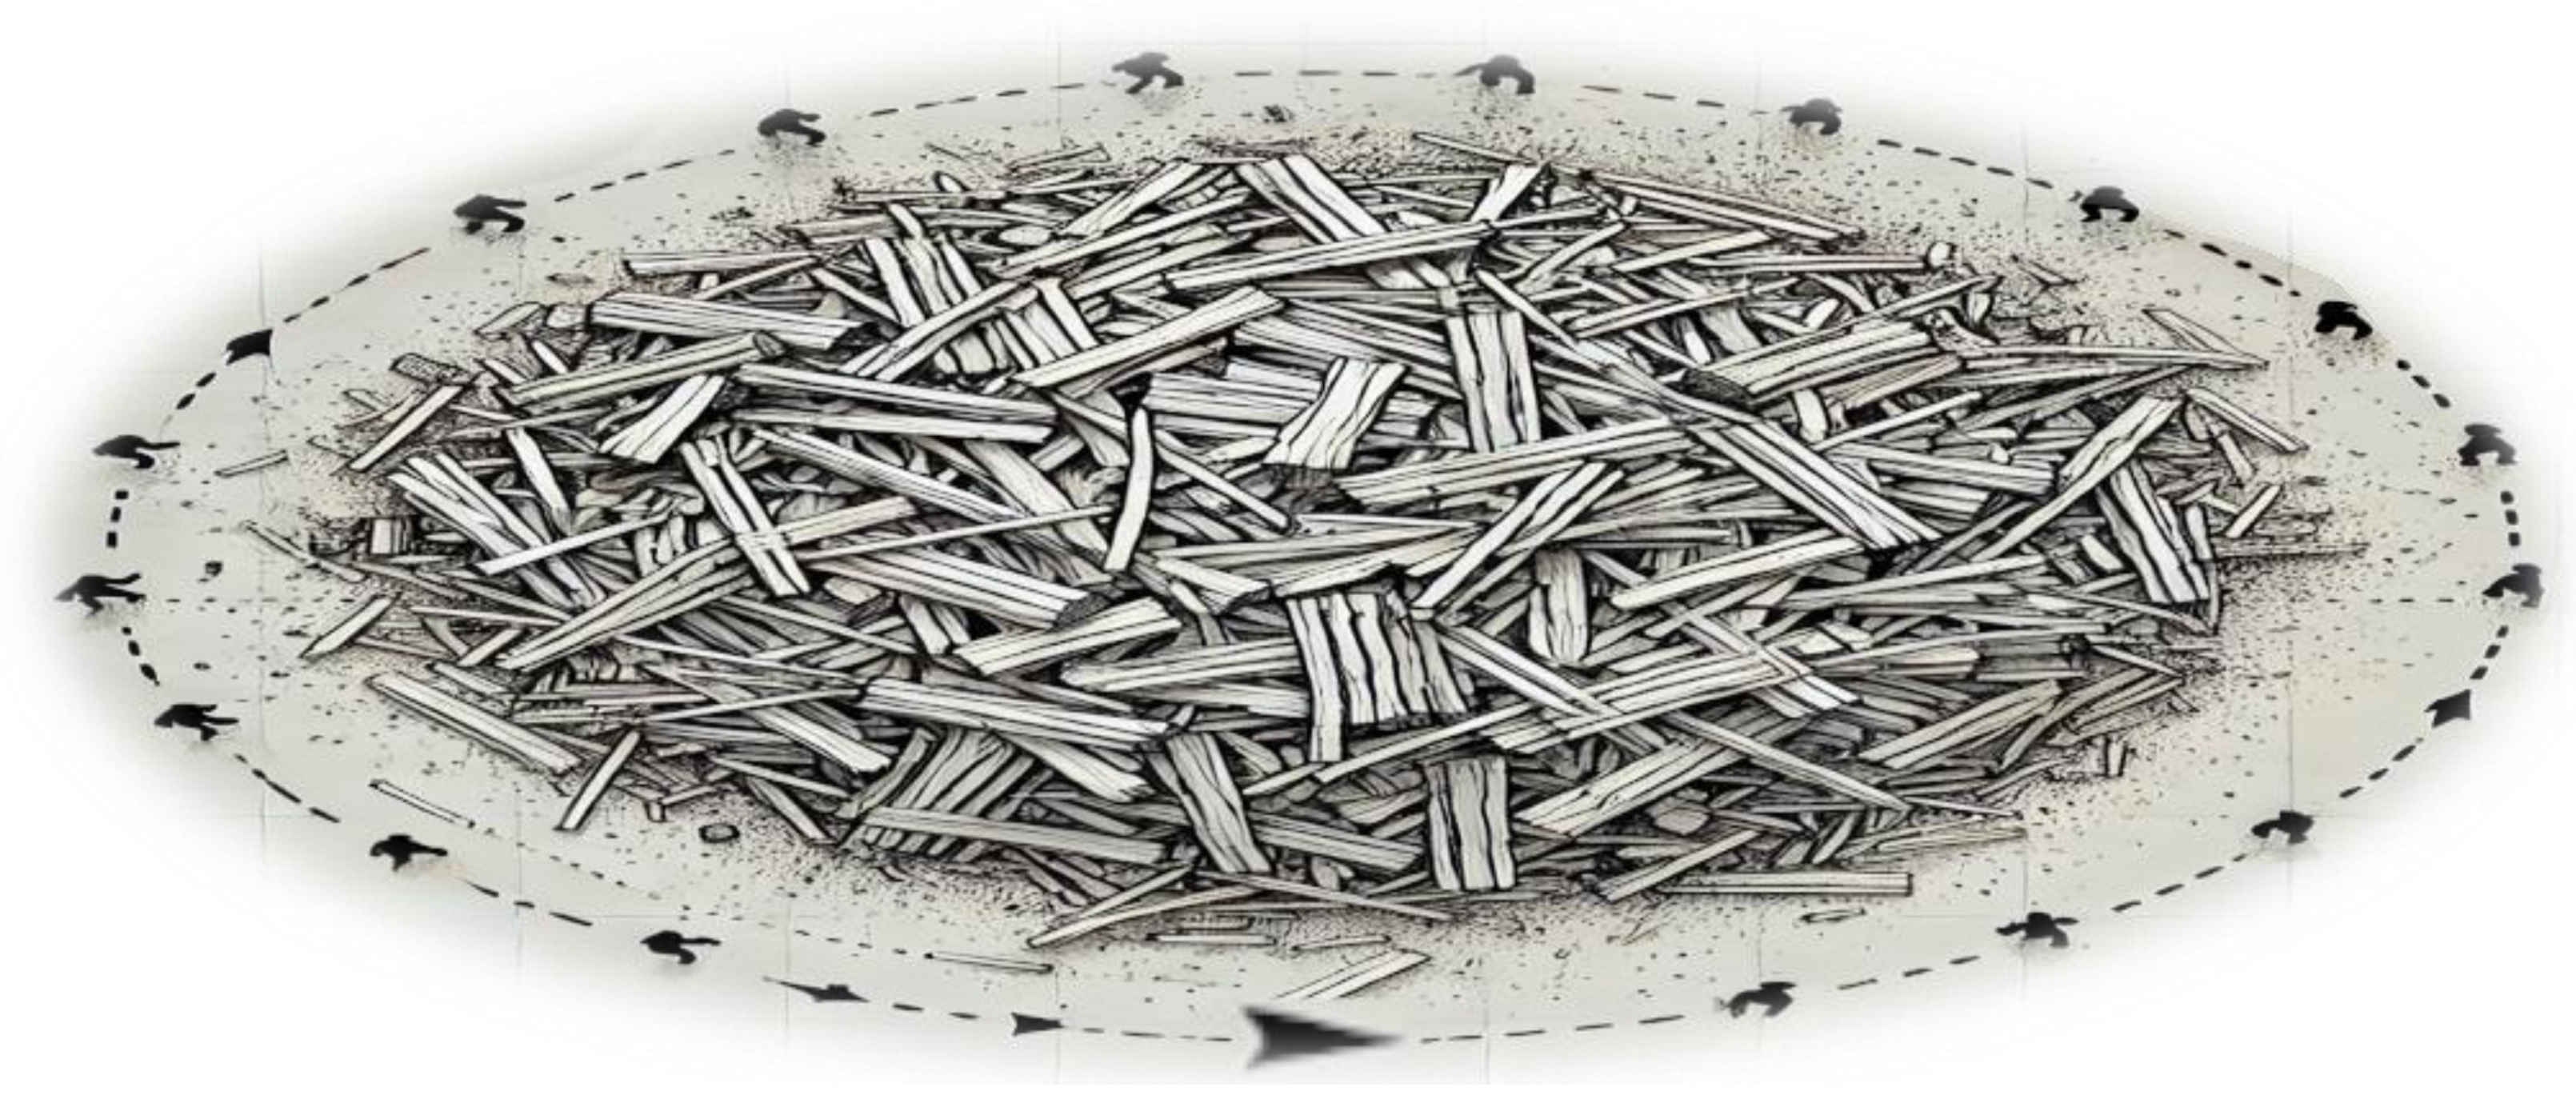
2.2.1. The Principle of 3D Modeling Technology and the Measurement Procedure

The principle of this technology lies in determining the distance from the scanned object based on calculating the speed of the reflected laser pulse and the time it takes to return after being reflected from the scanned object. The slant distance and horizontal and vertical angle of individual pulses allow for the precise determination of the spatial coordinates of individual points using the spatial polar method. With a data collection speed of 300,000 points per second, intensity information, relative accuracy of up to 6 mm, and a range of 100 m, the scanner is applicable in many fields, such as creating 2D floor plans, volume calculations, actual structure measurements, and object identification. To convert raw data into a 3D point cloud, the data must be processed using a 3D simultaneous localization and mapping (SLAM) algorithm, which combines data from 2D laser scanning with IMU data to generate accurate 3D point clouds.
To ensure accuracy, recommendations regarding route planning, distance from the object, movement speed, and thorough scanner preparation, calibration and functionality checks were followed as per the manufacturer’s manual. The operator moved around the pile at a steady pace to ensure complete coverage of the pile’s surface by laser beams. The movement trajectory was selected to minimize shadows and cover all parts of the pile. The operator started and finished the measurement at the same point, creating a closed loop (Figure 4), which improves accuracy through the SLAM algorithm.
The task of SLAM (Simultaneous Localization and Mapping) is to generate a real-time map of the surroundings based on sensor data from cameras, LiDAR, IMU, and GPS while simultaneously localizing the moving device within the generated map, thereby creating its movement trajectory. It is advisable for the operator to move in closed loops, as this improves map accuracy by aligning repeatedly measured points. The speed of the device movement influences the accuracy of the resulting point cloud. At high speeds, fewer key points necessary for the correct registration of sequentially generated point clouds are captured. However, extremely slow movement is also not ideal, as it results in an excessively large point cloud, making processing more demanding, particularly in terms of time.

2.2.2. Data Processing and Output Evaluation

The collected data were transferred to a computer and processed using the GeoSLAM Hub software v. 6.2.1, which generates a 3D point cloud model (Figure 5). For further analysis, the data were refined using CloudCompare software v. 2.13, where a 3D model of each pile was created, and its volume was calculated based on these outputs.

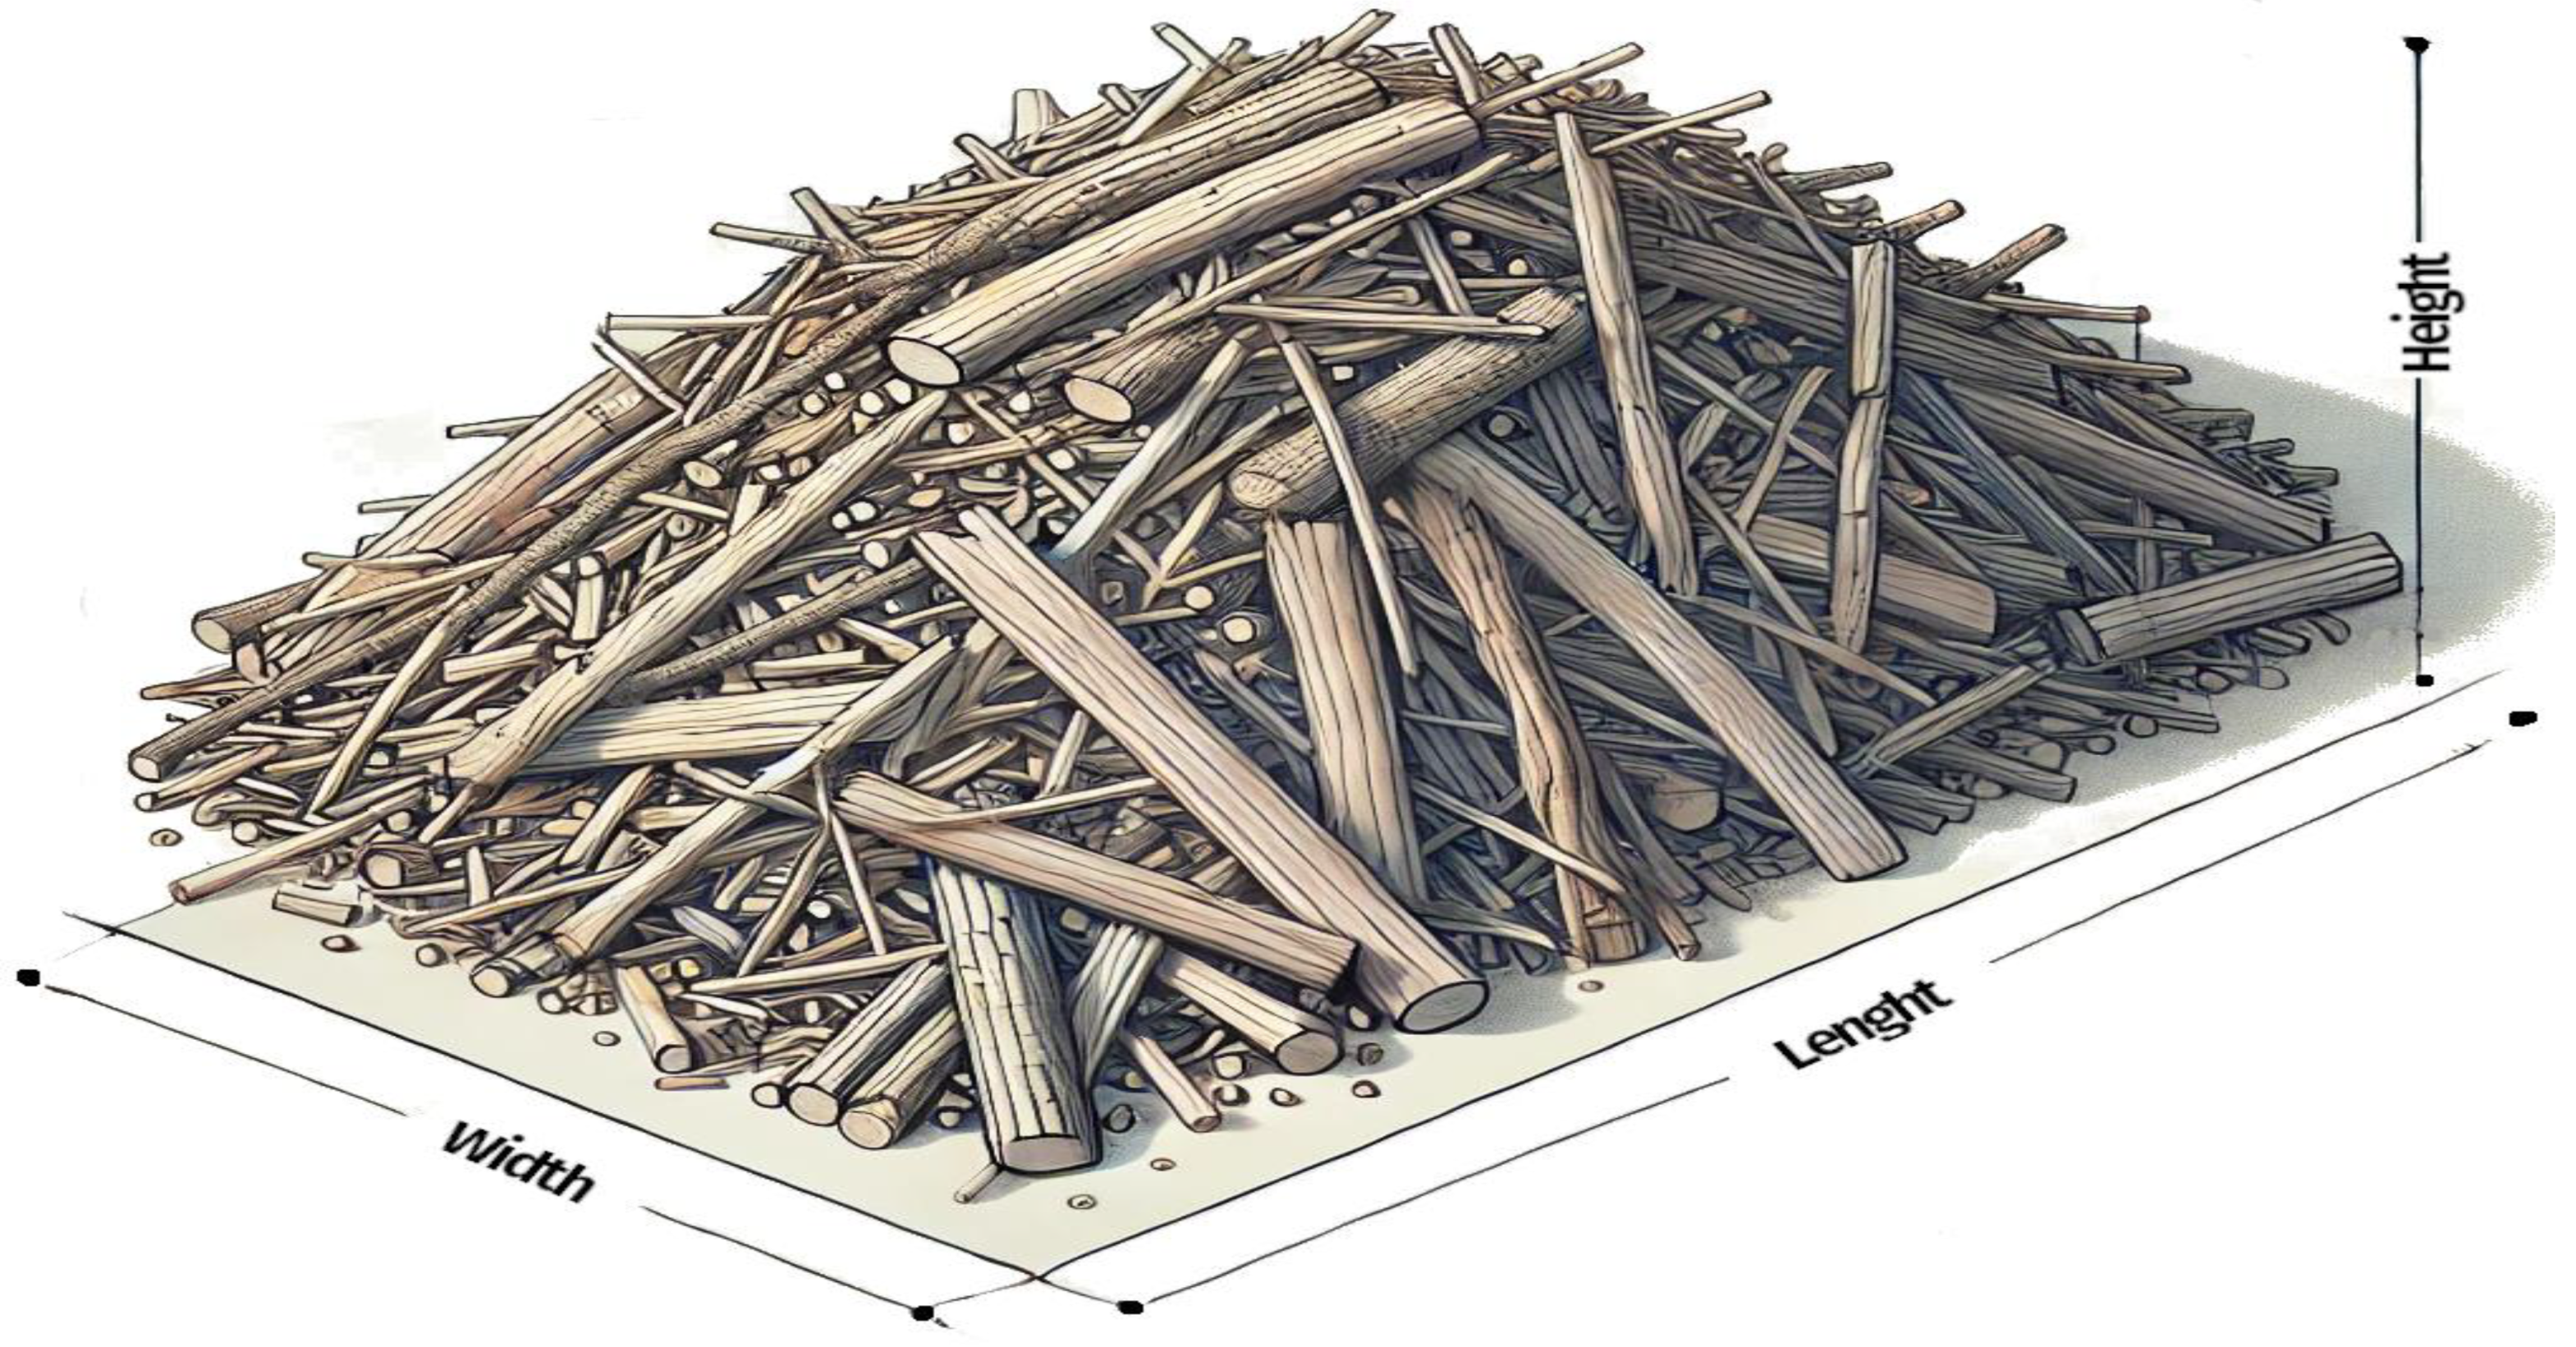
2.3. Manual Measurement Method

The principle of measurement is based on determining three key parameters: the length, width, and height of the pile (Figure 6). To measure these parameters of logging residue piles, a forestry tape is used to measure the length and width at ground level, and a measuring rod is employed to determine the height of the pile. The volume is then calculated using mathematical formulas for geometric shapes, applying a shape coefficient.
Length measurement (L)—The value of the longest axis of the logging residue pile is recorded using a forestry tape measure.
Width measurement—The width of the pile is measured perpendicular to its length at several reference points (e.g., at the beginning, middle, and end of the pile). The number of width measurements depends on the size of the pile. The average width (W) is calculated from the measured values.
W = (w1 + w2 + w3)/n
where
W—average width of the pile;
w—width of the pile at a selected point;
n—number of width measurements.
Height measurement—the height of the pile is measured with a rod from the ground level to the highest point of the pile. The number of height measurements depends on the length of the pile (e.g., every 5 m for longer piles). The average height (H) is calculated from the recorded values.
H = (h1 + h2 + h3)/n
where
H—average height of the pile;
h—height of the pile at a selected point;
n—number of height measurements.
The volume of the pile (VM) was estimated using the formula for the volume of a prism with an irregular base:
VM = L × W × H × k
where
L—maximum length of the pile;
W—average width of the pile;
H—average height of the pile;
k—shape coefficient accounting for the irregularity of the pile (for our purposes, k = 0.6).

2.3.1. Determination of the Actual Volume of Wood Chips

After measuring the volume of the piles, the logging residues from each pile were processed into wood chips. The volume of produced wood chips represents the actual processed material, providing a real indication of the biomass obtained from each pile. The calculation of the wood chip volume was carried out at the delivery site on the transport vehicle, based on the known dimensions of the cargo space (length, width, height of the load) in loose cubic meters (LCM), which is the standard unit for loose material and serves as the basis for the unit purchase/sale price of wood chips in Czechia.

2.3.2. Comparison of Methods and Calculation of Conversion Coefficients

The conversion coefficients were calculated as the ratio between the actual bulk or apparent volume of wood chips and the residue volumes obtained from both measurement methods. For each pile, three volume values were determined:
VS—volume from 3D laser scanning (m3)
VM—volume from manual measurement (m3)
VR—actual volume of produced wood chips (LCM)
Laser scanning coefficient—kS
kS = VR/VS
Manual measurement coefficient—kM
kM = VR/VM
These coefficients represent the ratio between the actual volume of produced wood chips and the volume of the biomass pile measured by each method, enabling the conversion of measured volumes to an estimate of the actual volume of wood material. A lower than one coefficient indicates that the measurement method overestimates the actual volume of wood chips that can be obtained from the biomass.

2.3.3. Statistical Verification of Data Normality

Before conducting further statistical analyses, we applied the Shapiro–Wilk (SW) test to assess the normality of the data distribution for the conversion factors kS and kM. The Shapiro–Wilk test is widely recognized for its effectiveness in evaluating normality, particularly in studies with small to moderate sample sizes. This test provides a reliable indication of whether the data follow a normal distribution, which determines the appropriateness of applying parametric or non-parametric statistical methods in subsequent analyses. The normality of the distribution of variables kS and kM was tested using the Shapiro–Wilk (SW) test. Since the data distribution was normal (p-values of the SW test were 0.8177 for kS and 0.4725 for kM, respectively), a parametric paired t-test for dependent samples was performed to compare the mean values of the coefficients kS and kM.

2.3.4. Time Measurement Methodology

To compare the efficiency of the applied measurement methods, we recorded the time required for each step of the process. The time measurements included the following:
-
Field data collection: Time required to manually measure pile dimensions and perform 3D scanning;
-
Data processing: Time spent processing the 3D point cloud and manually calculated volume;
-
Volume calculation: Computation time required for each method.
A stopwatch was used to ensure accurate time tracking, and multiple measurements were performed to minimize variability. The recorded time values were then compared statistically to determine the efficiency of the applied methods.

2.4. Assessment of Economic Aspects

Comparison of revenue differences based on wood chip volume using both measurement methods.
Estimated revenue for terrestrial 3D laser scanning:
RS = VS × P
where
RS—revenue (EUR);
VS—volume from 3D laser scanning (m3);
P—price of wood chips per 1 LCM (EUR).
Estimated revenue for manual measurement:
RM = VM × P
where
RM—revenue (EUR);
VM—volume from manual measurement (m3);
P—price of wood chips per 1 LCM (EUR).

3. Results

The main outcome of the collected data analysis is the volume of woody biomass in cubic meters, obtained using two different measurement methods: 3D laser scanning with the mobile scanner ZEB-HORIZON™ and manual measurement with a measuring tape and a pole. These volumes were compared with the actual volume of wood chips produced from the logging residues in loose cubic meters (LCM). By comparing the measured volumes of biomass piles with the actual volume of produced wood chips, conversion coefficients were calculated for each pile and each method. These coefficients allow the estimation of the actual volume of wood chips that can be obtained from the measured biomass volume.
The results of the volumes of individual piles at the selected locations, including the conversion coefficients, are presented in the tables below.
According to Table 1, a statistically significant difference was found between the mean values of coefficients kS and kM (t-value = 20.083, degrees of freedom = 11, p-value < 0.0001). The mean value of coefficient KS is 0.3629 (standard deviation = 0.0152), and the mean value of coefficient KM is 0.2411 (standard deviation = 0.0171).

3.1. Analysis of Conversion Coefficients

The average conversion coefficients across all locations were kS = 0.35 for scanner measurement and kM = 0.23 for manual measurement. This suggests that the volume measured by the scanner is generally more accurate and closer to the actual volume of produced wood chips, while manual measurement tends to overestimate the volume, leading to lower conversion coefficients. The overestimation of results in manual measurements is primarily due to the assumption of a regular shape (prism). This method does not account for rounding or tapering in irregularly shaped piles. The larger the pile, the greater the error in volume calculation.

3.2. Comparison of Potential Revenues

Table 2 provides an illustration of the potential financial impact of using different measurement methods. It calculates the total estimated value of biomass based on measured volumes and compares it with the actual revenues from the sale of produced wood chips.
The unit price P used in the calculations was obtained from the wood chip supplier based on current market data relevant to the region and the time of the study. The price of EUR 8.50 per LCM reflects the average market price of wood chips in the area. Actual prices may vary depending on factors such as the type of wood, the quality of the chips, the moisture content, and market demand.
The individual calculations provide the following results. The total volume of produced wood chips is 3150 LCM, representing actual sales revenue of EUR 26,775. The total volume of logging residues of 8807.28 m3 measured by the scanner would represent an estimated revenue of EUR 74,862. The total volume of logging residues of 13,403 m3 measured by the manual method would represent an estimated revenue of EUR 113,926. These calculations indicate that if the predictions for the expected volume and invoicing were based solely on the measured volumes of biomass piles without considering the actual yield of chips, the estimated revenues would be significantly higher than the actual revenues from the sale of produced chips.

3.3. Time Consumption of the Applied Measurement Methods

Field measurements using a handheld scanner took approximately 3–10 min, depending on the size and accessibility of individual piles. Downloading the data, basic processing, and exporting the point cloud took about 10 min. Subsequent automatic filtering of the point cloud, leaving only the points representing the surface of each pile, took approximately 3 min. Creating the mesh, determining the pile volume, and exporting the resulting 3D object (the pile’s envelope) took 2–3 min after optimizing the workflow and settings. The total data processing time for a single pile was, therefore, 18–26 min. Only one person is needed for the entire process.
The time required for traditional measurements using a measuring tape and rods in the field also depended on the size and shape of the pile. For smaller piles, the measurement time was around 5–7 min, while larger and irregularly shaped piles took up to three times longer. For larger and irregularly shaped piles, height (and sometimes width) measurements were performed at multiple points (start, middle, end) to ensure more accurate volume determination. The duration and accuracy of measurements depend on the tools used, particularly the length of the tape and rods. Precise measurements require at least two people. However, no additional data processing is required afterward, as the volume is simply calculated from the measured data, which takes about 2–3 min per pile. The total time for measurement and volume calculation using the traditional manual method for one pile is thus approximately 7–24 min.

4. Discussion

Logging residues represent a significant source of wood biomass for energy purposes [2,16,17], but their quantity is often unknown until the processing stage, which complicates their effective utilization [6]. Moreover, in certain cases, logging residues cannot be further utilized due to their disintegration directly in the forest stand. Techniques such as stump removal through grinding fall into this category [18]. Accurate estimates of the volume of logging residues biomass are crucial for various applications, including carbon stock assessment in forests, biodiversity, and environmental evaluations of logging practices [19].
In this study, we compared two methods for measuring the volume of logging residues: modern 3D laser scanning and conventional manual measurement. The results showed that manual measurements tend to overestimate biomass volume compared to laser scanning, as confirmed by statistical analysis. For the calculation of volume using the manual method, values in accordance with the recommended conversion coefficients by Wojnar et al. [20] were used. They indicate coefficients for non-roundwood, logging residues, and branches in the range of 0.57–0.63. However, the accuracy of both methods can also be influenced by the shape of the pile, the homogeneity of the material, and terrain conditions. Laser scanning provides a detailed 3D model that can better capture the irregularities of the pile’s surface. Manual measurements are more prone to inaccuracies, especially with larger and irregular piles. Logging residues are generally very irregular in shape. The manner of storage significantly influences the shape of the pile, unlike the shape of a stack of roundwood. Diverse shapes then require much more precise measurements and an appropriate coefficient for volume estimation. In practice, several basic measurement methods are used that are not demanding in terms of equipment but are relatively imprecise.
More precise measurements using the laser scanner provided higher coefficient values, indicating that this method is more suitable for estimating the actual volume of biomass. Manual measurements, which overestimate the volume, should be adjusted using lower coefficients for a more accurate estimate [7,21].

4.1. Quality of Wood Chips and Its Impact on Volume

The quality and size of wood chips affect the final volume of the load and are important for buyers [22,23]. Factors such as wood species, moisture content, fraction size, and the presence of impurities influence both the quality of the chips and their bulk density [24,25]. Accurate measurement of the volume of logging residues allows for better production planning and ensures the desired quality of the chips. The shape of logging residue piles is often irregular and influenced by the method of storage and terrain conditions [11,19]. Laser scanning provides detailed 3D models that better capture these irregularities [12,14]. In contrast, manual measurement is prone to inaccuracies, especially with larger and irregular piles, which can lead to significant deviations in volume estimates [26].

4.2. The Effect of Moisture on the Weight and Volume of Wood Chips

The moisture content of wood significantly affects its weight and energy value [8]. Accurate determination of moisture content is therefore crucial for the correct estimation of weight and, subsequently, for economic calculations related to the sale and transportation of wood chips. The ATRO weight (Absolute Total Residual Oven-Dry Weight) represents the oven-dry weight of the wood material without any moisture, while the LUTRO weight reflects the wood’s weight at its current moisture content. In our research, we utilized the LUTRO weight because it reflects the actual moisture condition of the material during processing.

4.3. Economic Impacts of Using Both Methods

The accuracy of measuring the volume of logging residues has a significant and direct impact on the economic outcomes for all parties involved in the biomass supply chain. Although laser scanning requires higher initial investments in equipment and software, it offers greater accuracy and time efficiency [27,28]. In terms of time consumption, it was found that measuring a single pile of logging residues using the laser scanning method took approximately 3 to 10 min, depending on the size of the pile, while manual measurement was significantly more time-consuming and required more labor.
Faster data collection using laser scanners allows for more piles to be processed in a shorter time, leading to savings in the logistics chain [24]. More accurate measurements also reduce the risk of financial losses due to inaccurate volume estimates, which is crucial when determining pricing and planning logistics [8]. Inaccuracies in volume estimation can lead to financial losses for one or both parties and create tension in business relationships [19].
In practice, transactions involving logging residues and wood chips are often negotiated based on different pricing structures [24,29]. However, accurate volume measurement is essential for fair price negotiations and ensuring the satisfaction of both parties. Overestimating the volume of biomass can lead to unrealistic expectations and disputes between suppliers and buyers [30].

4.4. Laser Scanning Limitations

The primary limitation of using this technology is the cost of the equipment, which amounts to hundreds of thousands of currency units. The financial burden can be reduced by purchasing the service instead of the scanner itself; however, this approach makes it difficult to respond quickly to situations (e.g., measuring at a specific time and date). Training to operate the scanner is quick and simple, but familiarity with some software (ideally a free version) for creating a 3D model is also necessary.
With the development of newer and more accurate devices, scanner prices are decreasing. The accuracy is determined by the scanner manufacturer and is steadily improving. Currently, it is also possible to use a mobile phone or tablet equipped with a built-in LiDAR and an application that generates a 3D model from the measured data in real time. This method offers significant financial savings but comes with its own limitations. However, this type of measurement was not part of this article.

4.5. Recommendations for Practice

Our study emphasizes the importance of utilizing modern technologies for measuring biomass volume in forestry. Investment in technologies such as 3D laser scanning can be worthwhile due to more accurate measurements that contribute to more efficient resource utilization and better economic outcomes [5,28]. Accurate measurement is crucial for effective resource management, optimizing logistical processes, and maintaining healthy business relationships.

5. Conclusions

This study has demonstrated that 3D laser scanning significantly outperforms manual measurement in both accuracy and reliability when estimating the volume of logging residues intended for energy utilization. Manual methods systematically overestimate biomass volume due to pile irregularities, terrain conditions, and human measurement errors. In contrast, 3D scanning provides more consistent and reproducible results, with conversion coefficients closely matching actual processed biomass volumes. More accurate volume estimates reduce logistical inefficiencies, optimize transport capacities, and enable fairer pricing between suppliers and buyers. Investing in modern measurement technologies such as 3D scanning minimizes the financial risks associated with inaccurate estimates and increases overall efficiency in the biomass supply chain. Furthermore, laser scanning does not require an additional assistant for measurements, reducing labor costs.
Based on the obtained results, we strongly recommend favoring 3D laser scanning for measuring the volume of logging residues, especially for larger and irregular piles where manual measurement exhibits higher inaccuracies. The standardization of measurement procedures and the calculation of conversion coefficients based on empirical data would improve estimation accuracy across the industry. Further investment in training and equipment necessary for the implementation of modern measurement technologies in forestry and the energy sector is highly recommended. Moreover, incorporating moisture content analysis in economic assessments would enhance pricing transparency and fairness in biomass trading.
Future studies should focus on optimizing measurement workflows by integrating automation and artificial intelligence for processing data from 3D scanning. Additionally, it is essential to investigate the influence of different wood types and environmental conditions on measurement accuracy and conversion coefficients. Developing GIS-integrated tools and mobile applications for field data collection would further enhance accessibility and usability. These advancements would contribute to the continuous improvement of biomass quantification methods, supporting both research and industry applications.

Author Contributions

Conceptualization, L.Z. and R.U.; methodology, L.Z. and M.C.; software, M.C.; validation, V.K. and T.B.; formal analysis, T.B.; investigation, T.B.; resources, V.K.; data curation, M.C.; writing—original draft preparation, L.Z.; writing—review and editing, L.Z.; visualization, V.K.; supervision, R.U.; project administration. All authors have read and agreed to the published version of the manuscript.

Funding

This research and the APC were funded by the Technology Agency of the Czech Republic, grant number FW03010019.

Data Availability Statement

All data and results therein are available in the content of the article. Additional information can be provided by the authors on request.

Acknowledgments

The authors would like to thank the company MP LESY, spol. s r.o. for granting access to their land for the purpose of conducting research activities.

Conflicts of Interest

The authors declare no conflicts of interest.

References

  1. Directive (EU) 2018/2001 of the European Parliament and of the Council of 11 December 2018 on the Promotion of the Use of Energy from Renewable Sources. Available online: https://eur-lex.europa.eu/legal-content/EN/LSU/?uri=oj%3AJOL_2018_328_R_0003 (accessed on 8 February 2025).
  2. Parikka, M. Global biomass fuel resources. Biomass Bioenergy 2004, 27, 613–620. [Google Scholar] [CrossRef]
  3. Zervos, A.; Lins, C.; Muth, J.; Smith, E. Re-Thinking 2050: A 100% Renewable Energy Vision for the European Union; European Renewable Energy Council (EREC): Brussels, Belgium, 2010. [Google Scholar]
  4. Brown, M.W. Evaluation of the Impact of Timber Truck Configuration and Tare Weight on Payload Efficiency: An Australian Case Study. Forests 2021, 12, 855. [Google Scholar] [CrossRef]
  5. Moskalik, T.; Tymendorf, Ł.; van der Saar, J.; Trzciński, G. Methods of Wood Volume Determining and Its Implications for Forest Transport. Sensors 2022, 22, 6028. [Google Scholar] [CrossRef] [PubMed]
  6. Clauser, N.M.; Felissia, F.E.; Area, M.C.; Vallejos, M.E. A framework for the design and analysis of integrated multi-product biorefineries from agricultural and forestry wastes. Renew. Sust. Energy Rev. 2021, 139, 110687. [Google Scholar] [CrossRef]
  7. Gałęzia, T. Energy balance and time-consumption of selected components in technological chain of forest biomass harvesting. Sylwan 2013, 157, 419–424. [Google Scholar]
  8. Han, S.-K.; Murphy, G. Trucking productivity and costing model for transportation of recovered wood waste in Oregon. For. Prod. J. 2011, 61, 552–560. [Google Scholar] [CrossRef]
  9. Sadowski, J.; Moskalik, T.; Zastocki, D.; Wrona, T. Selected Economic and Natural Aspects of Management of Logging Residues, Studies and Materials CEPL in Rogów. 2012, pp. 246–253. Available online: https://agro.icm.edu.pl/agro/element/bwmeta1.element.agro-7bbc38f4-d356-424b-b484-ba6619d7c6c8 (accessed on 8 February 2025).
  10. Jodłowski, K.; Moskalik, T.; Tomusiak, R.; Sarzyński, W. The Use of Photo-Optical Systems for Measurement of Stacked Wood. In Proceedings of the From Theory to Practice: Challenges for Forest Engineering, Warsaw, Poland, 4–7 September 2016; Department of Forest Utilization, Warsaw University of Life Sciences-SGGW: Warsaw, Poland, 2016; p. 306. [Google Scholar]
  11. Simanov, V.; Rozdíly v Evidovaném Objemu dříví. Lesnická práce. 2003. 2/3. [In Czech]. Available online: https://lesprace.cz/casopis-lesnicka-prace-archiv/rocnik-92-2013/lesnicka-prace-c-7-13/tezba-drivi (accessed on 8 February 2025).
  12. Knyaz, V.A.; Maksimov, A.A. Photogrammetric Technique for Timber Stack Volume Contol. Int. Arch. Photogramm. Remote Sens. Spat. Inf. Sci. 2014, 40, 157–162. [Google Scholar]
  13. Siekański, P.; Magda, K.; Malowany, K.; Rutkiewicz, J.; Styk, A.; Krzesłowski, J.; Kowaluk, T.; Zagórski, A. On-Line Laser Triangulation Scanner for Wood Logs Surface Geometry Measurement. Sensors 2019, 19, 1074. [Google Scholar] [CrossRef]
  14. Zemánek, T.; Cibulka, M.; Pelikán, P.; Skoupil, J. The use of terrestrial laser scanning for determining the driver’s field of vision. Sensors 2017, 17, 2098. [Google Scholar] [CrossRef]
  15. Zvěřina, L.; Cibulka, M.; Staněk, L.; Ulrich, R. Analysis of Field View from Tractor and Trailer Units Using the Method of Terrestrial Laser Scanning. Forests 2022, 13, 1383. [Google Scholar] [CrossRef]
  16. Kupčák, V. Dendromass Potential for Energy in the Conditions of Forest-Timber Branch of the Czech Republic and the Forestry. Intercathedra. 2009. sv. 25, č. 1, s. 68--72. ISSN 1640-3622. Available online: https://1library.net/article/v%C3%A1clav-kup%C4%8D%C3%A1k-intercathedra-annual-scientific-bulletin-economic-departme.zg33e08q (accessed on 8 February 2025).
  17. Staněk, L.; Zvěřina, L.; Ulrich, R.; Pavlíková, E.A. A Unique Grubbing Head Prototype forEnvironmentally Friendly and Sustainable Stump Removal. Forests 2022, 13, 1515. [Google Scholar] [CrossRef]
  18. Staněk, L.; Hamřík, T.; Košulič, O. Effect of age structure and management typeon epigeic arthropods in commercial oak forests. Zpráv. Lesn. Výzk. 2020, 65, 265–27533. [Google Scholar]
  19. Korboulewsky, N.; Bilger, I.; Bessaad, A. How to Evaluate Downed Fine Woody Debris Including Logging Residues? Forests 2021, 12, 881. [Google Scholar] [CrossRef]
  20. Wojnar, T. ; Doporučená Pravidla pro měření a Třídění dříví v České Republice; Lesnická Práce: Kostelec nad Černými lesy., Czech Republic, 2007; ISBN 978-80-87154-01-4. [Google Scholar]
  21. Janák, K. Differences in Round Woodmeasurements Usingelectronic 2D and 3Dsystems and Standardmanual Method. Drv. Industija. 2007, 53, 127–133. [Google Scholar]
  22. Plankenbühler, T.; Kolb, S.; Grümer, F.; Müller, D.; Karl, J. Image-based model for assessment of wood chip quality and mixture ratios. Processes 2020, 8, 728. [Google Scholar] [CrossRef]
  23. Schön, C.; Kuptz, D.; Mack, R.; Zelinski, V.; Loewen, A.; Hartmann, H. Influence of wood chip quality on emission behaviour in small-scale wood chip boilers. Biomass Convers. Biorefinery 2019, 9, 71–82. [Google Scholar] [CrossRef]
  24. Spinelli, R.; Eliasson, L.; Han, H.S. A critical review of comminution technology and operational logistics of wood chips. Curr. For. Rep. 2020, 6, 210–219. [Google Scholar] [CrossRef]
  25. Wataniyakul, P.; Boonnoun, A.T.P.; Quitain, M.; Sasaki, T.; Kida, N.; Laosiripojana, A. Shotipruk. Preparation of hydrothermal carbon as catalyst support for conversion of biomass to 5-hydroxymethylfurfural. Catal. Commun. 2018, 104, 41–47. [Google Scholar] [CrossRef]
  26. Borz, S.A.; Morocho Toaza, J.M.; Forkuo, G.O.; Marcu, M.V. Potential of Measure App in Estimating Log Biometrics: A Comparison with Conventional Log Measurement. Forests 2022, 13, 1028. [Google Scholar] [CrossRef]
  27. Houshfar, E.; Løvås, T.; Skreiberg, Ø. Experimental investigation on NOx reduction by primary measures in biomass combustion: Straw, peat, sewage sludge, forest residues and wood pellets. Energies 2012, 5, 270–290. [Google Scholar] [CrossRef]
  28. Moskalik, T.; SarzyĹ, W.; Zastocki, D. Efficiency of slash bundling in mature coniferous stands. Sci. Res. Essays 2013, 8, 1478–1486. [Google Scholar] [CrossRef]
  29. Olsson, B.A.; Hannrup, B.; Jönsson, M.; Larsolle, A.; Nordström, M.; Mörtberg, U.; Rudolphi, J.; Strömgren, M. A decision support model for individual tree stump harvesting options based on criteria for economic return and environmental protection. Scand. J. For. Res. 2017, 32, 246–259. [Google Scholar] [CrossRef]
  30. Hagan, J.M.; Grove, S.L. Coarse woody debris: Humans (and nature competing for trees. J. For. 1999, 97, 6–11. [Google Scholar] [CrossRef]
Figure 1. The pile at the Brodek site.
Forests 16 00498 g001
Figure 2. One of the piles at the Boskovice site.
Forests 16 00498 g002
Figure 3. Handheld mobile scanner ZEB-HORIZON™ (GeoSLAM Ltd., Nottingham, UK).
Forests 16 00498 g003
Figure 4. Sample of the operator’s movement trajectory around the pile during scanning.
Forests 16 00498 g004
Figure 5. Visual representation of the 3D point cloud model of one of the piles in the Boskovice site.
Forests 16 00498 g005
Figure 6. Schematic diagram of the measured parameters of the pile.
Forests 16 00498 g006
Table 1. Results of biomass pile volume measurements by both methods at all sites.
Site
Pile
No.
Volume of Biomass (m3)Coefficients
Scanner
ZEB Horizon
VS
Manual
Measurement *
VM
Wood Chips (LCM)
VR
kSkM
1.1388.904961350.350.27
1.2952.0814553550.370.24
1.3306.254791100.360.23
1.4142.11220550.390.25
1.5419.246621450.350.22
1.6267.674051000.370.25
1.7119.45172450.380.26
1.8918.7314933350.360.22
2.12390.1538328400.350.22
3.1438.087041600.370.23
3.21066.0816244000.380.25
3.31398.5418614700.340.25
Mean Value 0.36290.2411
Standart Deviation 0.01520.0171
* k—shape coefficient accounting for the irregularity of the pile (for our purposes, k = 0.6).
Table 2. Comparison of volume measurement methods in terms of potential financial revenues.
SiteScanner ZEB HorizonManual MeasurementWood Chips
VS (m3)RS (EUR)VM (m3)RM (EUR)VR (LCM)Revenues R (EUR)
Žďárná3514.4329,873538245,7471 28010,880
Brodek2390.1520,316383232,5728407140
Boskovice2902.7024,673418935,60710308755
Total8807.2874,86213,403113,926315026,755
Disclaimer/Publisher’s Note: The statements, opinions and data contained in all publications are solely those of the individual author(s) and contributor(s) and not of MDPI and/or the editor(s). MDPI and/or the editor(s) disclaim responsibility for any injury to people or property resulting from any ideas, methods, instructions or products referred to in the content.

