Article

Early- and Latewood vs. Stem Asymmetry: Which Is More Important for Dendrochemistry in Scots Pine?

by
Vladimir L. Gavrikov
1,*,
Alexey I. Fertikov
1,
Ruslan A. Sharafutdinov
1 and
Eugene A. Vaganov
1,2
1
School Ecology and Geography, Siberian Federal University, 660041 Krasnoyarsk, Russia
2
Institute for Forest, Siberian Branch of Russian Academy of Sciences, 660036 Krasnoyarsk, Russia
*
Author to whom correspondence should be addressed.
Forests 2025, 16(3), 493; https://doi.org/10.3390/f16030493
Submission received: 13 January 2025 / Revised: 27 February 2025 / Accepted: 4 March 2025 / Published: 11 March 2025

Abstract

:
For dendrochemical research, it may be important to be aware of the effects of stem asymmetry and the intra-ring structure because these may introduce unwanted dispersion in the results. In dendrochemical studies, separate analysis of the elemental content of early- and latewood is rare. Also, explanations of how the elemental content may relate to stem asymmetry originating from conditions at the edges of contrasting environments are largely lacking in these studies. The purpose of the current study was to estimate the impact of the seasonal tree ring structure and stem asymmetry on the distribution of elements in tree stems. The study population was a plantation of Scots pine (Pinus sylvestris L.) at an afforestation experiment area, with the sample trees being at the edge of the stand, causing strong crown asymmetry. Six pine trees were cored through the thickness from the maximal crown side (max-side) to the minimal crown side (min-side), and the cores were subsequently scanned through an Itrax Multiscanner unit. The count rates of aluminum (Al), silicon (Si), phosphorus (P), sulfur (S), chlorine (Cl), calcium (Ca), iron (Fe), copper (Cu), zinc (Zn), and strontium (Sr) in the tree rings from 1990 to 2022 were analyzed. A group of elements (Al, Si, P, S, and Cl) tended to consistently concentrate on the min-side, both in early- and latewood, the difference being most significant for S and Cl. Regarding early- vs. latewood, Al, Si, P, S, Cl, Cu, and Zn always had lower concentration in earlywood than in latewood, while others (Ca, Fe, and Sr) had lower concentrations in latewood, the relations being consistently significant. Overall, the role of the min- or max-side of the stem in allocation of elements appears to have been weaker that the intra-ring structure (early- and latewood). Some elements such as Al, Si, P, S, Cl, and Ca (in latewood) were often more abundant on the min-side; other elements such as Fe and Sr (in latewood) were often more abundant on the max-side, but these relations were significant only on rare occasions. Intra-ring heterogeneity (in early- and latewood) appears to be more decisive than the asymmetry of the tree stem in regard to the distribution of elements in Scots pine xylem. Nevertheless, tree stems with high and obvious asymmetry should be more extensively explored because a possibility remains that extreme asymmetry does impact the allocation of elements.

1. Introduction

Studies of elemental contents in tree rings can elucidate quite a number of processes from the past, including recent periods. Traditionally, tree ring studies have been linked to research into climatology. In particular, the chemical analysis of tree rings (dendrochemistry) has been applied in attempts to discover climatic traces of ancient volcanic eruptions [1,2]. Because tree rings can store information about environmental chemistry, particularly regarding pollutants, dendrochemical approaches have been applied in the fields of documenting environmental pollution, forensics, and similar fields [3,4,5,6,7,8,9,10].
In order to be able to study year-on-year elemental variations in tree rings, a powerful tool is required to provide data with annual or even intra-annual resolution. Such a tool is X-ray fluorescent analysis (XRF), which was developed based on the discoveries of X-ray radiation and the X-ray spectra of various elements. The XRF method came into broad application after the 1950s, especially in the field of nuclear reactor control [11].
In the second half of the 20th century, partly owing to the XRF method, dendrochemical studies grew steadily in terms of number, topic, and coverage of species. Binda et al. [12] and Canning et al. [13] have provided comprehensive analyses of the literature. From these reviews, a couple of gaps in the area of dendrochemistry may be inferred. One gap is that distinct separation of earlywood and latewood in tree rings is seldom found among the studies. An exception is the research by Hevia et al. [1] on Pinus uncinata Ramond ex DC. This research demonstrated that the majority of elements included in their study were allocated differently depending on whether they were found in early- or latewood. Other authors have shown that some important elements give a consistent and vivid picture of elemental allocation in these contrasting types of tree ring wood. For example, a sharp peak of calcium (Ca) can be observed in earlywood and then, at the beginning of latewood, it reaches its minimum (see, e.g., refs. [14,15]).
Another gap is a lack of consideration of the interactions of elements in tree xylem. Tree rings are a compound medium and their chemistry is not limited to inorganics but is largely controlled by the synthesis and transformations of large organic molecules. The best known organic substances in xylem are cellulose, hemicellulose, lignin, pentosans, and pectins [16]. Due to the importance of the organic content of wood (especially lignin) for the pulp industry, the organic composition of wood has been, and remains, a focus of wood research [17,18,19]. Organic substances are not uniformly distributed between early- and latewood, and this has been shown in several studies [20,21,22]. Furthermore, some of the substances are either acidic in nature or contain groups (active centers) with acidic properties. Thus, theoretically, metal ions may attach to these groups and thereby contribute to the inorganic content of the xylem.
Gavrikov et al. [23] considered a hypothesis that various metal ions may participate in a sort of replacement relation depending on their ionic radii and ionization potential. Several elements show similar patterns across tree rings, with some of them reaching minima in earlywood and others in latewood. Observations of some pairs of elements have shown that the content of one of the elements in the pair falls at a disproportionately stronger rate in minimum range, which may be due to the replacement of one element with the other. Hypothetically, of two different metal elements, the ion will preferably attach to an active center that has a smaller radius and higher ionization potential. Supposedly, a small ion can more easily penetrate into large organic molecules and attach to the active centers within them. If the ionization potential is high, it may prevent replacement by other ions with lower ionization potential. The input of energy is required due to the difference in ionization potential between the ions in the pair.
One cannot immediately observe the translocation of elemental atoms inside the wooden medium. Researchers have to apply indirect methods to understand the observed allocation of elements. The ratios of elemental content in different parts of a tree ring may serve as such a method. However, such an approach can only be successful if the elements involved demonstrate a significant degree of consistency in their distribution across the tree rings. It has been shown [24] that several elements (Al, Si, P, S, Cl, Cu, and Zn) have consistent maxima in latewood and consistent minima in earlywood. Other elements (Ca, Fe, and Sr), on the contrary, have consistent minima in latewood and maxima in earlywood. Meanwhile, there is another group of elements that show no consistent pattern across tree rings (K, Ti, Mn, and Hg).
The distinction between early- and latewood is not the only factor that may alter the distribution of elements in a tree’s wood. The stem shape itself is another factor that might influence how the elements move and are allocated within the wood. If a tree grows in a dense stand that has undergone self-thinning, its surroundings are expected to be relatively uniform, as the closest competitors are no longer present. However, geographical directions (e.g., North–South) that result in differences in illumination still play a role. As shown in a previous study [24], the general pattern of elemental allocation in tree rings (earlywood and latewood) remains more or less consistent regardless of direction (North or South). In this particular case, however, the sampled trees had uniform surroundings and displayed no visible signs of developmental asymmetry.
A completely different situation arises at the edge of a forest stand, where one side of a tree faces inward toward the stand and the opposite side faces an open space. Given these environmental conditions, substantial crown and stem cross-sectional asymmetry is expected in developing trees, potentially influencing the distribution of elements.
The purpose of this study was to estimate the impact of seasonal tree ring structure and stem asymmetry on the distribution of elements in the tree stem. Thus, the current study aims to answer the following questions:
(i)
Between the seasonal structure of a tree ring (early- and latewood) and stem asymmetry, which factor is more decisive for elemental allocation?
(ii)
Are the ratios of elements between early- and latewood significantly different in trees experiencing contrasting environmental conditions on opposite sides of the tree stem?
The answers to these questions are primarily sought from the perspective of consistency. This means that an effect found in an individual sample tree should ideally be repeated in all other sample trees. The more consistent the effect of a factor, the more decisive it is for elemental allocation in stem wood.

2. Materials and Methods
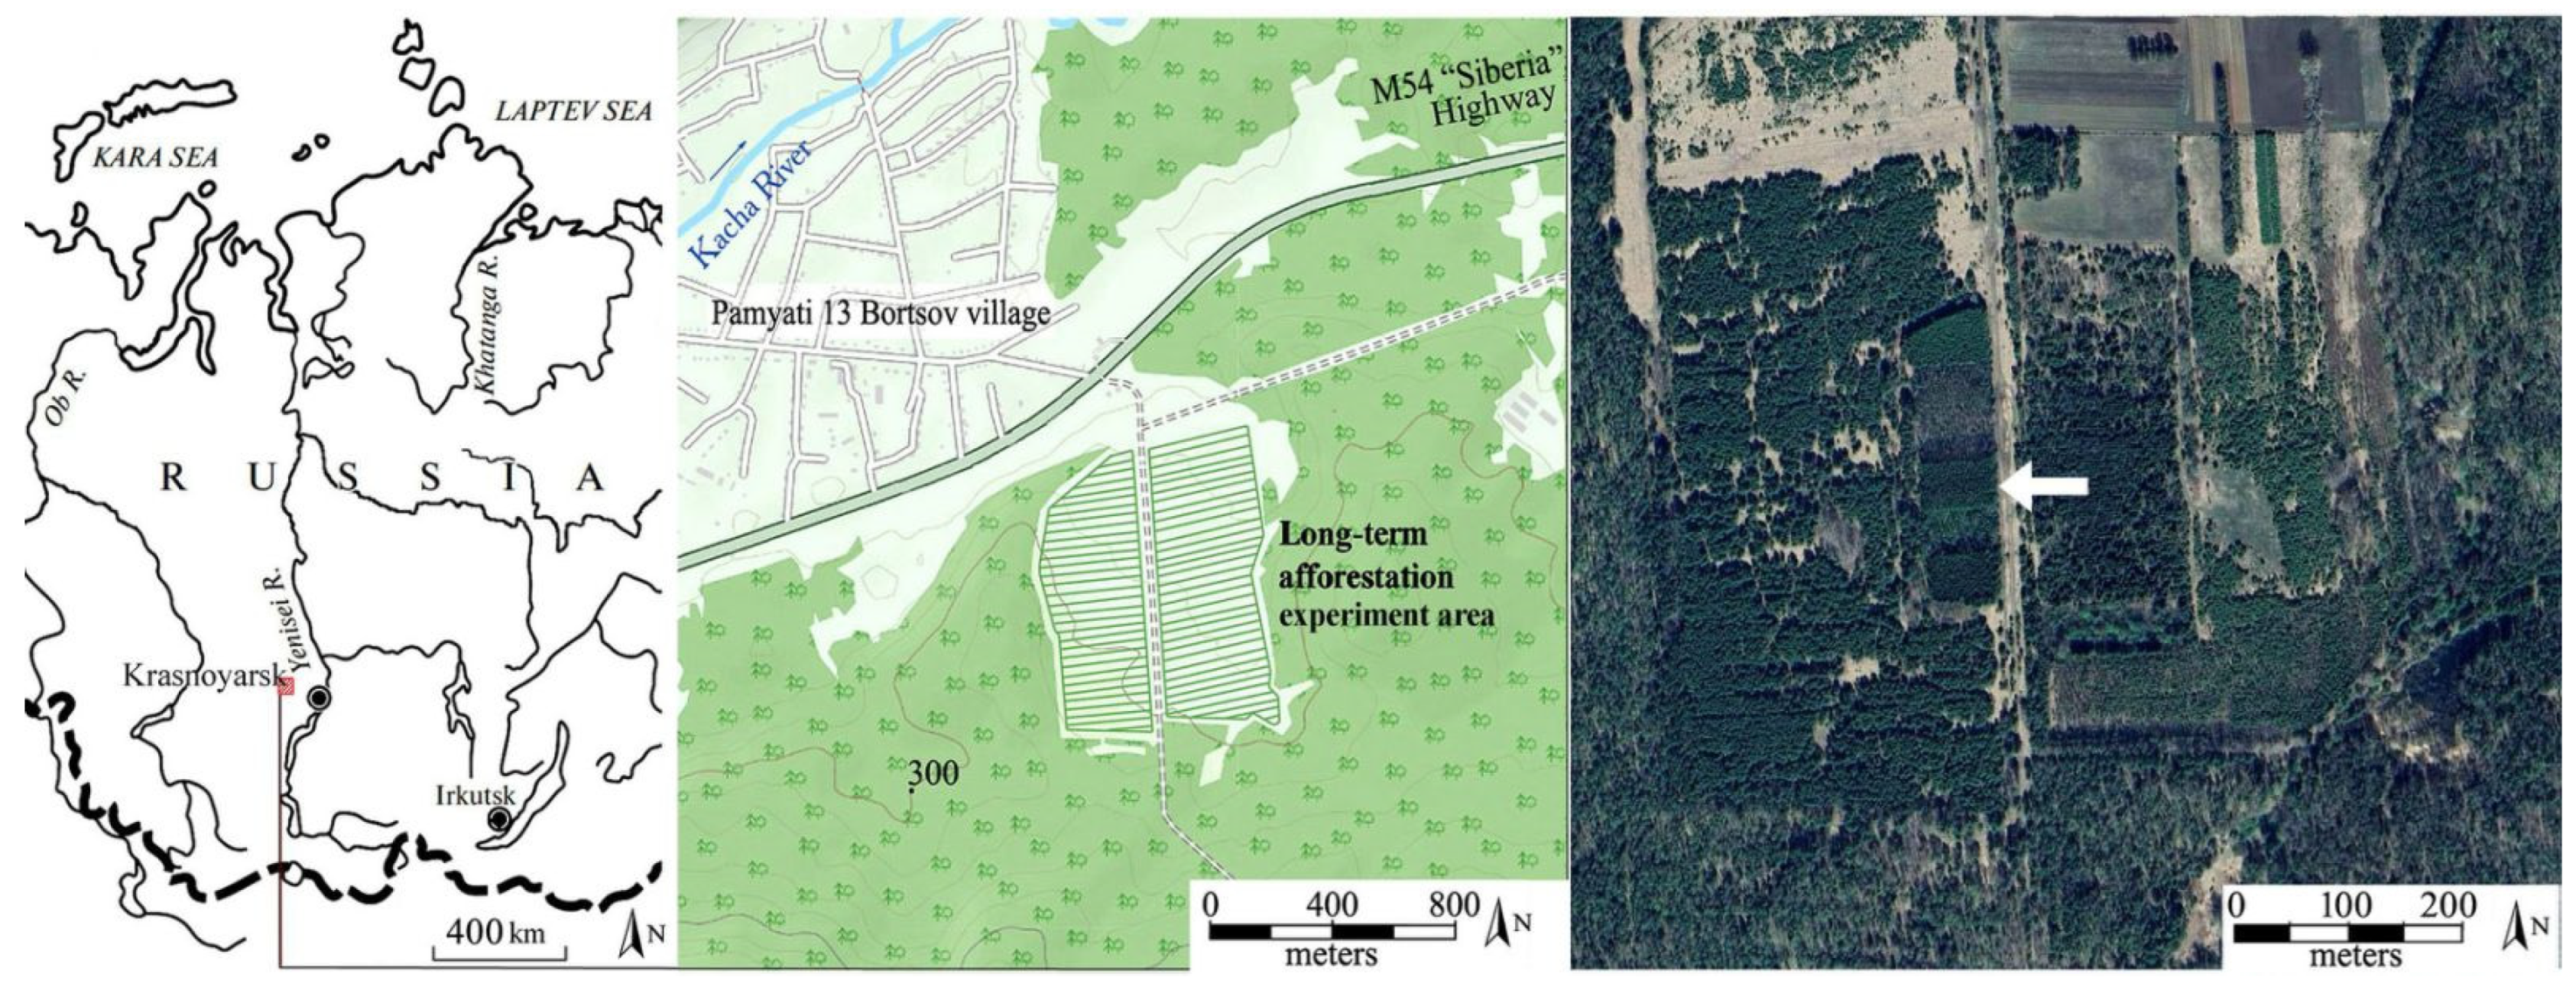
2.1. Area of Study

In 1971–1972, a team of soil scientists from the Institute for Forest SB RAS established a long-term afforestation experiment about 50 km away from Krasnoyarsk city (Russian Federation) (Figure 1). The GPS coordinates of the area are 56°12′8.49″ N 92°20′48.97″ E. The scientists planted the trees as 2–3-year-old seedlings on an area with a homogenized soil cover. The initial density of planting was approximately 40,000 seedlings per hectare. For the planting, the list of species included several important Siberian tree species, including Scots pine (Pinus sylvestris L.). The history, design of the experiment, and some results obtained have been published multiple times [25,26].

2.2. Experimental Design, Sampling

According to the objectives of the study, the sample trees were selected at the edge of Scots pine section of the afforestation experiment (Figure 1, right). An approximately 5–7-m-wide roadway constitutes the only open space present on the eastern edge. It is followed by a shunted wood that cannot cast a shadow on the Scots pine section.
On this edge, six healthy pines growing in the outmost row were selected as sample trees. The trees have asymmetrical crowns due to obvious edge effect (Figure 2). The number of trees sampled was determined by a few circumstances. On the one hand, there is a limited number of trees at the edge of the Scots pine section, which is approximately ca. 40 m long. Some of the trees have defects, while others are crooked. Thus, to avoid a source of unwanted dispersion, only undoubtedly healthy trees without visible defects were included in the sample. On the other, the current research is not an isolated study. The results are always compared with the results of earlier studies with other sampled trees, e.g., refs. [23,24], and the current study is the next step in a sequence of dendrochemical studies.
The side of the tree facing the open space has the most developed crown; therefore, this side is denoted as max-side for brevity. The side of the tree facing inward toward the stand has the least developed crown and, therefore, this side is denoted as min-side.
From these sample trees, cores were taken by a 12 mm Haglöf borer (Haglöf Sweden AB, Långsele, Sweden) at breast height (Figure 3a). For each tree, the core was taken through its full thickness, from the bark of the max-side to the bark of the min-side. For each of the six trees, therefore, two cores were taken for analysis, one from the max-side and one from the min-side, resulting in a total of twelve cores. The cores were taken in late August 2023.

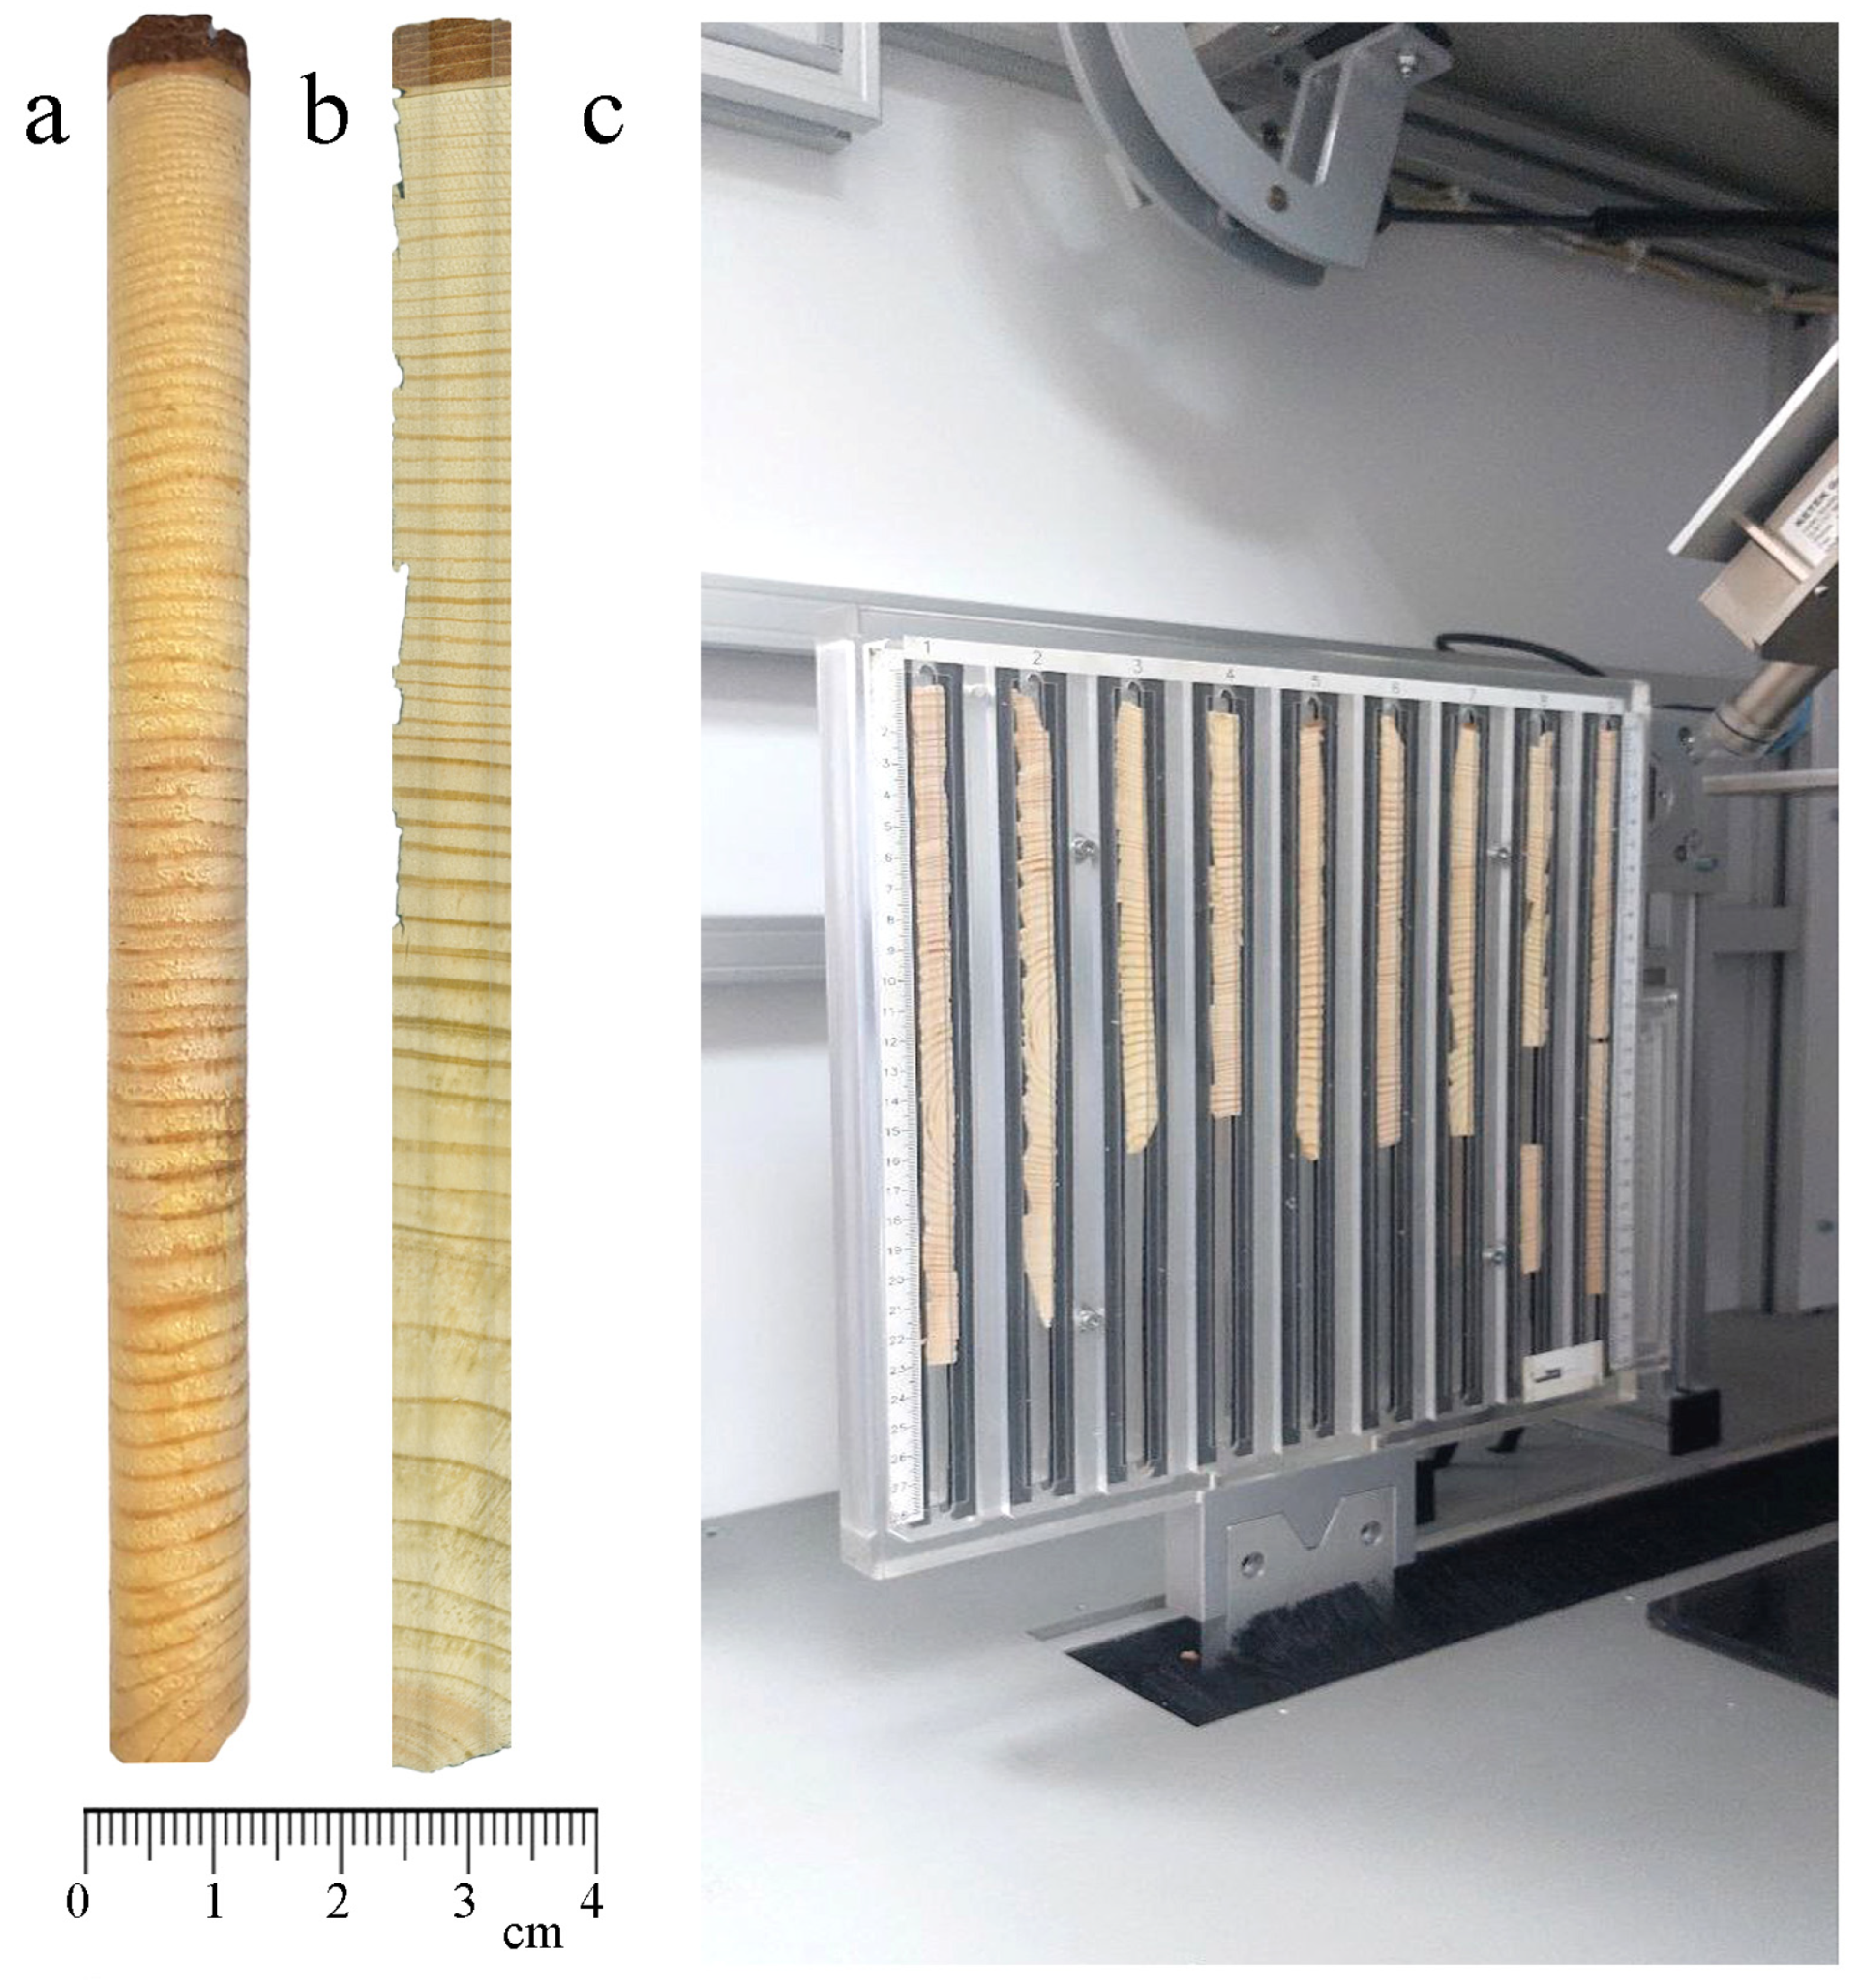
2.3. Treatment and the X-Ray Scanning of the Cores

The following procedure was applied to estimate the elements’ distribution in tree rings across the tree stem.
The cores were transported to the laboratory and air-dried for at least one week. As usual, thin slices (1–1.1 mm thick) were extracted from the cores perpendicular to the wood grain (see Figure 3b). According to the method, only one full-sized slice can be extracted from a core. This is the reason why large (12 mm diameter) core borers are used in this type of research.
The wooden slices were scanned using an Itrax Multiscanner (COX Analytical Systems, Mölndal, Sweden) coupled with Multi Scanner Navigator software (version 6.5.3.) (Figure 3c). The unit detects fluorescent radiation emitted by atoms using a silicon drift detector (SDD; Ketek GmbH, München, Germany). The collimator system of the SDD allows for the registration of X-ray emissions from a 0.05 × 2 mm spot. The spatial resolution of scanning (the distance between the discreet scanning points) was 100 µm.
The analyzed elements included aluminum (Al), silicon (Si), phosphorus (P), sulfur (S), chlorine (Cl), calcium (Ca), iron (Fe), copper (Cu), zinc (Zn), and strontium (Sr). These elements were selected based on a previous study [24], which demonstrated their consistent allocation pattern in earlywood and latewood.
X-ray fluorescent analysis (XRF) is a relative method of elemental analysis. The quantitative results, expressed as “counts per second” (cps), are derived from the mathematical processing of the instrument’s software. These counts are relative units and may vary depending on the instrument parameters; they are not directly equivalent to SI units of elemental concentration. However, when analyzing samples with identical chemical composition (e.g., pine wood), the counts reflect relative differences in elemental content within the specimen [27].
In this study, the primary parameter analyzed was the number of counts per scanning point. While this does not represent true elemental concentration in the classical chemical sense, it serves as a proxy under methodological constraints. Therefore, the terms “concentration” and “content” are used conventionally in the text, with acknowledgement of their distinction from standard chemical terminology.
The instrument also generates X-ray images of the specimens, enabling visual separation and dating of tree rings. A total of 33 tree rings per tree side, corresponding to growth years from 1990 to 2022, were analyzed.

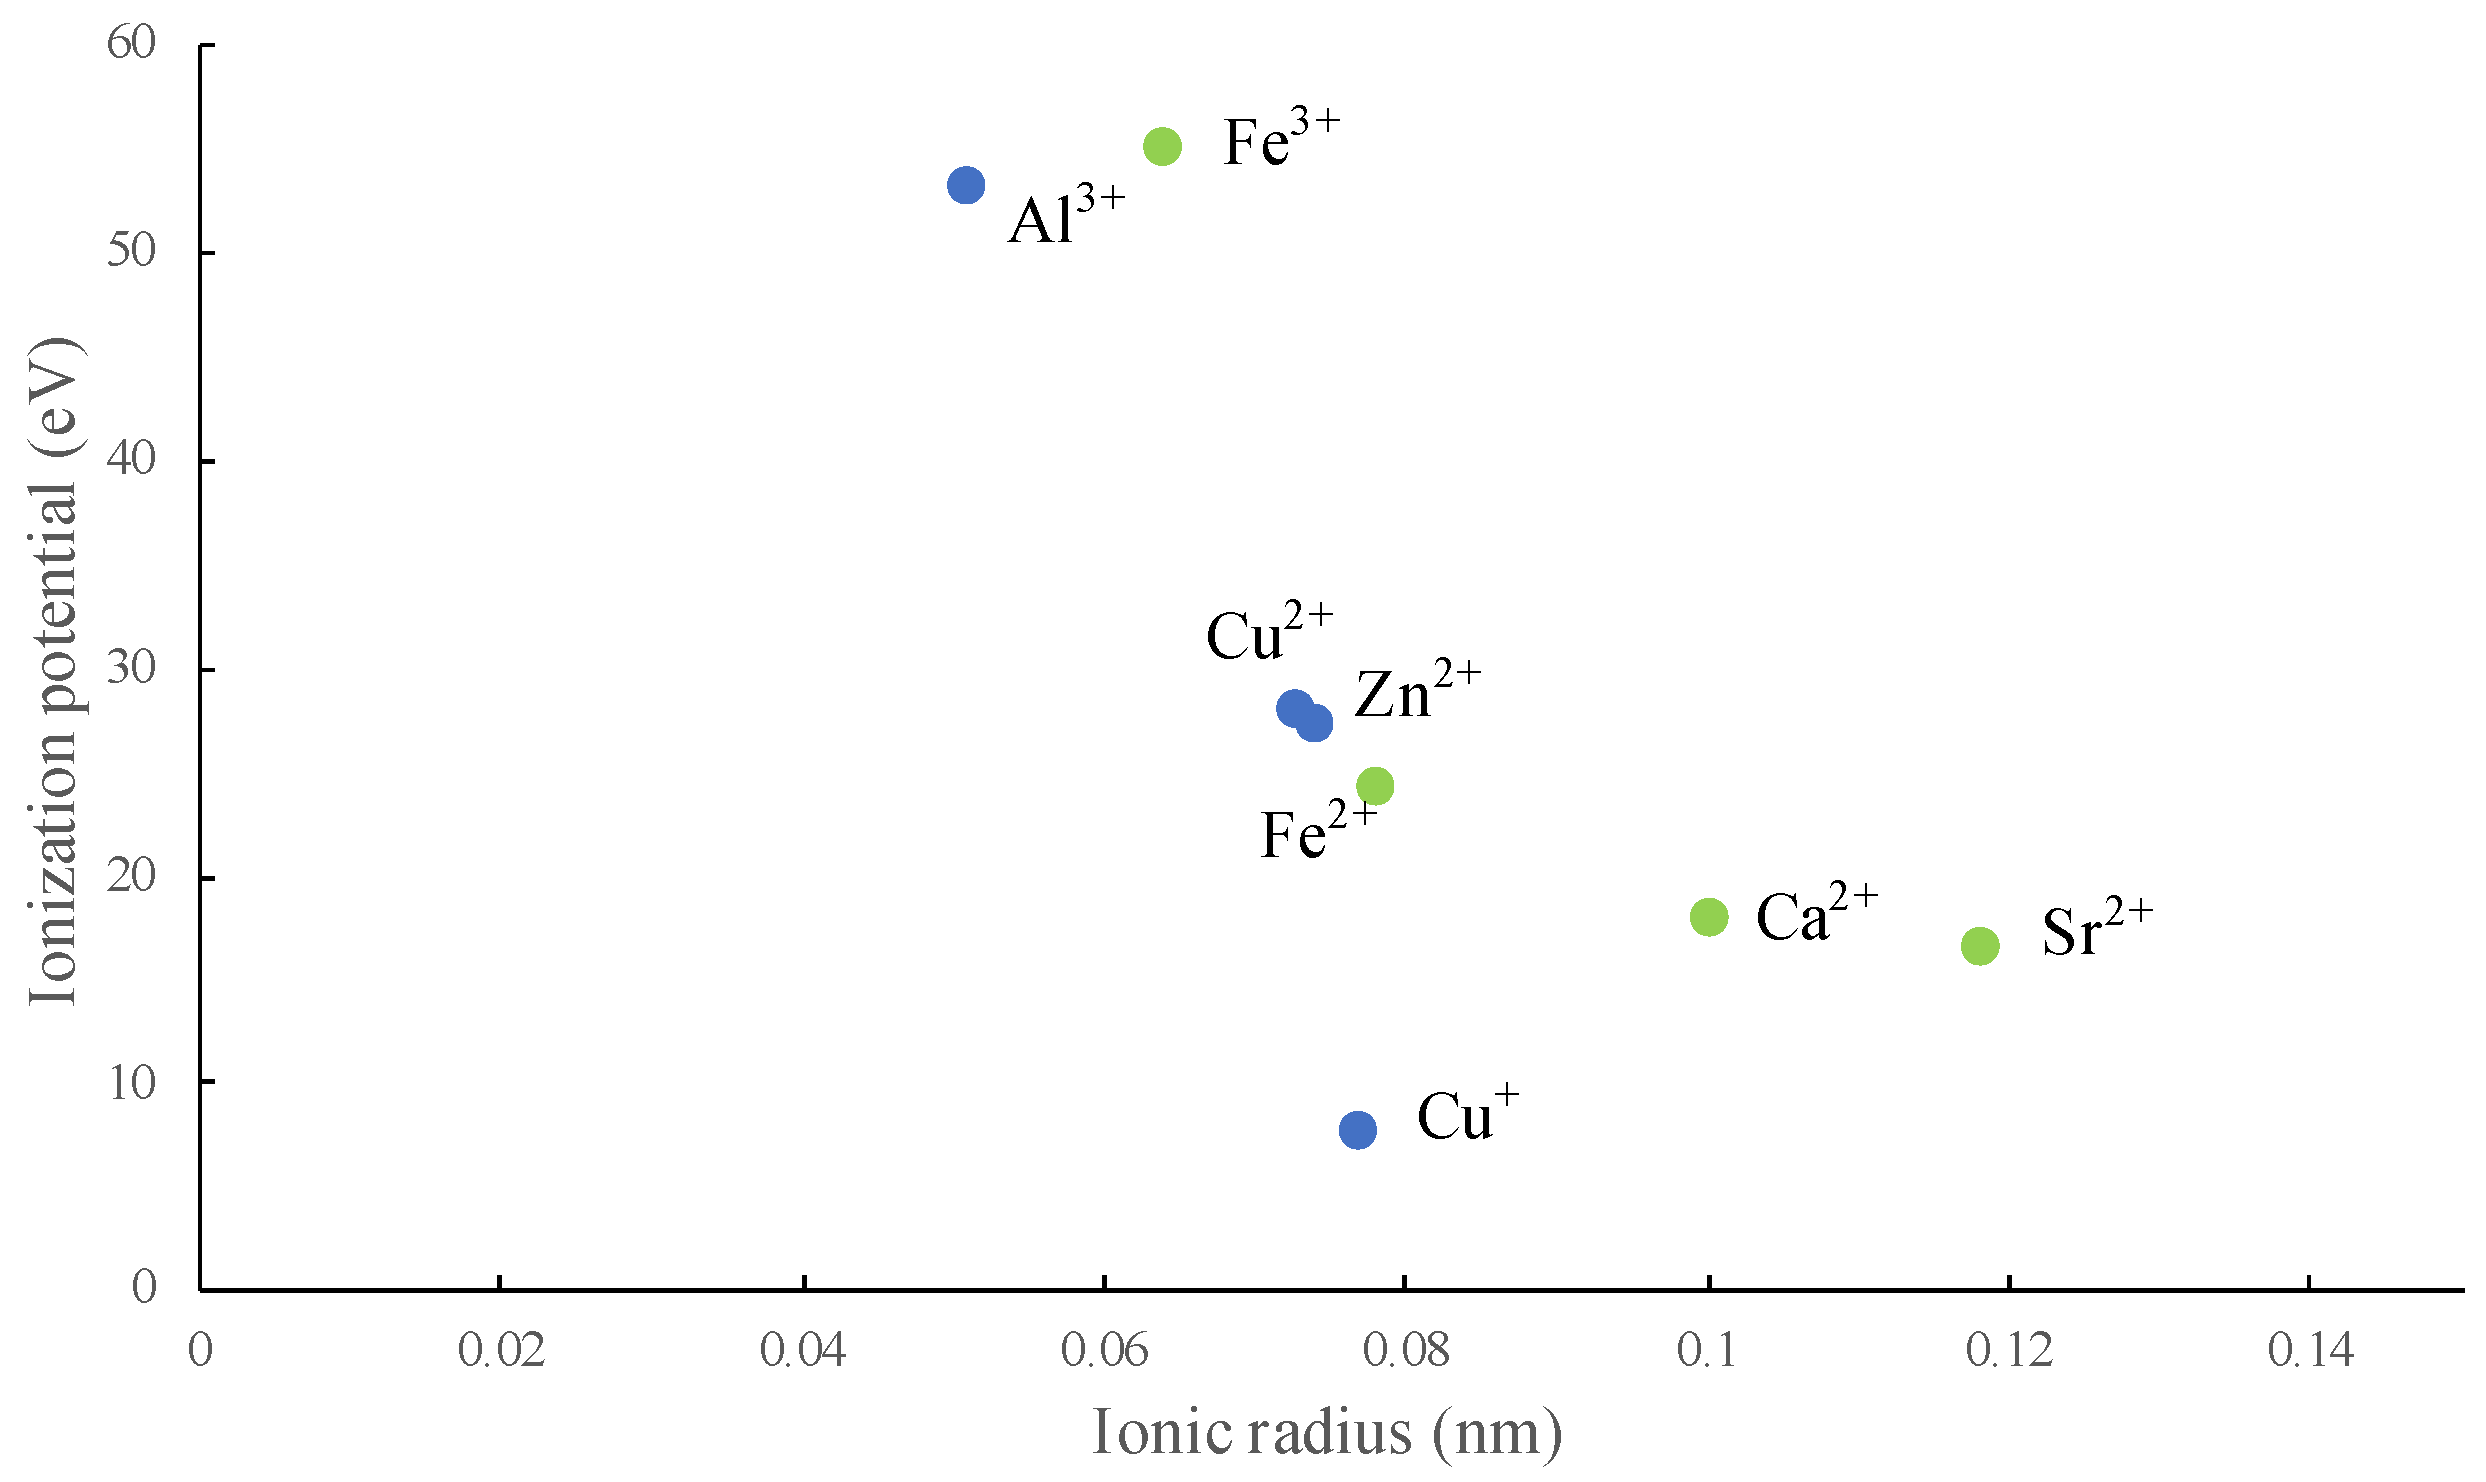
2.4. Approach to Analyze the Relations of Elements

Properties of ions can be found in chemical and physical data handbooks [28].
A metal ion is a positively charged particle. As hypothesized earlier [23], ions may bind to acid groups of organic molecules (e.g., carboxyl groups, –COOH) within the xylem structure. When multiple ions compete for limited binding sites (active centers), preferential binding may occur. Smaller ions with higher ionization potentials are theorized to have an advantage over larger ions with lower ionization potentials. Physically, smaller ions can penetrate organic molecules more easily, while higher ionization potential may reduce the likelihood of displacement by other ions.
Consequently, under conditions of limited active centers, larger ions with lower ionization potential are expected to be less abundant in the xylem compared to smaller ions with higher ionization potentials. This phenomenon may be observable for elements exhibiting similar distribution patterns across tree rings, particularly those with absolute minima in the same part of a ring (earlywood or latewood).
Figure 4 illustrates the distribution of selected metal elements on the “ionic radius vs. ionization potential” plane. As noted earlier, Fe, Ca, and Sr exhibit consistent minima in latewood and maxima in earlywood, whereas Al, Cu, and Zn show minima in earlywood and maxima in latewood. The following element pairs were analyzed: Fe/Ca, Fe/Sr, Ca/Sr, Al/Cu, Al/Zn, and Cu/Zn. According to the hypothesis [23], the element in the numerator of each pair is expected to be disproportionally more abundant than the denominator in the range of minima compared to the range of maxima. Mathematically, this implies that the ratio increases significantly in minima because the denominator decreases disproportionately relative to the numerator.

2.5. Statistical Treatment of Data

This study addresses multiple tasks to compare elemental content across tree stem regions, including max-side/min-side and earlywood/latewood comparisons. To ensure transparency and consistency in statistical analysis, these tasks were explicitly defined and treated separately. Figure 5 illustrates the data processing workflow.
  • Task A is the testing of differences in means—for the range of tree rings—of elemental content in latewood on the max-side vs. the min-side (Figure 5A).
  • Task B is the testing of differences in means of elemental content in earlywood on the max-side vs. the min-side (Figure 5B).
  • Task C is the testing of differences in means of elemental content of earlywood vs. latewood on the max-side (Figure 5C).
  • Task D is the testing of differences in means of elemental content of earlywood vs. latewood on the min-side (Figure 5D).
When considering not the content of individual elements but their ratios, the mean values of these ratios were statistically tested.
To assess differences in means, the non-parametric Mann–Whitney test was applied. The tests were performed using standard R tools (version 2023.06.2+561) [29]. A significance level of 5% was adopted, as it is widely accepted for estimating difference between means.

3. Results

3.1. Evaluation of the Stem Asymmetry

Stem asymmetry is a critical factor in this study, so its degree was evaluated. Radial growth was reconstructed from the scanning data, using the known spatial resolution of 100 µm. This allowed tree ring widths to be measured with an accuracy of 0.1 mm.
Individual trees exhibited varying degrees of asymmetry despite growing in visually similar conditions. For example, Figure 6 illustrates radial growth reconstructions for pines #5 and #6, highlighting inter-tree variability. Pine #6 shows high asymmetry, with consistently greater growth on the max-side compared to the min-side. Pine #5, however, initially had a smaller radius on the max-side during early growth stages. Over time, growth on the max-side accelerated, eventually surpassing that of the min-side.
Table 1 summarizes the degrees of stem asymmetry in individual pine trees. It is evident that the mean tree ring widths are consistently larger on the max-sides of the trees, although this difference is not always statistically significant. The table shows that the tree ring widths are significantly larger on the max-side in pines #1, #2, #4, and #6 (p < 0.05). In pine #5, the difference is marginal (p < 0.06), while in pine #3, it is insignificant.

3.2. Comparison of Elements’ Concentration Between Min-Side and Max-Side

Tables S1–S4 in the Supplementary Materials present the comparison results for individual pine trees. For clarity, the data are summarized in Table 2, Table 3, Table 4 and Table 5 below. The tables are simplified based on consistency criteria. If a relation (e.g., ”more”, “less”, “significant”) holds true for all sampled trees, it is labeled as “always”. If a single exception exists, it is labeled as “mostly”, indicating slightly lower consistency. Cells left blank indicate low consistency.
As outlined in the list of tasks (see Section 2.5), tasks A and B involve testing of differences in mean elemental concentrations between the max-side and min-side. Table 2 summarizes the data obtained for individual trees (see Table S1 in the Supplementary Materials). The table shows that some elements tend to have higher concentrations on the min-side, both in early- and latewood. These elements include Al, Si, P, S, and Cl. However, the differences are mostly significant only for Si and S.
Other elements studied do not exhibit a consistent pattern in relation to the sides of the tree stem. Notably, Ca tends to concentrate in latewood on the min-side, while Fe tends to concentrate more in latewood on the max-side. However, the differences between the sides are of low statistical significance. In contrast, Sr consistently concentrates more in latewood on the max-side.
Another noteworthy observation is that some elements show consistently significant differences between the max-side and min-side, but the direction of these differences vary. For example, Zn concentration appears to be randomly distributed with respect to the sides of the tree, yet the difference in means is always significant, regardless of which side has a higher concentration.

3.3. Comparison of Element Concentrations Between Earlywood and Latewood

Tasks C and D (see Section 2.5) involve the comparison of elements’ concentrations between earlywood and latewood. Table 3 summarizes the data for individual trees (see Table S2 in the Supplement). As the data indicate, the differences in elemental concentrations between earlywood and latewood are consistent. Some elements (Al, Si, P, S, Cl, Cu, and Zn) consistently show lower concentrations in earlywood compared to latewood, while others (Ca, Fe, and Sr) consistently show higher concentrations in earlywood, regardless of the side of the tree stem.
Moreover, the observed relationships are almost always statistically significant. Exceptions include P, S, and Cl; the differences in their concentrations between earlywood and latewood are mostly significant on max-side of the tree stem.

3.4. Comparison of Mean Element Ratios Between Min-Side/Max-Side and Earlywood/Latewood

Table 4 summarizes the data on testing the differences in the mean of ratios between earlywood vs. latewood (tasks C and D, see Section 2.5). The ratios were calculated for various elements as defined in Section 2.4. In the first group of elements (Fe, Ca, and Sr), the ratios Ca/Sr and Fe/Sr are consistently higher in latewood, the area of elemental minima, which aligns with the hypothesis of interaction between different ions. According to the hypothesis, smaller ions with higher ionization energy should be more abundant under conditions of a presumed lack of active centers for binding. In contrast, the ratio Fe/Ca is consistently lower in latewood—contrary to the hypothesis—although this difference is mostly significant only on the min-side of the tree stem.
In the second group of elements (Al, Cu, and Zn), the ratios Al/Zn and Cu/Zn are consistently higher in earlywood, the area of elemental minima, which supports the hypothesis. The mean differences in these ratios are almost always statistically significant; with the exception of Al/Zn on the max-side. The ratio Al/Cu is consistently higher in earlywood on the min-side, which also supports the hypothesis, though this difference is not always statistically significant.
Table 5 provides a summary of the testing of differences in mean element ratios between the max-side and min-side. As shown in the table, the distribution of ratios between the sides of the tree stem is largely inconsistent. For example, Fe/Ca ratio is mostly higher on the max-side, in both early- and latewood, but the differences in means are often not statistically significant. Similarly, even though the differences in means for the ratios Al/Zn and Cu/Zn are mostly significant, the differences themselves remain rather inconsistent.

4. Discussion

A significant number of studies have been published on the allocation of elements in the xylem of trees, both in early research [30,31,32] and in recent reviews [12,13]. Early publications have made it clear that the inorganic content of elements and their concentrations in wood vary widely within and between species, depending on the environmental conditions of tree growth [30].
The differences between earlywood and latewood, not only anatomical but also physiological, have been widely documented. From a physiological perspective, earlywood and latewood differ in their ability to conduct sap [33,34], which may contribute to differences in chemical composition. Regarding organic compounds, such as lignin, Scots pine exhibits quite distinct processes in earlywood and latewood [35]. One of the earliest reports on elements in earlywood versus latewood was provided by Saka and Goring [31], who used energy-dispersive X-ray spectroscopy (EDXA) to study the distribution of inorganics across the stems of black spruce. They identified approximately 15 different elements in the wood and reported higher inorganic content in earlywood compared to latewood.
In a recent study [24], several elements within Scots pine tree rings were analyzed, with a focus on the consistency of their distribution between early- and latewood, as well as between opposite sides of the tree stem (North vs. South). Unlike the findings of Saka and Goring [31], it was found that some elements (Ca, Fe, and Sr) were more abundant in earlywood, while others (Al, Si, P, S, Cl, Cu, and Zn) had higher concentrations in latewood. No significant pattern of elemental distribution was detected regarding the North/South sides.
The current research, as one of its aims, explored the consistency of element distribution between early- and latewood in a broader sample collection of trees of the same species. In addition, another possible source of variability was investigated, specifically, the edge effect, which occurs when a tree grows at the boundary between a dense forest stand and open space. This contrasting environmental conditions can lead to crown and stem asymmetry.
From a practical perspective, understanding the effect of stem asymmetry on elemental allocation is highly important. An uninformed sampling approach during tree stem coring may introduce unwanted variability in results. Therefore, for dendrochemical research, it is advisable to account for the effect of the stem asymmetry.
According to the measurements conducted, stem asymmetry takes place in trees growing at the edge of the forest stand, but it is not always as strong as could be expected (Table 1). While the crown is a relatively movable part of the tree (e.g., Figure 2), the stem appears to be more conservative. The latter may originate from some conditions at early growth stages—which, however, are not known—that brought about stronger growth on the min-side facing the forest stand. But with time, the conditions on the min-side may have gradually worsened, leading to faster growth on the max-side in recent tree rings. These different growth conditions could contribute to the variability of elemental allocation in the tree rings because faster growth, supposedly [36], implies increased sap flow through the xylem. Thus, the asymmetry of stem along with intra-ring heterogeneity related to the seasonality of growth (earlywood and latewood) were considered here as competitive sources of variability in terms of elements allocated in the xylem.
The comparison of Table 2 and Table 3 provides evidence that the intra-rings heterogeneity offers a more consistent picture of elemental variations. Table 3 shows that Al, Si, P, S, Cl, Cu, and Zn are more frequently recorded in latewood, while Ca, Fe and Sr are mostly recorded in earlywood—irrespective of the side (min or max) of the tree stem. These results support the earlier findings on the same elements [24] and, therefore, such a distribution may be considered a rather consistent phenomenon. A broader dataset, e.g., on Scots pine growing under other conditions in other areas, may, however, be desirable.
Against such a background, the role of the min- or max-side of the stem looks rather weak (Table 2). On the one hand, some elements such as Al, Si, P, S, Cl (both earlywood and latewood), and Ca (latewood) are often more abundant on the min-side, while other elements such as Fe and Sr (both in latewood) are often more abundant on the max-side. On the other hand, these relations are rarely significant, except for Si and S.
However, one should pay attention to individual differences in the trees (Table S1 in Supplementary Materials). As shown in Table 1, pine #1 and #6 have pronounced stem asymmetry, and these two pines show quite consistent results regarding some elements (Al, Si, P, S, Cl, Cu, and Zn). All these elements are more abundant on the min-side of the stem (both in early- and latewood), and all these relationships are significant in the both pines. It is, therefore, too early to discard the impact of stem asymmetry on elemental allocation: there is still a possibility that strong asymmetry may provide a notable contribution to elemental allocation variability, which is important to take into account during sampling procedures.
Since the coring of tree stems as a sampling method is an important source of dendrochemical information, field methods that provide rapid information on stem asymmetry would be helpful. Some literature sources report that the exact geometry information may be provided by both electronic tree calipers and ground-penetrating radar systems [37].
Another task of the current research was to test the hypothesis [23] that aimed at explaining why metal elements’ content changes disproportionately in the areas of minima relative to the areas of their maxima within tree rings. The hypothesis posits that a smaller ion with a higher ionization potential may have an edge over a larger ion with a lower ionization potential when competing for sparse active centers on organic molecules.
This hypothesis aligns well with several elements and their ratios. Calcium, Fe and Sr exhibit minima in latewood (Table 3), with both the ionic radius increasing and ionization potential decreasing following the sequence Fe → Ca → Sr (Figure 4). Consequently, one would expect Fe/Ca, Ca/Sr, and Fe/Sr ratios to be higher in latewood (as the denominator decreases more sharply, resulting in larger ratios). This expectation holds true for Ca/Sr and Fe/Sr but not for Fe/Ca (Table 4). Iron content in latewood decreases more significantly than calcium, likely due to unidentified factors. This deviation may arise from chemical features of Fe transport in the xylem. Heavier metals, such as Fe and Sr, are often transported via soluble organic compounds [32], potentially facing barriers when penetrating highly lignified latewood with narrow lumens.
Two observations can be made regarding the Ca, Fe, and Sr group. First, the ratios are largely independent of the min- or max-side of the tree stem. Second, the ratios, including the anomalous Fe/Ca, remain consistent across different tree samples (see ref. [23]).
Other studied elements (Al, Cu, and Zn) consistently show minima in earlywood (Table 3). The sequence of the ionic radii enlargement and ionization potential reduction is Al → Cu → Zn. A complication arises because copper can exist as Cu2+ or Cu+, and the sequence applies only to Cu2+. In line with the hypothesis, the ratios Al/Cu, Cu/Zn, and Al/Zn should thus be higher in earlywood than in latewood. Table 4 confirms this for ratios with Zn as the denominator. The hypothesis also holds true for Al/Cu on the min-side of the tree, though differences in means are mostly non-significant due to high data variability. Compared to prior work [23], Cu/Zn and Al/Zn ratios are consistent across tree samples.
The impact of the tree stem sides on ratio means lacks a clear pattern (Table 5).
Overall, intra-ring heterogeneity (early- and latewood) appears more decisive than stem asymmetry in Scots pine xylem element distribution. However, highly asymmetric stems warrant further study, as extreme asymmetry may influence elemental allocation. The intra-ring heterogeneity is remarkably consistent across tree samples, offering a robust framework for exploring elemental distribution.
Certain ratios (Ca/Sr, Fe/Sr, Fe/Ca, Cu/Zn, and Al/Zn) are consistent across samples (cf. ref. [24]), even when the hypothesis [23] fails (e.g., Fe/Ca).
To conclude, some limitations of the current study should be listed. First, despite sample size, expanded sampling may challenge the inferences conducted. Replication with independent samples may be critical. Second, while X-ray fluorescence (XRF) provides high-resolution data, it indirectly assesses wood chemistry. Complementary chemical analyses (with concentration units) are desirable to validate XRF results. Third, dendrochemical studies of earlywood vs. latewood are sensitive to ring width. Wider rings reduce error in delineating wood boundaries; the results primarily apply to such segments. Lastly, compression wood, though not visibly observed in our specimen, could perturb elemental distributions.

5. Conclusions

This study presents a part of a series of research efforts (see, e.g., Table S5 in the Supplementary Materials [24]) the long-term goal of which is to accumulate evidence of dendrochemical relationships that are consistently observed across various species. Despite the broad coverage of topics and significant results obtained, dendrochemistry remains a research area with notable inconsistencies [13]. Practical experience shows that a significant portion of these inconsistencies stems from the high level of variability that researchers encounter regarding chemical compounds in trees. Often, a strong correlation found in one individual tree may ‘disappear’ in another. Identifying elements and relationships between them that are not subject to excessive variability remains an important task in dendrochemistry. Such repeatable and reproducible relationships can serve as a solid foundation for dendrochemical research within and among different species.
Another important task in dendrochemistry involves exploring possibilities to link the observed elemental distribution to the chemical and physical properties of elements and their compounds. Addressing this challenge will enhance the predictive power of dendrochemistry.

Supplementary Materials

The following are available online at https://www.mdpi.com/article/10.3390/f16030493/s1, Table S1: Comparison of the elements’ concentration between min-side and max-side; Table S2: Comparison of the elements’ concentration between earlywood and latewood; Table S3: Comparison of elements’ mean ratios between earlywood and latewood; Table S4: Comparison of elements’ mean ratios between min-side and max-side; Table S5: Average elemental contents in tree rings of six Scots pines [24].

Author Contributions

Conceptualization, V.L.G. and E.A.V.; methodology, V.L.G. and R.A.S.; software, A.I.F.; validation, R.A.S. and A.I.F.; formal analysis, V.L.G.; investigation, V.L.G.; resources, A.I.F.; data curation, AF.; writing—original draft preparation, V.L.G.; writing—review and editing, V.L.G., R.A.S. and E.A.V.; visualization, A.I.F.; supervision, E.A.V.; project administration, V.L.G. and R.A.S.; funding acquisition, R.A.S. All authors have read and agreed to the published version of the manuscript.

Funding

This study was supported by the Russian Science Foundation (grant No.: 23-44-00067).

Data Availability Statement

Dataset available on request from the authors.

Conflicts of Interest

The authors declare no conflicts of interest.

References

  1. Hevia, A.; Sánchez-Salguero, R.; Camarero, J.J.; Buras, A.; Sangüesa-Barreda, G.; Galván, J.D.; Gutiérrez, E. Towards a better understanding of long-term wood-chemistry variations in old-growth forests: A case study on ancient Pinus uncinata trees from the Pyrenees. Sci. Total Environ. 2018, 625, 220–232. [Google Scholar] [CrossRef] [PubMed]
  2. Pearson, C.L.; Manning, S.W.; Coleman, M.; Jarvis, K. A dendrochemical study of Pinus sylvestris from Siljansfors Experimental Forest, central Sweden. Appl. Geochem. 2006, 21, 1681–1691. [Google Scholar] [CrossRef]
  3. Baes, C.F.; Ragsdale, H.L. Age-specific lead distribution in xylem rings of three tree genera in Atlanta, Georgia. Environ. Pollut—Ser. B Chem. Phys. 1981, 2, 21–35. [Google Scholar] [CrossRef]
  4. Baes, C.F.; McLaughlin, S.B. Trace elements in tree rings: Evidence of recent and historical air pollution. Science 1984, 224, 494–497. [Google Scholar] [CrossRef]
  5. Balouet, J.C.; Oudijk, G. The use of dendroecological methods to estimate the time frame of environmental releases. Environ. Claims J. 2006, 18, 35–52. [Google Scholar] [CrossRef]
  6. Abreu, S.N.; Soares, A.M.V.M.; Nogueira, A.J.A.; Morgado, F. Tree rings, Populus nigra L., as mercury data logger in aquatic environments: Case study of an historically contaminated environment. Bull. Environ. Contam. Toxicol. 2008, 80, 294–299. [Google Scholar] [CrossRef]
  7. Bondietti, E.A.; Baes, C.F., III; McLaughlin, S.B. Radial trends in cation ratios in tree rings as indicators of the impact of atmospheric deposition on forests. Can. J. For. Res. 1989, 19, 586–594. [Google Scholar] [CrossRef]
  8. Prohaska, T.; Stadlbauer, C.; Wimmer, R.; Stingeder, G.; Latkoczy, C.; Hoffmann, E.; Stephanowitz, H. Investigation of element variability in tree rings of young Norway spruce by laser-ablation-ICPMS. Sci. Total Environ. 1998, 219, 29–39. [Google Scholar] [CrossRef]
  9. Liu, Y.; Ta, W.; Bao, T.; Yang, Z.; Song, H.; Liu, N.; An, Z. Trace elements in tree rings and their environmental effects: A case study in Xi’an City. Sci. China Ser. D 2009, 52, 504–510. [Google Scholar] [CrossRef]
  10. De Vasconcellos, T.J.; dos Santos, R.S.; dos Anjos, M.J.; Tomazello-Filho, M.; Callado, C.H. Recording chemical changes in an urban environment: A dendrochemical study of Ceiba speciosa (A. St.-Hil.) Ravenna (Malvaceae) in the Atlantic Forest. Dendrochronologia 2025, 89, 126286. [Google Scholar] [CrossRef]
  11. Müller, R.O. Spectrochemical Analysis by X-Ray Fluorescence; Springer: New York, NY, USA, 1972; 326p. [Google Scholar] [CrossRef]
  12. Binda, G.; Di Iorio, A.; Monticelli, D. The what, how, why, and when of dendrochemistry: (paleo) environmental information from the chemical analysis of tree rings. Sci. Total Environ. 2021, 758, 143672. [Google Scholar] [CrossRef] [PubMed]
  13. Canning, C.M.; Laroque, C.P.; Muir, D. Critical Analysis of the Past, Present, and Future of Dendrochemistry: A Systematic Literature Review. Forests 2023, 14, 1997. [Google Scholar] [CrossRef]
  14. Silkin, P.P.; Ekimova, N.V. Relationship of strontium and calcium concentrations with the parameters of cell structure in Siberian spruce and fir tree-rings. Dendrochronologia 2012, 30, 189–194. [Google Scholar] [CrossRef]
  15. Scharnweber, T.; Hevia, A.; Buras, A.; van der Maaten, E.; Wilmking, M. Common trends in elements? Within- and be-tween-tree variations of wood-chemistry measured by X-ray fluorescence—A dendrochemical study. Sci. Total Environ. 2016, 566, 1245–1253. [Google Scholar] [CrossRef]
  16. Rowell, R.M. Handbook of Wood Chemistry and Wood Composites, 2nd ed.; CRC Press: Boca Raton, FL, USA, 2013; 688p. [Google Scholar]
  17. Uprichard, J.M. Cellulose and lignin content in Pinus radiata D. Don. Within-tree variation in chemical composition, density, and tracheid length. Holzforschung 1971, 25, 97–105. [Google Scholar] [CrossRef]
  18. Czajka, M.; Fabisiak, E. Radial variation of the content of cellulose and lignin in selected softwood species. Ann. WULS-SGGW For. Wood Technol. 2017, 100, 233–238. [Google Scholar]
  19. Borukanlu, M.R.; Zadeh, O.H.; Moradpour, P.; Khedive, E. Effects of growth rate of eastern poplar trees on the chemical and morphological characteristics of wood fibers. Eur. J. Wood Wood Prod. 2021, 79, 1479–1494. [Google Scholar] [CrossRef]
  20. Bertaud, F.; Holmbom, B. Chemical composition of earlywood and latewood in Norway spruce heartwood, sapwood and transition zone wood. Wood Sci. 2004, 38, 245–256. [Google Scholar] [CrossRef]
  21. Fredriksson, M.; Pedersen, N.B.; Thygesen, L.G. The cell wall composition of Norway spruce earlywood and latewood revisited. Int. Wood Prod. J. 2018, 9, 80–85. [Google Scholar] [CrossRef]
  22. Antonova, G.F.; Zheleznichenko, T.V.; Stasova, V.V. Peculiarities of lignification in earlywood and latewood in Scots pine. In Proceedings of the Structure, Properties and Quality of Wood—Materials of VI B.N.Ugolev International Symposium Dedicated to 50th Anniversary of the Regional Coordination Committee on Modern Problems of Wood Science, Krasnoyarsk, Russia, 10–16 September 2018; pp. 46–58. (In Russian). [Google Scholar]
  23. Gavrikov, V.L.; Fertikov, A.I.; Sharafutdinov, R.A.; Vaganov, E.A. Properties of ions may explain elemental stoichiometry in late- and early-wood: A case study in Scots pine tree rings. J. For. Res. 2024, 35, 126. [Google Scholar] [CrossRef]
  24. Gavrikov, V.L.; Fertikov, A.I.; Sharafutdinov, R.A.; Tang, Z.; Vaganov, E.A. Early-Wood vs. Late-Wood in Scots Pine: Finding Stable Relationships in Elemental Distribution. Sci 2024, 6, 4. [Google Scholar] [CrossRef]
  25. Menyailo, O.V.; Hungate, B.A.; Zech, W. Tree species mediated soil chemical changes in a Siberian artificial afforestation experiment. Plant Soil 2002, 242, 171–182. [Google Scholar] [CrossRef]
  26. Schugalei, L.S. The Siberian afforestation experiment: History, methodology, and problems. In Tree Species Effects on Soils: Implications for Global Change; Binkley, D., Menyailo, O., Eds.; Springer: Dordrecht, The Netherlands, 2005; pp. 257–268. [Google Scholar]
  27. Balouet, J.C.; Burken, J.G.; Karg, F.; Vroblesky, D.; Smith, K.T.; Grudd, H.; Rindby, A.; Beaujard, F.; Chalot, M. Dendrochemistry of multiple releases of chlorinated solvents at a former industrial site. Environ. Sci. Technol. 2012, 46, 9541–9547. [Google Scholar] [CrossRef]
  28. Lide, D.R. (Ed.) Handbook of Chemistry and Physics, 83rd ed.; CRC Press: Boca Raton, FL, USA, 2002; 2664p. [Google Scholar]
  29. R Core Team. R: A Language and Environment for Statistical Computing; R Foundation for Statistical Computing: Vienna, Austria, 2023; Available online: https://www.R-project.org/ (accessed on 9 September 2023).
  30. Young, H.E.; Guinn, V.P. Chemical elements in complete mature trees of seven species in Maine. Tappi 1966, 49, 190–197. [Google Scholar]
  31. Saka, S.; Goring, D.A.I. The distribution of inorganic constituents in black spruce wood as determined by TEM-EDXA. Mokuzai Gakkaishi 1983, 29, 648–656. [Google Scholar]
  32. Speer, J.H. Fundamentals of Tree-Ring Research; University of Arizona Press: Tucson, AZ, USA, 2010; 509p. [Google Scholar]
  33. Cartenì, F.; Deslauriers, A.; Rossi, S.; Morin, H.; De Micco, V.; Mazzoleni, S.; Giannino, F. The Physiological Mechanisms Behind the Earlywood-To-Latewood Transition: A Process-Based Modeling Approach. Front. Plant Sci. 2018, 9, 1053. [Google Scholar] [CrossRef] [PubMed]
  34. Chave, J.; Coomes, D.; Jansen, S.; Lewis, S.L.; Swenson, N.G.; Zanne, A.E. Towards a worldwide wood economics spectrum. Ecol. Lett. 2009, 12, 351–366. [Google Scholar] [CrossRef]
  35. Antonova, G.F.; Varaksina, T.N.; Zheleznichenko, T.V.; Stasova, V.V. Lignin deposition during earlywood and latewood formation in Scots pine stems. Wood Sci. Technol. 2014, 48, 919–936. [Google Scholar] [CrossRef]
  36. O’Brien, J.J.; Oberbauer, S.F.; Clark, D.B. Whole tree xylem sap flow responses to multiple environmental variables in a wet tropical forest. Plant Cell Environ. 2004, 27, 551–567. [Google Scholar] [CrossRef]
  37. Li, W.; Wen, J.; Xiao, Z.; Xu, S. Application of ground-penetrating radar for detecting internal anomalies in tree trunks with irregular contours. Sensors 2018, 18, 649. [Google Scholar] [CrossRef]
Figure 1. The location of the study area on the map of Russia (shown as red square on the (left)). Topographical map (center) shows the location relative to the nearest settlement. Satellite image (right) depicts the study area; the white arrow indicates the edge of the Scots pine section where sampling was conducted. Image source: https://www.arcgis.com/home/item.html?id=ab399b847323487dba26809bf11ea91a (accessed on 3 March 2025), World Imagery (Clarity).
Forests 16 00493 g001
Figure 2. Views of a sample pine tree growing at the edge of the pine section: (a) the side of the crown facing away from the stand, representing the side of maximal crown development (hereinafter referred to as max-side); (b) the side of the crown facing towards the stand, representing the side of minimal crown development (hereinafter referred to as min-side).
Forests 16 00493 g002
Figure 3. Details of the treatment procedure used: (a) a core extracted from a tree stem, (b) a slice extracted from the core, and (c) the slices mounted in a plastic holder inside the unit, ready for scanning.
Forests 16 00493 g003
Figure 4. Distribution of the ions of the studied elements on the plane “ionic radius vs. ionization potential”. Green markers () denote elements with maximal content in earlywood and minimal content in latewood. Blue markers () denote elements with minimal content in earlywood and maximal content in latewood. The analysis of ionic radii and ionization potentials is performed to evaluate the relative contents of the elements in early- and latewood. Hypothetically, ions with smaller ionic radii and higher ionization potentials may have a greater likelihood of attaching to organic compounds in the xylem. The data were obtained from the Handbook of Chemistry and Physics [28].
Forests 16 00493 g004
Figure 5. Schematic representation of statistical tasks. A cross-sectional view of the tree trunk shows the maximal side (max-side, facing away from the forest stand) and minimal side (min-side, facing towards the stand). These sides are hypothesized to experience contrasting growth conditions. The tasks include the following: (A) task = testing of differences in means of elements (mean concentrations withing the range 1990 to 2022) in max-side latewood vs. elements in min-side latewood; (B) task = testing of differences in means of elements in max-side earlywood vs. elements in min-side earlywood; (C) task = testing of differences in means of elements of earlywood vs. latewood on the max-side; (D) task = testing of differences in means of elements of earlywood vs. latewood on the min-side.
Forests 16 00493 g005
Figure 6. Radial growth of the sample trees exemplified by pine #5 and pine #6. The time span of the growth shown corresponds to the span of tree rings analyzed (1990 to 2022). In the legend, ‘pine 5 min’ (——) and ‘pine 5 max’ (— —) denote the data for pine #5 on the sides of minimal and maximal crown development, respectively. The same applies for pine #6.
Forests 16 00493 g006
Table 1. The results of tree stem asymmetry assessment as expressed by mean tree ring widths. Min-side column contains the means of trees ring widths (mm) in the time span 1990 to 2022. The same applies max-side column. p-values show the significance of differences in means estimated through the Mann–Whitney non-parametrical test (n = 33).
Tree NumberMean Width of Tree Ring, mmp-Value
Min-SideMax-Side
12.063.30<0.0001
21.902.480.007
32.042.180.345
42.652.980.008
51.842.300.056
62.183.16<0.0001
Table 2. Summary of the testing of differences in means between elements’ concentrations on the min-side of tree vs. the max-side of tree. The table summarizes the data obtained for individual trees given in Table S1 (see Supplementary Materials). The significance of differences in means was assessed through the Mann–Whitney non-parametric test. Methodologically, the testing corresponds to tasks A and B in Figure 5.
ElementType of WoodConcentration of Element:
Min-Side > Max-Side
Concentration of Element:
Min-Side < Max-Side
Significant
AlEarlywoodalways 1
Latewoodmostly 2
SiEarlywoodmostly mostly
Latewoodmostly mostly
PEarlywoodmostly
Latewoodalways
SEarlywoodmostly mostly
Latewoodmostly mostly
ClEarlywoodmostly
Latewoodmostly
CaEarlywood mostly
Latewoodmostly
FeEarlywood mostly
Latewood mostly
CuEarlywood
Latewood mostly
ZnEarlywood always
Latewood always
SrEarlywood mostly
Latewood mostlymostly
1 always = true for all six sample trees. 2 mostly = true for at least 5 of 6 sample trees.
Table 3. Summary of the testing of differences in means between elements’ concentrations in the earlywood of tree ring vs. the latewood of tree ring. The table summarizes the data obtained for individual trees given in Table S2 (see Supplementary Materials). The significance of differences in means was assessed through the Mann–Whitney non-parametric test. Methodologically, the testing corresponds to tasks C and D in Figure 5.
ElementSide of TreeConcentration of Element:
Earlywood > Latewood
Concentration of Element:
Earlywood < Latewood
Significant
AlMin-side always 1always
Max-side alwaysalways
SiMin-side alwaysalways
Max-side alwaysalways
PMin-side alwaysalways
Max-side alwaysmostly 2
SMin-side alwaysalways
Max-side alwaysmostly
ClMin-side alwaysalways
Max-side alwaysmostly
CaMin-sidealways always
Max-sidealways always
FeMin-sidealways always
Max-sidealways always
CuMin-side alwaysalways
Max-side alwaysalways
ZnMin-side alwaysalways
Max-side alwaysalways
SrMin-sidealways always
Max-sidealways always
1 always = true for all six sample trees. 2 mostly = true for at least 5 of 6 sample trees.
Table 4. Summary of the testing of differences in means of elements’ ratios in the earlywood of tree ring vs. the latewood of tree ring. The table summarizes the data obtained for individual trees given in Table S3 (see Supplementary Materials). The significance of differences in means was assessed through the Mann–Whitney non-parametric test. Methodologically, the testing corresponds to tasks C and D in Figure 5.
Ratio of ElementsSide of TreeMean Values of Ratios: Earlywood > LatewoodMean Values of Ratios: Earlywood < LatewoodSignificant
Ca/SrMin-side alwaysalways
Max-side alwaysmostly 2
Fe/CaMin-sidealways 1 mostly
Max-sidealways
Fe/SrMin-side alwaysalways
Max-side alwaysmostly
Al/CuMin-sidealways
Max-side
Al/ZnMin-sidealways always
Max-sidealways mostly
Cu/ZnMin-sidealways always
Max-sidealways always
1 always = true for all six sample trees. 2 mostly = true for at least 5 of 6 sample trees.
Table 5. Summary of the testing of significance of differences in means of elements’ ratios from the min-side of tree vs. max-side of tree. The table summarizes the data obtained for individual trees given in Table S4 (see Supplementary Materials). The significance of differences in means was assessed through the Mann–Whitney non-parametric test. Methodologically, the testing corresponds to tasks A and B in Figure 5.
Ratio of ElementsType of WoodMean Values of Ratios: Min-Side > Max-SideMean Values of Ratios: Min-Side < Max-SideSignificant
Ca/SrEarlywood
Latewoodmostly 2
Fe/CaEarlywood mostly
Latewood mostly
Fe/SrEarlywood
Latewood
Al/CuEarlywood
Latewood mostly
Al/ZnEarlywood mostly
Latewood always 1
Cu/ZnEarlywood
Latewood mostly
1 always = true for all six sample trees. 2 mostly = true for at least 5 of 6 sample trees.
Disclaimer/Publisher’s Note: The statements, opinions and data contained in all publications are solely those of the individual author(s) and contributor(s) and not of MDPI and/or the editor(s). MDPI and/or the editor(s) disclaim responsibility for any injury to people or property resulting from any ideas, methods, instructions or products referred to in the content.

