Abstract
Forest operations often expose workers to physical risks, including posture-related disorders such as low back pain. The Ovako Working Posture Assessment System (OWAS) is widely used to assess postures in forest operations, but it requires expertise and significant resources. In this study, the use of image embedding and transfer learning was explored to automate OWAS classification. Over 5000 images from motor–manual cross-cutting operations were analyzed using two models: Google’s Inception V3 and SqueezeNet, both of which were integrated with neural networks via the Orange Visual Programming platform. The image vectors were fed into a locally run neural network (a multilayer perceptron with backpropagation) that was optimized for architecture and hyperparameters. The models were trained and tested using 20-fold cross-validation on the Posture and Action datasets, achieving accuracies of 84% and 89%, respectively, with Inception V3 outperforming SqueezeNet on both datasets. Predictions on unseen images yielded lower accuracies (50%–60%), highlighting the challenge of domain differences. These results demonstrate the potential of embedding-based transfer learning to automate postural classification with high accuracy, thereby reducing the need for expertise and resources. However, further research is needed to improve performance on unseen data and to explore alternative classifiers and embedding methods for better representation.
Keywords:
forest harvesting; ergonomics; posture; chainsaw; crosscutting; deep learning; neural network; accuracy 1. Introduction
Despite the mechanization of timber harvesting, it is estimated that approximately 30% of timber used annually in the industry is felled and processed by chainsaws globally [1]. Compared to other industries, forestry work is considered one of the most dangerous professions, particularly in Thailand and other countries where motor-manual harvesting is the dominant method [2,3,4,5]. Furthermore, the physical strain and workload can lead to overexertion among chainsaw operators, increasing the risk of accidents [6]. Tsioras et al. [7] investigated tree felling and reported that inappropriate body posture significantly affects heart rate and physiological strain, potentially increasing the risk of developing musculoskeletal disorders (MSDs). Cheţa et al. [8] found that motor-manual tree felling and processing expose operators to heavy physical strain, unacceptable noise levels, and an elevated risk of MSDs. Robb et al. [9] concluded that occupational safety and health (OSH) in Asian countries require improvements in forest work, noting that chainsaw operators often work seasonally or temporarily without adequate education or training. In conclusion, motor-manual tree felling and processing remain prevalent worldwide, impacting the health of forestry workers; thus, reducing harmful working postures should be a primary concern in mitigating and improving OSH.
The evaluation of body posture during work typically aims to (i) characterize the risks of developing job-related MSDs; (ii) inform decision-makers about the potential risks associated with specific work methods, enabling them to find ways to minimize costs related to worker recovery; and (iii) identify (re)engineering strategies to improve work performance. Numerous methods have been employed to assess the risk of developing work-related MSDs [10], many of which have significant limitations. These include the need to process large volumes of data and to accurately annotate tasks and body postures observed in the field or in field-collected media. Furthermore, there is often a lack of agreement between outcomes when input data are evaluated by different individuals [10]. Additionally, the results of evaluations heavily depend on the amount of data considered in each study. Data that closely resembles real-life sequences of events are likely to yield the most accurate results for posture evaluation [11,12]. However, such data collection requires substantial effort in terms of annotation and categorization, which demands considerable resources and limits the scope of evaluations to a smaller number of workers or work situations. Inter-worker variability in anthropometry and work habits further complicates the validity of the outcomes, compounded by known variability in biomechanical exposure [13]. This variability hinders effective decision-making based on informed analyses. Under these conditions, conducting postural classification ergonomic studies becomes both time-consuming and financially burdensome.
Deep learning and computer vision techniques have demonstrated significant potential for addressing postural classification tasks [14,15,16,17]. Recent studies have employed advanced methods such as convolutional neural networks (CNNs), multitask joint learning, and deep reinforcement learning to achieve high accuracy in image recognition, real-time target tracking, and classification [18,19,20,21,22]. For instance, Zhang et al. [21] reported over 98% accuracy in image recognition, target tracking, and classification. The deep learning approaches proposed by Talaat [23] and Upadhyay et al. [24] achieved 100% and 98.88% classification accuracy for yoga posture recognition and automated posture assessment, respectively.
However, these methods face key limitations, such as model overfitting and class imbalance [25,26,27,28]. In overfitting, models specialize in specific tasks and datasets, limiting their generalizability [28]. This specialization can reduce versatility and restrict the model’s application in various contexts [28]. To enhance classification performance, particularly with limited training data and overfitting, techniques such as transfer learning [29,30,31] and data augmentation [28] have been employed. Shorten and Khoshgoftaar [29] define class imbalance as a dataset with a skewed ratio of majority to minority samples, which can lead models to favor majority classes and perform poorly on minority ones [25,27,29]. Addressing class imbalance is crucial, as it negatively impacts classifier accuracy [25,26,27]. Moreover, the annotation effort and resources required to create large, balanced datasets can be substantial [29]. Consequently, various data-level methods (oversampling, undersampling, and feature selection) and algorithm-level methods (cost-sensitive and hybrid/ensemble methods) have been investigated to tackle class imbalance [25,26,27], though more work is needed to overcome these challenges [29].
Image analysis appears to be one of the most promising and powerful techniques for inferring the postural conditions of workers. Traditionally, this approach has relied on human classifiers to evaluate images, supporting decisions aimed at improving workplace conditions [8,32,33,34,35,36]. In contrast, image-based deep learning has revolutionized many industries by employing task-oriented neural networks. However, these methods typically require large annotated datasets to effectively address specific problems [18,37]. Transfer learning has emerged as a powerful alternative to commonly used deep learning methods, particularly for classification tasks such as postural assessment. In essence, transfer learning is a technique that leverages previously acquired deep learning knowledge to address new problems, as it can effectively manage differences in domains, tasks, and data distributions between training and testing sets [29]. One approach to facilitate this is a technique known as image embedding, which involves passing an image through a deep network to obtain its vector representation [38]. Image embedding utilizes feature representation from the penultimate layer, enabling its use alongside conventional machine learning methods to tackle new classification tasks [38]. Image embedding appears to have considerable potential in postural classification, particularly in terms of reducing the resources required by conventional approaches and minimizing subjectivity in assessments. In contrast, certain tasks specific to forest operations may be easier for both humans and machines to classify, while others may present challenges. Issues such as image occlusion, crowding, or incompleteness can impact the outcomes of deep learning classification [18,22,39,40].
The goal of this study was to evaluate the extent to which image embedding and transfer learning could support accurate postural classification in forest operations using a dataset characterized by crowding, occlusion, missing data, and class imbalance. The objectives of the study were to (i) assess the feasibility of image-based postural classification via the OWAS method using image embedding and transfer learning, and (ii) determine which of the two most commonly used embedders is the most suitable for postural classification. Both objectives were addressed through hyperparameter tuning, data visualization, and the estimation of accuracy metrics. Based on the outcomes, the most suitable image embedder was selected.
2. Materials and Methods
2.1. Data Sourcing
In Thailand, it is common practice to carry out harvesting using partly mechanized systems, which typically involve a significant amount of manual labor to fell and process the trees; choke the tree lengths; and, more importantly, measure and crosscut them into logs. This operation is performed manually in designated log yards [41]. One such log yard was selected for data collection in this study, located at 14°10′58.8″ N, 98°55′34.3″ E in Kanchanaburi province, Thailand (Figure 1). The field survey included the collection of media footage documenting the motor-manual crosscutting of teak (Tectona grandis L.f.) performed by a team of two workers. One worker operated a chainsaw to crosscut the stems, while the other assisted manually by lifting the logs with a steel lever. An iPhone 13 Pro Max (Apple Inc., Cupertino, CA, USA, 2021) was used to collect high-resolution video files, with the field of view oriented towards the worker performing the motor-manual tasks, although other individuals were also captured in the footage, including the manual assistant. The person filming moved to various positions while maintaining a similar field of view during the operations. Videos were recorded from a distance always greater than 2 m but not exceeding four meters. Figure 1 shows an example of the operations captured by the camera.
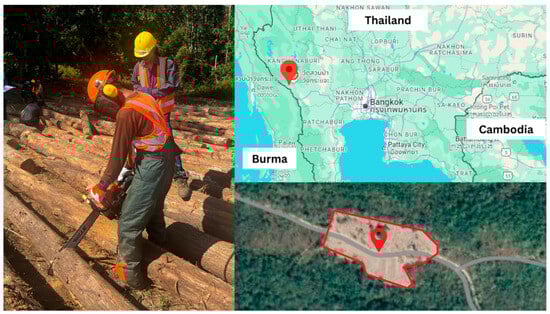
Figure 1.
An example of an image used for modeling (left) and the location of the study (right).
A total of 14 videos of varying durations were collected, accounting for nearly 3.7 h in length. These videos were visually analyzed to select those exhibiting the highest variability in posture, leading to a detailed analysis of three specific video files. Images were extracted from these videos at one-second intervals using Free Video to JPG Converter (DVD Video Soft Ver. 5.0.101.201, Roseau, Dominica) software, resulting in more than 5000 still images deemed valid for detailed analysis.
Respondents participating in the survey were fully informed about the procedures, purpose, and intended outcomes of the study. Prior to their involvement, each respondent provided informed consent, acknowledging their understanding and agreement to participate. A certificate of approval for the study (COA67/055) was granted by the Kasetsart University Research Ethics Committee. The authors confirm that all study steps were performed in accordance with the relevant guidelines and regulations involving humans as research subjects.
2.2. Manual Data Classification and Annotation
All images were visually assessed according to the OWAS postural classification system. OWAS is widely used in industry to evaluate the postural conditions of work [10,42] and is commonly applied in forest operations [8,33,34], primarily due to its simplicity, the inexpensive equipment required for data collection and analysis [34,43], and its capacity to evaluate the entire body [10,44,45]. At the core of the method is the description of postural conditions using 252 four-digit codes that characterize the possible postures taken by a worker in terms of three body parts (back, arms, and legs) and force exertion [34,42]. Based on these codes, a matrix categorizing the posture of the back, arms, and legs, as well as force exertion, is employed to classify each instance into one of four possible action categories. These categories describe the postural risks and corresponding actions, representing the main outcome of the assessment. While the method is straightforward, the main limitations relate to the volume of data necessary to produce reliable results and the sampling strategy employed. For example, fine systematic sampling has been shown to yield more reliable estimates [11], but it incurs a high cost in terms of time spent on data classification. Another limitation of this conventional method is the lower intra- and interrater reliability [10,46,47], which could potentially be improved through automation.
Following the visual assessment, the images were stored in folders that were created and named according to the four-digit codes, representing the first dataset used for analysis, hereafter referred to as the Posture dataset. Based on these four-digit codes, action categories were identified, and the images were copied into four folders corresponding to these action categories, forming a second dataset for analysis, hereafter referred to as the Action dataset. Table 1 shows the distribution of images across action categories, while Supplementary Table S1 presents the data distribution across postural codes. As illustrated in Table 1 and Table S1, there was a class imbalance in the data, which is typical for most forest operations, where the distribution of postural categories is heavily influenced by the characteristics of the tasks performed. In total, 26 four-digit codes were identified; however, due to the presence of single instances in some of them, the respective folders were removed to ensure compatibility with the requirements of the software used. The final dataset for analysis comprised 5001 images distributed according to the posture of the motor-manual worker in both the Posture and Action datasets.

Table 1.
Frequency of the action categories identified in the dataset used for machine learning.
2.3. Classification by Embedding and Machine Learning
2.3.1. Software and Embedders Used
Orange Visual Programming software version 3.36 (https://orangedatamining.com/ (14 October 2024) was used to develop, train, and test the machine learning models for classification. The software offers several benefits, including a visual interface; the integration of commonly used machine learning models; and, more importantly, the ability to create widget-based workflows. A description of the main functionalities is provided on the dedicated web page and in Demšar et al. [48]. Recently, the software has been equipped with widgets for image analytics and the functionalities required for image embedding and transfer learning, which can be coupled with a conventional classifier that runs locally [38]. Specifically, the software supports loading class-level image data, embedding and visualizing images based on their similarities, tuning the architecture and hyperparameters of local machine learning classifiers, and evaluating the accuracy of the results. This version (3.36) supports several embedders, such as Inception V3 [49], SqueezeNet [46], VGG16 [50], VGG19 [51], Painters [38], DeepLoc [52], and OpenFace [53]. SqueezeNet, which is a shallow deep neural network, operates on a local machine, while the other networks require a dedicated server [38].
The basic workflow used in this study was adapted from Godec et al. [38] and from the widget catalog of Orange Visual Programming software 3.36 (https://orangedatamining.com/widget-catalog/ (14 October 2024). This workflow was utilized to import the images, retrieve their vector representations, train and test the local classifier by tuning its architecture and hyperparameters, obtain the main outcomes of classification performance, and save the best-performing models. A description of the model is included in Figure S1, while Figure S2 illustrates the workflow used for data visualization and comparison.
Two image embedders, namely, Google’s Inception V3 and SqueezeNet, were used to obtain the vector representation of the images contained in the two datasets. Google’s Inception V3 is a 42-layer CNN architecture designed to improve the computational efficiency and performance of computer vision tasks [49,53] by introducing modifications to previous inception architectures [53,54]. SqueezeNet is a series network model with an 18-layer depth that processes input images at a resolution of 227 × 227 [55,56]. The model comprises layers referred to as “fire modules”, which specialize in processing input features through compression [57] and expansion operations utilizing resolution filters [53,55,56].
2.3.2. Workflow Used to Tune the Architecture and Hyperparameters of the Local Classifier
An artificial neural network, in the form of a multilayer perceptron with backpropagation, is currently supported by Orange Visual Programming (https://orangedatamining.com/widget-catalog/model/neuralnetwork/ (14 October 2024). The approach used to determine the best architecture and tune the hyperparameters aimed at achieving optimal classification results was trial and error. Given that the classifier’s architecture is manageable in terms of the number of layers and the neurons within them, the models were trained and tested using 1, 2, 3, 5, and 10 layers for each dataset and embedder. For the neurons, across each dataset, embedder, and number of layers, 10, 100, and 1000 neurons were utilized. Additional tests were conducted with 10,000 neurons per layer; however, these primarily resulted in increased computation time without significant improvements in accuracy. As a result, this architecture option was abandoned after three tests were performed on the Inception V3 vector representations derived from the Action data.
Other tunable options for the neural network include the activation function, solver, regularization term, and number of iterations. The ReLU (Rectified Linear Unit) is one of the most popular activation functions due to its effectiveness in addressing nonlinear problems [58,59], and it was chosen as the standard for the analyzed data. This function is used in conjunction with the stochastic gradient descent-based optimizer (Adam), which is preferred for its low training costs [60]. The number of iterations was kept at the maximum allowed by the software, specifically 1,000,000 iterations. For each dataset, embedder, number of hidden layers, and neurons, the regularization term was successively set to 0.0001, 0.001, and 0.01, based on the classification outcomes associated with this parameter [61].
Testing and scoring were performed via stratified random sampling using the dedicated widget of the software. Random sampling splits the data into training and testing datasets in a specified proportion, which can be set in advance. A proportion of 90% for training and 10% for testing was used. When no customized data preprocessors are set and linked to the neural network widget of the software, it implements a standard data preprocessing workflow that removes instances with unknown values, continuizes categorical variables, removes empty columns, imputes missing values with mean values, and normalizes the data by centering it to the mean and scaling it to a standard deviation of 1 (https://orangedatamining.com/widget-catalog/model/neuralnetwork/ (24 October 2024)).
By utilizing various architectures and hyperparameter variations, a total of 180 models were trained and tested with the aim of identifying the best-performing image embedder, architecture, and hyperparameters for each dataset (Posture and Action). Of these, 90 models were run for the Posture dataset, and 90 models were run for the Action dataset. For each dataset, half of the models employed Google’s Inception V3 embedder, while the other half used the locally running SqueezeNet embedder. The accuracy of the models was evaluated based on the validation outcomes, and the best-performing models were saved.
A different set of unseen data was prepared for testing, containing 406 images collected in the same area and for the same operations, but from different perspectives and angles of rotation. A total of 397 of these images were used to test the postural classification models, while all of them were used for testing the action-level models. These images were fed successively, in groups belonging to the same posture or action category, into the four saved models. Of these, two were designed to classify posture (the best Inception V3 and SqueezeNet-based neural networks for the Posture dataset), while the remaining two classified the action category (the best Inception V3 and SqueezeNet-based neural networks for the Action dataset). The workflow used to make predictions is shown in Figure S3, and the frequencies of instances by posture and action categories are presented in Tables S4 and S5. The correct predictions were counted based on those fed to the models by posture and action category, and the classification accuracy was computed on this basis.
Several metrics described in the literature support the evaluation of classification performance [62,63]. Orange Visual Programming allows for the computation of various metrics through its “test and score” and “predictions” widgets. These metrics include training and testing time, area under the ROC curve, classification accuracy, F1 score, precision, and recall. These parameters were used for a general evaluation of model performance and are reported in Tables S2 and S3. As the main results of training and validation, classification accuracy, F1 score, precision, and recall were reported. However, to determine the best-performing models to be saved for each dataset following the training and validation steps, classification accuracy was used, as it reflects the percentage of correct predictions [63]. Additionally, to evaluate the models on unseen data, classification accuracy was again employed as the metric of classification performance. The computer platform used for this study was a Dell Alienware 17 R3, equipped with Windows 10 Home (Microsoft, 2024) and an Intel® Core™ i7-6700HQ CPU running at 2.60 GHz (2592 MHz), featuring 4 cores and 8 logical processors, along with 16 GB of installed RAM.
3. Results
3.1. Accuracy of the Models on the Posture Dataset
The main results of the classification accuracy metrics based on the Posture dataset are shown in Figure 2, Figure 3, Figure 4 and Figure 5. For the two image embedders used, the classification accuracy, F1 score, precision, and recall reached their peak values for different architectures and hyperparameter settings of the local neural network classifier. The best-performing models for the Inception V3 image embedder achieved a maximum classification accuracy of 0.836 with a neural network architecture featuring two hidden layers of 1000 neurons each. For SqueezeNet, the top classification accuracy was 0.820, achieved with a neural network architecture similar to that used for Inception V3. Similar findings in terms of architecture and hyperparameter settings were obtained for the F1 score, precision, and recall, which were recorded as 0.830 and 0.816, 0.832 and 0.815 for Inception V3, and 0.836 and 0.820 for SqueezeNet. For the Inception V3 embedder, the highest classification accuracy was achieved with a learning rate of α = 0.0001, whereas the top classification accuracy for SqueezeNet was achieved with α = 0.001. The classification accuracy, along with the other selected metrics, showed some variability depending on the architecture and hyperparameter settings used for the neural network (Table S2). In general, neural network architectures containing 100 and 1000 neurons performed better.
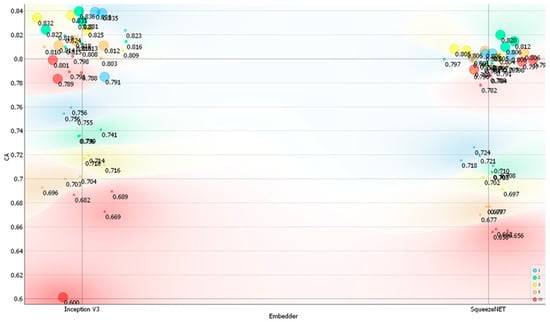
Figure 2.
Classification accuracy (CA) on the Posture dataset depending on the embedder used, the number of layers, and the number of neurons per layer. Legend: size of the data points represents the number of neurons used (small—10 neurons, medium—100 neurons, and large—1000 neurons) and color represents the number of layers used (red—ten, orange—five, yellow—three, green—two, and blue—one).
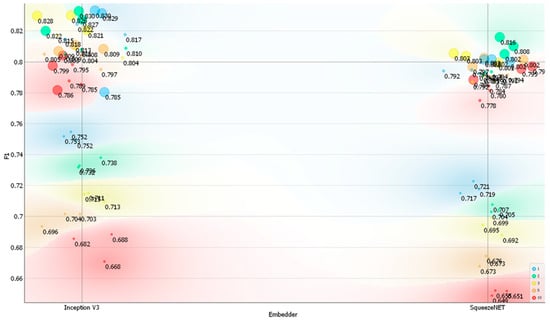
Figure 3.
F1 score (F1) on the Posture dataset depending on the embedder used, the number of layers, and the number of neurons per layer. Legend: size of the data points represents the number of neurons used (small—10 neurons, medium—100 neurons, and large—1000 neurons) and color represents the number of layers used (red—ten, orange—five, yellow—three, green—two, and blue—one).
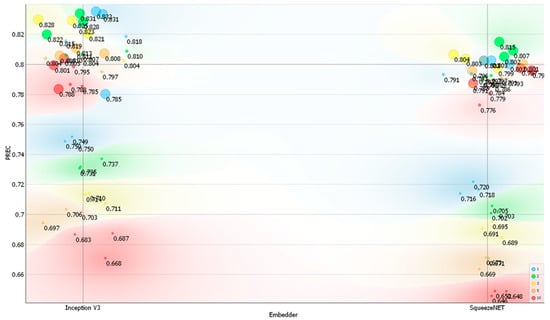
Figure 4.
Precision (PREC) on the Posture dataset depending on the embedder used, the number of layers, and the number of neurons per layer. Legend: size of the data points represents the number of neurons used (small—10 neurons, medium—100 neurons, and large—1000 neurons) and color represents the number of layers used (red—ten, orange—five, yellow—three, green—two, and blue—one).
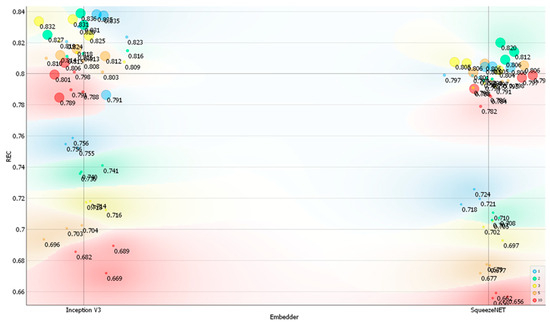
Figure 5.
Recall (REC) on the Posture dataset depending on the embedder used, the number of layers, and the number of neurons per layer. Legend: size of the data points represents the number of neurons used (small—10 neurons, medium—100 neurons, and large—1000 neurons) and color represents the number of layers used (red—ten, orange—five, yellow—three, green—two, and blue—one).
As shown in Figure 2, the classification accuracy of the Posture dataset reached 84% when Google’s Inception V3 embedder was used. Figure S4 illustrates the confusion matrix for this embedder, indicating that correct class-level predictions varied between 33% and 100%. This performance was superior to that of the neural network utilizing vector representations extracted by the SqueezeNet embedder, which struggled to classify some of the posture class-level data (Figure S5).
3.2. Accuracy of the Models on the Action Dataset
The classification accuracies of the models on the Action dataset are presented in Figure 6, Figure 7, Figure 8 and Figure 9. Regarding classification accuracy, F1 score, precision, and recall, the two image embedders performed similarly, achieving top classification accuracies and recalls of 0.888–0.889 and a F1 score and precision of 0.886. Although the classification accuracies were similar for both embedders, the primary differences in the neural network architectures that led to these comparable results were related to the number of hidden layers. The Inception V3 image embedder achieved its highest classification accuracy (CA = 0.889) with one hidden layer containing 1000 neurons, while SqueezeNet reached a maximum classification accuracy (CA = 0.888) with a design featuring two hidden layers of 1000 neurons each. In both cases, the optimal performances regarding classification accuracy were obtained with a learning rate of α = 0.001. Variability was observed in classification accuracy and the other three selected metrics, attributed to the neural network architecture and hyperparameter settings (Table S3). Nevertheless, for both image embedders, the accuracy metrics surpassed 80%, regardless of the architecture and hyperparameter configurations used.

Figure 6.
Classification accuracy (CA) on the Action dataset depending on the embedder used, the number of layers, and the number of neurons per layer. Legend: size of the data points represents the number of neurons used (small—10 neurons, medium—100 neurons, and large—1000 neurons) and color represents the number of layers used (red—ten, orange—five, yellow—three, green—two, and blue—one).
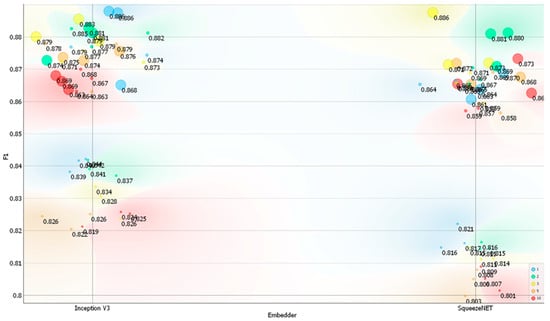
Figure 7.
F1 score (F1) on the Action dataset depending on the embedder used, the number of layers, and the number of neurons per layer. Legend: size of the data points represents the number of neurons used (small—10 neurons, medium—100 neurons, and large—1000 neurons) and color represents the number of layers used (red—ten, orange—five, yellow—three, green—two, and blue—one).
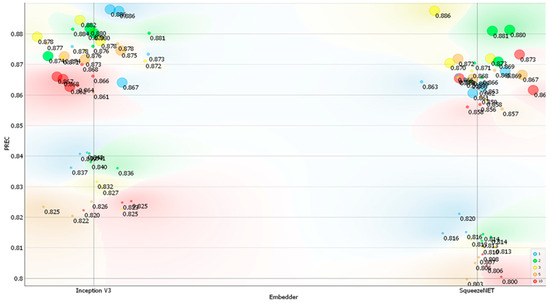
Figure 8.
Precision (PREC) on the Action dataset depending on the embedder used, the number of layers, and the number of neurons per layer. Legend: size of the data points represents the number of neurons used (small—10 neurons, medium—100 neurons, and large—1000 neurons) and color represents the number of layers used (red—ten, orange—five, yellow—three, green—two, and blue—one).
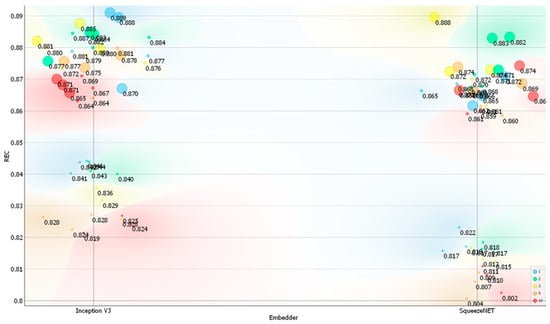
Figure 9.
Recall (REC) on the Action dataset depending on the embedder used, the number of layers, and the number of neurons per layer. Legend: size of the data points represents the number of neurons used (small—10 neurons, medium—100 neurons, and large—1000 neurons) and color represents the number of layers used (red—ten, orange—five, yellow—three, green—two, and blue—one).
The training time depended on both the architecture used for the neural network and the learning rate set during the trial-and-error experiments. The best-performing models based on the Inception V3 and SqueezeNet embedders took approximately 23 min and 22 min to train, respectively. Testing required less than 5 s for each of the developed models, and the total computing time to train and test all the models was approximately 21 h. For both embedders, there was a noticeable differentiation in the classification metrics, with two distinct groups emerging for each embedder (Figure 6, Figure 7, Figure 8 and Figure 9). In general, models with only 10 neurons per layer performed the worst, achieving a classification accuracy between 0.800 and 0.850. However, SqueezeNet’s performance was inferior to that of Inception V3 for this number of neurons (Figure 6, Figure 7, Figure 8 and Figure 9).
Compared to the Posture dataset, the performance of the models on the Action dataset was typically higher in terms of classification accuracy. The differences in top classification accuracies between the Action and Posture datasets were 5.3% for Inception V3 and 6.8% for SqueezeNet, respectively. The improved classification accuracy on the Action dataset may be attributed to its lower classification complexity, as the task comprised only four classes. For the Action dataset, classification accuracy reached nearly 90% for both image embedders, making these results very competitive compared to other similar deep learning applications [54,64]. Conversely, the slightly lower performance of SqueezeNet may stem from its design as a shallow neural network.
Figures S6 and S7 display the confusion matrices for the classification of the Action dataset using the best neural networks with Google’s Inception V3 and SqueezeNet vector representations of the images. The correct prediction rates by Google’s Inception V3 on the action data ranged from 70.6% to 91.4%. The proportions at the action category level were similar to those obtained using embeddings from SqueezeNet, which ranged from 70.4% to 91.3%.
3.3. Model Performance on Unseen Data
Table 2 presents the results of applying the trained models to unseen data. The classification performance decreased, with predicted classification accuracies ranging from 49% to 52% for the posture data and from 51% to 60% for the action category data.
Table 2.
Performance of the models on unseen data.
The lower classification performance on unseen data suggests that the training and validation datasets may not have been fully representative of the real-world data distribution. Key factors contributing to this performance gap may include domain shifts and data scarcity as specific to this study.
4. Discussion
This study evaluated the effectiveness of image embedding and transfer learning in facilitating precise postural classification in forest operations using a dataset characterized by challenges such as crowding, occlusion, missing data, and class imbalance. The objectives were to determine the feasibility of image-based postural classification via the OWAS method through image embedding and transfer learning, as well as to identify the most suitable embedder for such tasks. By rigorously tuning hyperparameters, visualizing data, and calculating accuracy metrics, this study successfully demonstrated the viability of image-based postural classification through these techniques.
The performance of the models on unseen data showed a classification accuracy range of 49% to 52% for posture data and 51% to 60% for action category data. Previous studies have highlighted the strengths of deep learning models and their ability to facilitate multiclass classifications [65]. Joshi et al. [66] noted that neural networks demonstrate greater efficiency as the quantity of data increases, unlike other classifiers, which often plateau in performance beyond a certain data threshold. For instance, Ogundokun et al. [54] reported an accuracy exceeding 74% for human posture identification using InceptionV3. Similarly, Tiwari et al. [67] employed a dataset of yoga postures with Inception V3 embedding and achieved a classification accuracy of 94.33%, underscoring the model’s versatility. Joshi et al. [66] also leveraged Inception V3 for feature extraction in sports category classification, attaining an average accuracy of 96.64% across six categories, further demonstrating the model’s effectiveness when provided ample data. Iandola et al. [55] highlighted the efficiency of SqueezeNet in terms of model size and computational performance, achieving competitive accuracy rates while reducing complexity. In detecting human activity types from 3D posture data, SqueezeNet achieved an overall accuracy of 83.33% [56]. In contrast, Tiwari et al. [67] found that the SqueezeNet embedding method reached the highest classification accuracy of 95.14%, exemplifying its effectiveness in domain-specific contexts. A comparison of these studies with the current study reveals lower performance outcomes, highlighting areas for potential improvement in model accuracy. The findings emphasize the importance of dataset size and diversity in enhancing machine learning model efficiency, with neural networks exhibiting increased efficacy with larger data inputs. Thus, the results of this study suggest that dataset augmentation or model fine-tuning could help align performance more closely with established benchmarks.
ShuffleNet and Inception V3 are powerful CNNs known for their efficiency and performance in image classification. However, several studies have shown that the performance of deep learning models on multiclass classification tasks can vary significantly depending on model architecture, hyperparameters, and dataset characteristics [65,68]. Even the most sophisticated models are sensitive to the quality and characteristics of the training data [68,69,70]. In this study, the major challenges related to the datasets used included class imbalance, image crowding, and occlusion—common issues encountered in various machine learning applications, particularly in computer vision tasks [40,68,69,70,71,72].
Class imbalance refers to a scenario in which the distribution of classes in a dataset is highly skewed, with the number of samples in the majority classes exceeding that of the minority classes [68,72]. This imbalance can lead to models exhibiting bias toward the majority classes, thereby disregarding the minority classes and detrimentally impacting classification performance [68,69,72,73]. Addressing this issue may involve techniques such as data augmentation to synthetically increase the volume of minority classes [28,39], or exploring cost-sensitive learning algorithms that penalize misclassified minority classes more heavily [69], which were not implemented in this study. To offset the skewed distributions of classes and instances in multi-instance learning, both cost-sensitive and standard resampling methods have been utilized in previous studies by Mera et al. [74] and Wang et al. [64]. However, effective imbalanced learning from multilabel and multi-instance data remains an ongoing challenge that requires further development and research.
The performance degradation of the models could also stem from challenging instances, especially within the minority class, as highlighted by Kubat et al. [70]. Recent research by Napierala and Stefanowski [75] highlights imbalanced datasets from the perspective of minority class structure and introduces innovative proposals to expand the understanding of the inherent difficulties within the dataset. In tasks involving multiclass classification, potential challenges such as class overlap, label noise, and vague class boundaries emphasize the critical role of thorough data preprocessing and sampling techniques [70]. In this study, ensuring balanced model performance across all classes required tailored cleaning and other preprocessing procedures that accounted for the unique characteristics of each class [75]. These customized strategies play a pivotal role in overcoming the complexities of imbalanced datasets and optimizing model outcomes.
Moreover, image crowding occurs when objects in an image are closely packed or overlapping, which hinders the correct identification and localization of individual objects [39]. Addressing image crowding often involves data augmentation techniques [28,39], such as random cropping, padding, or brightness adjustments. Adding noise can also increase the diversity of the training data and enhance the model’s ability to handle variations and occlusion [76]. When parts of the target postures are obscured in the images (occlusion), the model receives incomplete information, making accurate classification difficult [22,77,78]. Occlusion can lead to features being misclassified or not detected, ultimately hindering performance [22,78,79]. Possible solutions for future research include exploring more robust feature extraction techniques that are less susceptible to occlusion [22,78], such as those based on deformable parts models [58] or employing training strategies that artificially introduce occlusion during training to improve the model’s robustness [22,79].
Furthermore, the lower performance on the unseen dataset compared to the validated dataset can potentially be attributed to the differences in domains between the two datasets [80,81,82], leading to a mismatch in the underlying patterns and features that the models have learned. When models are trained on specific data distributions and then tested on unseen data that vary significantly from the training distribution, performance tends to decrease [82]. Additionally, the training and validation datasets may have been insufficient in size to fully capture the complexity and variability of real-world data [83]. This limitation could have impeded the generalizability of the model. This disparity underscores the importance of having a diverse and representative dataset for training and validation purposes. By incorporating a larger and more varied dataset during the training phase, models can better generalize to new, unseen data, thereby improving their performance in real-world scenarios. Adequate data representation is crucial for ensuring that models learn robust and reliable patterns that can be effectively applied across different domains. The need for more comprehensive datasets becomes particularly evident when higher accuracy rates and consistent model performance outside the training environment are desired [37].
While the classification accuracy achieved in this study might seem initially discouraging, consideration of the significant limitations of manual postural assessment methods is important [10,36,84], which often serve as the ground truth for these tasks. Despite being considered the “gold standard”, manual assessments suffer from inherent subjectivity and variability, which limits their reliability [10,36,85]. Interrater reliability, which measures the agreement between different assessors evaluating the same posture [46,86,87], is often disappointingly moderate or low [46]. For example, a study by Lins et al. [46] investigating the interrater reliability of the OWAS method for individual postures reported low agreement for the back (“twisted” and “bent and twisted”) and the lower limbs (“load on a straight leg” and “load on bent leg”). Similarly, Rhén and Forsman [87] reported that the interrater reliability of the OCRA checklist method was moderately reliable in a study of video-recorded manual work tasks. This lack of consistency might arise from factors such as varying experience levels, subjective interpretations of postural deviations, and even subtle differences in measurement techniques and confusion in terms of perception among raters [46,86]. Furthermore, intrarater reliability, which assesses the consistency of a single assessor over repeated evaluations [87], also presents challenges. Even when the same assessor evaluates the same posture multiple times, variations can arise due to factors such as fatigue, memory bias, or even slight changes in the subject’s position [86]. A study by Rhén and Forsman [87] highlighted this issue, reporting average intrarater agreement for visual postural assessments as low as 45%, indicating poor agreement. In a study by Eliasson et al. [86] to evaluate the inter- and intraobserver reliability of risk assessments of the upper body, without the use of an explicit observational method, kappa statistics showed nonacceptable inter- and intrareliability. These low interrater and intrarater reliability values underscore the inherent limitations of manual postural assessments. While they provide valuable insights, their subjective nature introduces uncertainty and variability [86]. This subjectivity may have caused potential discrepancies in the assessment, possibly due to the limited rating space that distinguishes between distinct postures [88]. The presence of subjective assessments could elucidate the challenges encountered in the performance of unseen data within action categories 2 and 4, as well as across certain posture classes. This inherent limitation reinforces the need for more objective and reliable methods for postural assessment. For example, assessing static standing posture via noninvasive, user-friendly, and affordable posture-assessing software (PostureScreen Mobile®) yielded repeatable measures for anatomical landmarks that were found to have substantial or almost perfect inter- and intrarater agreement [89]. Therefore, even though this automated approach may not have reached the desired accuracy levels yet, it holds significant potential for improvement and ultimately surpasses the limitations of manual methods. By iteratively refining the Inception v3 and ShuffleNet embedders used in this study and addressing the challenges posed by the Posture datasets, it is possible to work toward a more objective, consistent, and potentially more accurate approach to postural assessment.
While the study has provided valuable insights and promising results, several limitations should be acknowledged. First, the study tested only a limited number of image embedders and one conventional classifier. This restrained approach may not fully capture the diversity of techniques available, potentially limiting the generalizability of the findings [37]. Second, the scope of hyperparameter tuning was limited to a few aspects, such as activation functions and solvers. Exploring a broader range of hyperparameters and optimization strategies could enable further improvements in model performance [90]. Furthermore, the study focused primarily on certain deep learning models such as Inception v3 and ShuffleNet, disregarding the potential benefits that could arise from experimenting with a wider array of models. Moreover, the evaluation was conducted on a specific dataset with unique characteristics. Generalizing the findings to diverse datasets or real-world applications may pose challenges due to dataset-specific nuances and biases [91]. Highlighting the initial data labeling effort required to develop a task-specific model, which enables the model to effectively utilize any amount of data from the same task, is essential. Vallabhaneni and Prabhavathy [37] highlighted that pretrained network models necessitate a significant and varied dataset to achieve satisfactory results. Nonetheless, this process proved to be challenging in this study because of the considerable effort and time required for gathering and labeling large datasets. Moreover, deep-learning-based computer vision techniques may require multiple stages that are computationally intensive, such as noise removal, image resizing, data partitioning, feature extraction, and classification, making them resource intensive [37]. Last, the study did not delve deeply into the computational complexity and efficiency aspects of the chosen models [37], which are essential considerations for practical deployment and scalability in real-world scenarios [84]. Addressing these limitations in future research can enable a more robust and comprehensive understanding of the classification methods and their practical implications.
Future studies should focus on balancing the effort in annotating data with achieving accuracy on unseen data. This presents an opportunity for significant benefits to be derived within the context of postural evaluation methods. Given that only two embedders and one conventional classifier were tested in this study, future studies should explore the potential for increased accuracy when the remaining image embedders are used. Investigating other ways for enhancement, such as hyperparameter tuning involving different solvers/optimizers and activation functions, would be beneficial [92,93,94,95]. Additionally, a thorough evaluation of the effectiveness of various modern machine learning algorithms, including random forests, support vector machines, gradient-boosted decision trees, deep pretrained CNNs, generative adversarial networks, and vision transformers, in learning from imbalanced computer vision datasets [72], such as those utilized in this study, could reveal novel prospects for improving performance and extending the scope of the study. As Saini and Susan [72] noted, most of these models employ either data-level manipulation, such as data augmentation, or cost-sensitive learning, such as loss functions, or a combination of both tactics. Thus, incorporating different models may offer unique insights and potentially enhance classification accuracy [72]. By delving into these aspects, a more comprehensive evaluation of different models and hyperparameters can allow a deeper understanding and refinement of the classification system.
5. Conclusions
Many forest operations are carried out manually and potentially expose workers to work-related disorders, which are believed to be caused by postural conditions. Among the methods used to assess postural conditions, the OWAS is typically used in forest operations because of its many benefits. This study proposes a novel method to automate the process of postural classification in motor-manual work via the OWAS while saving resources. By leveraging image embedding and transfer learning, this study provides a new approach to training an accurate postural classification model using only image data, thus avoiding the need for expensive sensors and time-consuming manual labeling. Collectively, the findings prove that i) classifying complex problems such as those of postural assessment can be performed with remarkable accuracy (84%–89%), via an easy-to-use visual platform that uses embedding-based transfer learning coupled with a local classifier; ii) it is possible, with less effort, to reconfigure deep learning networks to solve the problem of accurate postural classification with important savings in resources and with less expertise; and iii) the learned image representations may be less effective on unseen data (50%–60%) when the domain distribution of unseen data is highly different from that used to learn. The proposed method can potentially reduce the cost of ergonomic assessments and improve the accuracy of injury risk assessments in a range of industries, making it an important contribution to the fields of occupational health and safety. Moreover, the approach used for this study can be applied to various computer vision tasks in forest operations, including different postural evaluation methods. Future studies should be aimed at increasing accuracy by testing other image embedders and machine learning classifiers.
Supplementary Materials
The following supporting information can be downloaded at https://www.mdpi.com/article/10.3390/f16030492/s1. Figure S1. The workflow used to develop, train, test and save the best performing models. Legend: 1—Import Images widget, used to load the folder-based images for Posture and Action datasets, 2—Image Embedding widget, used to embed the Posture and Action images on a server by Google’s Inception V3 deep network, as well as locally using the SqueezeNet, 3—Neural Network widget which was tuned in terms of architecture and hyperparameters for each dataset and embedder used (number of hidden layers was set successively at 1, 2, 3, 5 and 10, and for each number of hidden layers a number of 10, 100 and 1000 neurons were used, number of iterations was kept constant at the maximum enabled by the software, which was 1,000,000, activation function used was ReLu, solver used was Adam, and regularization parameter for each number of layers and neurons was set successively at α = 0.0001, 0.001 and 0.01), 4—Test and Score widget which was set at a 20-fold cross validation by splitting the initial data in 90% for training and 10% for testing, and then used to retrieve the main classification metrics, 5—Confusion Matrix widget which was used to extract the confusion matrix for each best performing model of the two embedders used on Posture and Action datasets, 6—Save Model widget which was used to save the best performing models by dataset and embedder used. Figure S2. The workflow used to visualize the results of training and testing. Legend: 1—File widget used to load an Excel-based file containing the descriptive codes of the datasets, embedders, architecture, and hyperparameters as well as numerical values of the classification accuracy metrics, 2—Color widget used to tune the color outputs as a function of the main parameters, 3- Scatter Plot widget used to plot the main classification accuracy metrics depending on dataset, embedder, architecture of the network and tuned hyperparameters. Figure S3. The workflow used to classify unseen data. Legend: 1—Import Images widget used to retrieve the unseen image data from Posture and Action folders, 2—Image Embedding widget used to get the vector representation of the images by setting it successively at Google’s Inception V3 and SqueezeNet, respectively, 3—Predictions widget which was used to make predictions successively on unseen data based on 4—Loading Model widget that was used to load successively the four best performing models. Note: each of the best performing model was run to make predictions on its corresponding dataset and image embedder. Figure S4. Confusion matrix of the best performing model during training and testing based on Google’s Inception V3 vector representation on Posture dataset. Figure S5. Confusion matrix of the best performing model during training and testing based on SqueezeNet vector representation on Posture dataset. Figure S6. Confusion matrix of the best performing model during training and testing based on Google’s Inception V3 vector representation on Action dataset. Figure S7. Confusion matrix of the best performing model during training and testing based on SqueezeNet vector representation on Action dataset. Table S1. Frequency of postures identified in the dataset used for analysis by the four-digit code. Table S2. Model architecture, hyperparameter tuning and performance metrics of the Posture dataset, classification accuracy (CA), F1 score (F1), precision (PREC) and recall (REC) were reported. Table S3. Model architecture, hyperparameter tuning and performance metrics of the Action dataset classification accuracy (CA), F1 score (F1), precision (PREC) and recall (REC) were reported. Table S4. Frequency of postures in the unseen data based on the four-digit code. Table S5. Frequency of action categories in the unseen data.
Author Contributions
Conceptualization, S.A.B. and N.K.; methodology, S.A.B. and N.K.; software, S.A.B. and G.O.F.; formal analysis, S.A.B. and G.O.F.; investigation, S.A.B. and G.O.F.; writing—original draft preparation, S.A.B., G.O.F., and T.K.; writing—review and editing, S.A.B., G.O.F., and T.K.; visualization, S.A.B.; supervision, N.K.; project administration N.K., resources N.K.; funding acquisition, N.K. All authors have read and agreed to the published version of the manuscript.
Funding
This project is funded by National Research Council of Thailand (NRCT) and Kasetsart University: contract number N42A670571. Some of the funds required to carry out this study were provided from a grant from the Ministry of Research, Innovation and Digitization, CNCS/CCCDI–UEFISCDI, project number PN-IV-P8-8.1-PRE-HE-ORG-2023-0141, within PNCDI IV, which supported the study by providing the computers required to run the models.
Data Availability Statement
The datasets used and/or analyzed during the current study are available from the corresponding author upon reasonable request.
Acknowledgments
The authors acknowledge the support of the Department of Forest Engineering, Forest Management Planning and Terrestrial Measurements, Faculty of Silviculture and Forest Engineering, Transilvania University of Brasov, for providing the computing services required to develop and run the models in this study.
Conflicts of Interest
The authors declare no conflicts of interest.
References
- Lundbäck, M.; Häggström, C.; Nordfjell, T. Worldwide trends in methods for harvesting and extracting industrial roundwood. Int. J. For. Eng. 2021, 32, 202–215. [Google Scholar] [CrossRef]
- Rhee, K.Y.; Choe, S.W.; Kim, Y.S.; Koo, K.H. The trend of occupational injuries in Korea from 2001 to 2010. Saf. Health Work 2013, 4, 63–70. [Google Scholar] [CrossRef] [PubMed]
- Social Security Office. Occupational Accident Statistics and Sicknesses. 2015. Available online: https://www.sso.go.th/wpr/assets/upload/files_storage/sso_th/32ad74534d1c43ed7e322128308ec49f.pdf (accessed on 2 August 2024).
- Noor, J.; Syafinie, M.; Marinah, M.; Najidah, M.; Juliana, Y.; Nasrul, A.A. Occupational accidents in forestry and agricultural sectors in Malaysia. Borneo J. Sci. Technol. 2021, 3, 16–19. [Google Scholar]
- Hălălisan, A.F.; Popa, B.; Borz, S.A.; Abrudan, I.V. Health and Safety Issues in Romanian Forests: Findings from FSC Certification Audits. Forest 2022, 13, 714. [Google Scholar] [CrossRef]
- Lindroos, O.; Burström, L. Accident rates and types amoung self-employed private forest owners. Accid. Anal. Prev. 2010, 42, 1729–1735. [Google Scholar] [CrossRef]
- Tsioras, P.A.; Khooshdonbat, M.; Nikooy, M.; Naghdi, R.; Heidari, M. The impact of body posture on heart rate strain during tree felling. Int. J. Environ. Res. Public Health 2022, 19, 11198. [Google Scholar] [CrossRef]
- Cheţa, M.; Marcu, M.V.; Borz, S.A. Workload, exposure to noise, and risk of musculoskeletal disorders: A case study of motor-manual tree feeling and processing in poplar clear cuts. Forests 2018, 9, 300. [Google Scholar] [CrossRef]
- Robb, W.; Zemánek, T.; Kaakkurivaara, N. An analysis of chainsaw operator safety between Asian and European countries. Croat. J. For. Eng. 2022, 43, 373–389. [Google Scholar] [CrossRef]
- David, G.C. Ergonomic methods for assessing exposure to risk of factors for work-related musculoskeletal disorders. Occup. Med. 2005, 55, 190–199. [Google Scholar] [CrossRef]
- Brandl, C.; Mertens, A.; Schlick, C.M. Effect of sampling interval on the reliability of ergonomic analysis using the Ovako working posture analysis system. Int. J. Ind. Ergon. 2017, 57, 68–73. [Google Scholar] [CrossRef]
- Castro Pérez, S.N.; Borz, S.A. Improving the Event-Based Classification Accuracy in Pit-Drilling Operations: An Application by Neural Networks and Median Filtering of the Acceleration Input Signal Data. Sensors 2021, 21, 6288. [Google Scholar] [CrossRef]
- Mathiassen, S.E. Diversity and variation in biomechanical exposure: What is it, and why would we like to know? Appl. Ergon. 2006, 37, 419–427. [Google Scholar] [CrossRef]
- Forkuo, G.O. A systematic survey of conventional and new postural assessment methods. Rev. Pădurilor 2022, 138, 1–34. [Google Scholar]
- Jiang, X.; Hu, Z.; Wang, S.; Zhang, Y. A survey on artificial intelligence in posture recognition. CMES-Comp. Model. Eng. 2023, 137, 35. [Google Scholar]
- Ma, N.; Wu, Z.; Cheung, Y.M.; Guo, Y.; Gao, Y.; Li, J.; Jiang, B. A survey of human action recognition and posture prediction. Tsinghua Sci. Technol. 2022, 27, 973–1001. [Google Scholar] [CrossRef]
- Zheng, C.; Wu, W.; Chen, C.; Yang, T.; Zhu, S.; Shen, J.; Kehtarnavaz, N.; Shah, M. Deep learning-based human pose estimation: A survey. ACM Comput. Surv. 2023, 56, 1–37. [Google Scholar] [CrossRef]
- Alzubaidi, L.; Zhang, J.; Humaidi, A.J.; Al-Dujaili, A.; Duan, Y.; Al-Shamma, O.; Santamaría, J.; Fadhel, M.A.; Al-Amidie, M.; Farhan, L. Review of deep learning: Concepts, CNN architectures, challenges, applications, future directions. J. Big Data 2021, 8, 53. [Google Scholar] [CrossRef]
- Pak, M.; Kim, S. A review of deep learning in image recognition. In Proceedings of the 2017 4th International Conference on Computer Applications and Information Processing Technology (CAIPT), Kuta Bali, Indonesia, 8–10 August 2017; IEEE: Piscataway, NJ, USA, 2017; pp. 1–3. [Google Scholar]
- Raj, R.; Kos, A. An improved human activity recognition technique based on convolutional neural network. Sci. Rep. 2023, 13, 22581. [Google Scholar] [CrossRef]
- Zhang, J.; Cao, J.; Chang, J.; Li, X.; Liu, H.; Li, Z. Research on the application of computer vision based on deep learning in autonomous driving technology. arXiv 2024. [Google Scholar] [CrossRef]
- Zeiler, M.D.; Fergus, R. Visualizing and understanding convolutional networks. In Proceedings of the Computer Vision–ECCV 2014: 13th European Conference, Zurich, Switzerland, 6–12 September 2014; Proceedings, Part I 13. Springer International Publishing: Cham, Switzerland, 2014; Volume 8689, pp. 818–833. [Google Scholar]
- Talaat, A.S. Novel deep learning models for yoga pose estimator. SN Appl. Sci. 2023, 5, 341. [Google Scholar] [CrossRef]
- Upadhyay, A.; Basha, N.K.; Ananthakrishnan, B. Deep learning-based yoga posture recognition using the Y_PN-MSSD model for yoga practitioners. Healthcare 2023, 11, 609. [Google Scholar] [CrossRef]
- Acharya, A. 9 Ways to Balance Your Computer Vision Dataset. Encord. 2023. Available online: https://encord.com/blog/balance-computer-vision-datasets/ (accessed on 11 February 2025).
- Ali, A.; Shamsuddin, S.M.; Ralescu, A.L. Classification with class imbalance problem. Int. J. Adv. Soft Comput. Appl. 2013, 5, 176–204. [Google Scholar]
- Leevy, J.L.; Khoshgoftaar, T.M.; Bauder, R.A.; Seliya, N. A survey on addressing high-class imbalance in big data. J. Big Data 2018, 5, 42. [Google Scholar] [CrossRef]
- Shorten, C.; Khoshgoftaar, T.M. A survey on image data augmentation for deep learning. J. Big Data 2019, 6, 60. [Google Scholar] [CrossRef]
- Pan, S.J.; Yang, Q. A survey on transfer learning. IEEE Trans. Knowl. Data Eng. 2010, 22, 1345–1359. [Google Scholar] [CrossRef]
- Shao, L.; Zhu, F.; Li, X. Transfer learning for visual categorization: A survey. IEEE Trans. Neural Netw. Learn. Syst. 2014, 26, 1019–1034. [Google Scholar] [CrossRef]
- Weiss, K.; Khoshgoftaar, T.M.; Wang, D. A survey of transfer learning. J. Big Data 2016, 3, 9. [Google Scholar] [CrossRef]
- Borz, S.A.; Iordache, E.; Marcu, M.V. Enhancing working posture comparability in forest operations by the use of similarity metrics. Forests 2021, 12, 926. [Google Scholar] [CrossRef]
- Calvo, A. Musculoskeletal disorders (MSD) risks in forestry: A case study to propose an analysis method. Agric. Eng. Int. CIGR J. 2009, 11, 1–9. [Google Scholar]
- Justavino, F.C.; Ramirez, R.J.; Perez, N.M.; Borz, S.A. The use of OWAS in forest operations postural assessment: Advantages and limitations. Bull. Trans. Univ. Bras. Ser. II For. Wood Ind. Agr. Food Eng. 2015, 8, 7–16. [Google Scholar]
- Marogel-Popa, T.; Marcu, M.V.; Borz, S.A. Postural risk in manual planting operations of poplar: Two options compared. Sustainability 2020, 12, 5531. [Google Scholar] [CrossRef]
- Zanuttini, R.; Cielo, P.; Poncino, D. The OWAS Method. Preliminary results for the evaluation of the risk of work-related musculo-skeletrical disorders (WMSD) in the forestry sector in Italy. Forest 2005, 2, 242–255. [Google Scholar] [CrossRef]
- Vallabhaneni, N.; Prabhavathy, P. Segmentation quality assessment network-based object detection and optimized CNN with transfer learning for yoga pose classification for health care. Soft Comput. 2023, 28, 743. [Google Scholar] [CrossRef]
- Godec, P.; Pančur, M.; Ilenič, N.; Čopar, A.; Stražar, M.; Erjavec, A.; Pretnar, A.; Demšar, J.; Starič, A.; Toplak, M.; et al. Democratized image analytics by visual programming through integration of deep models and small-scale machine learning. Nat. Commun. 2019, 10, 4551. [Google Scholar] [CrossRef] [PubMed]
- Cen, F.; Zhao, X.; Li, W.; Wang, G. Deep feature augmentation for occluded image classification. Pattern Recognit. 2021, 111, 107737. [Google Scholar] [CrossRef]
- Kortylewski, A.; Liu, Q.; Wang, H.; Zhang, Z.; Yuille, A. Combining compositional models and deep networks for robust object classification under occlusion. In Proceedings of the IEEE Winter Conference on Applications of Computer Vision (WACV), Snowmass, CO, USA, 1–5 March 2020; pp. 1322–1330. [Google Scholar]
- Kaakkurivaara, N.; Kaakkurivaara, T.; Ketkaew, C.; Sakulya, T.; Borz, S.A. Modelling productivity in extraction operations by simulations based on GNSS documented data: An example from skidding teak wood in Thailand. Bull. Trans. Univ. Brasov Series II For. Wood Ind. Agr. Food Eng. 2022, 15, 13–32. [Google Scholar] [CrossRef]
- Karhu, O.; Kansi, P.; Kuorinka, I. Correcting working postures in industry: A practical method for analysis. Appl. Ergon. 1977, 8, 199–201. [Google Scholar] [CrossRef] [PubMed]
- Spinelli, R.; Aminti, G.; De Francesco, F. Postural risk assessment of mechanised firewood processing. Ergonomics 2016, 60, 375–383. [Google Scholar] [CrossRef]
- Kivi, P.; Mattila, M. Analysis and improvement of work postures in the building industry: Application of the computerised OWAS method. Appl. Ergon. 1991, 22, 43–48. [Google Scholar] [CrossRef]
- Mattila, M.; Karwowski, W.; Vilkki, M. Analysis of working postures in hammering tasks on building construction sites using the computerized OWAS method. Appl. Ergon. 1993, 24, 405–412. [Google Scholar] [CrossRef] [PubMed]
- Lins, C.; Fudickar, S.; Hein, A. OWAS inter-rater reliability. Appl. Ergon. 2021, 93, 103357. [Google Scholar] [CrossRef]
- Janowitz, I.L.; Gillen, M.; Ryan, G.; Rempel, D.; Trupin, L.; Swig, L.; Mullen, K.; Rugulies, R.; Blanc, P.D. Measuring the physical demands of work in hospital settings: Design and implementation of an ergonomics assessment. Appl. Ergon. 2006, 37, 641–658. [Google Scholar] [CrossRef] [PubMed]
- Demšar, J.; Curk, T.; Erjavec, A.; Gorup, Č.; Hočevar, T.; Milutinovič, M.; Možina, M.; Polajnar, M.; Toplak, M.; Starič, A.; et al. Orange: Data mining toolbox in Python. J. Mach. Learn. Res. 2013, 14, 2349–2353. [Google Scholar]
- Szegedy, C.; Vanhoucke, V.; Ioffe, S.; Shlens, J.; Wojna, Z. Rethinking the inception architecture for computer vision. In Proceedings of the IEEE Conference on Computer Vision and Pattern Recognition, Las Vegas, NV, USA, 27–30 June 2016; pp. 2818–2826. [Google Scholar]
- Simonyan, K.; Zisserman, A. Very deep convolutional networks for large-scale image recognition. arXiv 2014. [Google Scholar] [CrossRef]
- Almagro Armenteros, J.J.; Sønderby, C.K.; Sønderby, S.K.; Nielsen, H.; Winther, O. DeepLoc: Prediction of protein subcellular localization using deep learning. Bioinformatics 2017, 33, 3387–3395. [Google Scholar] [CrossRef]
- Baltrušaitis, T.; Robinson, P.; Morency, L.P. Openface: An open source facial behavior analysis toolkit. In Proceedings of the 2016 IEEE Winter Conference on Applications of Computer Vision (WACV), Lake Placid, NY, USA, 7–10 March 2016; IEEE: Piscataway, NJ, USA, 2016; pp. 1–10. [Google Scholar]
- Chen, L.; Li, S.; Bai, Q.; Yang, J.; Jiang, S.; Miao, Y. Review of image classification algorithms based on convolutional neural networks. Remote Sens. 2021, 13, 4712. [Google Scholar] [CrossRef]
- Ogundokun, R.O.; Maskeliūnas, R.; Damaševičius, R. Human posture detection using image augmentation and hyperparameter-optimized transfer learning algorithms. Appl. Sci. 2022, 12, 10156. [Google Scholar] [CrossRef]
- Iandola, F.N.; Han, S.; Moskewicz, M.W.; Ashraf, K.; Dally, W.J.; Keutzer, K. SqueezeNet: AlexNet-level accuracy with 50× fewer parameters and <0.5 MB model size. arXiv, 2016. [Google Scholar] [CrossRef]
- Çalışkan, A. Detecting human activity types from 3D posture data using deep learning models. Biomed. Signal Process. Control 2023, 81, 104479. [Google Scholar]
- Han, S.; Mao, H.; Dally, W.J. Deep compression: Compressing deep neural networks with pruning, trained quantization and Huffman coding. arXiv 2015. [Google Scholar] [CrossRef]
- Maas, A.L.; Hannun, A.Y.; Ng, A.Y. Rectifier nonlinearities improve neural network acoustic models. In Proceedings of the 30th International Conference on Machine Learning, ICML 2013, Atlanta, GA, USA, 16–21 June 2013; Volume 30, p. 3. [Google Scholar]
- Nair, V.; Hinton, G.E. Rectified linear units improve restricted Boltzmann machines. In Proceedings of the 27th International Conference on Machine Learning (ICML-10), Haifa, Israel, 21–24 June 2010; pp. 807–814. [Google Scholar]
- Kingma, D.P.; Ba, J.L. Adam: A method for stochastic optimization. In Proceedings of the 3rd International Conference on Learning Representations, ICLR 2015, San Diego, CA, USA, 7–9 May 2015. [Google Scholar] [CrossRef]
- Varying Regularization in Multi-Layer Perceptrons. 2024. Available online: https://scikit-learn.org/stable/auto_examples/neural_networks/plot_mlp_alpha.html#sphx-glr-auto-examples-neural-networks-plot-mlp-alpha-py (accessed on 13 November 2024).
- Fawcett, T. An introduction to ROC analysis. Pattern Recognit. Lett. 2006, 27, 861–874. [Google Scholar] [CrossRef]
- Kamilaris, A.; Prenafeta-Boldú, F.X. Deep learning in agriculture: A survey. Comput. Electron. Agric. 2018, 147, 70–90. [Google Scholar] [CrossRef]
- Wang, S.; Liu, W.; Wu, J.; Cao, L.; Meng, Q.; Kennedy, P.J. Training deep neural networks on imbalanced data sets. In Proceedings of the 2016 International Joint Conference on Neural Networks (IJCNN), Vancouver, BC, Canada, 24–29 July 2016; IEEE: Piscataway, NJ, USA, 2016; pp. 4368–4374. [Google Scholar]
- Grandini, M.; Bagli, E.; Visani, G. Metrics for multi-class classification: An overview. arXiv 2020. [Google Scholar] [CrossRef]
- Joshi, K.; Tripathi, V.; Bose, C.; Bhardwaj, C. Robust sports image classification using InceptionV3 and neural networks. Procedia Comput. Sci. 2020, 167, 2374–2381. [Google Scholar] [CrossRef]
- Tiwari, R.G.; Misra, A.; Ujjwal, N. Image embedding and classification using pre-trained deep learning architectures. In Proceedings of the 8th International Conference on Signal Processing and Communication (ICSC) Noida, India, 1–3 December 2022; IEEE: Piscataway, NJ, USA, 2022; pp. 125–130. [Google Scholar]
- Brownlee, J. Data Preparation for Machine Learning: Data Cleaning, Feature Selection, and Data Transforms in Python. Machine Learning Mastery. 2020. Available online: https://tinyurl.com/yfznxsdn (accessed on 4 November 2024).
- Buda, M.; Maki, A.; Mazurowski, M.A. A systematic study of the class imbalance problem in convolutional neural networks. Neural Netw. 2018, 106, 249–259. [Google Scholar] [CrossRef]
- Kubat, M.; Holte, R.; Matwin, S. Learning when negative examples abound. In Proceedings of the Machine Learning: ECML-97: 9th European Conference on Machine Learning Prague, Czech Republic, 23–25 April 1997; Proceedings 9. Springer: Berlin/Heidelberg, Germany, 1997; pp. 146–153. [Google Scholar]
- Japkowicz, N.; Stephen, S. The class imbalance problem: A systematic study. Intell. Data Anal. 2002, 6, 429–449. [Google Scholar] [CrossRef]
- Saini, M.; Susan, S. Tackling class imbalance in computer vision: A contemporary review. Artif. Intell. Rev. 2023, 56, 1279–1335. [Google Scholar] [CrossRef]
- Ghosh, K.; Bellinger, C.; Corizzo, R.; Branco, P.; Krawczyk, B.; Japkowicz, N. The class imbalance problem in deep learning. Mach. Learn. 2024, 113, 4845–4901. [Google Scholar] [CrossRef]
- Mera, C.; Orozco-Alzate, M.; Branch, J. Improving representation of the positive class in imbalanced multiple-instance learning. In Proceedings of the Image Analysis and Recognition: 11th International Conference, ICIAR 2014, Vilamoura, Portugal, 22–24 October 2014; Proceedings, Part I 11. Springer International Publishing: Cham, Switzerland, 2014; pp. 266–273. [Google Scholar]
- Napierala, K.; Stefanowski, J. Types of minority class examples and their influence on learning classifiers from imbalanced data. J. Intell. Inf. Syst. 2016, 46, 563–597. [Google Scholar] [CrossRef]
- Ahmed, E.; Saint, A.; Shabayek, A.E.R.; Cherenkova, K.; Das, R.; Gusev, G.; Aouada, D.; Ottersten, B. A survey on deep learning advances on different 3D data representations. arXiv 2018. [Google Scholar] [CrossRef]
- Felzenszwalb, P.F.; Girshick, R.B.; McAllester, D.; Ramanan, D. Object detection with discriminatively trained part-based models. IEEE Trans. Pattern Anal. Mach. Intell. 2009, 32, 1627–1645. [Google Scholar] [CrossRef]
- Ghiasi, G.; Yang, Y.; Ramanan, D.; Fowlkes, C.C. Parsing occluded people. In Proceedings of the IEEE Conference on Computer Vision and Pattern Recognition, Columbus, OH, USA, 23–28 June 2014; pp. 2401–2408. [Google Scholar]
- Rafi, U.; Gall, J.; Leibe, B. A semantic occlusion model for human pose estimation from a single depth image. In Proceedings of the 2015 IEEE Conference on Computer Vision and Pattern Recognition Workshops (CVPRW), Boston, MA, USA, 7–12 June 2015; pp. 67–74. [Google Scholar]
- Bulusu, S.; Kailkhura, B.; Li, B.; Varshney, P.K.; Song, D. Anomalous example detection in deep learning: A survey. IEEE Access 2020, 8, 132330–132347. [Google Scholar] [CrossRef]
- Hendrycks, D.; Dietterich, T. Benchmarking neural network robustness to common corruptions and perturbations. arXiv 2019. [Google Scholar] [CrossRef]
- Mehra, A.; Zhang, Y.; Hamm, J. Test-time assessment of a model’s performance on unseen domains via optimal transport. In Proceedings of the IEEE/CVF Conference on Computer Vision and Pattern Recognition, Columbus, OH, USA, 23–28 June 2014; pp. 173–182. [Google Scholar]
- Polyzotis, N.; Roy, S.; Whang, S.E.; Zinkevich, M. Data management challenges in production machine learning. In Proceedings of the 2017 ACM International Conference on Management of Data, Chicago, IL, USA, 14–19 May 2017; pp. 1723–1726. [Google Scholar]
- Borz, S.A.; Papandrea, S.F.; Marcu, M.V.; Bacenetti, J.; Proto, A.R. Postural assessment of three wood measurement options by the owas method: Digital solutions seem to be better. Forests 2022, 13, 2007. [Google Scholar] [CrossRef]
- Osqueizadeh, R.; Bandpei, M.A.M.; Rahmani, N.; Goudarzi, H.R.; Ebadi, A. Reliability and validity of observational methods for postural load assessment: An updated systematic review. J. Health Scope 2023, 12, e137573. [Google Scholar] [CrossRef]
- Eliasson, K.; Palm, P.; Nyman, T.; Forsman, M. Inter-and intra-observer reliability of risk assessment of repetitive work without an explicit method. Appl. Ergon. 2017, 62, 1–8. [Google Scholar] [CrossRef] [PubMed]
- Rhén, I.M.; Forsman, M. Inter-and intra-rater reliability of the OCRA checklist method in video-recorded manual work tasks. Appl. Ergon. 2020, 84, 103025. [Google Scholar] [CrossRef]
- Chaparro-Rico, B.D.; Cafolla, D. Test-retest, inter-rater and intra-rater reliability for spatiotemporal gait parameters using SANE (an eaSy gAit aNalysis systEm) as measuring instrument. Appl. Sci. 2020, 10, 5781. [Google Scholar] [CrossRef]
- Boland, D.M.; Neufeld, E.V.; Ruddell, J.; Dolezal, B.A.; Cooper, C.B. Inter-and intra-rater agreement of static posture analysis using a mobile application. J. Phys. Ther. Sci. 2016, 28, 3398–3402. [Google Scholar] [CrossRef]
- Chollet, F. Deep Learning with Python; Manning Publication Co.: Shelter Island, NY, USA, 2021. [Google Scholar]
- Staples, M.; Zhu, L.; Grundy, J. Continuous validation for data analytics systems. In Proceedings of the 38th International Conference on Software Engineering Companion, Austin, TX, USA, 14–22 May 2016; pp. 769–772. [Google Scholar]
- Bergstra, J.; Bengio, Y. Random search for hyper-parameter optimization. J. Mach. Learn. Res. 2012, 13, 281–305. [Google Scholar]
- Bergstra, J.; Yamins, D.; Cox, D. Making a science of model search: Hyperparameter optimization in hundreds of dimensions for vision architectures. In Proceedings of the International Conference on Machine Learning, PMLR, Atlanta GA USA, 16–21 June 2013; pp. 115–123. [Google Scholar]
- Goodfellow, I.; Bengio, Y.; Courville, A. Deep Learning; MIT Press: Cambridge, MA, USA, 2016. [Google Scholar]
- Ruder, S. An overview of gradient descent optimization algorithms. arXiv 2016. [Google Scholar] [CrossRef]
Disclaimer/Publisher’s Note: The statements, opinions and data contained in all publications are solely those of the individual author(s) and contributor(s) and not of MDPI and/or the editor(s). MDPI and/or the editor(s) disclaim responsibility for any injury to people or property resulting from any ideas, methods, instructions or products referred to in the content. |
© 2025 by the authors. Licensee MDPI, Basel, Switzerland. This article is an open access article distributed under the terms and conditions of the Creative Commons Attribution (CC BY) license (https://creativecommons.org/licenses/by/4.0/).