1. Introduction
Clusters of non-occupational public health diseases are reported regularly. Looking just at the United States and just at cancer, most states have at least one report of some cancer or another appearing to cluster in space and/or time, i.e., illness occurring more frequently across a population than the given background rate for a discrete locale (
Figure 1). Possible cancer clusters come into public awareness often through concerned citizens observing what they feel are more cases of cancer around them than usual and then contacting a local or state health agency to report that observation [
1].
The course of action taken upon receiving reports of possible clusters of cancer varies. In many instances, it is determined that the number of cases through time for the population under consideration does not statistically exceed the general background rate of incidence of that cancer, and no further action is taken. In other instances, public health agencies ranging from the city or county level to the state and even federal level might investigate the report by surveying the community under consideration to determine if recent cases (people diagnosed with cancer) share anything in common, e.g., genetics, lifestyles, and/or environmental exposures, that might explain an uptick in cases. It has been notoriously difficult to identify commonalities across cancer cases [
2], which often results in no further action being taken.
Figure 1.
Quantity of reports of possible clustering of cancers by state across the US. From [
3].
Figure 1.
Quantity of reports of possible clustering of cancers by state across the US. From [
3].
In other instances, other researchers, either private and/or academic, are contacted and asked to conduct additional research in addition to that of governmental agencies. For example, in the instance of a cluster of childhood leukemia in Fallon, Nevada, in the late 1990s–early 2000s, multiple academic research teams became involved with surveys or measuring various components of the environment, which resulted in a special issue of publications dedicated to Fallon [
4] as well as in fatigue in the community because of being the center of so much attention [
5].
We (the authors herein) are occasionally contacted by citizens of communities appearing to experience more than the background frequency of disease through time and geographical area. This is because we employ dendrochemistry, the measurement and analysis of elements in tree rings [
6], to study environmental change through time, including in urban settings. The premise of dendrochemistry in public health studies is that while trees take up soil moisture as a matter of mere existence and growth, chemical elements tend to come along with that moisture and thereby enter the tree. Elements are then deposited in the growth rings and thereby represent at least a theoretical possibility of a time series of environmental availability of elements for some lengthy amount of time, e.g., at least many years if not decades [
7]. This premise is certainly true for elements that are necessary for plant life itself, such as the essential macronutrients of C, H, O, P, K, N, S, Ca, Fe, and Mg, as well as the essential micronutrients of Mo, Mn, Cu, Zn, and B [
8]. This premise is also true for elements that are not necessary for plant life, e.g., heavy metals, rare-earth elements, and radioactives. Chemical measurement techniques such as inductively coupled plasma mass spectroscopy (ICP-MS) can measure various environmental samples for a sizeable fraction of the elements of the periodic table, many of which have, indeed, been detected in wood [
9].
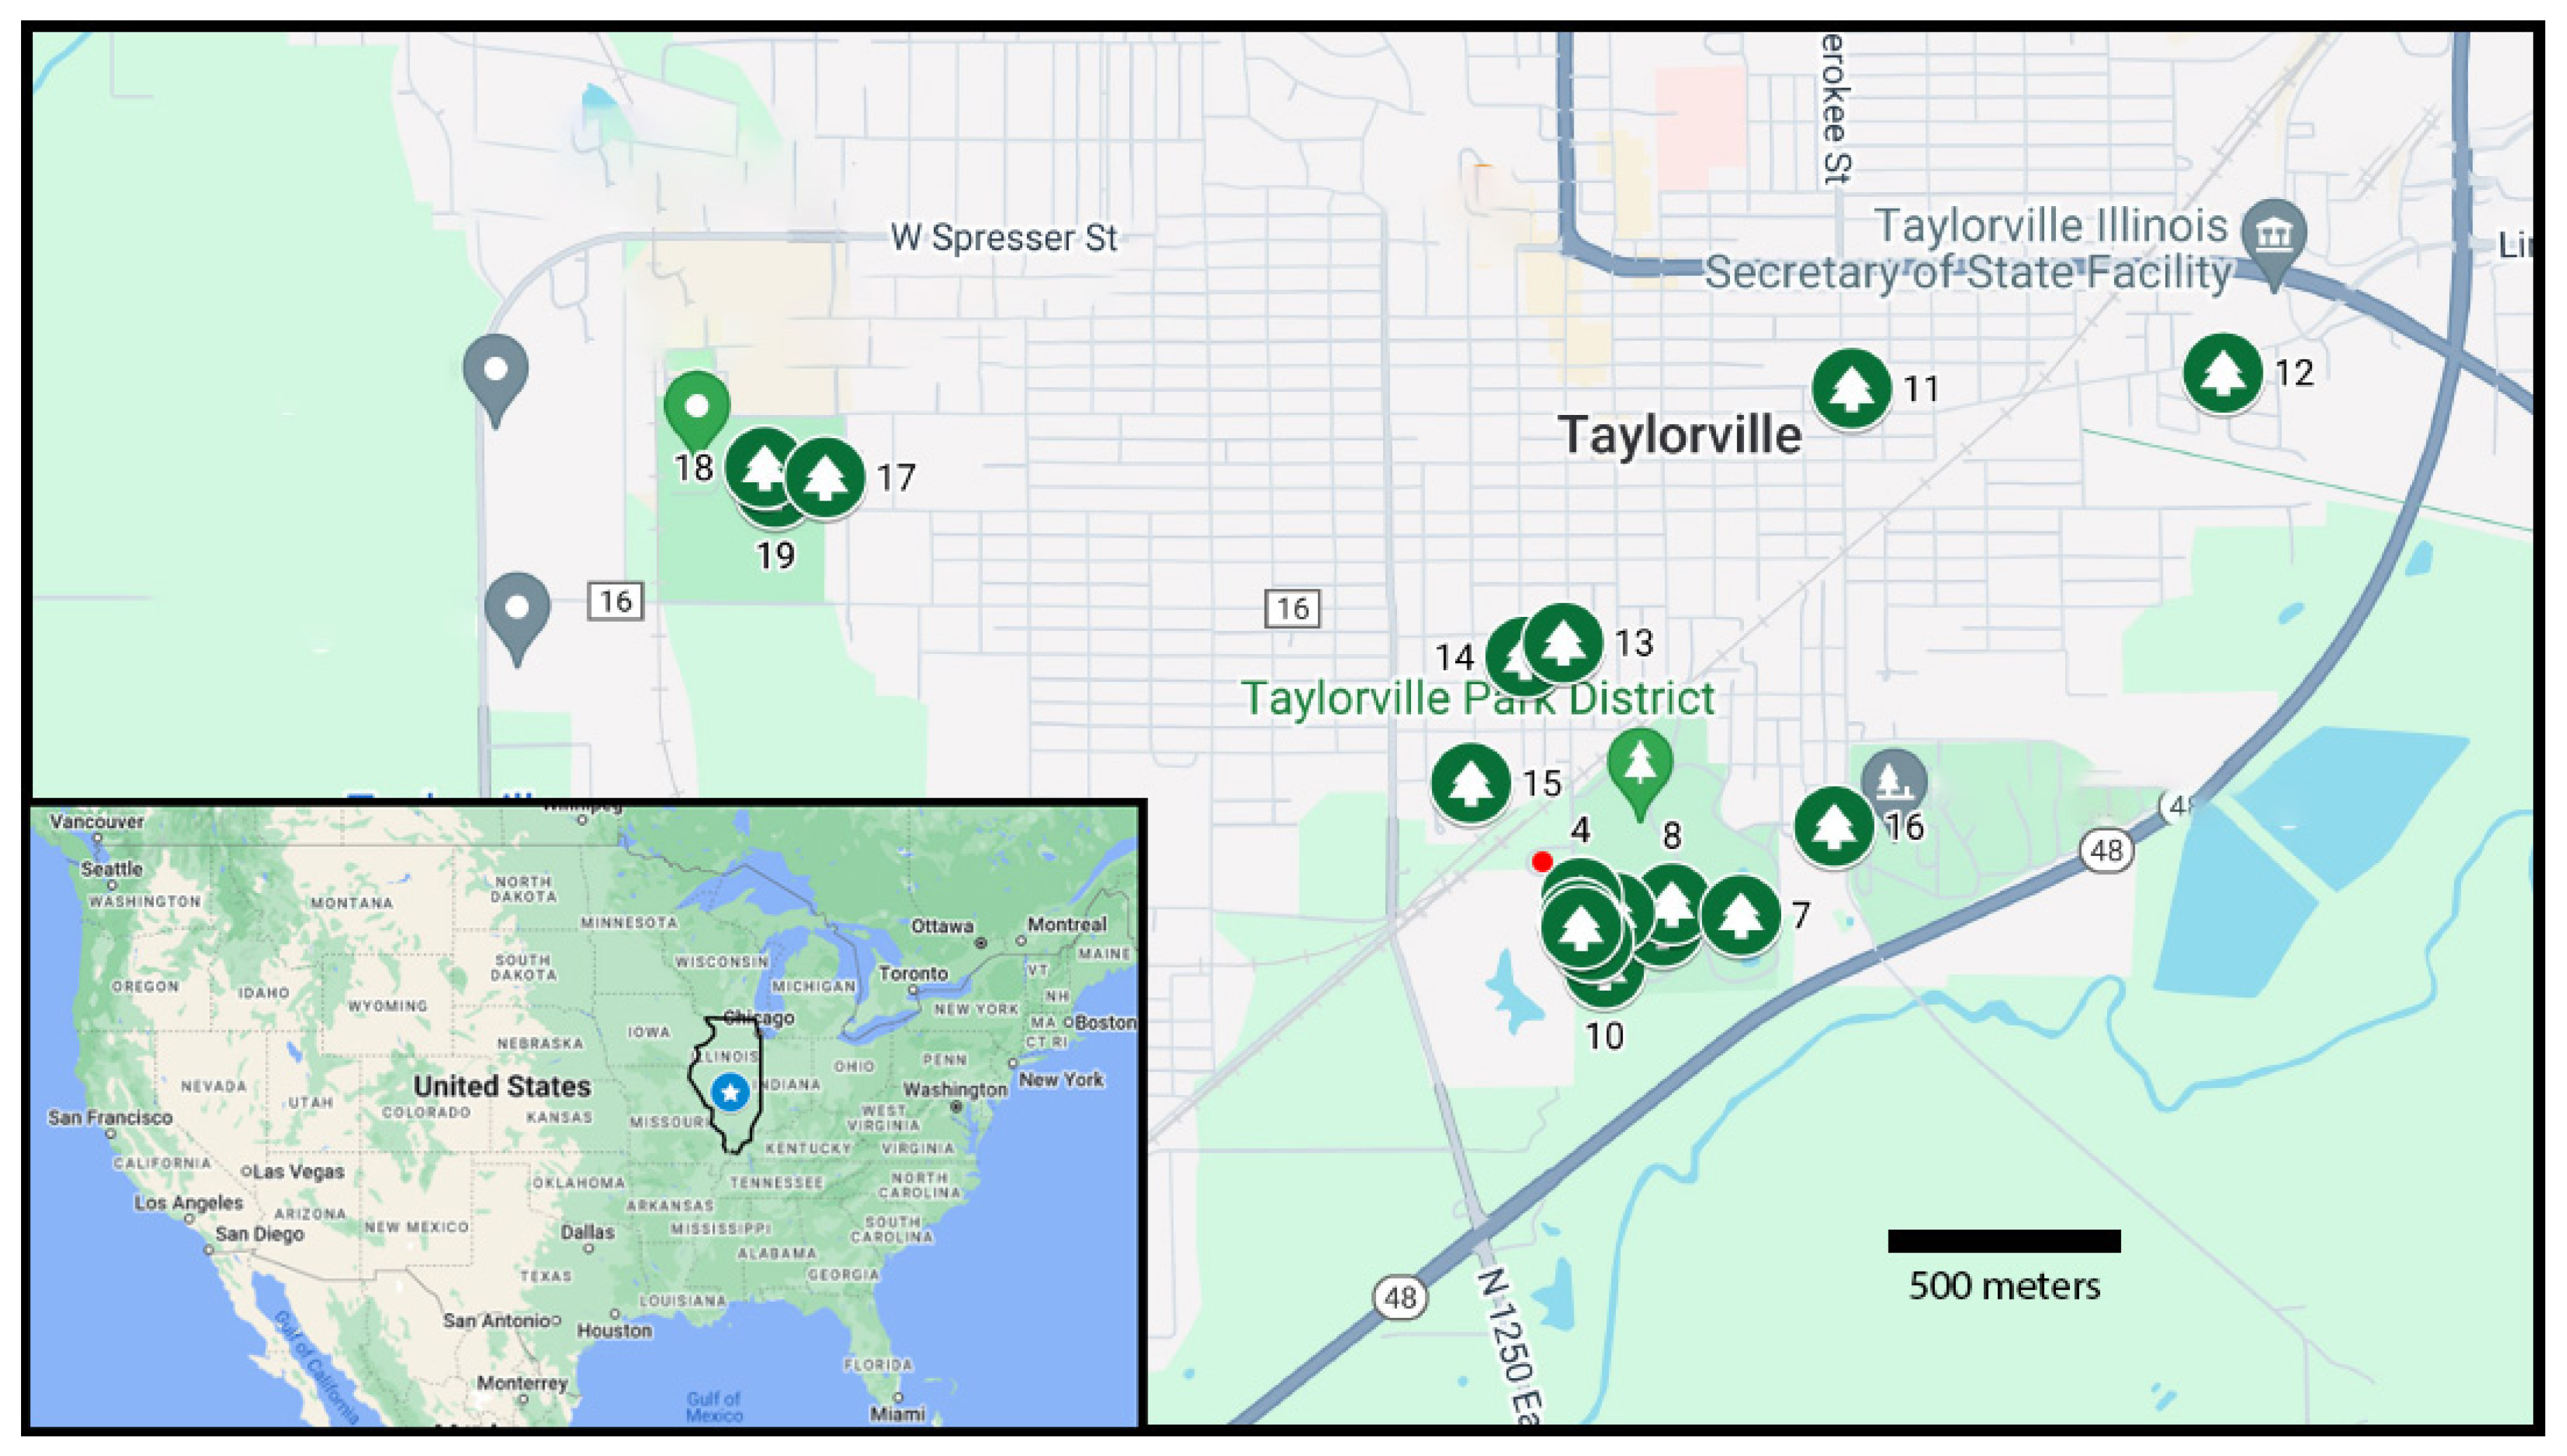
A recent case study of ours in applying dendrochemistry to public health was conducted in Taylorville, Illinois (
Figure 2, inset). Located in central Illinois, Taylorville has about 11,000 residents located in a region characterized principally as agricultural. In the mid-1990s, multiple cases were reported in Taylorville of neuroblastoma, i.e., cancer of nerve cells usually restricted to young children at the age of 5 years or younger [
10]. Since then, multiple cases of glioblastoma, a cancer of the brain, have been reported across all ages [
11]. The online NIH search engine for State Cancer Profiles [
12] shows an incidence rate for brain cancers for Christian County, the county of Taylorville, that is slightly, though not significantly, higher than the state and federal background rates for the last five years. By contrast, the same search engine shows an incidence rate for lung cancer for Christian County that is almost double the state and federal background rates, though a majority of the counties of Illinois also show higher rates of lung cancer than the state and federal rates. Additionally, the rate of ovarian cancer for Christian County exceeds the state and federal rates and is the highest of any county in Illinois.
Environmentally, Taylorville has a superfund site, i.e., a location with excessive contamination of some contaminant or another [
13]. This superfund site is located near a public park with ballfields and other facilities (
Figure 2, red dot) [
14,
15]. This site is related to a former manufactured gas plant that ceased operations in 1932. The site has been contaminated with polynuclear aromatic hydrocarbons and volatile organic compounds. Remediation of the site has been ongoing for years, and it remains under environmental monitoring [
15].
As is often the case in these kinds of public health situations, there is not a consensus of opinion across authorities/stakeholders that Taylorville truly experienced elevated rates of cancers above background levels and/or has an ongoing environmental concern [
16]. However, given the co-occurrence within Taylorville of higher-than-expected numbers of non-occupational cancers in recent years, as well as an environmental degradation to the point of being declared a superfund site, we agreed to visit Taylorville to see if dendrochemistry could provide information about changes in the chemical environment through time. If Taylorville’s urban forest included a sufficient number of trees of sufficient age (at least a few to several decades old), and if those trees were of a species with observable growth rings that were annual in resolution, and if those tree species were reasonably easy to sample by increment coring (some hardwood species have wood that really is very hard such that core sampling cannot be accomplished without risking breaking the increment borers), then dendrochemistry could at least be tried there. Dendrochemistry does not always conclude with clear-cut results that unequivocally show changes in chemical environments through time [
17], so that outcome cannot be guaranteed.
As in past applications of dendrochemistry to public health events [
7,
18], our approach in Taylorville fell within the type of investigation known as ecologic study, where an urban setting is assessed broadly, i.e., without regard to specific contamination sources presumed ahead of time to be of concern [
19,
20]. Ecologic study is applicable in investigations of the clustering of an illness in small geographical areas [
21]. A limitation is that ecologic studies cannot pinpoint a specific environmental factor in particular as the cause of an illness [
22]. Consequently, the objective in this study was to assess the urban environment for changes through time in multiple elements so that if the abundance of an element were discovered to increase in the past, then that element might be studied further for possible causal association with the illness at hand [
21]. An additional objective in this article is to continue discussing issues of applying dendrochemistry to studies of public health, in accordance with the mission of this special issue of
Forests on dendrochemistry [
23].
2. Materials and Methods
2.1. Study Area
Tree sampling in Taylorville was dictated by the existence of trees of reasonable age (at least a few decades) and whether permission to sample was obtainable. The urban forest of Taylorville includes mature trees of a conifer species (eastern white pine) and various hardwood species, such as white and red oaks, walnut, tulip tree, and sycamore. Tree sampling was allowed for trees growing in public parks, which therefore was the predominate location of sampling (
Figure 2). Permission to sample was also granted for a few trees on private property. Trees well away from central Taylorville were also sampled in order to have control comparisons, i.e., trees located presumably outside the influence of the urban activity of the town. However, it is hard to know initially the spatial variability of elements in urban areas, so it was not clear if control trees truly were found for sampling [
7].
For the most part, living trees were sampled using a standard 5 mm diameter increment borer to obtain as long a radial core as possible from the bark towards the pith. As expected, eastern white pines, being conifers, were easy to core all the way to pith while the hardwoods were difficult, if not impossible, to reach the pith without risking breaking the borer. Two cut stumps of oaks that died recently were sampled by cutting the full radii from the stumps using a chain saw. In all, 19 trees were sampled: 8 white pines and 11 hardwoods (
Table 1).
2.2. Sample Preparation
Tree core samples were prepared for chemical measurement following protocols of dendrochemistry [
7]. Cores were stored in mounts for safe keeping but without being glued in mounts. Tree cores were viewed as-is under a microscope to identify rings, i.e., without sanding [
24]. In most cases, growth rings were reasonably visible without sanding.
2.3. Chemical Measurement
Chemical measurement of wood started with half of the trees sampled (
Table 1). The samples from some of the hardwoods were too short to contribute to this research and/or did not have clear ring boundaries to reliably determine separate growth rings in any case. Such trees were not measured. Eight of the other trees were measured in the first round, six hardwoods and two conifers equally spread out geographically around Taylorville. Upon seeing results from the first round of measuring, four additional conifers were measured in a second round to improve the depth of the dataset.
Radial samples were cut into decadal time chunks, as it was not considered necessary to maintain annual resolution in this application of dendrochemistry and the decadal resolution reduced the cost of chemical measurements considerably. Additionally, measuring rings at the decade time scale accounts for elements possibly moving across rings [
17], which serves to smooth out that variation [
7]. This plan provided enough data for an exploratory view of changes in elements through time while retaining sample wood for more measurements and cross-checking results as merited.
The wood of the tree rings was chemically measured via acid digestion, inductively coupled with plasma mass spectroscopy (ICP-MS). Prior to measuring, the order of the samples was randomized so that if any errors occurred during measuring, no particular temporal pattern would be created. Wood samples were weighed into precleaned, pre-weighed, trace metal-free polypropylene digestion tubes. Depending on the mass of each sample, 3–6 mL of concentrated Optima grade nitric acid (HNO3), certified for sub-50 ppt concentration of other elements, were added to the tube. The samples were allowed to sit at room temperature for two days and then were digested at 90 °C in a heater block until digestion was complete, usually between 1 and 2 h. After digestion was complete, the sample tubes were reweighed in order to calculate dilution factors. After thorough mixing, a 1.5 mL aliquot of the digestate was gravimetrically diluted by a factor of 10 with ultrapure 18.2 megaohm/cm water. Internal standards of Be, Bi, and In were also added.
To calibrate the VG PlasmaQuad 3 ICP-MS, linearity standards were prepared. These linearity standards were diluted from multielement calibration standards obtained from high purity standards. Scandium and indium were added to the linearity standards at approximately 20 ppb for scandium and 10 ppb for indium. Be, In, and Bi internal standards were added to the linearity standards at approximately 20 ppb (for Be), 10 ppb (for In), and 5 ppb (for Bi). Four standard points were used to calibrate the instrument for all elements of interest. The exact concentrations for all standards were calculated and these data were used to create the linear calibration curve of instrument response versus concentration (for each analyte). The linearity standards were re-analyzed repeatedly during the analytical run to ensure continuous correct instrument response. Solutions were measured for concentration of elements of a couple standard sets, namely, Be, Al, V, Cr, Mn, Fe, Co, Ni, Cu, Zn, As, Se, Mo, Ag, Cd, Sn, Sb, Ba, and Pb. Limits of detection were mostly ≤10 ppb. Sample values less than the limit of detection were considered zeros.
3. Results
A logical approach to showing dendrochemistry data might be a time series of absolute concentration values of elements measured in the wood samples, organized either by element and/or by tree [
7]. Unfortunately, a time series of absolute values of elements can be affected by the existence of high outlying values, which can occur in dendrochemistry. Because of this, a time series of absolute concentration values of elements are often not useful because of the y-axes being dominated by the presence of a very high value, resulting in compressing all other values down near the 0 line, obscuring patterns that might exist.
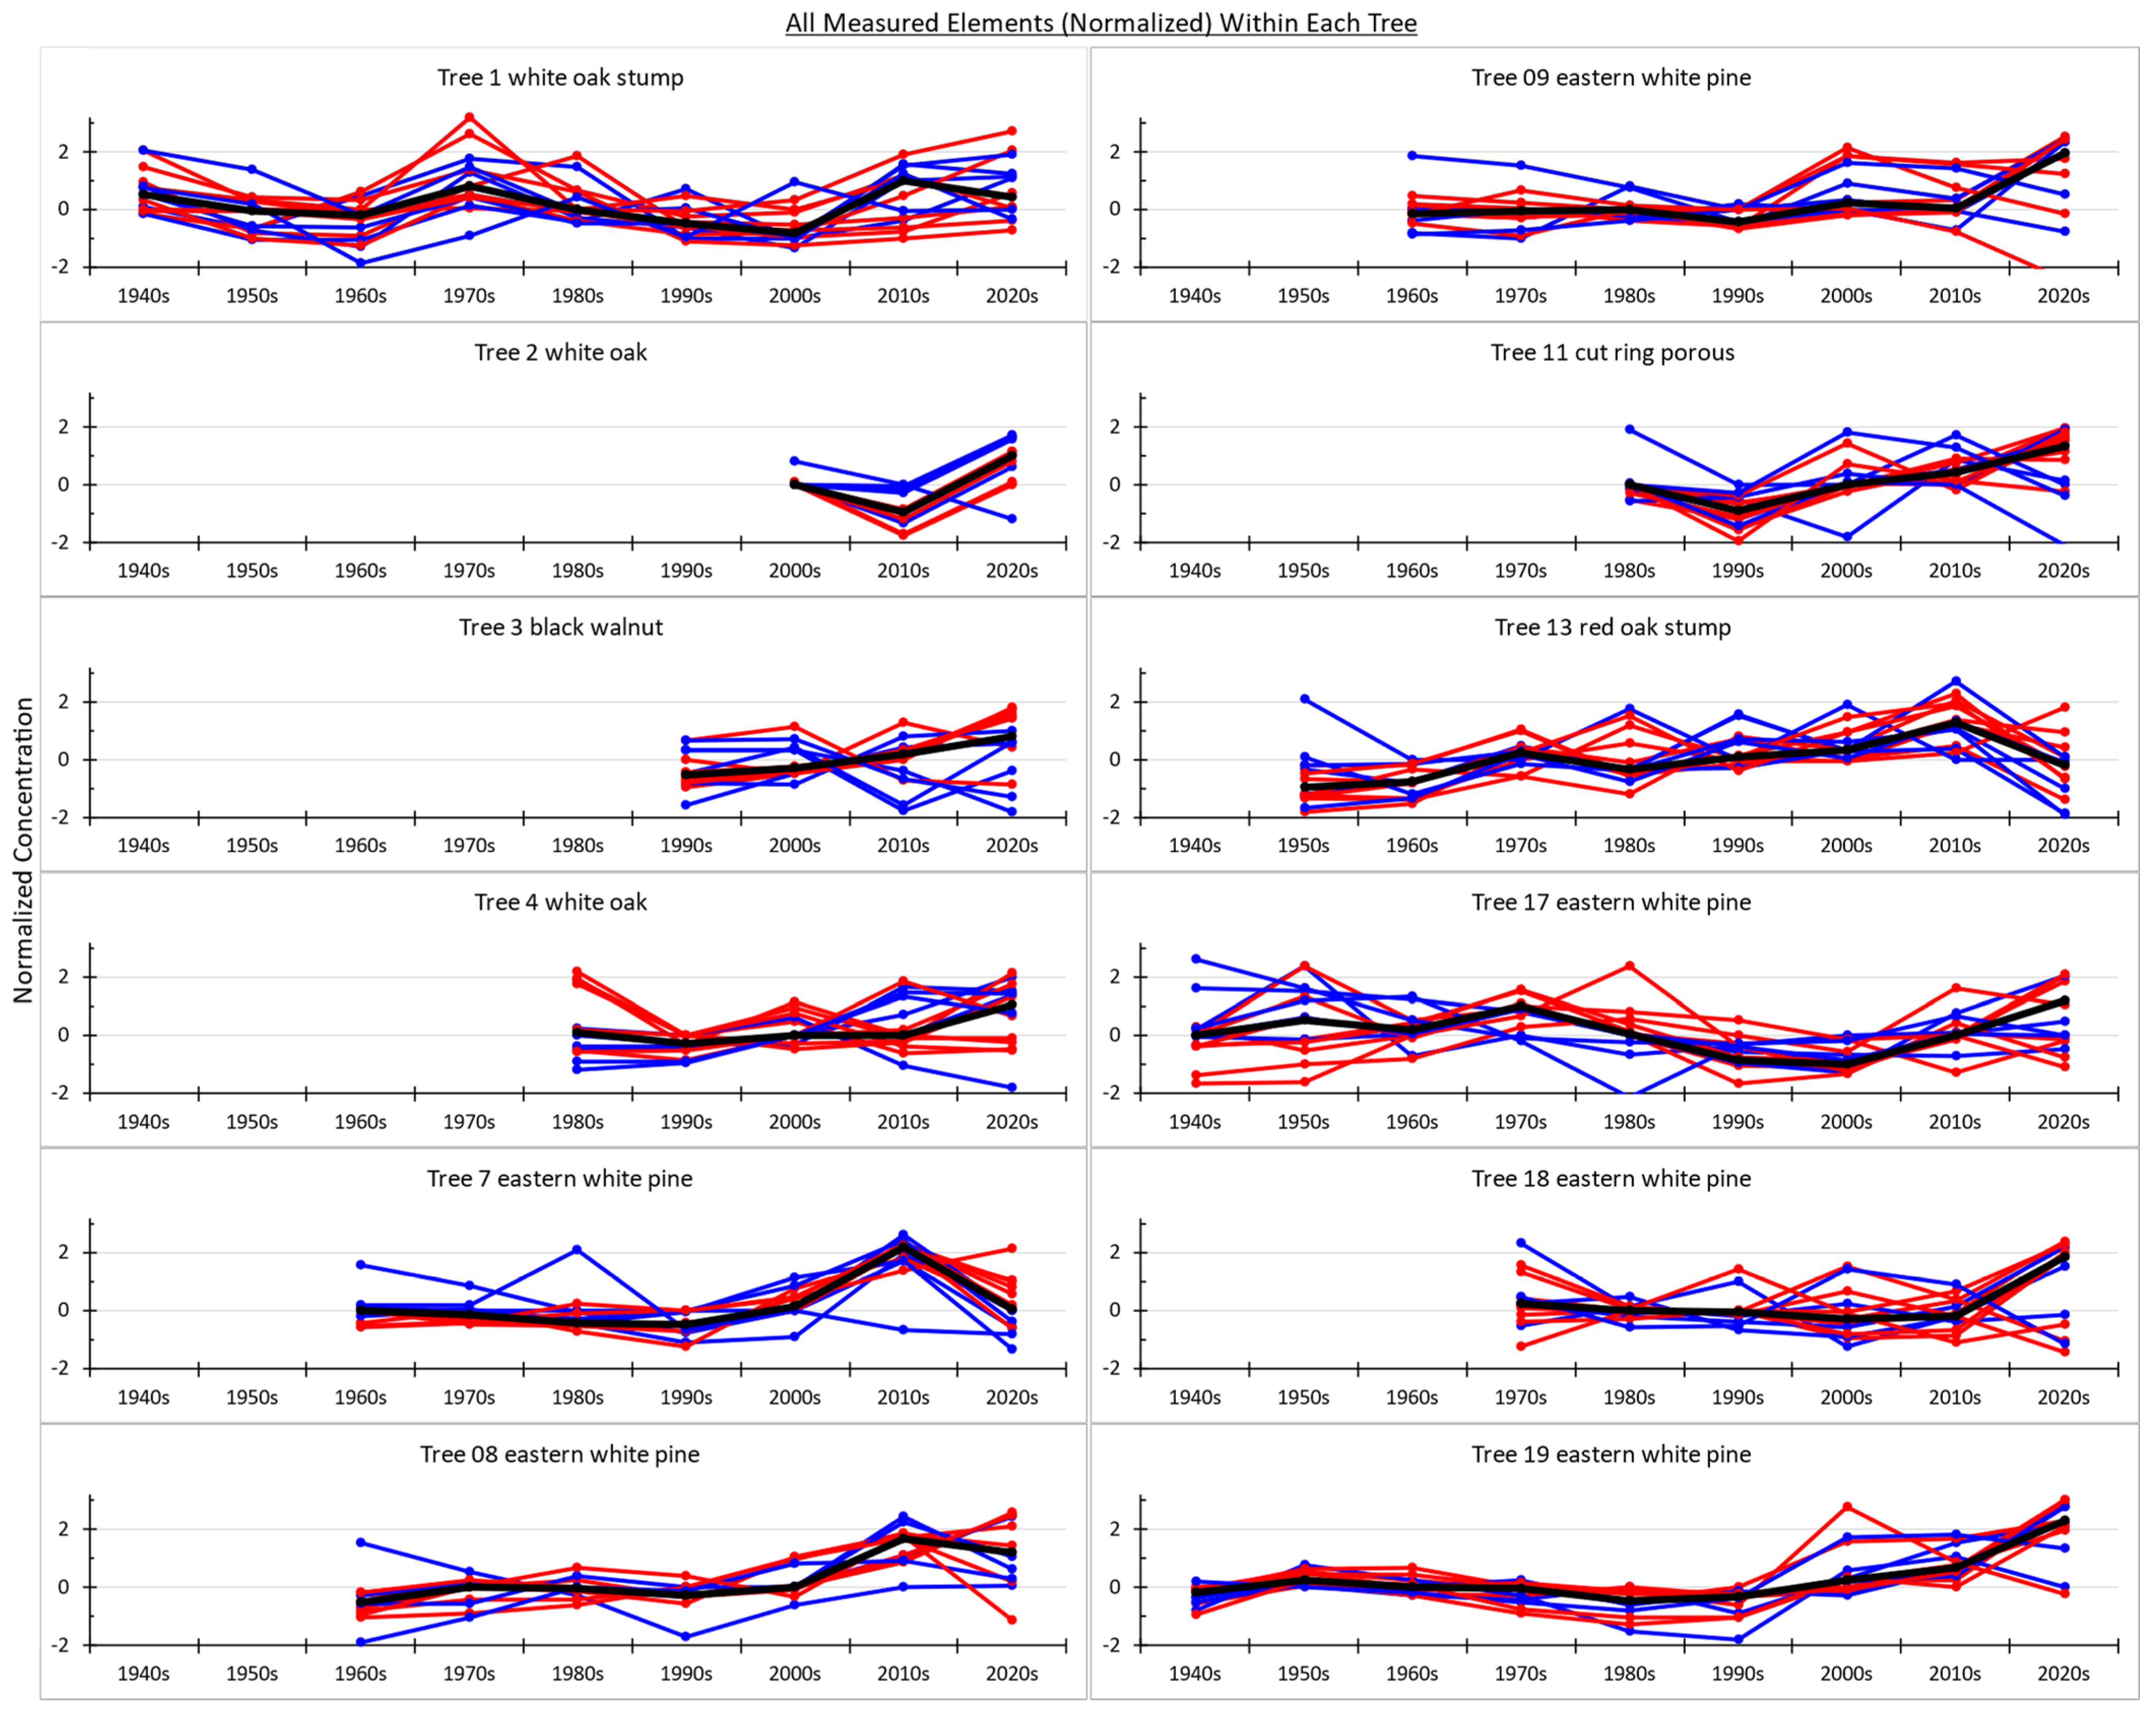
A couple solutions exist to overcome this problem. One is to convert values within each tree by each element into standardized values, resulting in all series having a mean of zero and a similar variance through time [
7]. This allows the time series to be overlay plotted together such that all trees are visible in multiple-tree time series plots. On the other hand, standardization results in negative values, which can be counterintuitive when the data are concentrations, which logically should not be negative values.
The second is to log transform the values within each tree by each element, thereby bringing outlying high values down in value without compressing the other values down into the 0 line [
25]. This leaves all values as positive numbers and allows the data to be overlay plotted together such that all trees are visible in multiple-tree time series plots. This option was chosen for the first glance at the dendrochemistry data from Taylorville.
About half the elements measured show little to no change (trend) through time (
Figure 3). Regardless of whatever their absolute values are, which can vary within each tree and across elements, there is no obvious trend through time in these elements that could be interpreted as evidence of something changing in Taylorville over the last several decades. This is true for the hardwoods (blue lines) as well as the conifers (red lines) sampled.
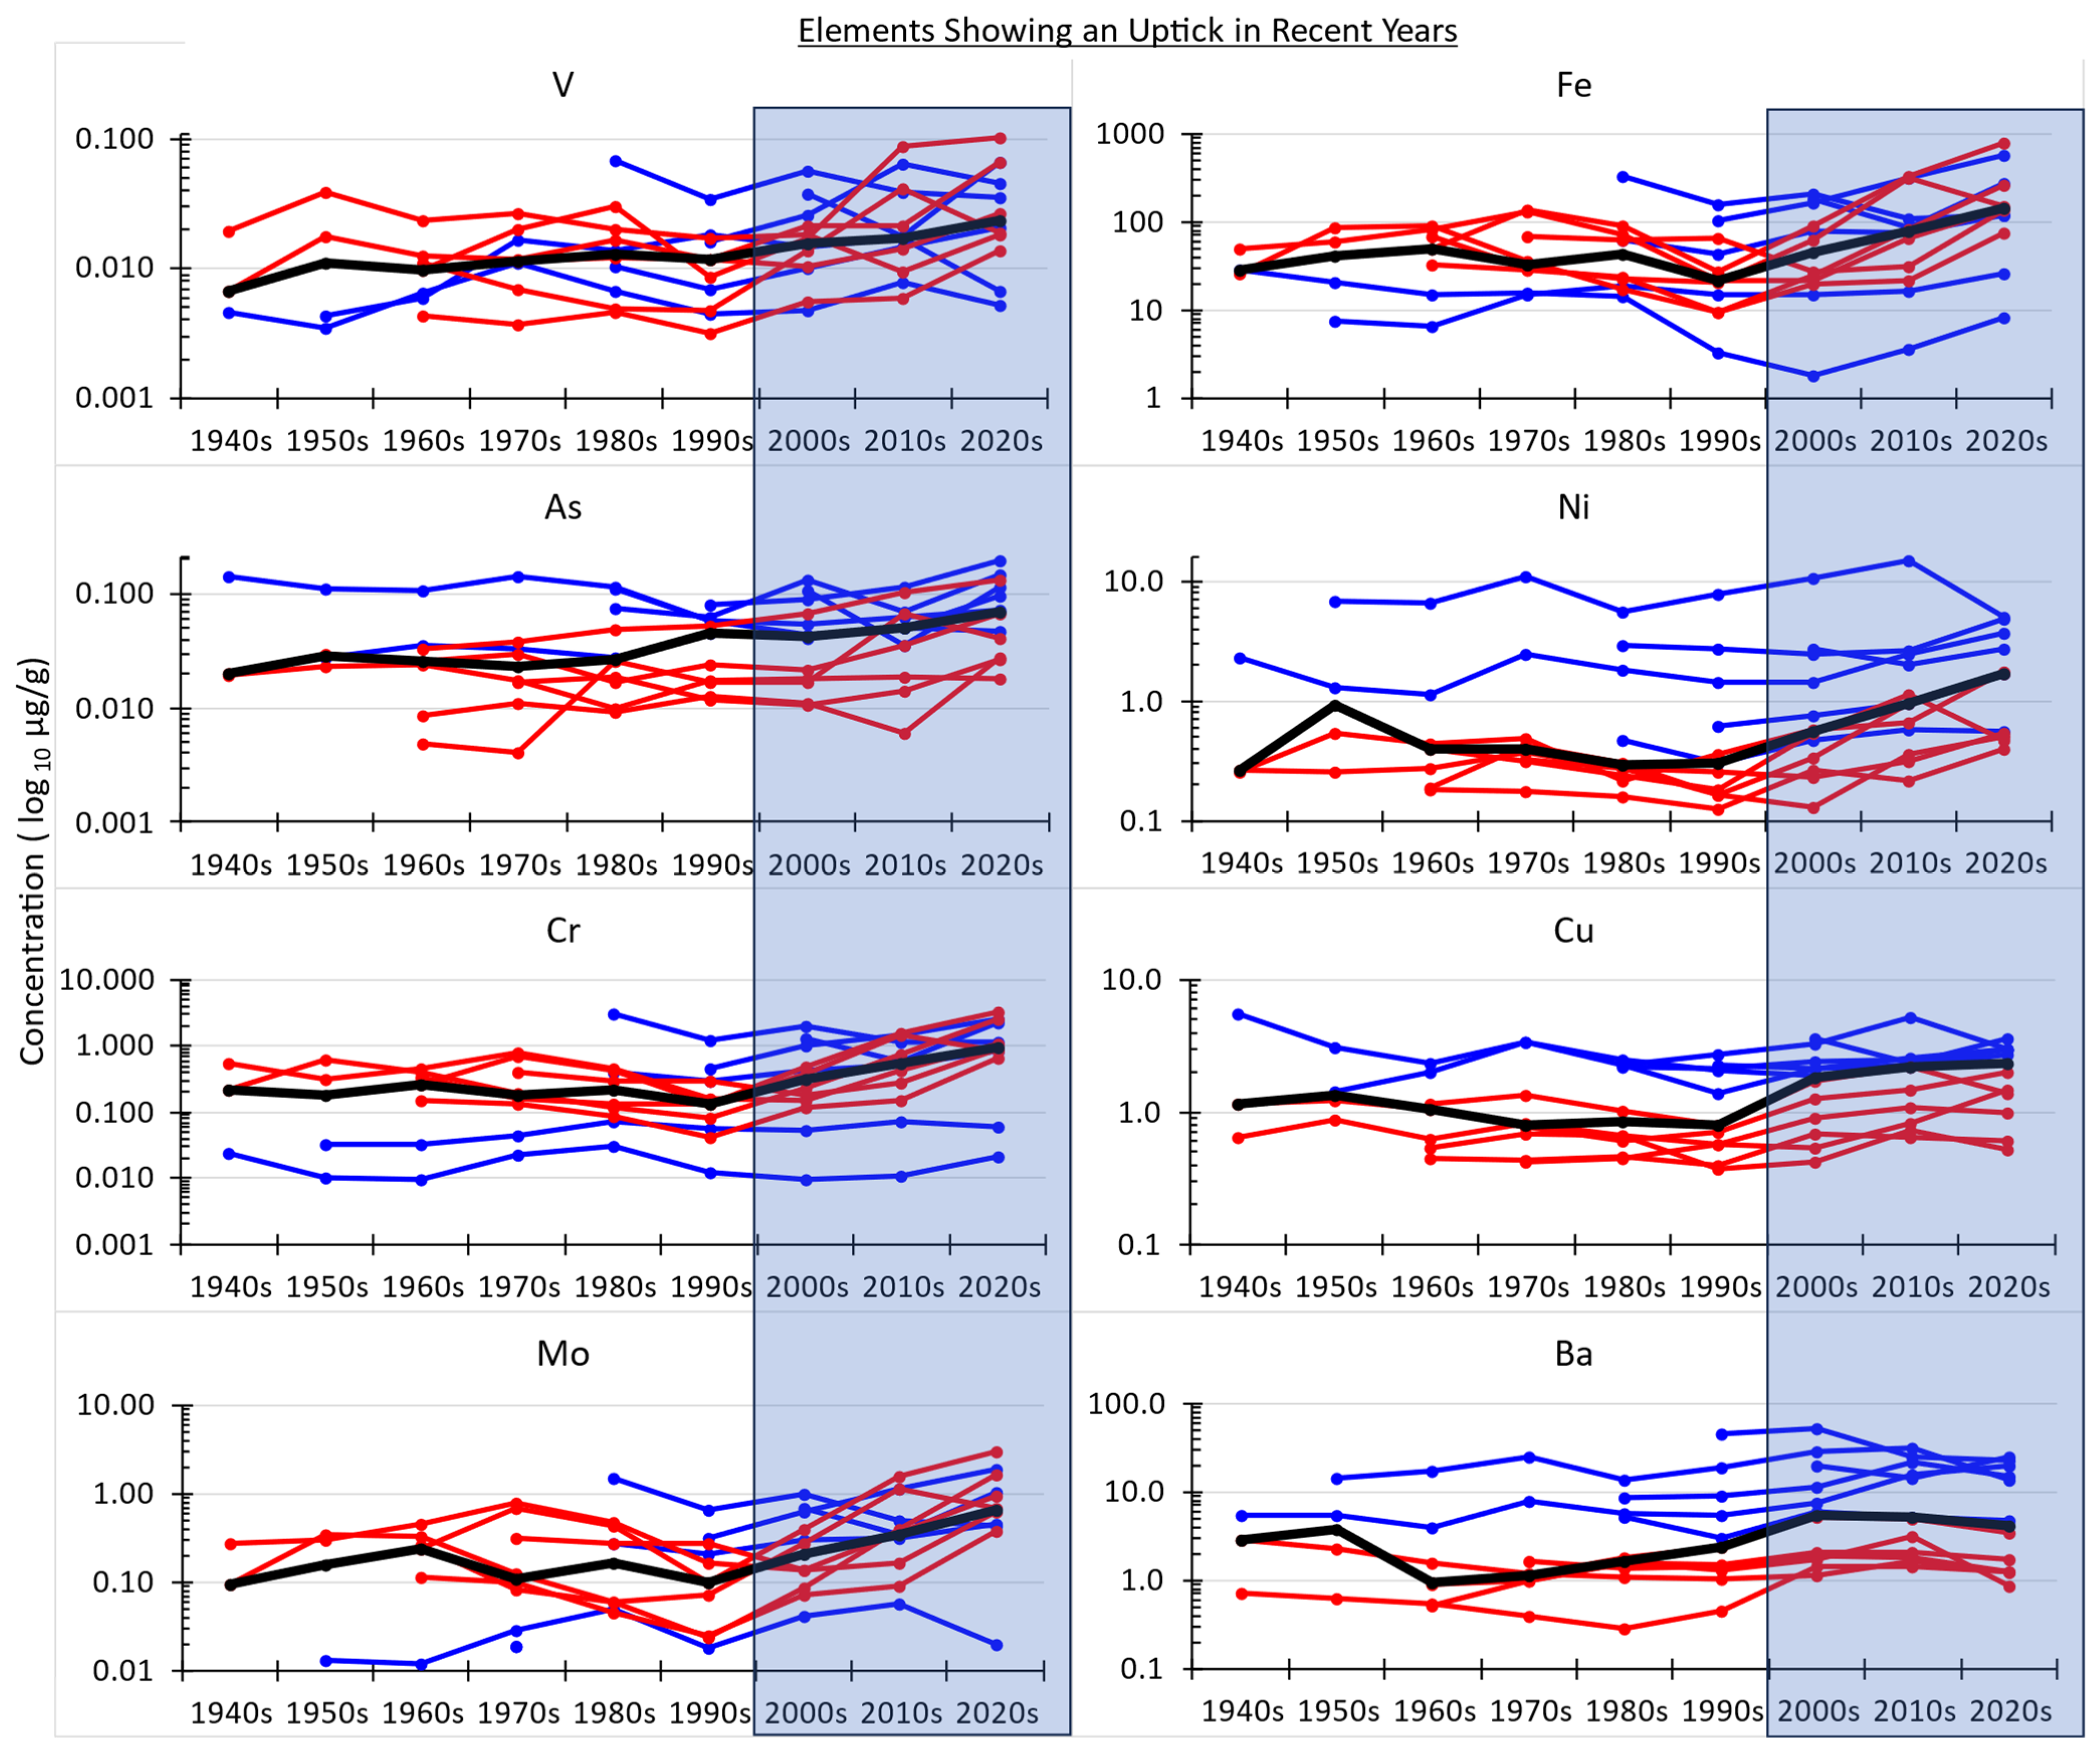
By contrast, other elements measured do show change (trend) through time, namely an uptick in concentration beginning with the 2000s decade (
Figure 4). Again, regardless of whatever their absolute values are, concentration values since 2000 are significantly higher than before 2000, as shown with the non-parametric Mann–Whitney test (
Table 2, right side). The Mann–Whitney test of the elements not showing a trend through time confirmed no significant differences in concentrations pre- versus post-2000 (
Table 2, left side). With respect to which metals showed no trend through time versus those that showed an uptick in concentration in recent decades, there does not appear to be any obvious pattern (
Figure 5). Only two columns of the periodic table have more than one metal measured in this study: column 6, the chromium group, and column 12, the zinc group. In each group, the two metals measured match each other for showing a trend through time or not, but in one group (#6), the metals show an uptick, while in the other group (#12), they do not show a trend.
Spatially, no obvious pattern emerged from the trees sampled and measured in this study (
Figure 6). Sampled trees located near the superfund site (trees 1–4 and 7–9) show about the same general trends of element concentrations through time as do trees within Taylorville neighborhoods (trees 11 and 13) as well as trees located west of the center of town (trees 17–19).
4. Discussion
In addition to providing a temporal record of environmental elements of a small town that has public health concerns, this case study illustrates various issues of using dendrochemistry for environmental monitoring and reconstruction, in accordance with the mission statement of the special issue of
Forests on dendrochemistry [
23]:
A concern about dendrochemistry has been that if/when concentrations of elements are elevated in the outermost growth rings of trees, i.e., rings formed most recently, it might be merely because of physiological processes of trees storing resources in sapwood, the part of the trunk that still has living cells [
26]. In such cases, high concentrations in outermost rings would not reflect change through time in the environmental availability of those elements and should not be interpreted as evidence of recent environmental change. The fact that several elements measured here did not show any trend through time confirms that such a non-result is possible. By logical extension, the fact that other elements measured here did show upticks in concentration in recent decades can be taken as evidence that their environmental availability really might have increased in recent years, i.e., since about the year 2000. This is an important result for dendrochemistry and could be informative for Taylorville, i.e., indicating possible increases in public exposure to multiple elements through time in this urban setting.
Although ecologic studies cannot conclude that a particular environmental factor caused a particular illness, it should still be of interest to evaluate elements that have been shown by dendrochemical data to have increased recently for possible public health ramifications. A couple elements showing increases since 2000 (
Figure 4) are known to be harmful to human health, e.g., arsenic [
27] and nickel [
28]. However, other elements showing a recent uptick in availability in Taylorville are not obviously harmful to human health. Indeed, some elements in
Figure 4 are essential nutrients, i.e., needed in at least micro quantities for life, e.g., molybdenum [
29] and copper [
30], and iron is an essential macronutrient for life for which humans can be found deficient and advised to take as a dietary supplement [
31]. Nonetheless, even elements that are essential for life can be unhealthful in higher-than-normal amounts. For example, excessive intake of iron can cause various health issues, including cancer [
32,
33].
Beyond focusing on the health ramifications of any single metal, it might be of more interest in public health to consider increases through time in multiple metals, as the dendrochemical data from this research in Taylorville show. For example, a widescale environmental assessment across Pakistan showed many metals, including elements that are essential to life, to be elevated generally to the potential detriment of public health [
34]. A conclusion was that the general population is exposed to multiple metals, particularly through water and air, and especially through air in urban and roadside locales. Even without identifying public health ramifications of exposure to specific metals, it would be prudent for public health purposes to reduce the exposure to airborne metals.
Because it can be difficult to identify exact sources of multiple airborne metals solely from trees sampled for dendrochemical purposes, it would be useful to monitor environments in other ways for this purpose. For example, the study in Pakistan suggested routine monitoring programs for defining the distribution and severity of metal pollutants in Pakistan [
34]. The US has such a broad monitoring system in place, where air collection instruments are located across the country in order to assay air quality on a regular basis, without any specific public health incident taking place [
35]. However, even with as widespread and dense as the EPA air monitoring system is, not every town has monitors, especially not small towns. For example, Taylorville does not appear to have an EPA air monitoring station. For as foresightful as the national system of air quality monitoring system is, it cannot provide regular data and insight into air quality in places where no monitors are deployed. Additionally, the EPA air monitoring system focuses mostly on six so-called “criteria pollutants”: CO, Pb, NO
2, Ozone, PM
10, PM
2.5, and SO
2, i.e., not a suite of airborne metals [
35].
Alternatives to the EPA air monitoring stations exist for regularly assessing air for airborne pollutants, such as leaf surface chemistry [
36], lichen chemistry [
37], and dust collected from paved surfaces [
38]. For example, in Fallon, Nevada, all of these spatial monitoring techniques were used to assess airborne particulates throughout the entire town [
39] in order to fine-tune the sampling strategy for trees for dendrochemistry [
18]. Of these spatial techniques, leaf surface chemistry is recommendable. Trees are common in urban areas because they are planted and maintained for multiple landscape and urban forestry purposes [
40]. It is easy to collect leaves, to prepare samples for measurement, and to measure for elemental content [
39]. The measurement of samples, usually water extracts from the leaves, is straightforward, using ICP-MS, which is common technology these days. In Fallon, 95 trees were sampled for leaf surface chemistry as a spatial environmental monitoring technique to inform the sampling plan for dendrochemistry (
Figure 7). While the presence of an EPA superfund site in Taylorville suggested a single area as a location to collect tree ring samples, it would be better to have the entire town of Taylorville canvassed with broader spatial environmental monitoring in order to better inform the search for suitable trees for dendrochemistry. More broadly, it would be ideal that all small towns implemented such an environmental monitoring plan so that if/when any illness ever increased, baseline environmental data would already exist against which changes in environmental exposures could be discerned and sourced.


