Abstract
The southeast of Spain is one of the most arid and desertification-prone areas in continental Europe, with climate change contributing to this situation. Climatic conditions affect the availability of water in the plant structures of wild species, facilitating the onset and/or spread of forest fires and increasing aridity. The Region of Murcia, in southeastern Spain, has small forest stands of gall oak (Quercus faginea Lam.) with relict value. It is of interest to investigate the situation of these stands, allowing us to know about their distribution and their evolution in the face of climate change. For this purpose, previous dendrometric studies, available from a specific stand, are considered to be contrasted with current data, individual trees were geolocated, and distribution maps of contrasting environmental conditions were created. In general, gall oak has been observed to be distributed up to 1200 m altitude, especially in shady areas and embedded valleys and north-northeast orientations. Importantly, there was a positive evolution of vegetative development, with increments in the number of trees during the study period, despite some negative affections in specific areas due to climate change.
1. Introduction
The gall oak (Quercus fagínea Lam.) [1] displays a global distribution that is limited to the Mediterranean region (Figure 1a) [2]. Furthermore, this species’ global distribution is centered primarily in Spain, with smaller occurrences in the rest of Europe and more significant ones in northern Africa [3]. However, the sketch in Figure 1b does not depict the presence of the species in countries such as France and Italy [1].
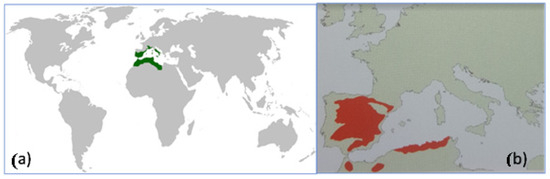
Figure 1.
Distribution of Quercur faginea Lam.: (a) Worldwide distribution (in green). (b) Distribution in the Mediterranean area (in red) (Yacine Kouba, 2014 & Sánchez Gómez et al., 2002) [1,2].
In Spain, among the regions of origin of gall oak, the Region of Murcia, in the southeastern Iberian Peninsula (Figure 2a), is one of the most important areas (Figure 2b) [3,4,5].
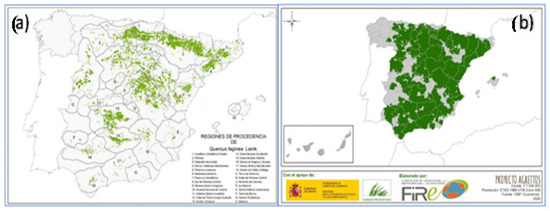
Figure 2.
Quercus faginea in Spain: (a) regions of origin and (b) areas of distribution (MITECO, 2003; Jiménez et al., 1997 & AAVV, 2023) [3,4,5].
Despite the southeastern area of the Iberian Peninsula being considered a potential distribution área of gall oak (Figure 2b), we are dealing with a species with very limited presence in the provinces of Murcia and Almería (southeastern Spain), representing a small remnant of its broader historical distribution. The areas under study can be classified within the so-called Spanish region of dry and warm origin, considered as areas with uniform ecological conditions where similar phenotypic or genetic characteristics can be found, depending on the species in question. One of the study areas of this region, Salinas in Yecla [4], is characterized by an average annual precipitation not exceeding 450 mm, with a nearly four-month period of summer drought and average temperatures close to 14 °C. The extreme moisture conditions make the species seek refuge in deep places with shaded orientations [6].
In moderately warm semi-arid Mediterranean climates with precipitation ranging between 300 and 600 mm per year, when precipitation reaches 300 mm, it is usually found on slopes and moister areas [6]. Other studies calculated the species’ habitat, taking into account the maximum and minimum values, in this case, of rainfall, defining the upper and lower limits, respectively. They also defined the optimal or central habitat, where the species thrives without issues. The optimal rainfall level is 665.6 mm per year, with the lower limit being 486 mm and the upper limit at 796.6 mm. It should be considered that most of the territory in the Region of Murcia provides a marginal habitat for Quercus faginea, as its rainfall is less than 486 mm per year [7]. Other authors mention annual rainfall near 600–700 mm per year, which is found in territories located in the northwestern part of the region [8,9].
On the other hand, global warming has led to the expansion of arid climate zones, resulting in changes in the seasonal activities and abundance of some plant species. Climate change entails an increase in the frequency and intensity of certain extreme meteorological and climatic events as a result of global warming, and they will continue to increase. Consequently, some of these extreme events, such as heatwaves, are expected to increase in frequency, intensity, and duration. Similarly, the frequency and intensity of droughts are also projected to increase in the future, as they already are in some regions that are prone to drought, predominantly in the Mediterranean basin [10]. Indeed, since 1975, the region has experienced 57 heat waves [11].
The terrestrial areas threatened by desertification make up 40% of the Earth’s surface. In Spain, the Canary Islands and the Mediterranean region are the areas at the highest risk of desertification [12]. The Region of Murcia, in the southeastern part of the Iberian Peninsula, is one of the driest areas in peninsular Spain, and a significant portion of it is at moderate to very high risk of desertification [13].
Desertification will have an impact on natural systems under climate change. Growing aridity increases the risk of extinction for some plant species, especially those already threatened due to small populations or restricted habitats [10]. Deforestation and forest degradation remain significant global threats. Forests are one of the Earth’s largest carbon and biodiversity reservoirs, crucial for mitigating climate change [14]. Assessing the well-being of terrestrial ecosystems is a complex task, and the use of indicators can facilitate this work. By analyzing parameters that respond to changes, such as dendrometric parameters related to plant species, desired information can be obtained [15].
Quejigo (Quercus faginea) populations in the Region of Murcia consist of small populations confined to areas that promote the isolation of small stands or scattered specimens throughout the regional territory. Additionally, this species is listed as a vulnerable species in the Regional Catalog of Protected Wild Flora of the Region of Murcia [16]. It should also be emphasized that in projections regarding the presence of this species, it is estimated to have disappeared from the Region of Murcia by 2071 [17].
Regarding its distribution on the Iberian Peninsula, a sketch of its distribution in the Spanish province of Guadalajara was already made in 1985 [18]. In the Region of Murcia, the gall oak, due to its water requirements, can be found in places where soil moisture or precipitation is higher than in the rest of the region, such as riverbeds and wetter mountain areas [19].
In light of all this, we hypothesized that the distribution and dendrometry of quejigo (Quercus faginea) can be used as an indicator of climate change and increased aridity in the Region of Murcia. Therefore, the objective of this work was to study the regional distribution of gall oak by comparing previous and actual dendrometric data from a realistic tree mass located in Barranco del Horcajo, Region de Murcia, Spain.
2. Material and Methods
2.1. Study Area
From a chorological perspective, the Region of Murcia in the southeast of Spain (Figure 3) [20] was selected as the study area with the aim of roughly determining the territorial distribution of Quejigo (Quercus faginea) stands, as well as significant trees of the species.
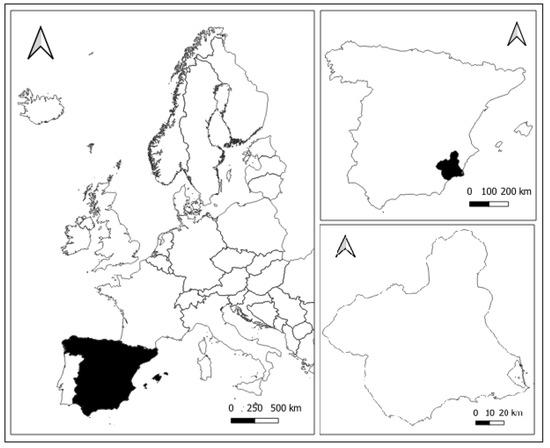
Figure 3.
Location of the study area. Source: National Geographic Information Center of Spain (CNIG-Spain, 2023) [20].
2.2. Methodology
Utilizing existing literature on the location of quejigo (Quercus faginea) in the Region of Murcia [1] (Figure 4), information gathered from informal interviews with the Environmental Agents in the Region of Murcia, and taking into account the necessary climatic conditions for the species’ survival, a survey was conducted in the areas of the Region of Murcia where the existence of these trees was most abundant.
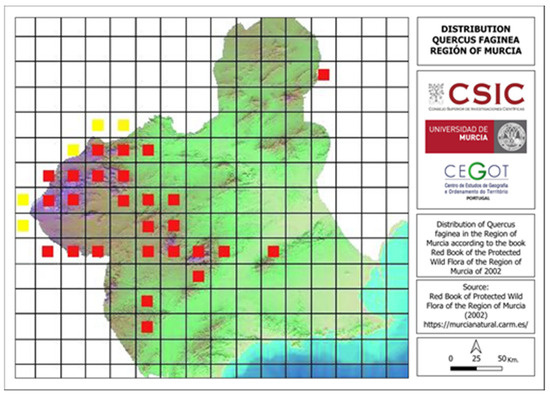
Figure 4.
Accurate distribution (in red) and probable distribution (in yellow) in tiles of Quercus faginea in the Region of Murcia. Source: Sánchez Gómez et al. (2002) [1].
Once the stands and significant trees were located, their geolocation was carried out using a GPS by walking through the area and individually locating each tree. New distribution maps and territorial locations of the trees were created using the geolocation points.
Given that data on certain dendrometric, lithological–edaphological, floral assemblages, etc., parameters were collected in 2006 for the stand located in the Barranco de El Horcajo (Sierra de Pedro Ponce) [21,22] (Figure 5), some of which were published in 2012 [23], and considering that the most important indicator for studying the well-being of natural systems is related to the growth and vegetation production capacity of the plant components of the system, data on parameters related to the species under study were collected [15]. Additionally, it is of interest to collect data on these characteristics again to detect their evolution with respect to vegetative growth and other aspects.
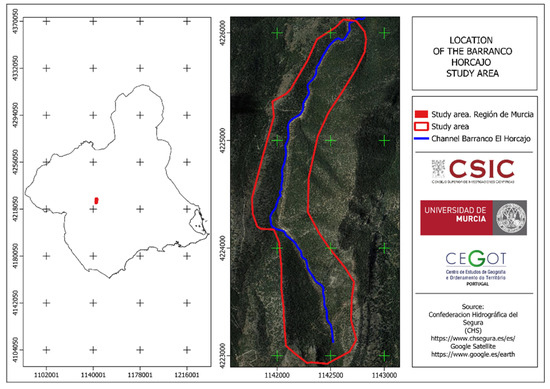
Figure 5.
Location of the Barranco El Horcajo. Source: Confederación Hidrográfica del Segura (CHS) (2023) y Google Terrain (2023) [21,22].
The Barranco El Horcajo is formed by a discontinuous-flow riverbed located in a mountainous area. In the study area, it is flanked by slopes with gradients approaching 40%, an altitude ranging between 1000 m and 1400 m, and a northeast orientation. This gives this small area climatic conditions that are colder and more humid than the surrounding areas.
Several pedestrian transects were carried out along the Barranco El Horcajo, covering both banks at intervals of 25 m, measured from the thalweg, transversely to the riverbed. The trees were randomly selected from those present in the study area in 2012 [23]. Once selected, they were geolocated, various measurements of the tree were taken, the species comprising the floral assemblage were noted, and the types of lithological–edaphological materials were recorded.
The variables measured for each tree were total tree height and the breast height diameter at 1.3 m from ground level (dbh1.30) by using a tape measure, distance from the base to and the height of the whorl where at least 50% of the branches are alive, with a laser-type hypsometer, crown height and crown width north–south and east–west orientation using a graduated and extendable pole [24]. Data on the floral assemblage were collected by identifying as many plants as possible in two concentric circles with a 5 and 10 m radius, respectively, with the tree’s axis serving as the central point. Regarding lithological–edaphological characteristics, three concentric circles with a radius of 1, 3, and 5 m were established, taking as a central reference point the axis of the trunk using a tape measure. Three classes of materials were considered: (1) clays and sands, (2) mixed (where 1 and 3 were present), and (3) rocky. By using a tape measure, the radii of the different crowns or circles were accurately determined, where vegetation data and soil type were collected.
The data collected in the field related to the trees were used to determine the volume of the standing trees. A quick method, when high precision is not required, is to use the formula devised for hardwoods in normal thickness designed by Auvergne (cited in [24], pp. 18–26), which was used for this work:
where V (volume) in m3, dbh (breast height diameter) in m at 1.3 m from the ground, and h (total height) in m, with the latter measure being of great interest as it reflects the quality of a given site [24].
V = 0.55·dbh1.302·h,
Quantifying the crown of the trees is important, as it allows the productive capacity to be assessed through biomass production. The volume of the crown of the different trees was calculated using the following formula:
where V (volume of the crown) is in m3, CL (crown length) is in m, and CS is the crown projection area. To calculate the independent variables, CL was obtained by the difference between the total height of the tree and the crown height, and CS was calculated as CScrown = (π/4) d2crown in m2, where dcrown is the diameter of the crown. To determine the crown diameter, the two measurements taken based on the previously mentioned orientation were used through the application of the formula: dcrown = (d1 + d2)/2, in m [24], where d1 is the diameter of the crown taken in the north–south direction and d2 in the east–west direction in m.
Vcrown = CLcrown × CScrown,
The variables measured both in 2006, published in 2012 [23], and in 2022 were the diameter of the tree at breast height at 1.30 m height (dbh1.30), total height, and crown surface area. In 2022, both the surface area and height or depth of the crown were measured. Thus, it was possible to compare between 2006 and 2022 the differences in total height, tree diameter at 1.30 m from ground level (dbh1.30), volume, and crown surface area. The selected trees in 2022 were representative of those analyzed in 2006. To test this, we applied the sample size Formula (3):
where N = population size; e = margin of error; z = score from confidence level. We applied a confidence level of 80%, an error of 10%, and N (total population in 2006) of 155 trees, resulting in a sample of 33 trees, which were measured in 2022.
Other parameters related to the ecology of the study area were also determined: the number of trees per hectare (N/ha) and the basal area (BA) per hectare. Basal área was obtained from the previously defined dbh, the following Formula (4):
3. Results and Discussion
The regional distribution of Quejigo (Quercus faginea) (Figure 6) shows some similarities and differences compared to what was described by Sánchez Gómez et al. (2002) [1], as can be observed in Figure 4 and Figure 6. Globally, the similarities are found in the mountains of Las Salinas (Yecla), Villafuertes (Moratalla), Pedro Ponce (Mula), Sierra Espuña (Alhama de Murcia and Totana), and the municipality of Bullas. On the contrary, specimens were not found in certain areas of the northwestern and southwestern areas of the Region of Murcia. Its presence was also not detected in the mountain El Carche (Jumilla and Yecla) or in the mountain La Zarza (Caravaca de la Cruz), although in the latter location, informal interviews with locals provided knowledge of the existence of some specimens [25].
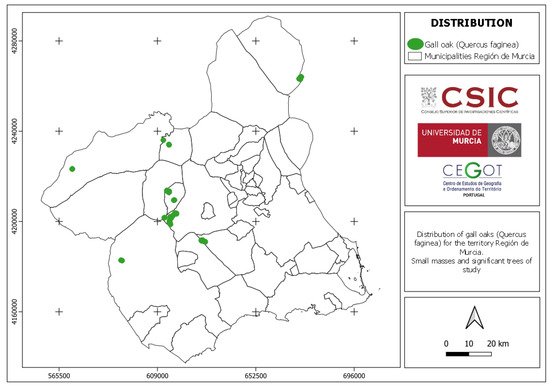
Figure 6.
Distribution of Quejigo (Quercus faginea) in the Región de Murcia.
The average height of the Quejigo (Quercus faginea) trees in the study area of Baranco El Horcajo, covering a surface of 17.5 ha, has increased, while tree density has slightly declined, from 155 trees recorded in 2006 to 151 in 2022, due to strong wind and rainstorms that uprooted trees. The mean basal area per hectare increased as a result of continuous tree growth, given the relatively optimal environmental conditions for the species, despite being within a generally arid regional setting (Table 1). Studies conducted on quejigo (Quercus faginea) show that with lower tree density, as a consequence of thinning techniques, growth remains stable. However, in unmanaged plots, a gradual decline is expected, according to data analysis based on the basal area [26]. In contrast, other studies on the basal area of various forest species, including encina (Quercus ilex) and alcornoque (Quercus suber), which are species related to Quejigo (Quercus faginea), showed continuous growth over a five-year observation period [27], similar to what was observed in the Barranco El Horcajo.

Table 1.
Eco-structural parameters of Quejigo (Quercus faginea) forest in the Barranco El Horcajo in the years 2006 and 2022.
In relation to the climate, rainfall has been considered the most limiting factor for vegetative growth. It has been observed that the presence of small stands or groves of oak is focused in the rainiest areas of the Region of Murcia, where annual average precipitation exceeds 400 mm and even surpasses 600 mm in certain locations [8,28], according to data collected by the authors on dates preceding their publication in 2007 and 2013 [8,28]. The pattern of annual mean precipitation distribution is consistent with the two maps in Figure 7. The northwest, along with certain mountainous enclaves, is identified as the area with the highest precipitation (Figure 7).
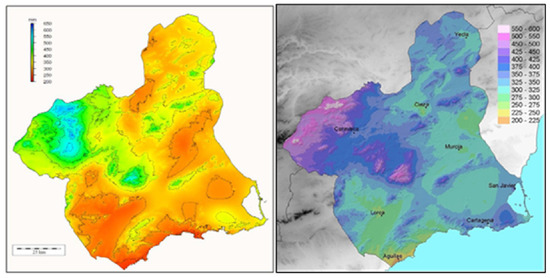
Figure 7.
Annual rainfall distribution in the Region of Murcia. Source: Alonso Sarría (2007) (left); Garrido Abenza et al. (2013) (right) [8,26].
Precipitation stands out as the most limiting factor for vegetative development. It has been observed that the presence of small masses or groves of gall oak occurs in the rainier areas of the Region of Murcia, where average annual precipitation exceeds 400 mm and can surpass 600 mm in specific locations [8,28] (Figure 7).
Regarding the Barranco El Horcajo, the information obtained about the oaks present in the Barranco El Horcajo shows an average annual rainfall that exceeds 500 mm (Figure 7 and Figure 8).
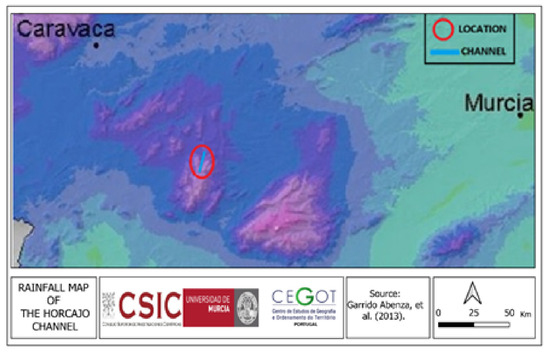
Figure 8.
The Barranco El Horcajo location. Garrido Abenza et al. (2013) [26].
The dendrometric information previously collected on the part of the oak forest present in the Barranco El Horjaco allows for a partial evolutionary insight based on specific dendrometric parameters, which are not available for the rest of the regional trees. Hence, there is an interest in focusing attention on this territory.
The data collected in the field were obtained for a total of 33 trees (Figure 9), compared to 155 in 2006, using a confidence level of 80%, an error of 10%, and a population size of 155 (N), which represents 21.30%. Considering the river bank, data for 16 trees on the river bank right were collected, compared to 79 in 2006, which represents 20.25%. On the left river bank, 17 trees out of 76 were surveyed, resulting in 22.36%.
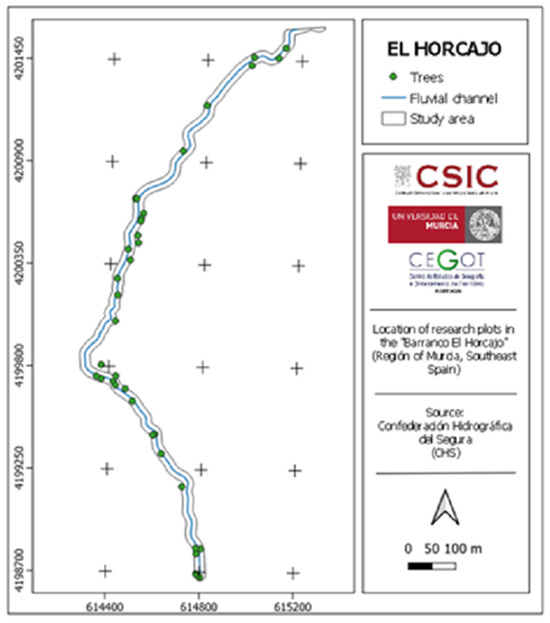
Figure 9.
Distribution of the studied trees in the Barranco El Horcajo. Source: Confederación Hidrográfica del Segura (CHS) [21].
Regarding the dimensions of the different trees measured in 2006, the average total height was 4.62 m [23]. The results obtained in 2022 show an increase in the parameters of the different variables (total height, diameter—dbh1.30—, and volume) compared to the 2006 data, referring to the stem. The calculation was performed using the formula: final mean values—initial mean values for total height, diameter, and volume (Table 2).
Table 2.
Miscellaneous statistics of Quercus faginea selected trees in the Barranco El Horcajo referring to the trunk.
The variance shows greater consistency and, therefore, less dispersion in total height in 2022, which is not the case for diameter or volume. Regarding the standard deviation, the values obtained for 2022 indicate greater variability and, consequently, a greater deviation from the mean. The coefficient of variation indicates high variability (>20%), being higher in the data obtained in 2006 for all the variables studied (Table 2).
The results obtained from the application of the t-test statistic for total height, diameter, and volume were highly significant (p < 0.01), using the data collected in 2006 and 2022. For total height, the results indicate statistically significant differences, which is a consequence of using two datasets from different periods, 2006 and 2022. This situation suggests a real change over time, possibly due to growth variations.
Although the difference in diameter between the two datasets is minimal, it is statistically significant, which may indicate a consistent change over time. Regarding volume, there is a noticeable, though slow, increase between the two years. The difference in the means between 2006 and 2022 indicates an increase in the studied variables (Table 2). It is worth noting that the slow rate of increases may be attributed to the species being considered as slow-growing.
In the case of the canopy, in 2006, only data regarding its surface area were collected, allowing us to determine the fraction of canopy cover (FCC). Comparisons have been established between the FCC of 2006 and 2022, revealing an increase in the average surface area, which amounts to an increase of 4.40 m2. The increase in crown surface (CS) between 2006 and 2022 was 14.39 m2 (Table 3).
Table 3.
Dendrometric absolute values of the canopy of quejigo (Quercus faginea) selected trees in the Barranco El Horcajo.
The basic floral assemblage identified comprises 18 species of wild flora, including herbaceous, shrubby, and arboreal species, with an important proportion of them being protected species. Some of them were present in both 2006 and 2022, as well as on both river banks and in both canopies, such as Brachypodium retusum (Pers.) P. Beauv, Juniperus communis L., and Pinus halepensis Mill. On the other hand, the least frequently present species include Acer monspessulanum L. and Allium triquetrum L. The rest exhibit varying degrees of presence (Table 4).
Table 4.
The basic floral assemblage of Quercus faginea selected trees in the Barranco El Horcajo.
The presence of one or another type of lithology–soil (substrate) displays varying values, ranging from 61% of occurrences of rocky terrain within a 5 m radius canopy on the river bank left in 2006 to only 3% of occurrences on the river bank right for the same year and canopy (Table 5).
Table 5.
Percentage of lithology–soil in crowns of 1, 3, and 5 m associated with Quercus faginea selected trees in the Barranco El Horcajo.
If we compare the river bank left of the two years, the predominance of rocky terrain stands out, with the clay–sandy type generally being the least common. In the case of the river bank right, the predominance is of the clay-sandy type in 2006, and this substrate is fairly evenly matched with the one defined as mixed (Figure 10).
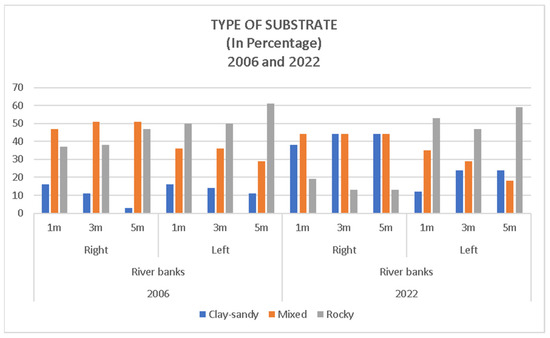
Figure 10.
Distribution of lithology in percentage in crowns of 1, 3, and 5 m associated with Quercus faginea selected trees in the Barranco El Horcajo.
Table 6 shows important geographic traits of the different areas where Quercus faginea can be found in the Region of Murcia. These data were assessed during the analysis and evaluation of other variables. It is important to highlight the location of small tree masses from 600 m of altitude up to 1300 m. All the small stands are located in riverbeds, sometimes ephemeral and at other times with continuous water flow (river), extending from the riverbed itself to the nearby slopes (Table 6). This circumstance coincides with what has been described for the warmer and drier areas of Spain (Alicante, Murcia, Almería, etc.), where oaks are primarily found in mountainous areas at the bottom of small valleys or ravines, where the best thermal and hydrological conditions create suitable microclimatic environments for their existence [18]. The terrains they grow on are predominantly oriented to the north. They all occupy the shady sides of the large mountains in the Region of Murcia. In agreement with Alcaraz Ariza et al. [19], it has been observed that the species inhabits soils that naturally have higher edaphic moisture.
Table 6.
Geographic traits of different áreas where Quercus faginea trees can be found in the Region of Murcia.
It is important to note the structural drought that has been affecting the Region of Murcia for years, leading to the progression of desertification. This is exacerbated by the adverse effects of climate change that the region is experiencing, such as water scarcity and rising temperatures [29]. Arid climates in the Region of Murcia have been on the rise, with an increase in the average annual temperature of approximately 0.88 °C between 1941 and 2019, both minimum and maximum temperatures affected by this rise. Regarding rainfall, no significant changes were observed within the framework of variability typical of the Mediterranean region [30,31].
In addition, several aridity indices were used to assess their evolution in the Region of Murcia from 2006 to 2022. The Lang aridity index relates annual precipitation to mean annual temperature, categorizing areas with values between 0 and 20 as desert and between 20 and 40 as arid. The De Martonne aridity index relates annual precipitation to mean annual temperature plus 10, classifying areas with values between 5 and 10 as semidesert (arid) and those between 10 and 20 as Mediterranean semi-arid. The thermopluviometric index of Danti Cereceda and Revenga (D and R) relates the product of the mean annual temperature multiplied by 100 to the total annual precipitation; an index greater than 4 indicates an arid zone, while values between 2 and 4 denote a semi-arid zone [32].
Of the total 17 years considered, the Lang index indicates that 12 years show desert conditions and the rest as arid; the De Martonne index classifies 8 years as semidesert (arid) and 9 as Mediterranean semi-arid, while the D and R index classifies all years as arid zones (Table 7, see [32]).
Table 7.
Values of different aridity indexes in the Region of Murcia (2006–2022).
When considering the evolution and trend of aridity in the Region of Murcia between 2006 and 2022, the R and D index shows a tendency to decrease, whereas the Lang and De Martonne indices indicate the opposite, pointing towards an increase in aridity (Figure 11).
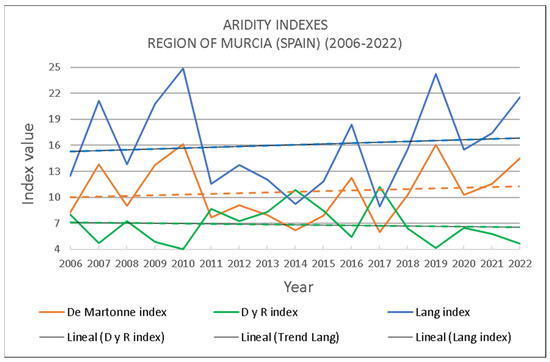
Figure 11.
Evolution of aridity conditions in the Region of Murcia through the application of different indices between the years 2006 and 2022.
4. Conclusions
The Region of Murcia is facing a future scenario in which climate change will lead to rising temperatures and increased aridity. Precipitation is not expected to undergo significant variations in the near future. Extreme events, a higher number of heatwaves, longer summers, prolonged periods of drought, and torrential rains will become the norm in the future climate of the Region of Murcia [30]. In response to this situation, plant species undergo physiological changes as they continually adapt to new conditions. Some wild plant species can serve as indicators of certain environmental changes. In the face of water scarcity and increased transpiration demands due to rising temperatures, some of these species experience water stress, which can severely reduce plant productivity [31].
Although the Region of Murcia is one of the driest regions in the Iberian Peninsula, with very low precipitation levels, there are small areas where soil moisture exceeds the general norm. This is the case in certain riverbeds or areas where rainfall exceeds the regional annual average of 300 mm, such as some inland mountains. These are the places where the located oak trees take refuge, exhibiting higher density in clearly mountainous enclaves like Sierra Espuña and Sierra de Pedro Ponce or in the vicinity of rivers, such as the Mula River in Bullas. Similar to other areas in Spain, such as Catalonia, gall oak is associated with pine forests and some specimens of holm oaks (Quercus rotundifolia). Likewise, they can be found in shady areas, ravines, and sheltered valleys, and in the case of the Region of Murcia, on north and northwest-facing slopes [33]. The species, also described in North Africa (Morocco, Algeria, and Tunisia), shows interest due to similar conditions to those in the Region of Murcia, including tree distribution, the climate, mountainous areas with higher precipitation, and a terrain formed by a dense hydrographic network with notable elevation changes, likely serving as a refuge for North African specimens [34].
It has been observed through the evaluation of dendrometric parameters in the small stand located in the Barranco El Horcajo Ravine (Sierra de Pedro Ponce) that between 2006 and 2022, all parameters measured in Quercus faginea increased. Furthermore, the low tree tree density due to thinning resulted in a stabilization of the growth rate. However, in unmanaged plots, a gradual decline of the growth index occurs, according to the data of the basal area. In contrast, the basal area per hectare increased in the study area of Barranco El Horcajo, where no thinning has been carried out.
There were no significant effects of climate change, as observed in the Quercus genera worldwide [35]. This suggests that the mountainous areas are less influenced by aridity. In the future, in warmer scenarios with high tree densities, their growth may be limited [36].
Author Contributions
Conceptualization, M.Á.S.-S. and A.A.; methodology, M.Á.S.-S. and A.A.; formal analysis, M.Á.S.-S. and A.A.; resources, M.Á.S.-S. and A.A.; writing—original draft preparation, A.A.; writing—review and editing, M.Á.S.-S. and A.A.; supervision, A.A.; funding acquisition, M.Á.S.-S. and A.A. All authors have read and agreed to the published version of the manuscript.
Funding
This research was funded by the European Commission through the LIFE program, grant number LIFE17/NAT/ES/000184.
Institutional Review Board Statement
Not applicable.
Informed Consent Statement
Not applicable.
Data Availability Statement
All data will be available upon reasonable request from the corresponding author.
Acknowledgments
The authors thank José Antonio Domínguez for the critical reading of the manuscript.
Conflicts of Interest
The authors declare no conflicts of interest.
References
- Sánchez Gómez, P.; Carrión Vilches, M.A.; Hernández González, A.; Guerra Montes, J. Quercus faginea. In Libro Rojo de la Flora Silvestre de la Región de Murcia; Dirección General del Medio Natural. Consejería de Agricultura, Agua y Medio Ambiente; Región de Murcia, Edt.: Murcia, Spain, 2002; Volume II, pp. 456–458. [Google Scholar]
- Kouba, Y. Distribución Espacial, Dinámica Espacio-Temporal, Regeneración y Diversidad en las Comunidades de Quercus faginea del Pirineo Central Aragonés. Ph.D. Thesis, University of Zaragoza, Zaragoza, Spain, 2014. Available online: https://digital.csic.es/handle/10261/107613 (accessed on 11 October 2023).
- Jiménez, M.P.; Díaz-Fernández, P.M.; Gil, L. Regiones de procedencia de Quercus pyrenaica Willd., Quercus faginea Lam. y Quercus canariensis Willd. Cuad. Soc. Española Cienc. For. 1997, 3, 135–141. [Google Scholar]
- Ministry of Ecological Transition and the Demographic Challenge [MITECO]. Regiones de Procedencia. 2003. Available online: https://www.miteco.gob.es/content/dam/miteco/es/biodiversidad/temas/recursos-geneticos/map_Quercus%20faginea_tcm30-139391.jpg (accessed on 29 October 2023).
- AAVV. Quercus faginea. In Fundación Internacional para la Restauración de Ecosistemas (FIRE); 2023; Available online: https://creatuseto.fundacionfire.org/especie/quercus-faginea/ (accessed on 3 December 2023).
- Ministry of Ecological Transition and the Demographic Challenge [MITECO]. Quercus faginea. 2023. Available online: https://www.miteco.gob.es/content/dam/miteco/es/biodiversidad/temas/inventarios-nacionales/Quercus_faginea_tcm30-200498.pdf (accessed on 4 December 2023).
- López Senespleda, E.; y Sánchez Palomares, O. Caracterización del hábitat y áreas potenciales fisográfico-climáticas del quejigo (Quercus faginea Lam.) en la provincia de Guadalajara. Cuad. Soc. Española Cienc. For. 2008, 25, 267–272. [Google Scholar]
- Alonso Sarriá, F. El clima. In Atlas Global de la Región de Murcia; Romero Díaz, A., Alonso Sarriá, F., Eds.; Cátedra de Historia Contemporánea de la Universidad de Murcia, La Verdad-CMM S.A.: Murcia, Spain, 2007; pp. 146–156. [Google Scholar]
- Murcianatural. Características Climáticas de la Región de Murcia. 2004. Available online: https://murcianatural.carm.es/web/guest/clima (accessed on 12 October 2023).
- IPCC. Resumen para responsables de políticas. In El Cambio Climático y la Tierra: Informe Especial del IPCC Sobre el Cambio Climático, la Desertificación, la Degradación de las Tierras, la Gestión Sostenible de las Tierras, la Seguridad Alimentaria y los Flujos de Gases de Efecto Invernadero en los Ecosistemas Terrestres; Shukla, P.R., Skea, J., Buendia, E.C., Masson-Delmotte, V., Pörtner, H.-O., Roberts, D.C., Zhai, P., Slade, R., Connors, S., van Diemen, R., Eds.; IPCC: Geneva, Switzerland, 2019. [Google Scholar]
- Gómez, M. ¿Más Cerca de los 50 °C? Así Serán Nuestros Veranos en 30 Años. Eltiempo.es. 2023. Available online: https://www.eltiempo.es/noticias/cambio-climatico-asi-seran-los-veranos-en-2050 (accessed on 3 January 2024).
- Van den Berg, E. Spain’s Advancing Desert. National Geographic. 18 June 2020. Available online: https://www.nationalgeographic.com.es/naturaleza/grandes-reportajes/espana-desierto-que-avanza_11448 (accessed on 27 August 2023).
- Ministry of Ecological Transition and the Demographic Challenge [MITECO]. Desertification in Spain. 2022. Available online: https://www.miteco.gob.es/es/biodiversidad/temas/desertificacion-restauracion/lucha-contra-la-desertificacion/lch_espana.aspx (accessed on 22 October 2022).
- ONU. Informe de los Objetivos de Desarrollo Sostenible. Edición Especial. 2023. Available online: https://unstats.un.org/sdgs/report/2023/The-Sustainable-Development-Goals-Report-2023_Spanish.pdf (accessed on 22 October 2022).
- Garay, C. Las Tres Constantes Vitales Que Indican la Salud de los Bosques de España. National Geographic, 17 Ene 2022. Available online: https://www.nationalgeographic.es/medio-ambiente/2022/01/las-tres-constantes-vitales-que-indican-la-salud-de-los-bosques-de-espana (accessed on 11 June 2023).
- Decreto n° 50/2003, de 30 de Mayo or el que se Crea el Catálogo Regional de Flora Silvestre Protegida de la Región de Murcia y se Dictan Normas Para el Aprovechamiento de Diversas Especies Forestales. Boletín Oficial de la Comunidad Autónoma de la Región de Murcia (BORM). BORM Número 131 de 10 de Junio de 2003. Available online: https://www.borm.es/services/anuncio/ano/2003/numero/6889/pdf?id=13383 (accessed on 15 January 2024).
- Ministry of Ecological Transition and the Demographic Challenge [MITECO]. Quejigo in Spain. 2011. Available online: https://www.miteco.gob.es/content/dam/miteco/es/biodiversidad/temas/inventarios-nacionales/Quercus_faginea_tcm30-200498.pdf (accessed on 20 February 2024).
- San Miguel Ayanz, A. Ecología, Tipología, Valoración y Alternativas Silvopascicolas de los Quejigares (Quercus faginea L.) de Guadalajara; Final Project; Universidad Politécnica de Madrid: Madrid, Spain, 1985; Available online: https://oa.upm.es/13832/ (accessed on 25 April 2024).
- Alcaráz Ariza, F.; Botías Pelegrín, M.; García Ruíz, R.; Ríos Ruíz, S.; Rivera Núñez, D.; Robledo Miras, A. Flora Básica de la Región de Murcia; Sociedad Cooperativa de Enseñanza Severo Ochoa: Murcia, Spain, 2002; p. 264. [Google Scholar]
- CNIG-España. Centro de Descargas. Centro Nacional de Información Geográfica de España. 2023. Available online: https://centrodedescargas.cnig.es/CentroDescargas/index.jsp (accessed on 20 November 2024).
- Confederación Hidrográfica del Segura (CHS). Red Hidrográfica de la Cuenca del Río Segura. 2023. Available online: https://www.chsegura.es/es/ (accessed on 30 October 2023).
- Google Earth Terrain. Available online: https://www.google.es/earth/ (accessed on 5 October 2023).
- Sánchez Sánchez, M.A.; Romero Díaz, A.; Belmonte Serrato, F. Distribución de quejigos en el barranco de El Horcajo en las sierras de Pedro Ponce y Cambrón (Región de Murcia). In Las Zonas de Montaña: Gestión y Biodiversidad; Cunill, R., Ed.; VII Congreso Español de Biogeografía; Departament de Geografía, Universitat Autónoma de Barcelona: Bellaterra, Barcelona, Spain, 2012; pp. 190–195. [Google Scholar]
- Lòpez Serrano, F.R.; García Morote, F.; Cerro del Borja, A. Dasometría. Ciencia de la Medición Forestal; Popular Libros: Albacete, Spain, 2003; p. 317. [Google Scholar]
- AAVV. Estrategia Forestal de la Región de Murcia; Comunidad Autónoma de la Región de Murcia: Murcia, Spain, 2003; p. 215. Available online: https://murcianatural.carm.es/c/document_library/get_file?uuid=5881e6f2-95c7-46da-8dc5-60ff6d4af1f5&groupId=14 (accessed on 7 November 2023).
- Fernández de Uña, L.; Cañellas, I.; Bachiller, A.; Viscasillas, E.; y Gea Izquierdo, G. Efecto de la Selvicultura en la Respuesta al Cambio Climático de Masas de Quercus Submediterráneos. Vitoria, 6° Congreso Forestal Español 2013. 6CFE01-115. Available online: https://secforestales.org/publicaciones/index.php/congresos_forestales/article/download/14446/14289/14438 (accessed on 8 February 2023).
- Di Cosmo, L.; Giuliani, D.; Dickson, M.M.; Gasparini, P. An individual-tree linear mixed-effects model for predicting the basal area increment of major forest species in Southern Europe. For. Syst. 2020, 29, e019. [Google Scholar] [CrossRef]
- Garrido Abenza, R.; Palenzuela Cruz, J.E.; Bañón Peregrín, L.M. Atlas Climático de la Región de Murcia; Agencia Estatal de Meteorología (AEMET): Madrid, Spain, 2013.
- AAVV. Declaración Institucional del Consejo de Gobierno de la Región de Murcia. In Francisco Victoria Jumilla, Cambio Climático en la Región de Murcia, del Acuerdo de París a la Emergencia Climática; Consejería de Agua, Agricultura, Ganadería, Pesca y Medio Ambiente de la Región de Murcia: Murcia, Spain, 2021; p. 305. [Google Scholar]
- Palenzuela Cruz, J.E.; Bañón Peregrín, M.N.; Valcarcel Hernández, J.A.; García Valero, J.A. El Cambio Climático, Presente y Tendencias Futuras en la Región de Murcia. In Francisco Victoria Jumilla, Cambio Climático en la Región de Murcia, del Acuerdo de París a la Emergencia Climática; Consejería de Agua, Agricultura, Ganadería, Pesca y Medio Ambiente de la Región de Murcia: Murcia, Spain, 2021; pp. 19–48. [Google Scholar]
- Mendoza Herrer, O. Respuesta Fisiológica de la Encina (Quercus ilex subsp. Rotundifolia) a la Sequía Estival, Edáfica y Atmosférica, del Clima Mediterráneo: Análisis de los Mecanismos Hidráulicos y Fotosintéticos. Ph.D. Thesis, Universidad de Zaragoza, Zaragoza, Spain, 2023. Available online: https://zaguan.unizar.es/record/127613/files/?ln=en (accessed on 25 June 2024).
- Amestoy Alonso, J.; Amestoy García, J. Precipitaciones, aridez, sequía y desertificación de la comarca del Campo de Cartagena. Lurralde. Invest. Espac. 2009, 32, 119–154. [Google Scholar]
- Sanz, M.; Sobrino, E. Nuevos datos altitudinales sobre Quercus faginea Lam. Subsp. Faginea en el sur de Cataluña. Lagascalia 2000, 21, 289–294. [Google Scholar]
- UICN. Libro Rojo de los Ecosistemas Forestales de Marruecos; UICN: Gland, Switzerland; Málaga, Spain, 2015; p. 164. [Google Scholar]
- Marañon, T.; Pérez Ramos, M. Los bosques de Quercus ante el proceso del cambio global. Quercus 2013, 334, 68–69. Available online: https://www.revistaquercus.es/noticia/5648/sumario/quercus-sumario-cuaderno-334-/-diciembre-2013-.html (accessed on 25 August 2024).
- Fernández de Uña, L. Respuesta de Pinus Sylvestris y Quercus spp. Sub-Mediterráneos al Clima y La Competencia a Diferentes Escalas: Implicaciones Ante Escenarios de Cambio Climático; Sociedad Española de Ciencias Forestales: Alcalá de Henares, Spain, 2016. [Google Scholar]
Disclaimer/Publisher’s Note: The statements, opinions and data contained in all publications are solely those of the individual author(s) and contributor(s) and not of MDPI and/or the editor(s). MDPI and/or the editor(s) disclaim responsibility for any injury to people or property resulting from any ideas, methods, instructions or products referred to in the content. |
© 2025 by the authors. Licensee MDPI, Basel, Switzerland. This article is an open access article distributed under the terms and conditions of the Creative Commons Attribution (CC BY) license (https://creativecommons.org/licenses/by/4.0/).