

Using Infrared Thermography to Assess Musculoskeletal Overload in the Hands of Harvester Operators

 ,
,  ,
,  and
and 
Abstract
1. Introduction
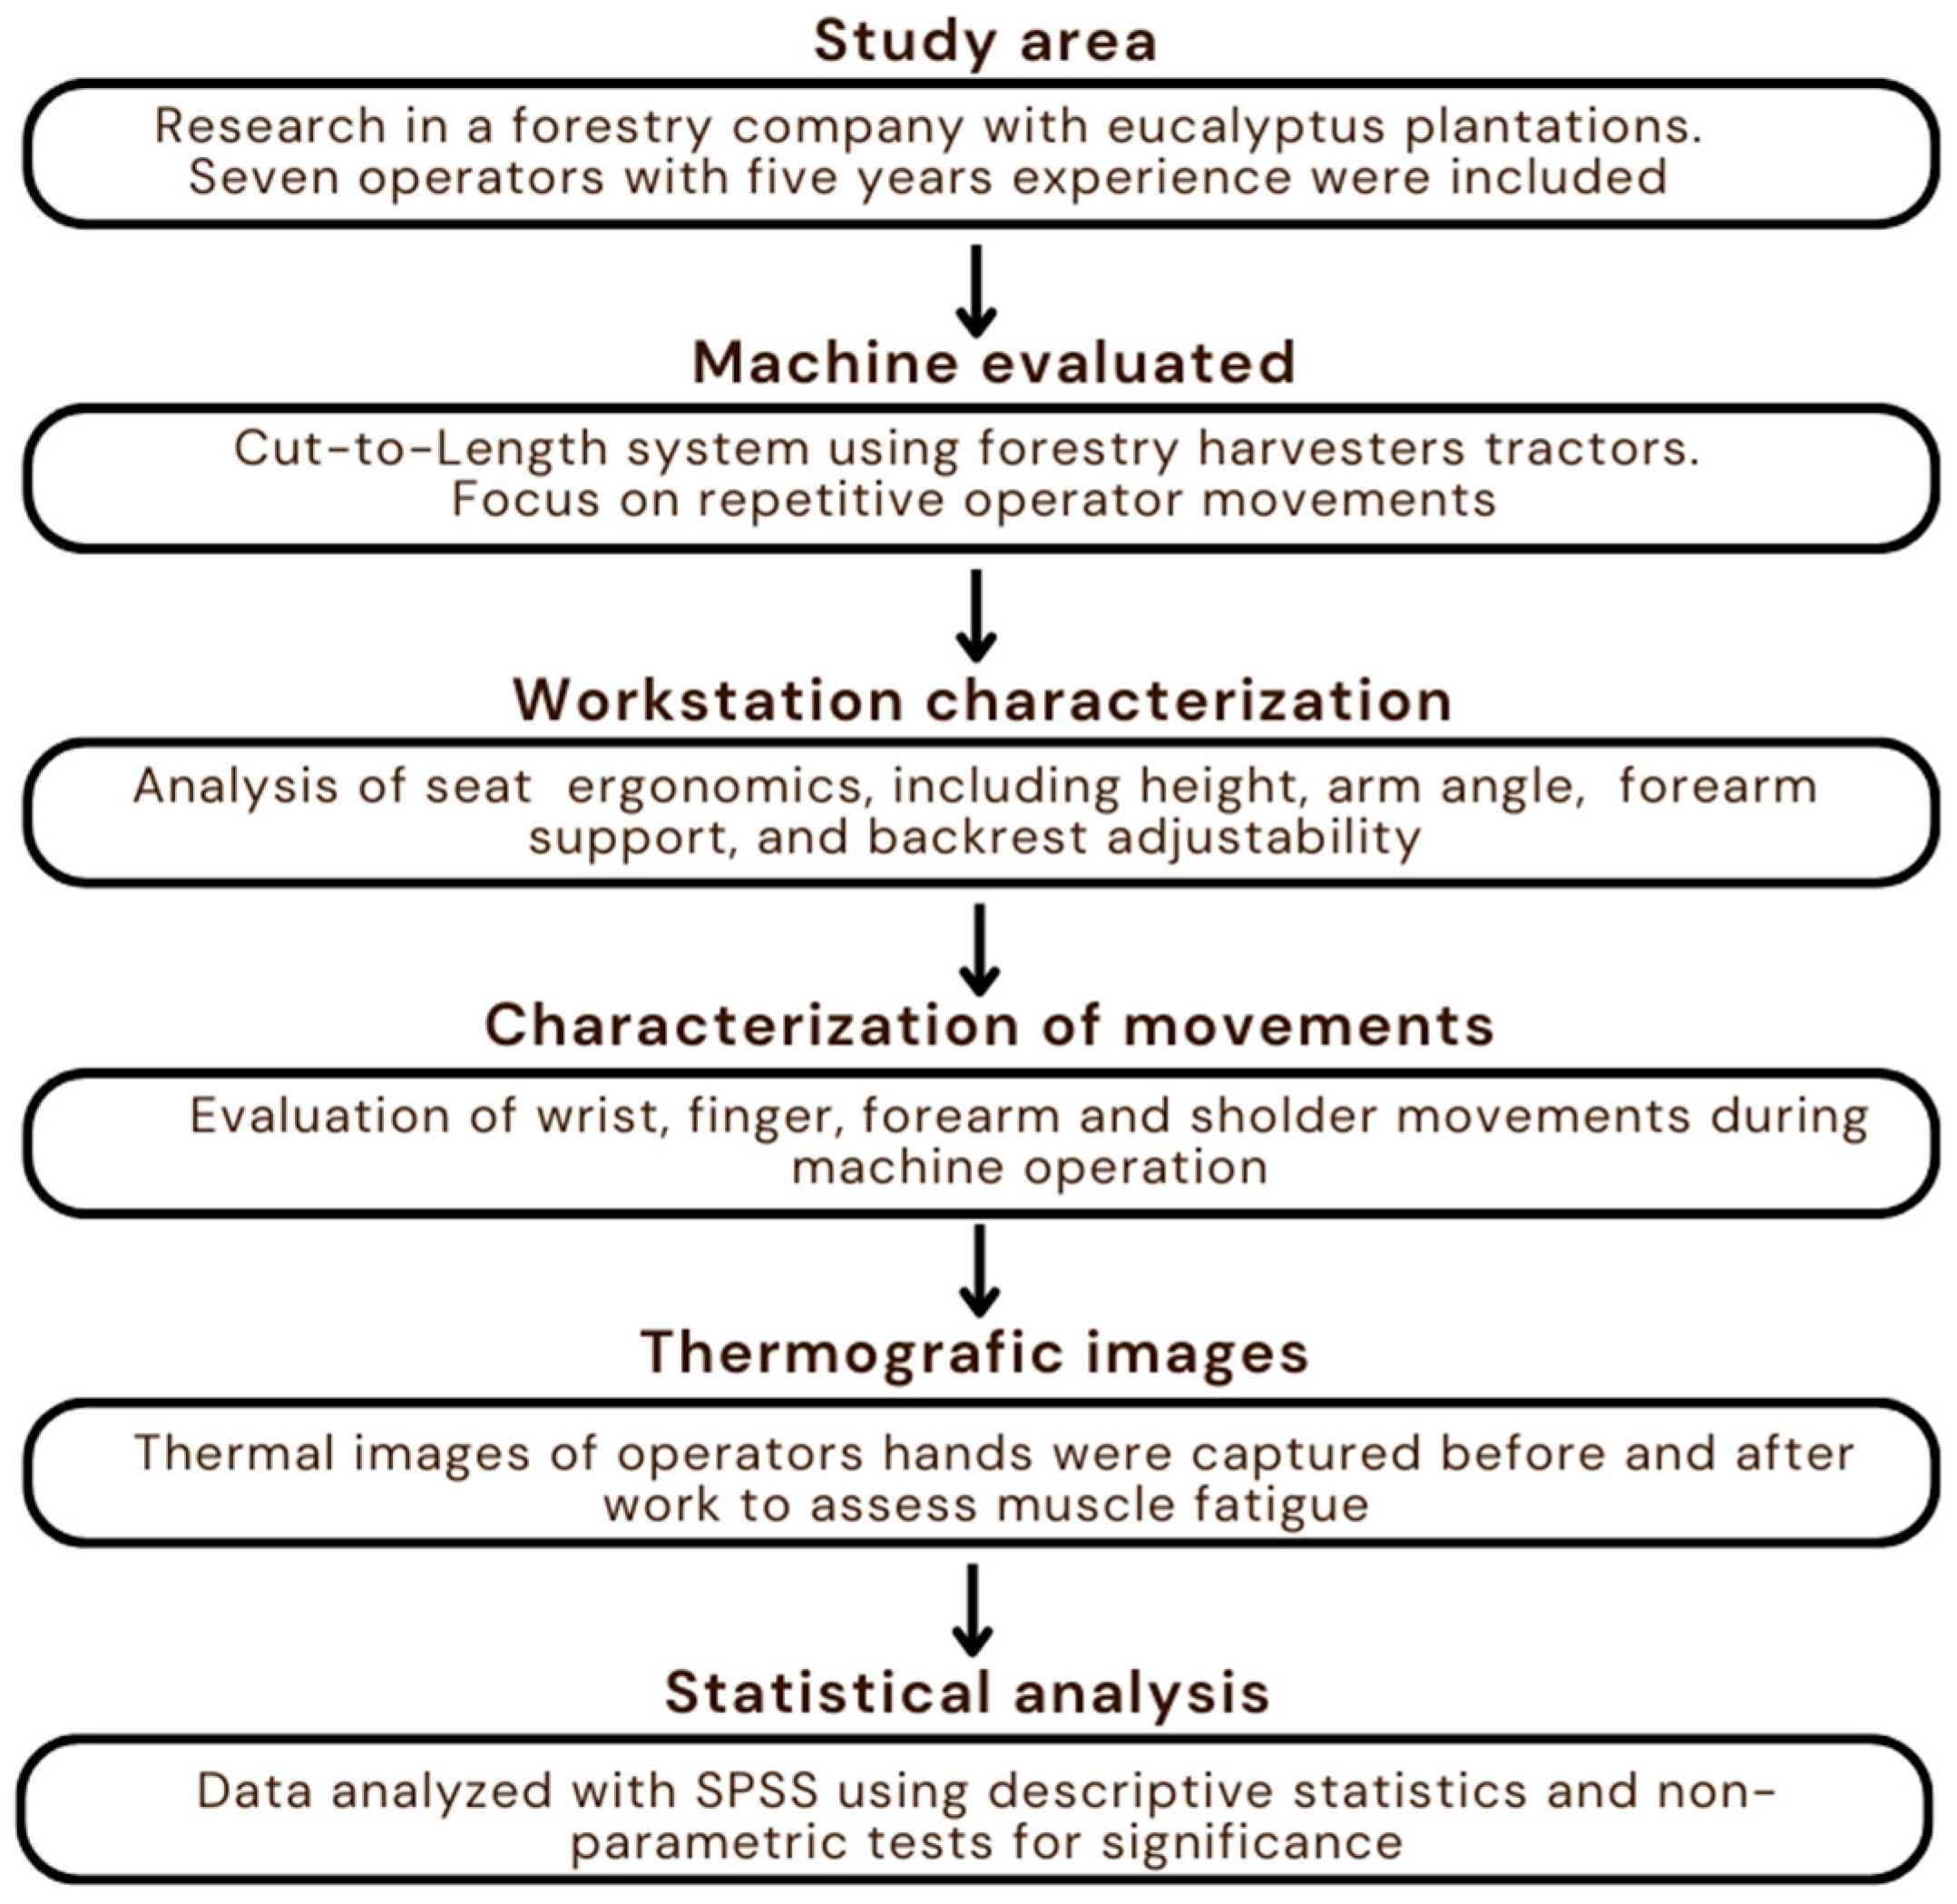
2. Materials and Methods
2.1. Study Area and Sample
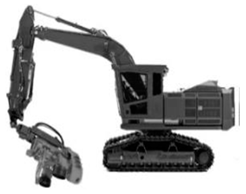
2.2. Machines Evaluated
2.3. Workstation Characterization
2.4. Characterization of Movements
- Wrist and finger movements: The operators used their first and second fingers to make fine adjustments to the joystick, applying pressure to move the controls in different directions (forward, backward, and laterally). Although these movements are small, they require precision and could result in repetitive effort when performed for long periods.
- Forearm movements: Forearm rotation was often necessary to adjust the joystick to larger angles or to perform longer-range movements. This movement involved flexing and extending the elbow, which could overload the forearm and upper arm muscles, especially when performed with the hand in suboptimal positions.
- Shoulder movements: Positioning the joystick required the operator to move their shoulder, especially when the device was positioned at a height or at non-ergonomic angles. Repetitive shoulder abduction or rotation movements can cause muscle overload and fatigue.
- Body and neck movements: Operators adopted non-ideal positions in some situations, such as twisting their torso or tilting their head to improve their view of the device. The additional strain on the neck and spine due to these postural adjustments can contribute to increased muscle overload and to developing cervical and back pain.
2.5. Obtaining Thermographic Images
2.6. Statistical Analysis
3. Results
4. Discussion
5. Conclusions
Author Contributions
Funding
Data Availability Statement
Acknowledgments
Conflicts of Interest
References
- Oliveira, F.M.; Lopes, E.S.; Koehler, H.S.; Behling, A. Application of an Integrated Ergonomic Indicator (IEI) in evaluating forest machines. Int. J. For. Eng. 2021, 32, 256–265. [Google Scholar] [CrossRef]
- Sláma, D.; Mergl, V.; Pavlíková, E.A. Analysis of the heart rate of operators of forwarding machines during work activities. Forests 2023, 14, 1348. [Google Scholar] [CrossRef]
- Diniz, C.C.; Timofeiczyk Junior, R.; Garzel, J.C.; Robert, R.C.G.; Sessions, J.; Lopes, E.S. Comparing different replacement policies for logging machines in Brazil. Croat. J. Eng. 2024, 45, 57–70. [Google Scholar] [CrossRef]
- Holzfeind, T.; Visser, R.; Chung, W.; Holzleitner, F.; Erber, G. Development and benefits of winch-assist harvesting. Curr. For. Rep. 2020, 6, 201–209. [Google Scholar] [CrossRef]
- Pagnussat, M.B.; Lopes, E.S.; Robert, R.C.G. Machine availability and productivity during timber harvester machine operator training. Can. J. Res. 2021, 51, 433–438. [Google Scholar] [CrossRef]
- Malinen, J.; Taskinen, J.; Tolppa, T. Productivity of cut-to-length harvesting by operators’ age and experience. Croat. J. For. Eng. 2018, 39, 15–22. [Google Scholar]
- Martins, A.B.; Lopes, E.S.; Pagnussat, M.B.; Fiedler, N.C.; Oliveira, F.M. Upper limb posture and movement during tracked versus wheeled harvester operation on pinus thinning. Inter. J. Eng. 2020, 31, 263–271. [Google Scholar] [CrossRef]
- Synwoldt, U.; Gellerstedt, S. Ergonomic initiatives for machine operators by the Swedish logging industry. Appl. Erg. 2003, 34, 49–156. [Google Scholar] [CrossRef] [PubMed]
- Becerra, A.G.; Olguín-Tiznado, J.E.; Alcaraz, J.L.G.; Wilson, C.C.; Garcia-Rivera, B.R.; Vardasca, R.; López-Barreras, J.A. Infrared thermal imaging monitoring on hands when performing repetitive tasks: An experimental study. PLoS ONE 2021, 16, e0250733. [Google Scholar] [CrossRef] [PubMed]
- Muggleton, J.; Allen, R.; Chappell, P. Hand and arm injuries associated with repetitive manual work in industry: A review of disorders, risk factors and preventive measures. Ergonomics 1999, 42, 714–739. [Google Scholar] [CrossRef]
- Brioschi, M.L.; Teixeira, M.J.; Yeng, L.T.; Silva, F.M.R.M. Manual de Termografia Médica (Based of the International Consensus and Guidelines For Medical Thermography), 1st ed.; Andreoli: São Paulo, Brazil, 2012; 239p. [Google Scholar]
- Lubkowska, A.; Pluta, W. Infrared thermography as a non-invasive tool in musculoskeletal disease rehabilitation—The control variables in applicability—A systematic review. Appl. Sci. 2022, 12, 4302. [Google Scholar] [CrossRef]
- Kawasaki, R.; Sakata, A.; Hosoda, C.; Harada, S.; Soeda, T.; Nishida, Y.; Matsumoto, N.; Tatsumi, K.; Nogami, K.; Yoshimura, Y.; et al. The Use of infrared thermography for non-invasive detection of bleeding and musculoskeletal abnormalities in patients with hemophilia: An observational study. Thromb. J. 2023, 21, 70. [Google Scholar] [CrossRef] [PubMed]
- Vaz, R.; Andreoli, C.V.; Bittencourt, N.F.N.; Lasmar, R.C.P.; Kanope, T.; Silva, R.P.; Assis, M.G. The Integrated Use of Thermography and Ultrasonography as Predictive Load Control Model of Muscle Injuries in Soccer Athletes. J. Clin. Med. Image 2022, 6, 1–8. [Google Scholar]
- Côrte, A.C.; Pedrinelli, A.; Marttos, A.; Souza, I.F.G.; Grava, J.; Hernandez, A.J. Infrared thermography study as a complementary method of screening and prevention of muscle injuries: Pilot study. BMJ Open Sport. Exerc. Med. 2019, 5, e000431. [Google Scholar] [CrossRef]
- Dindorf, C.; Bartaguiz, E.; Janowicz, E.; Fröhlich, M.; Ludwig, O. Effects of unilateral muscle fatigue on thermographic skin surface temperature of back and abdominal muscles—A pilot study. Sports 2022, 10, 41. [Google Scholar] [CrossRef]
- Gold, J.E.; Cherniack, M.; Hanlon, A.; Soller, B. Skin temperature and muscle blood volume chances in the hand after typing. Inter. J. Ind. Erg. 2010, 40, 161–174. [Google Scholar] [CrossRef]
- Camargo, C.; Ordorica, J.; De La Vega, E.; Olguín, J.; López, O.; López, J. Analysis of temperature on the surface of the wrist due to repetitive movements using sensory thermography. Work 2012, 41 (Suppl. S1), 2569–2575. [Google Scholar] [CrossRef] [PubMed]
- Gold, J.E.; Cherniack, M.; Buchholz, B. Infrared thermography for examination of skin temperature in the dorsal hand of office workers. Eur. J. Appl. Physiol. 2004, 93, 45–251. [Google Scholar] [CrossRef]
- Magas, V.; Neves, E.B.; Moura, M.A.M.; Nohama, P. Avaliação da aplicação da termografia no diagnóstico de tendinite de punho por Ler/Dort. In Proceedings of the XXIII Brazilian Congress on Biomedical Engineering, Porto de Galinhas, PE, Brazil, 1–5 October 2012. [Google Scholar]
- Sokolov, A.; Seliverstov, A.; Sukhanov, Y. Forest machine automation and ergonomics. E3s Web Conf. 2023, 389, 03002. [Google Scholar] [CrossRef]
- Bandeira, F.; Neves, E.B.; Moura, M.A.M.; Nohama, P. A termografia no apoio ao diagnóstico de lesão muscular no esporte. Rev. Bras. Med. Esporte 2014, 20, 59–64. [Google Scholar] [CrossRef]
- Assunção, A.A. Sistema Musculoesquelético: Lesões por esforços repetitivos (LER). In Patologia do Trabalho; Mendes, R., Ed.; Atheneu: Rio de Janeiro, Brazil, 1997. [Google Scholar]
- Bastos, D.; Silva, G.; Teixeira, L.; Lustosa, M.; Borda, M.; Couto, S.E.; Vicente, T. Dor. Rev. SBPH 2007, 10, 86–96. [Google Scholar] [CrossRef]
- Waersted, M.; Hanvold, T.N.; Veiersted, K.B. Computer work and musculoskeletal disorders of the neck and upper extremity: A systematic review. BMC Musculoskelet. Disord. 2010, 11, 79. [Google Scholar] [CrossRef] [PubMed]
- Trotta, J.; Ulbricht, L. Termografia no diagnóstico complementar de doenças músculo esqueléticas. Pan Am. J. Med. Thermol. 2015, 2, 7–13. [Google Scholar] [CrossRef]


| Machine | Control Details | Technical Specifications | Prefix | Operator Age (Years) |
|---|---|---|---|---|
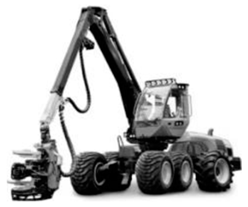 |  | Harvester tires 8 × 8 drive Weight: 21,500 kg Power: 210 kW | HV2 | 29 |
 |  | Harvester tracks Track drive Weight: 21,500 kg Power: 118 kW | HV1 | 37 |
| HV3 | 38 | |||
| HV4 | 31 | |||
| HV5 | 40 | |||
| HV6 | 55 | |||
| HV7 | 37 |
| Hand Region | Region of Interest (ROI) | Description |
|---|---|---|
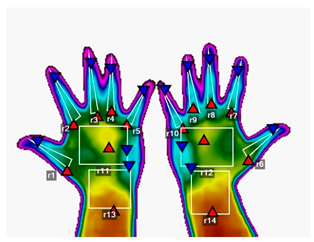 | r1 | 1st left finger |
| r2 | 2nd left finger | |
| r3 | 3rd left finger | |
| r4 | 4th left finger | |
| r5 | 5th left finger | |
| r6 | 1st right finger | |
| r7 | 2nd right finger | |
| r8 | 3rd right finger | |
| r9 | 4th right finger | |
| r10 | 5th right finger | |
| r11 | Left palmar region | |
| r12 | Right palmar region | |
| r13 | Left carpal region | |
| r14 | Right carpal region |
| Thermal Variation (°C) | Condition |
|---|---|
| Δt ≤ 0.30 | Normal |
| 0.30 < Δt ≤ 0.60 | Light |
| 0.60 < Δt ≤ 1.00 | Moderate |
| Δt > 1.00 | Intense |
| Model | Work Shift | Work Schedule Day | ||
| 1 | 3 | 6 | ||
| HV2 | Before | 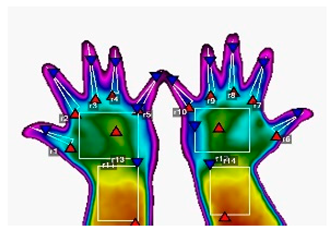 |  |  |
| After | 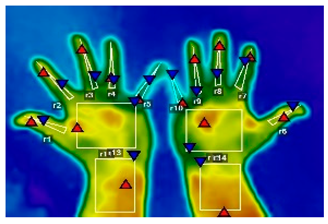 |  | 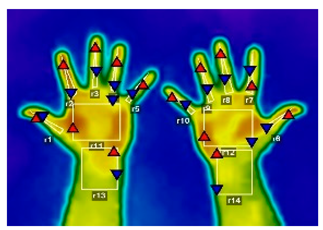 | |
| HV6 | Before | 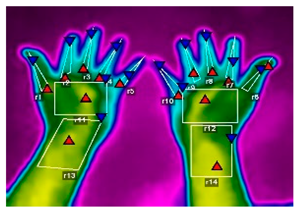 | 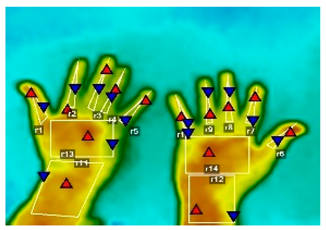 | 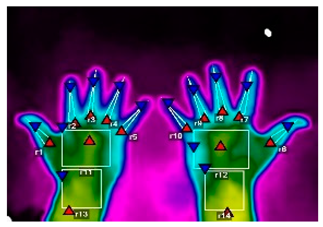 |
| After |  | 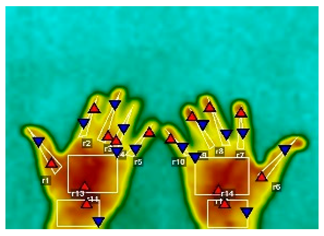 | 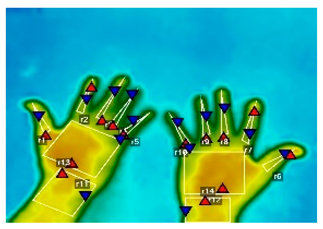 | |
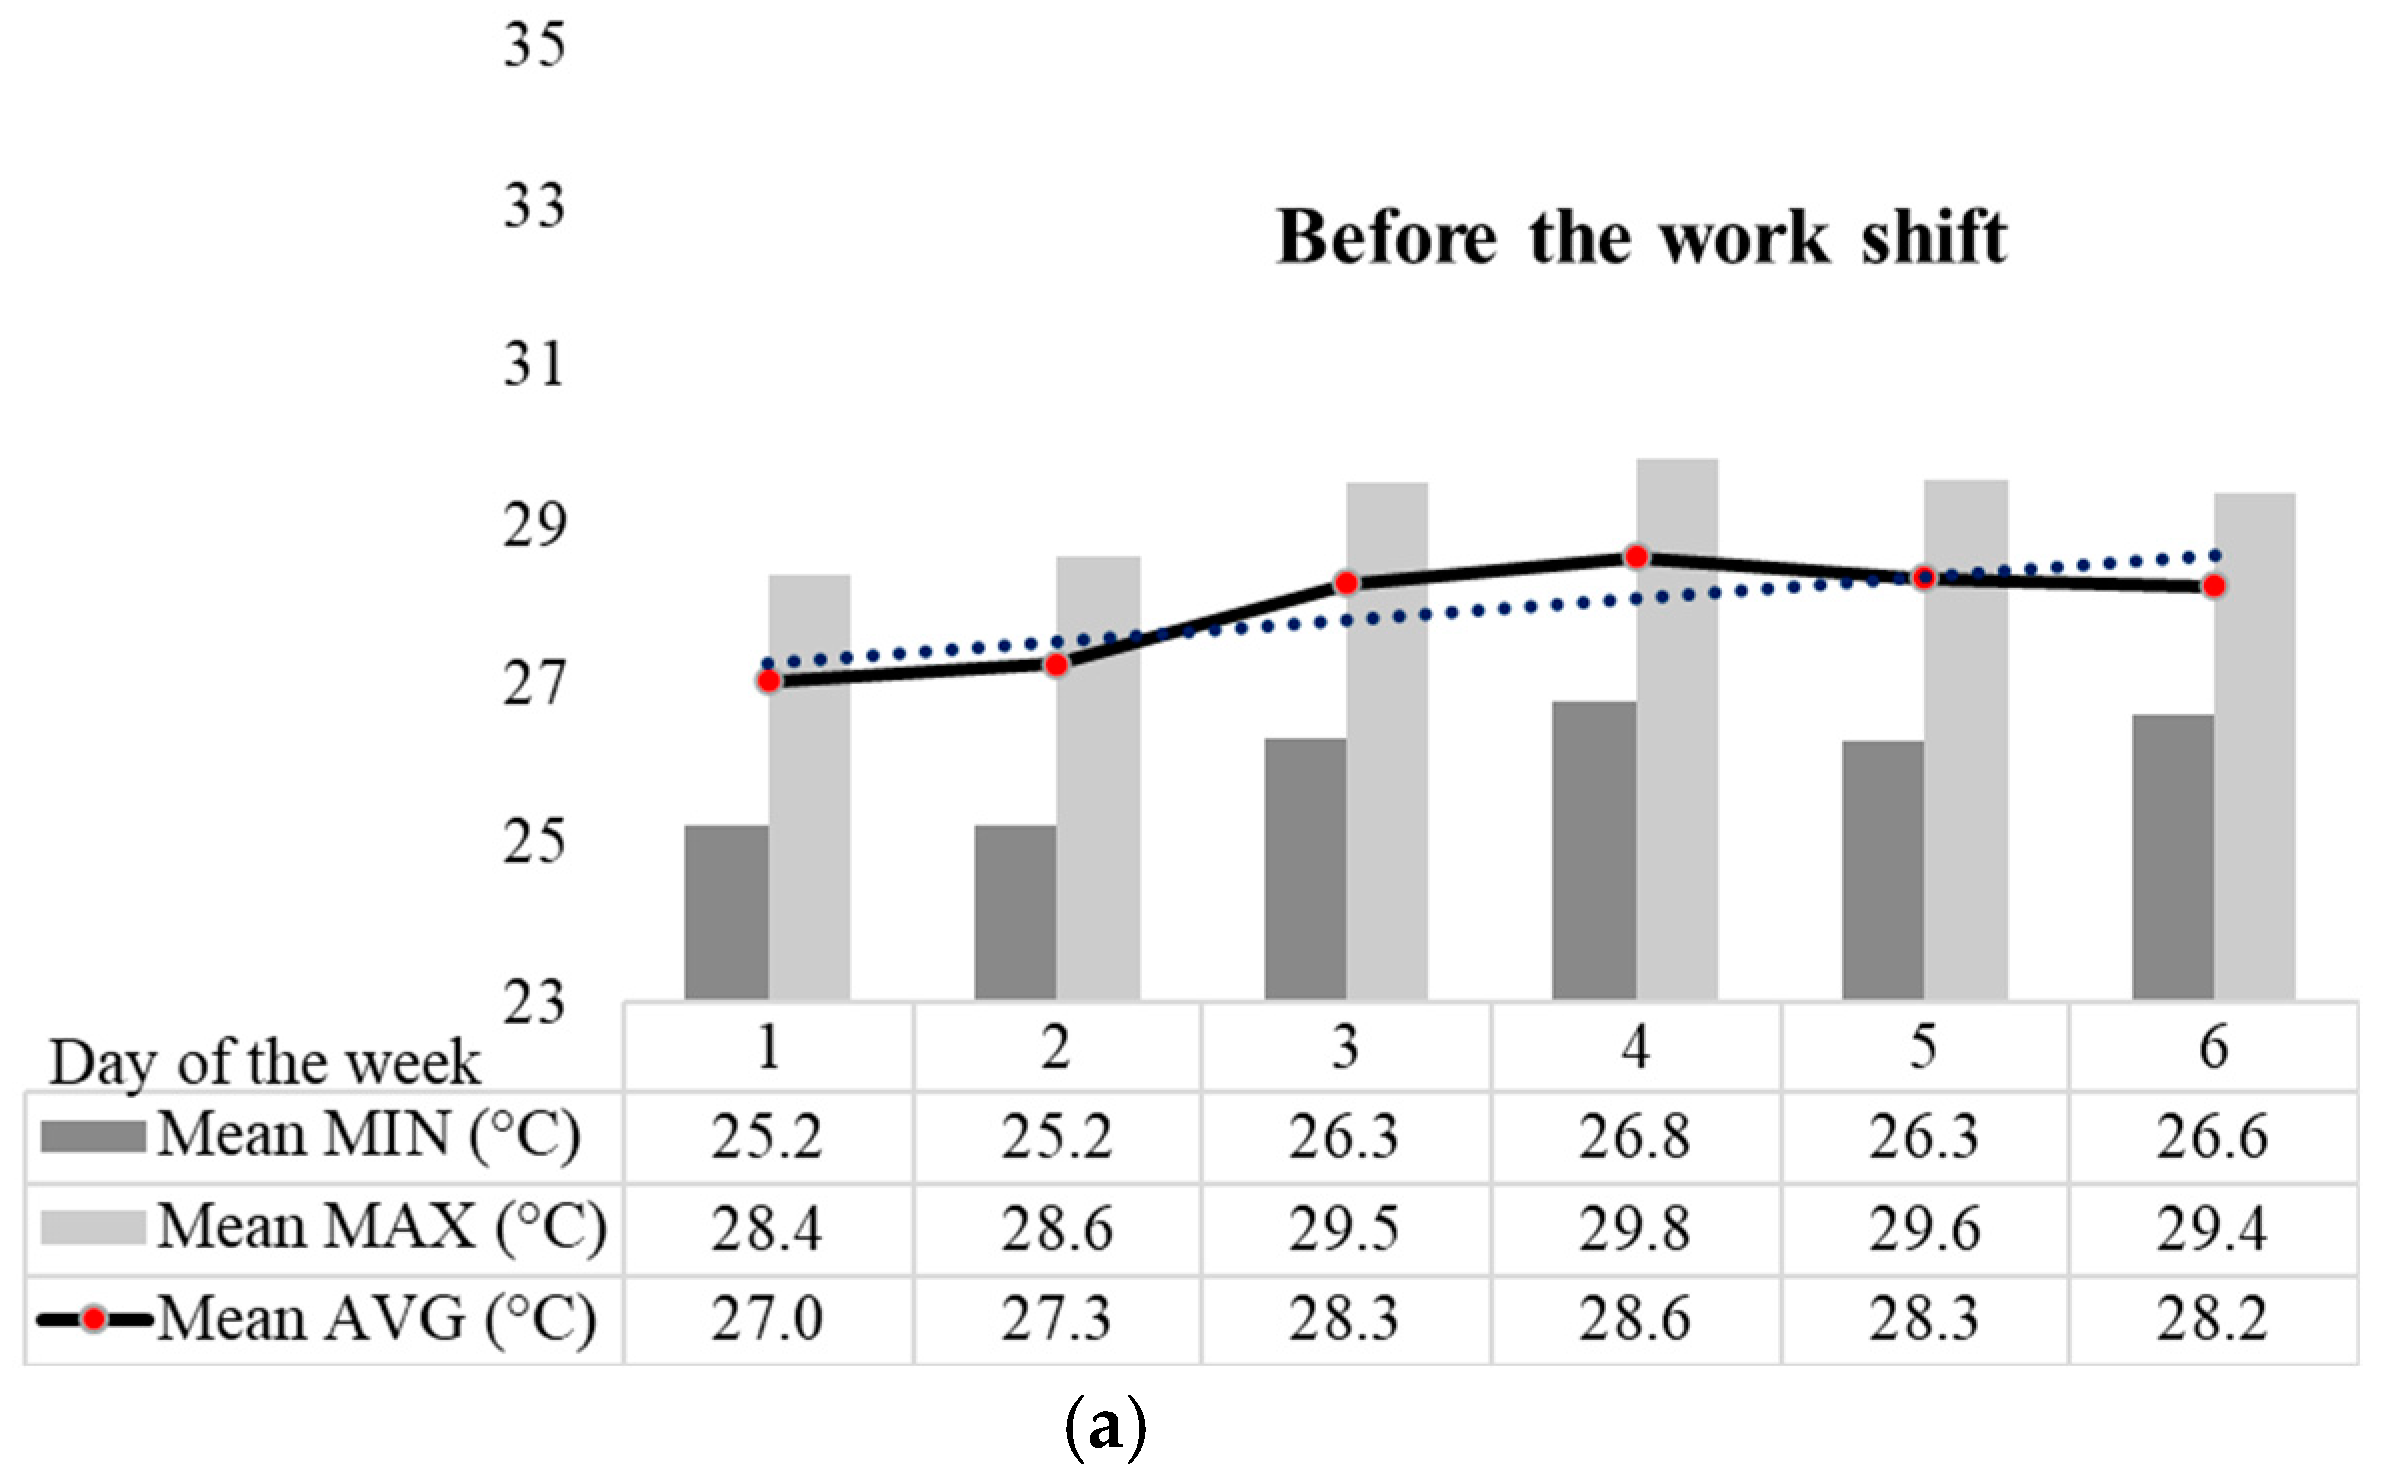
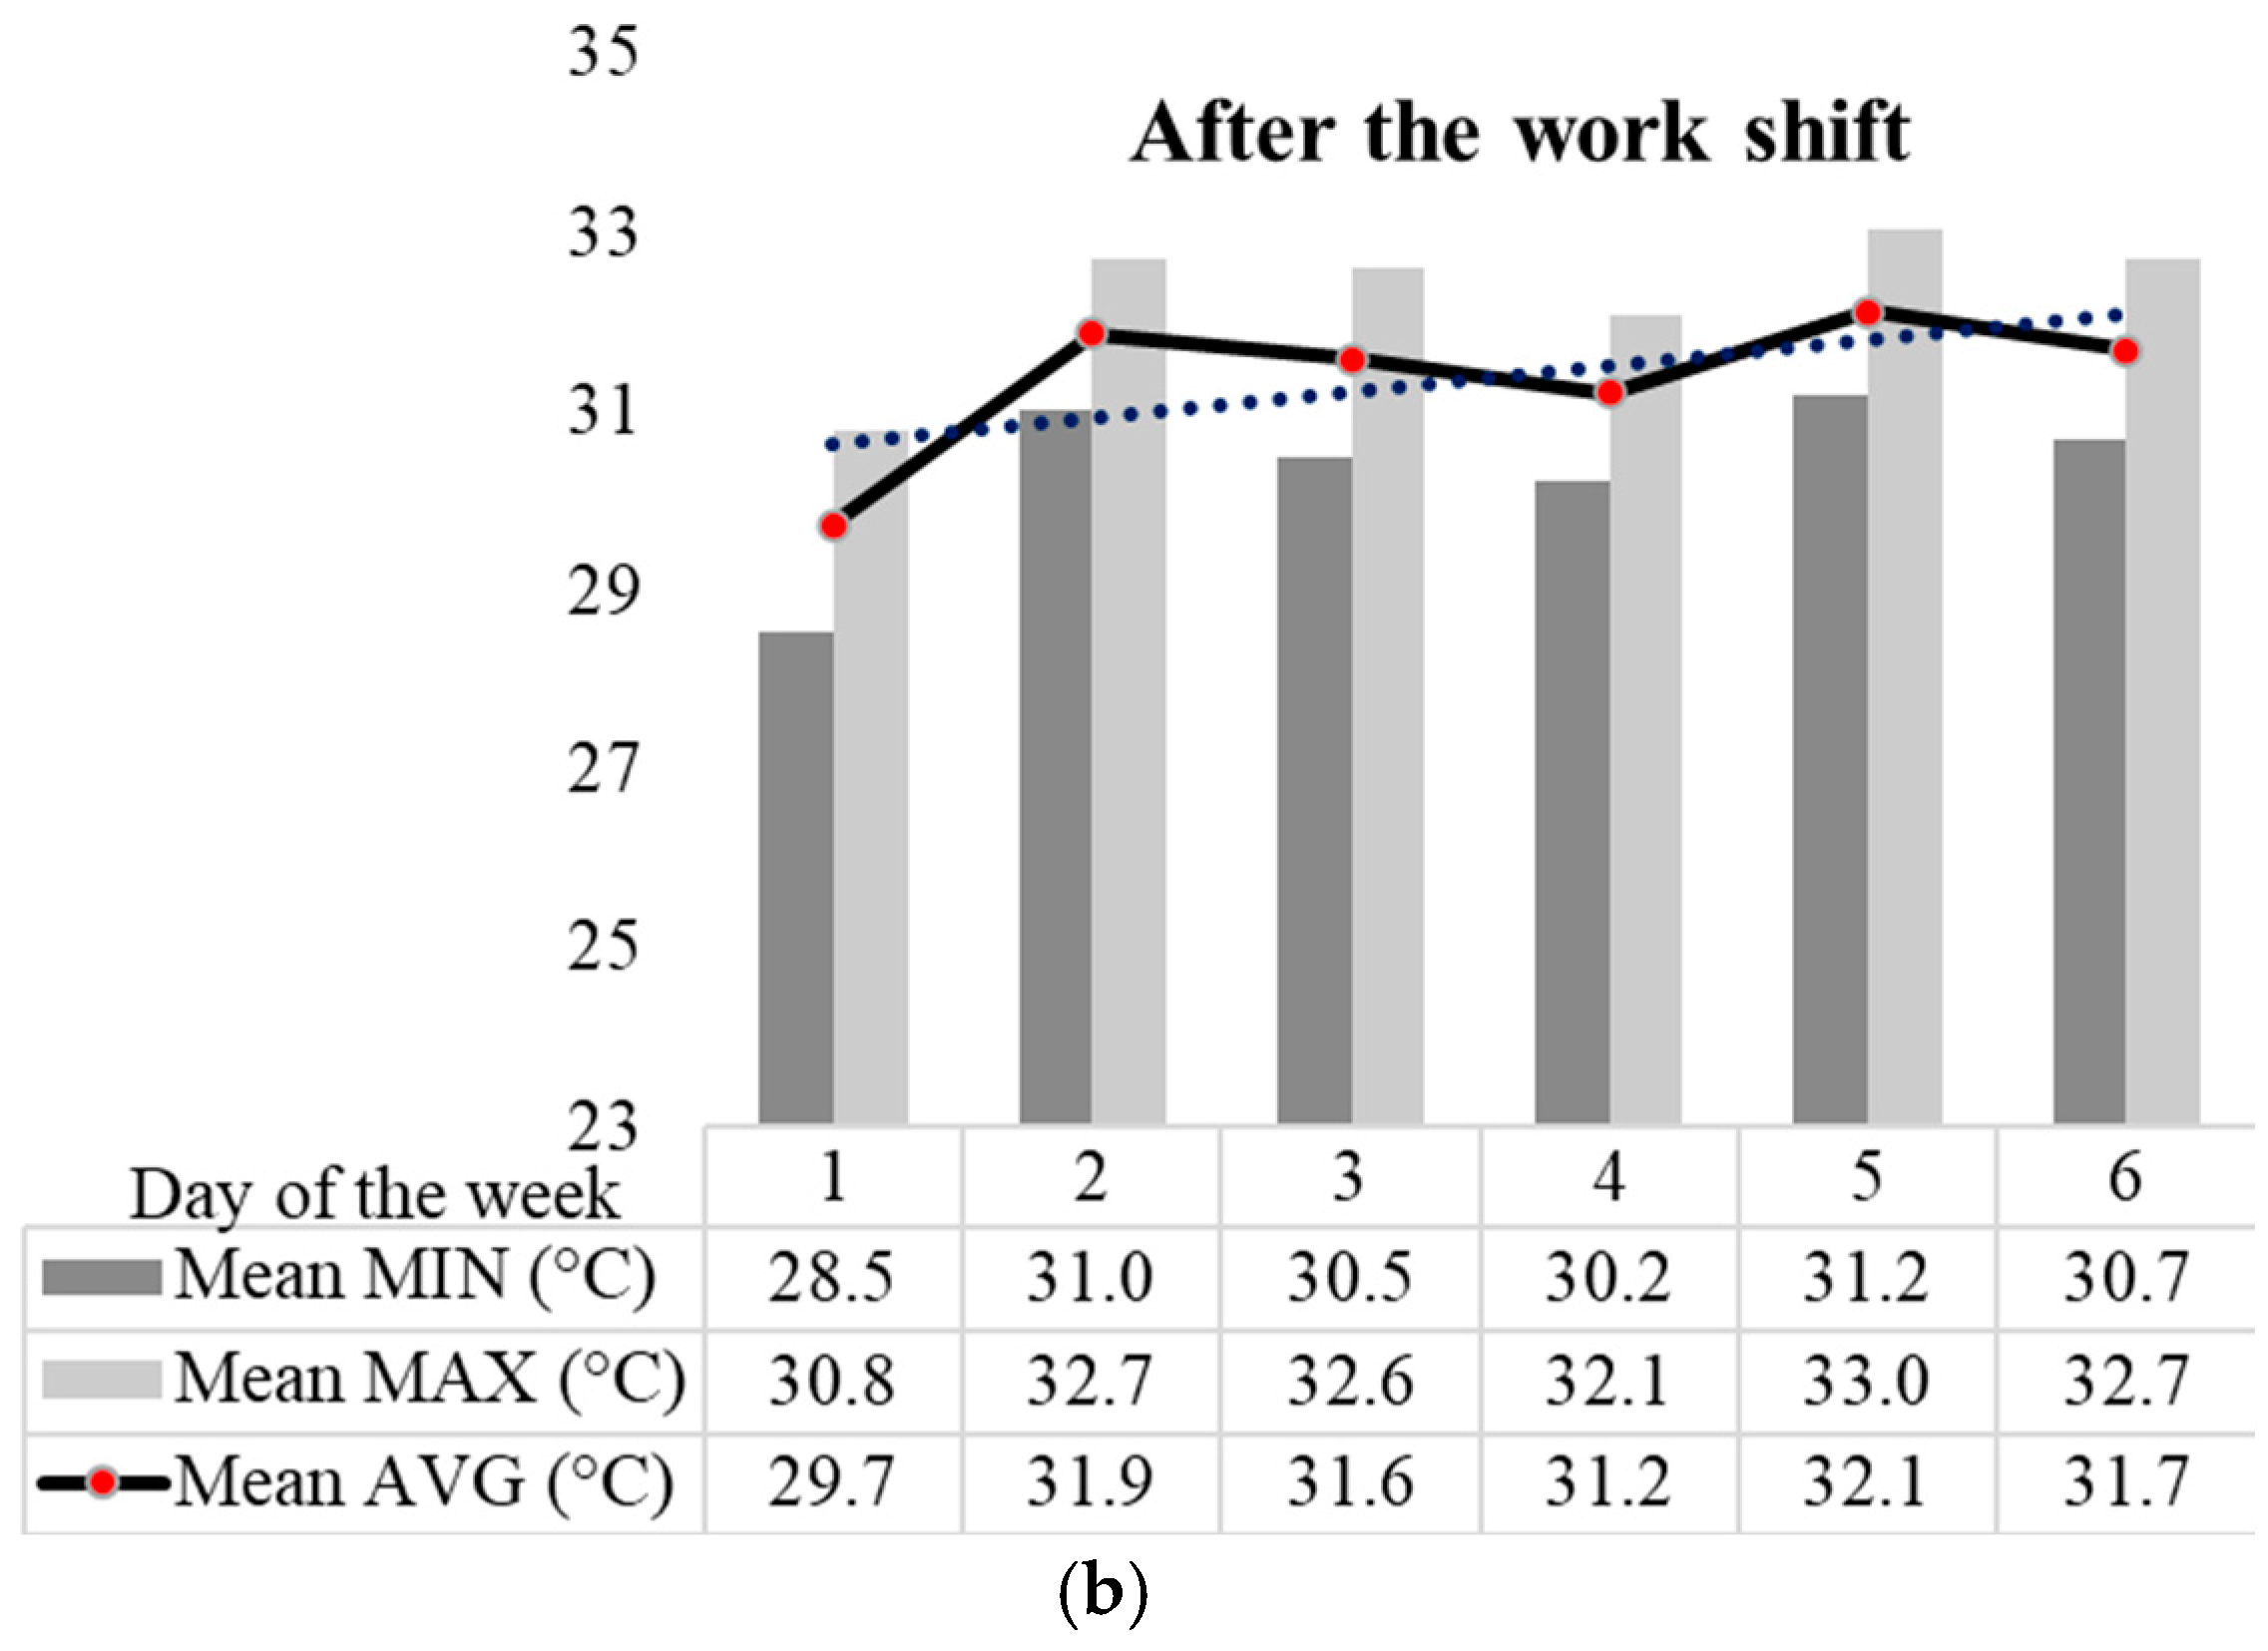
| Temperature | Period | Work Shift Day | |||||||
|---|---|---|---|---|---|---|---|---|---|
| 1st | 2nd | 3rd | 4th | 5th | 6th | Mean | SD | ||
| T. MIN | Before | 25.2 | 25.2 | 26.3 | 26.8 | 26.3 | 26.6 | 26.1 | 0.7 |
| After | 28.5 | 31.0 | 30.5 | 30.2 | 31.2 | 30.7 | 30.4 | 1.0 | |
| ∆t | 3.3 | 5.8 | 4.2 | 3.4 | 4.9 | 4.1 | 4.3 | 0.9 | |
| T. MAX | Before | 28.4 | 28.6 | 29.5 | 29.8 | 29.6 | 29.4 | 29.2 | 0.6 |
| After | 30.8 | 32.7 | 32.6 | 32.1 | 33.0 | 32.7 | 32.3 | 0.8 | |
| ∆t | 2.4 | 4.1 | 3.1 | 2.3 | 3.4 | 3.3 | 3.1 | 0.7 | |
| T. AVG | Before | 27.0 | 27.3 | 28.3 | 28.6 | 28.3 | 28.2 | 28.0 | 0.6 |
| After | 29.7 | 31.9 | 31.6 | 31.2 | 32.1 | 31.7 | 31.4 | 0.9 | |
| ∆t | 2.7 | 4.6 | 3.3 | 2.6 | 3.8 | 3.5 | 3.4 | 0.7 | |
| Day | ROI | Hand | Condition | Min. (°C) | Avg. (°C) | Max. (°C) | Extend (°C) | SD (°C) | Result |
|---|---|---|---|---|---|---|---|---|---|
| 1 | 1 | Left | Hyperradiant | 3.05 | 2.54 | 2.21 | 1.94 | 0.47 | SA |
| 2 | Left | Hyperradiant | 3.11 | 2.80 | 2.45 | 1.93 | 0.46 | SA | |
| 3 | Left | Hyperradiant | 2.81 | 2.43 | 2.16 | 1.94 | 0.46 | SA | |
| 4 | Left | Hyperradiant | 2.90 | 2.50 | 2.23 | 1.94 | 0.46 | SA | |
| 5 | Left | Hyperradiant | 3.47 | 2.93 | 2.67 | 1.94 | 0.46 | SA | |
| 6 | Right | Hyperradiant | 3.75 | 3.09 | 2.95 | 1.94 | 0.46 | SA | |
| 7 | Right | Hyperradiant | 3.49 | 3.22 | 3.17 | 1.95 | 0.46 | SA | |
| 8 | Right | Hyperradiant | 3.44 | 2.96 | 2.67 | 1.95 | 0.46 | SA | |
| 9 | Right | Hyperradiant | 3.67 | 3.11 | 2.84 | 1.94 | 0.46 | SA | |
| 10 | Right | Hyperradiant | 3.74 | 3.30 | 2.95 | 1.95 | 0.46 | SA | |
| 11 | Left | Hyperradiant | 2.65 | 2.01 | 1.87 | 1.95 | 0.46 | SA | |
| 12 | Right | Hyperradiant | 2.57 | 1.93 | 1.85 | 1.94 | 0.46 | SA | |
| 13 | Left | Hyperradiant | 1.99 | 0.90 | 0.77 | 1.92 | 0.45 | SS | |
| 14 | Right | Hyperradiant | 1.30 | 0.75 | 0.84 | 1.91 | 0.45 | SS | |
| 2 | 1 | Left | Hyperradiant | 5.58 | 4.28 | 3.93 | 1.89 | 0.45 | SA |
| 2 | Left | Hyperradiant | 5.60 | 4.33 | 3.58 | 1.89 | 0.45 | SA | |
| 3 | Left | Hyperradiant | 5.54 | 4.23 | 3.50 | 1.90 | 0.45 | SA | |
| 4 | Left | Hyperradiant | 6.03 | 4.62 | 4.03 | 1.91 | 0.45 | SA | |
| 5 | Left | Hyperradiant | 5.79 | 5.05 | 4.69 | 1.92 | 0.46 | SA | |
| 6 | Right | Hyperradiant | 5.70 | 4.65 | 4.29 | 1.92 | 0.46 | SA | |
| 7 | Right | Hyperradiant | 5.81 | 4.89 | 4.17 | 1.93 | 0.46 | SA | |
| 8 | Right | Hyperradiant | 5.52 | 4.60 | 4.08 | 1.93 | 0.46 | SA | |
| 9 | Right | Hyperradiant | 5.92 | 4.86 | 4.31 | 1.94 | 0.46 | SA | |
| 10 | Right | Hyperradiant | 6.40 | 5.49 | 5.00 | 1.95 | 0.46 | SA | |
| 11 | Left | Hyperradiant | 4.07 | 3.10 | 2.67 | 1.96 | 0.47 | SA | |
| 12 | Right | Hyperradiant | 4.29 | 3.19 | 2.92 | 1.95 | 0.47 | SA | |
| 13 | Left | Hyperradiant | 2.82 | 1.59 | 1.37 | 1.95 | 0.47 | SA | |
| 14 | Right | Hyperradiant | 2.73 | 1.53 | 1.50 | 1.95 | 0.47 | SA | |
| 3 | 1 | Left | Hyperradiant | 3.92 | 3.08 | 2.77 | 1.95 | 0.47 | SA |
| 2 | Left | Hyperradiant | 4.21 | 3.40 | 2.78 | 1.95 | 0.47 | SA | |
| 3 | Left | Hyperradiant | 4.14 | 3.18 | 2.75 | 1.95 | 0.47 | SA | |
| 4 | Left | Hyperradiant | 4.39 | 3.25 | 2.78 | 1.96 | 0.47 | SA | |
| 5 | Left | Hyperradiant | 4.52 | 3.67 | 3.17 | 1.97 | 0.47 | SA | |
| 6 | Right | Hyperradiant | 4.25 | 3.20 | 2.72 | 1.98 | 0.47 | SA | |
| 7 | Right | Hyperradiant | 4.62 | 3.87 | 3.47 | 1.99 | 0.48 | SA | |
| 8 | Right | Hyperradiant | 4.45 | 3.51 | 3.34 | 1.99 | 0.48 | SA | |
| 9 | Right | Hyperradiant | 4.94 | 3.82 | 3.59 | 1.99 | 0.48 | SA | |
| 10 | Right | Hyperradiant | 5.17 | 4.22 | 4.01 | 2.00 | 0.48 | SA | |
| 11 | Left | Hyperradiant | 2.99 | 2.42 | 2.25 | 2.01 | 0.48 | SA | |
| 12 | Right | Hyperradiant | 3.43 | 2.70 | 2.42 | 2.01 | 0.48 | SA | |
| 13 | Left | Hyperradiant | 1.78 | 1.12 | 1.17 | 2.00 | 0.48 | SA | |
| 14 | Right | Hyperradiant | 1.98 | 1.14 | 1.16 | 1.99 | 0.48 | SA | |
| 4 | 1 | Left | Hyperradiant | 1.08 | 0.69 | 0.47 | 1.98 | 0.48 | SS |
| 2 | Left | Hyperradiant | 1.42 | 0.81 | 0.47 | 1.99 | 0.48 | SS | |
| 3 | Left | Hyperradiant | 1.32 | 0.51 | 0.27 | 2.00 | 0.48 | SoA | |
| 4 | Left | Hyperradiant | 1.21 | 0.64 | 0.37 | 2.01 | 0.48 | SS | |
| 5 | Left | Hyperradiant | 1.49 | 1.01 | 0.80 | 2.01 | 0.48 | SA | |
| 6 | Right | Hyperradiant | 1.70 | 1.16 | 0.86 | 2.02 | 0.48 | SA | |
| 7 | Right | Hyperradiant | 0.98 | 0.70 | 0.56 | 2.03 | 0.48 | SS | |
| 8 | Right | Hyperradiant | 1.45 | 0.82 | 0.52 | 2.04 | 0.49 | SS | |
| 9 | Right | Hyperradiant | 1.43 | 0.94 | 0.74 | 2.05 | 0.49 | SS | |
| 10 | Right | Hyperradiant | 1.95 | 1.14 | 0.86 | 2.07 | 0.49 | SA | |
| 11 | Left | Hyperradiant | 0.44 | 0.25 | 0.07 | 2.08 | 0.49 | N | |
| 12 | Right | Hyperradiant | 0.75 | 0.47 | 0.34 | 2.06 | 0.48 | SoA | |
| 13 | Left | Hyporadiant | 0.09 | −0.53 | −0.36 | 2.02 | 0.48 | SoA | |
| 14 | Right | Hyporadiant | 0.15 | −0.40 | −0.30 | 2.00 | 0.47 | SoA | |
| 5 | 1 | Left | Hyperradiant | 3.74 | 2.66 | 2.37 | 1.98 | 0.47 | SA |
| 2 | Left | Hyperradiant | 4.01 | 3.05 | 2.32 | 1.99 | 0.47 | SA | |
| 3 | Left | Hyperradiant | 3.97 | 3.12 | 2.78 | 2.00 | 0.47 | SA | |
| 4 | Left | Hyperradiant | 3.86 | 3.09 | 2.75 | 2.01 | 0.47 | SA | |
| 5 | Left | Hyperradiant | 4.10 | 3.51 | 3.28 | 2.03 | 0.47 | SA | |
| 6 | Right | Hyperradiant | 4.33 | 3.45 | 3.09 | 2.03 | 0.47 | SA | |
| 7 | Right | Hyperradiant | 4.31 | 3.48 | 2.95 | 2.05 | 0.47 | SA | |
| 8 | Right | Hyperradiant | 4.36 | 3.59 | 3.37 | 2.09 | 0.48 | SA | |
| 9 | Right | Hyperradiant | 4.73 | 3.78 | 3.55 | 2.10 | 0.48 | SA | |
| 10 | Right | Hyperradiant | 4.67 | 3.85 | 3.52 | 2.13 | 0.49 | SA | |
| 11 | Left | Hyperradiant | 3.37 | 2.43 | 2.17 | 2.17 | 0.49 | SA | |
| 12 | Right | Hyperradiant | 3.00 | 2.61 | 2.28 | 2.16 | 0.49 | SA | |
| 13 | Left | Hyperradiant | 1.76 | 0.95 | 1.19 | 2.13 | 0.49 | SS | |
| 14 | Right | Hyperradiant | 2.00 | 1.16 | 1.21 | 2.10 | 0.48 | SA | |
| 6 | 1 | Left | Hyperradiant | 3.59 | 3.16 | 2.80 | 2.06 | 0.48 | SA |
| 2 | Left | Hyperradiant | 3.94 | 3.48 | 3.39 | 2.06 | 0.47 | SA | |
| 3 | Left | Hyperradiant | 3.80 | 3.22 | 2.93 | 2.08 | 0.48 | SA | |
| 4 | Left | Hyperradiant | 3.87 | 3.26 | 3.00 | 2.11 | 0.48 | SA | |
| 5 | Left | Hyperradiant | 3.90 | 3.58 | 3.46 | 2.15 | 0.48 | SA | |
| 6 | Right | Hyperradiant | 4.03 | 3.59 | 3.38 | 2.19 | 0.49 | SA | |
| 7 | Right | Hyperradiant | 3.71 | 3.43 | 3.44 | 2.25 | 0.50 | SA | |
| 8 | Right | Hyperradiant | 3.76 | 3.32 | 3.30 | 2.33 | 0.51 | SA | |
| 9 | Right | Hyperradiant | 3.96 | 3.59 | 3.50 | 2.40 | 0.51 | SA | |
| 10 | Right | Hyperradiant | 4.45 | 4.15 | 4.10 | 2.52 | 0.52 | SA | |
| 11 | Left | Hyperradiant | 2.62 | 2.42 | 2.53 | 2.71 | 0.54 | SA | |
| 12 | Right | Hyperradiant | 3.13 | 2.82 | 2.75 | 2.61 | 0.53 | SA | |
| 13 | Left | Hyperradiant | 1.44 | 1.12 | 1.32 | 2.44 | 0.49 | SA | |
| 14 | Right | Hyperradiant | 2.50 | 1.29 | 1.24 | 2.32 | 0.45 | SA |
Disclaimer/Publisher’s Note: The statements, opinions and data contained in all publications are solely those of the individual author(s) and contributor(s) and not of MDPI and/or the editor(s). MDPI and/or the editor(s) disclaim responsibility for any injury to people or property resulting from any ideas, methods, instructions or products referred to in the content. |
© 2025 by the authors. Licensee MDPI, Basel, Switzerland. This article is an open access article distributed under the terms and conditions of the Creative Commons Attribution (CC BY) license (https://creativecommons.org/licenses/by/4.0/).
Share and Cite
Martins, A.B.; Brioschi, M.L.; Rodrigues, C.K.; Lopes, E.d.S. Using Infrared Thermography to Assess Musculoskeletal Overload in the Hands of Harvester Operators. Forests 2025, 16, 429. https://doi.org/10.3390/f16030429
Martins AB, Brioschi ML, Rodrigues CK, Lopes EdS. Using Infrared Thermography to Assess Musculoskeletal Overload in the Hands of Harvester Operators. Forests. 2025; 16(3):429. https://doi.org/10.3390/f16030429
Chicago/Turabian StyleMartins, Alysson Braun, Marcos Leal Brioschi, Carla Krulikowski Rodrigues, and Eduardo da Silva Lopes. 2025. "Using Infrared Thermography to Assess Musculoskeletal Overload in the Hands of Harvester Operators" Forests 16, no. 3: 429. https://doi.org/10.3390/f16030429
APA StyleMartins, A. B., Brioschi, M. L., Rodrigues, C. K., & Lopes, E. d. S. (2025). Using Infrared Thermography to Assess Musculoskeletal Overload in the Hands of Harvester Operators. Forests, 16(3), 429. https://doi.org/10.3390/f16030429