Article

The Physical Properties of Surface Layer Thermally Modified Wood and Energy Consumption in the Preparation Process

1
Research Institute of Wood Industry, Chinese Academy of Forestry, Beijing 100091, China
2
Co-Innovation Center of Efficient Processing and Utilization of Forest Resources, College of Materials Science and Engineering, Nanjing Forestry University, Nanjing 210037, China
*
Author to whom correspondence should be addressed.
Forests 2025, 16(3), 427; https://doi.org/10.3390/f16030427
Submission received: 21 January 2025 / Revised: 20 February 2025 / Accepted: 25 February 2025 / Published: 26 February 2025

Abstract

:
Surface layer thermal modification (SLTM) not only improves the dimensional stability of wood but also effectively shortens production time. However, limited research has been conducted on how treatment conditions influence the properties of SLTM wood and energy consumption during the production process. This study compared the physical properties of SLTM wood with conventional thermally modified (CoTM) wood treated at 185 °C, 200 °C, and 215 °C, as well as the energy consumption during processing. Samples were subjected to SLTM at three temperatures (185 °C, 200 °C, and 215 °C) two times (2 h and 3 h) and two target surface layer thicknesses (6 mm and 12 mm). The results showed SLTM improved dimensional stability, with the anti-swelling efficiency (ASE) after water absorption increasing by a maximum of 2.4 times compared to CoTM185-2h. Increases in treatment temperature, time, and target surface layer thickness all contributed to enhanced ASE. At 96% relative humidity, SLTM wood samples exhibited lower equilibrium moisture content (16.6% to 19.2%) than CoTM185-2h (19.5%). SLTM also reduced the total treatment time by 1.9 h to 10.8 h compared to CoTM treatments. SLTM demonstrated energy savings ranging from 215 kW∙h to 1567 kW∙h, resulting in a reduction in CO2 emissions by 73 kg to 729 kg per 1 m3 of processed wood. These findings suggest that SLTM provides a promising strategy for the energy-efficient utilization of plantation wood.

1. Introduction

With the continued development of the global economy and population growth, the demand for wood has steadily increased [1,2]. However, the reduction in global forest resources, coupled with intensified efforts to protect the ecological environment, has posed significant challenges regarding the raw material supply for the wood processing industry. Plantation wood, known for its rapid growth, has increasingly been used as a substitute for natural forest wood [3]. However, plantation wood has some serious drawbacks, including poor mechanical strength, dimensional instability, and susceptibility to biodegrading, which limit its widespread application in both residential and industrial sectors [4,5].
To enhance the dimensional stability, mechanical properties, and biodegradability of plantation wood, various modification methods have been employed, such as chemical impregnation [6,7], thermal treatment [8,9], and densification [10]. As a physical modification method, thermal treatment changes the chemical composition and structure of wood cell walls through high-temperature heating, thereby improving the dimensional stability and durability of the wood [11]. Because no chemical additives are required, thermal modification has been widely regarded as one of the most successful and effective methods for enhancing the dimensional stability of wood [12].
Despite its advantages, conventional thermal modification (CoTM) presents several challenges, including long processing times, high energy consumption, and a reduction in mechanical strength [13]. Surface layer thermal modification (SLTM) modifies only the surface layer of wood while maintaining the cell structure and properties of the core layer. This method not only reduces the treatment time but also minimizes the loss of mechanical strength in the wood. As an emerging thermal modification method, SLTM has attracted significant attention and research in recent years.
Ebner et al. [14,15] and Sorčan et al. [16]. used the “Yakisugi” method to prepare SLTM wood and confirmed that the treated wood exhibited enhanced weathering resistance, decay resistance, and flame retardancy. This method is a specific type of surface layer thermal modification, with a treatment temperature (up to over 450 °C) significantly higher than that of wood thermal treatment (160–240 °C), and is typically conducted in an oxygen-containing environment. As a result, hemicellulose, cellulose, and lignin undergo degradation. The improved properties of the samples are attributed to the formation of a charred layer [17]. The charred surface layer reduces water and moisture adsorption, and the decrease in surface pH improves decay resistance. Moreover, the char provides a passive insulating layer that inhibits further degradation of the wood beneath the char, which also contributes to the enhanced fire resistance of the treated wood [15]. However, the effectiveness of this layer often varies due to factors such as species or type of samples [18], and cracking in the charred layer can increase the water absorption of the samples [15]. Another common method for preparing SLTM wood is the “hot plate method”. During processing, the temperature of the hot plate can be controlled below 240 °C. Additionally, the surface of the sample is tightly adhered to the metal plate, and the steam formed by the vaporization of moisture in the sample creates a low oxygen processing atmosphere. Kymäläinen et al. [19]. treated spruce and pinus wood samples using this method, finding that the surface wettability decreased and water absorption varied depending on the species. While water absorption resistance increased in spruce samples, no improvement was observed in pine samples (Kymäläinen et al.) [20]. Later studies on the effects of treatment temperature and time showed that higher temperature and shorter treatment time reduced the moisture sorption and water absorption but also reduced the surface layer thickness [21]. It was confirmed that the hygroscopicity of SLTM samples was lower in the surface layer compared to the core layer, as discussed by Čermák et al. [22] and Ding et al. [23], who attributed this difference to variations in chemical composition and structure. Despite these advances, limitations remain in controlling surface layer thickness in SLTM wood prepared by the hot plate method.
Cyclic-gradient thermal modification has shown great potential in controlling surface layer thickness [24,25], with the prepared surface layer thickness reaching up to 12 mm. Samples treated at 215 °C exhibited excellent overall performance, with ASE increasing by more than 20%, and the transverse compressive strength being more than 40% higher than that of CoTM samples at the same temperature. However, research on this method remains limited. Furthermore, with the increasing emphasis on energy conservation and emission reduction, the energy consumption associated with wood thermal modification technologies has garnered significant attention. However, there is still a blank in the research on the energy consumption involved in SLTM. Therefore, this study aimed to prepare SLTM wood using cyclic-gradient thermal modification, establish the relationship between treatment conditions and wood properties, and reduce energy consumption in the thermal modification process. This study provides valuable insights and references for the energy-efficient utilization of plantation wood.

2. Materials and Methods

2.1. Materials

A typical fast-growing hardwood species, Poplar wood (Populus euramericana cv. ‘San Martina I-72/58’), was chosen as the experimental material. A total of 57 defect-free samples, each with dimensions of 50 mm × 50 mm × 360 mm (radial × tangential × longitudinal), were obtained from two logs sourced from the 12th to 19th growth rings. Of these, 21 samples were subjected to CoTM, while 36 samples were used for SLTM. Detailed information regarding the logs and the distribution of samples for each treatment condition are provided in Table 1.

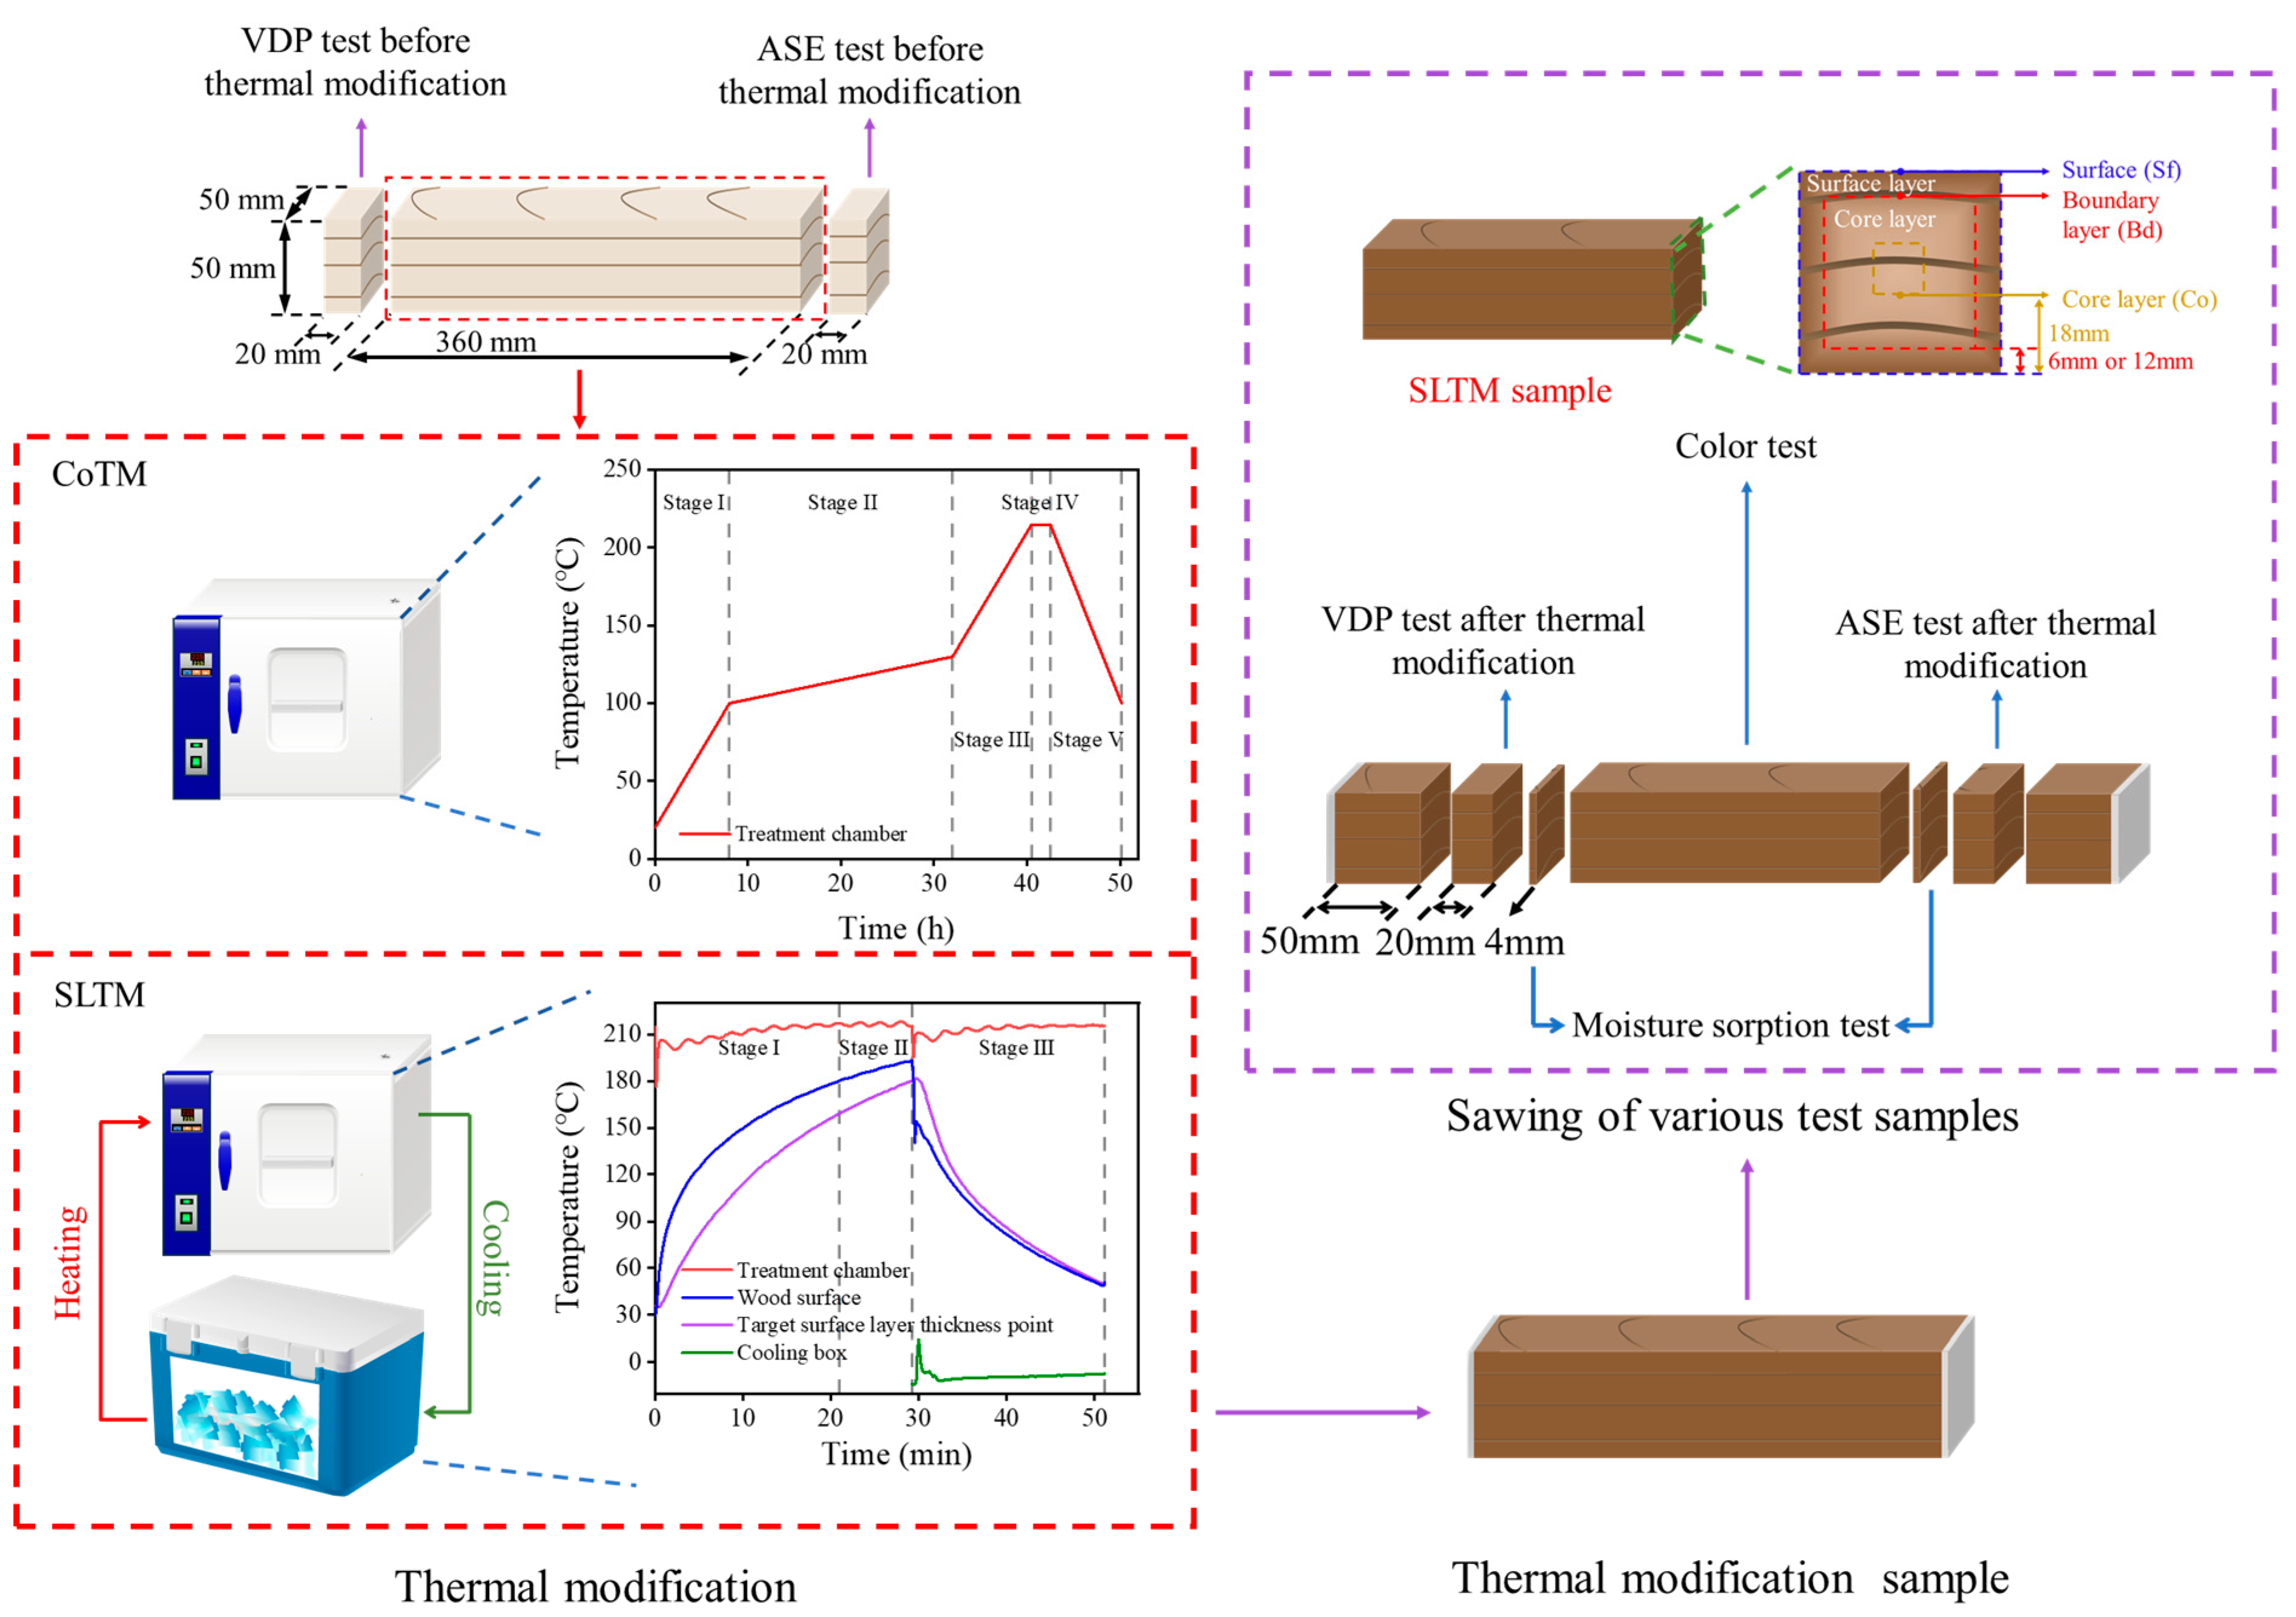
2.2. SLTM and CoTM Processes

The preparation of SLTM and CoTM followed the methodology outlined in our previous research [24], as illustrated in Figure 1. CoTM was based on the Thermwood process, which comprised five stages. Stages I and II were focused on the drying of the samples, while Stages III, IV, and V corresponded to the heating, effective thermal treatment, and cooling stages, respectively.
Prior to SLTM, the samples were oven-dried. The drying procedure involved an initial phase at 60 °C for 4 h, followed by 80 °C for 4 h, and was completed at 103 ± 2 °C for 12 h. After drying, the samples were directly treated at the target temperature. SLTM was performed in three distinct stages: Stage I involved the heating phase, during which a temperature gradient was established between the surface and the target surface layer point of the sample. Stage II commenced when the surface temperature of the sample reached 180 °C and continued until the temperature at the target surface layer point also reached 180 °C, signifying the effective thermal treatment of the target surface layer. Stage III represented the cooling phase, during which the samples were removed from the treatment chamber and placed in a cooling box (−20–0 °C) until the temperature of the entire sample dropped below 100 °C. The heating, thermal treatment, and cooling cycles were repeated until the cumulative time in Stage II satisfied the required treatment conditions.
For SLTM, we established 12 groups by varying three treatment temperatures (185 °C, 200 °C, and 215 °C), two target surface layer thicknesses (6 mm and 12 mm), and two treatment times (2 h and 3 h). Similarly, for CoTM, 6 groups were prepared using the same temperatures and time. An additional group of oven-dried samples served as a control, and each group consisted of three replicates.

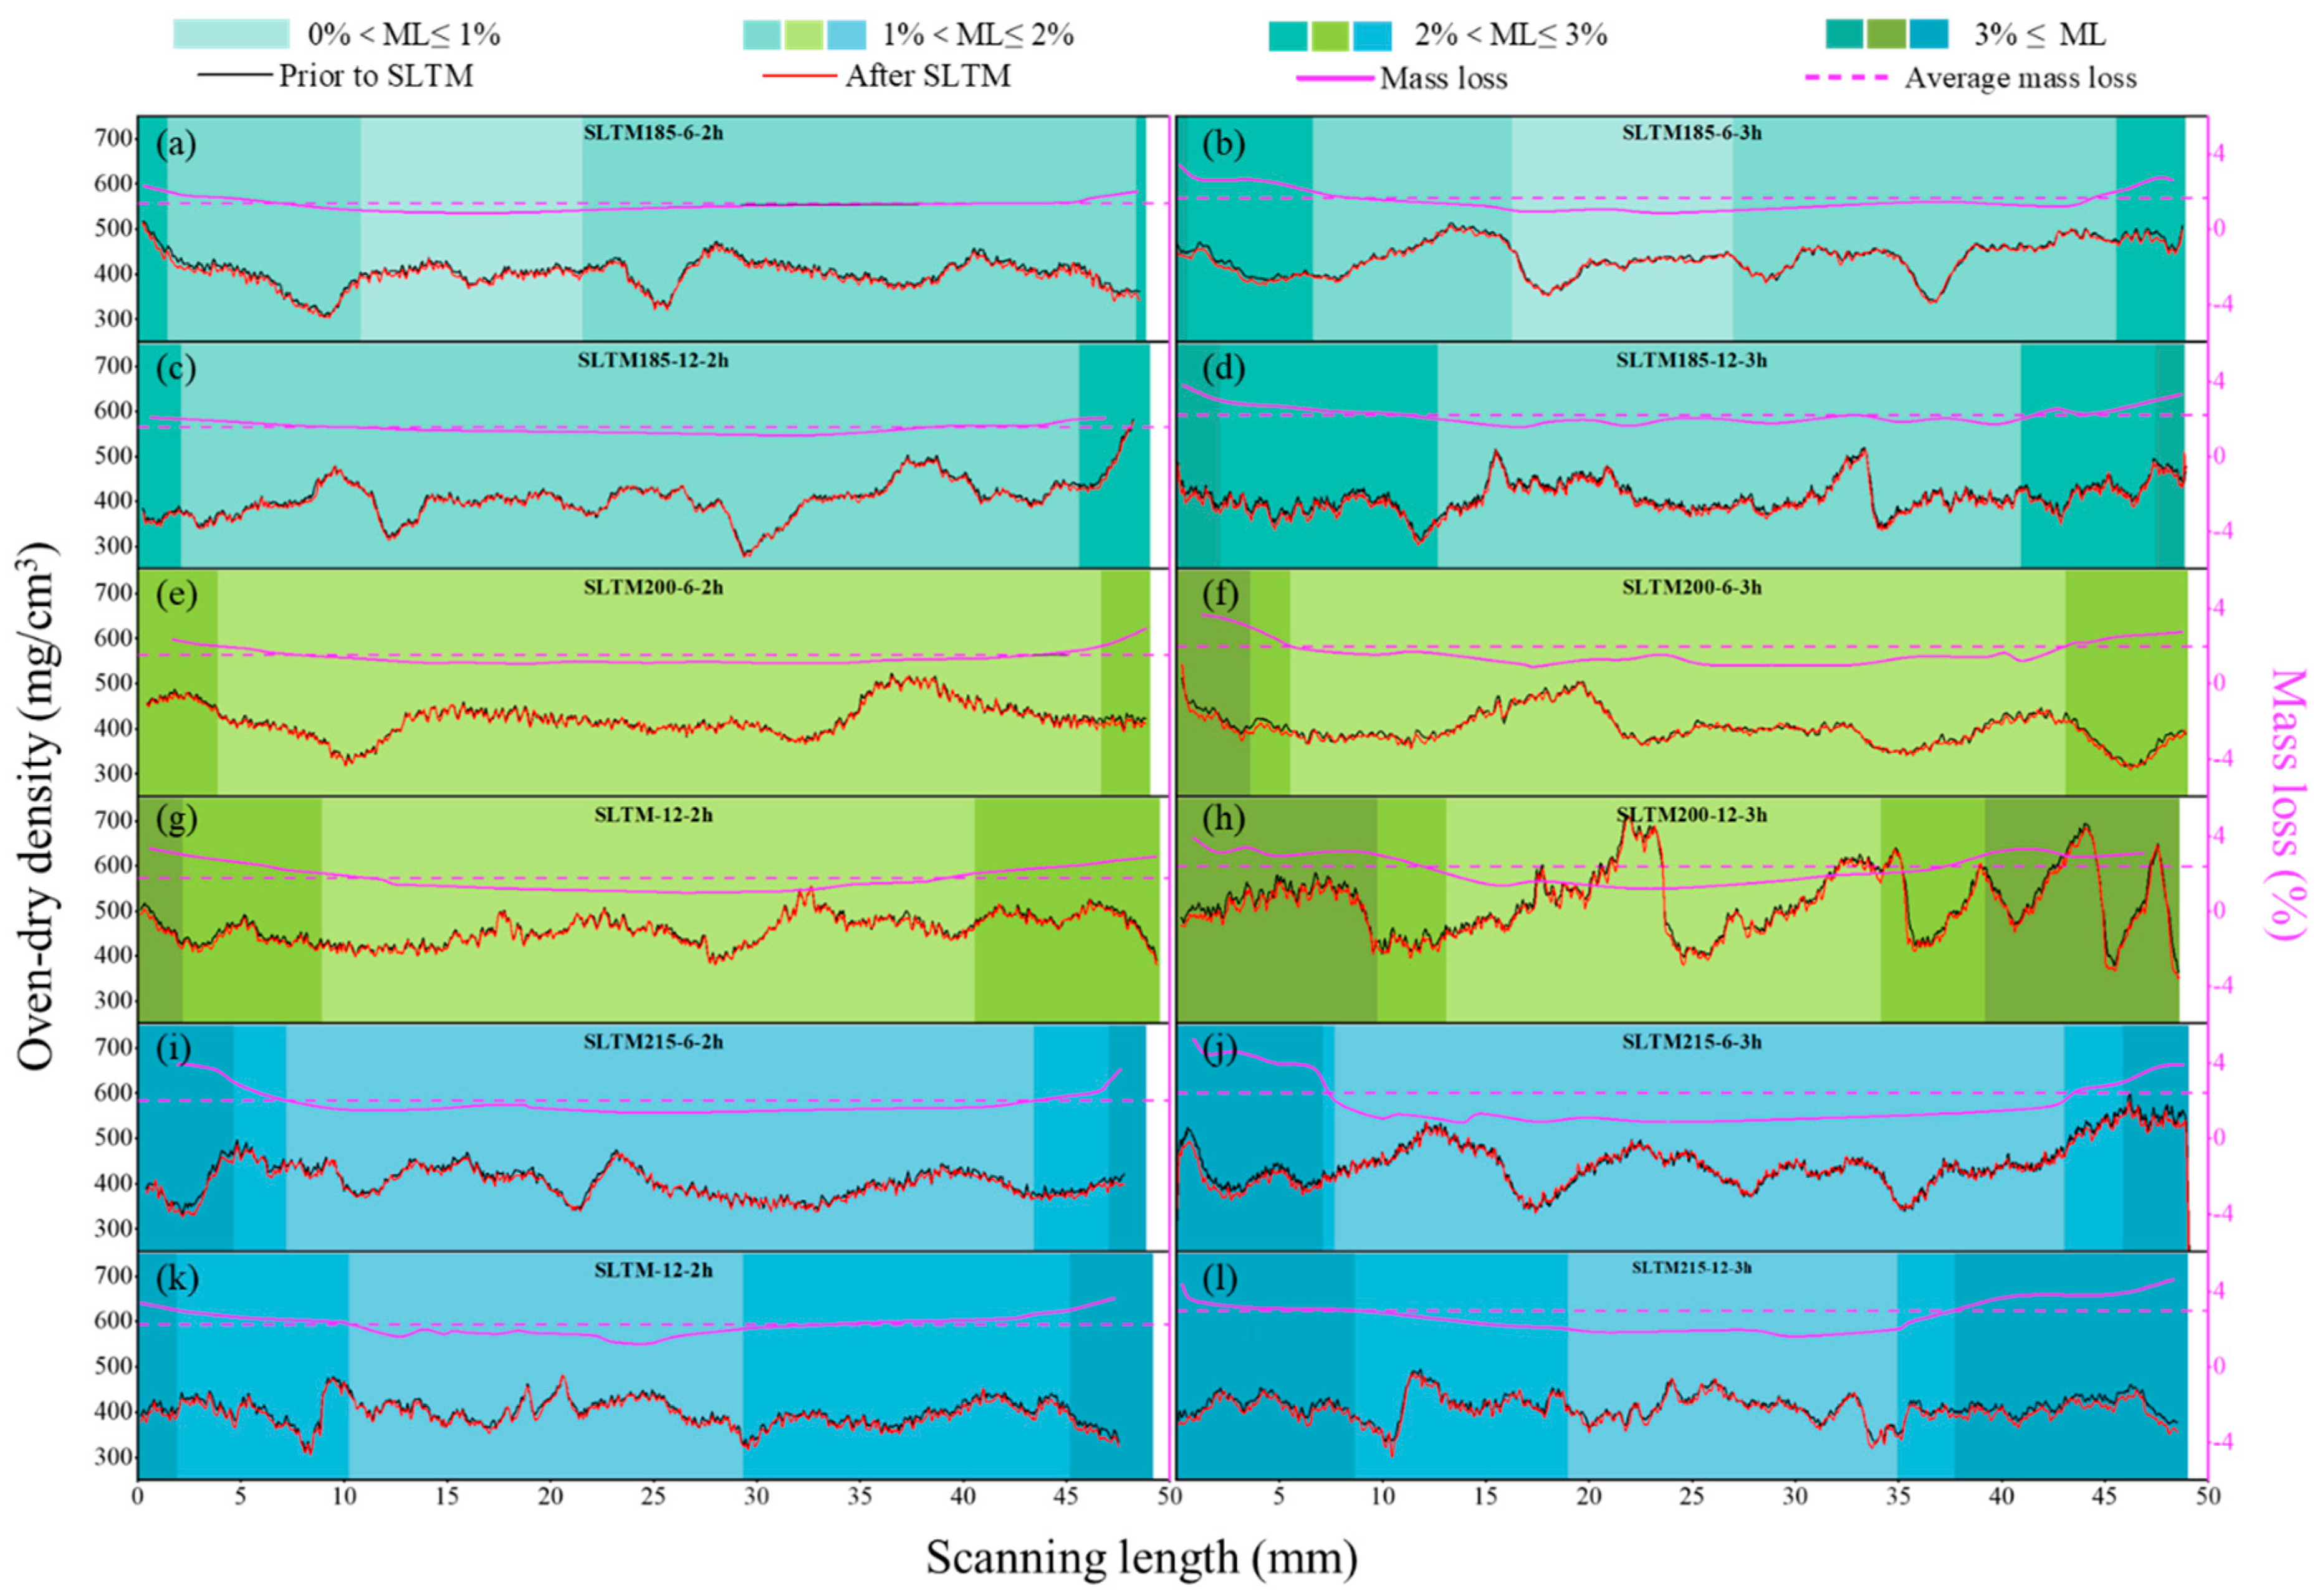
2.3. Mass Loss Analyses

The profile densities of the SLTM samples before and after treatment were measured using an X-ray contour densitometer (EWS, Mönchengladbach, Germany). The profile density after treatment was corrected and the mass loss (ML) distribution of the samples was calculated based on the vertical density profile (VDP) results.
Portions of the wood where ML exceeded the overall average were designated as the surface layer, while the remaining sections were classified as the core layer. The distance from the sample surface to the point where the ML equals the overall average ML was defined as the actual surface layer thickness (SLA). The average surface layer mass loss (MLSL) was calculated as the ratio of the integral area of ML within the actual surface layer region to the actual surface layer thickness. The distribution of ML in all samples was categorized into four gradients: 0% < ML ≤ 1%, 1% < ML ≤ 2%, 2% < ML ≤ 3%, and ML > 3%. The thickness proportions of these gradients were compared to evaluate differences in treatment intensity.

2.4. Color Distribution Analyses

The sampling for color testing of the samples is presented in Figure 1. For CoTM, the surface color of the samples was chosen to represent the overall color of the samples. For SLTM, the samples were sawed to expose three different thicknesses of the surfaces: the surface of the samples, the thickness of 6 mm or 12 mm (representing the boundary layer between the surface and core layers), and the thickness of 18 mm (representing the core layer). Color parameters were measured at five random positions on each surface for each of the three different thicknesses.
The color of the wood samples was determined using a spectrophotometer (3nh Technology Co., Ltd., Shenzhen, China) based on the CIE L*a*b* system. Measurements were conducted within a three-dimensional colorimetric framework, utilizing the L*, a*, and b* color coordinates, as described in previous studies [26]. Specifically, for the SLTM samples, the color was measured on the wood surface as well as at thicknesses of 6 mm, 12 mm, and 18 mm. Each test group, including SLTM, CoTM, and untreated samples, was evaluated using five replicate specimens. The total color change ΔE* is used to evaluate the color difference between various samples, according to ISO/CIE 11664–6 (2022) [27].

2.5. Water Absorption Test

Before the water absorption test, all samples were oven-dried at 103 ± 2 °C. They were then fully immersed in deionized water at 20 ± 2 °C. The samples for water absorption tests were cut as shown in Figure 1, with dimensions of 50 mm × 50 mm × 20 mm (radial × tangential × longitudinal). Each test group consisted of three replicate samples, for a total of 57 samples. The samples were periodically weighed, with surface water carefully removed before each weighing. The water absorption amount was calculated by Equation (1):
A w a t e r = m i m 0 m 0 × 100 %
where mi is the mass of the samples after water soaking (g), and m0 is the initial mass of oven-dry samples before water soaking (g). The maximum water absorption amount (Amax) was considered to be reached when the change in water absorption amount between the last two measurements was less than 5% [28]. Then, the anti-swelling efficiency (ASE) of the samples was calculated by Equation (2):
A S E = α 0 α t α 0 × 100 %
where α0 is the volumetric swelling coefficient of untreated samples at Amax state, and αt is the volumetric swelling coefficient of thermal modification samples at Amax state. The water absorption tests were conducted twice. In the first test, the samples had unsealed end faces, and the dimensional changes in the longitudinal, radial, and tangential directions were measured. After reaching the water saturation state, the samples were conditioned for 8 weeks at 20 °C and 65% relative humidity (RH). Subsequently, the end faces (cross-sections) of the samples were sealed with epoxy resin, and the samples were oven-dried at 103 ± 2 °C. In the second test, the water absorption amount was measured again.

2.6. Moisture Sorption Test

The moisture absorption and desorption of the samples were conducted progressively at 40 °C and a series of relative humidities (0%, 11%, 32%, 53%, 75%, and 96% RH), with the corresponding RH levels regulated using saturated salt solutions of P2O5, LiCl, MgCl2, NaBr, NaCl, and K2SO4. An electronic balance with a precision of 0.001 g was used to record the mass changes in the samples. When the mass changes in the sample did not exceed 0.1%, it was considered to have reached equilibrium at the corresponding RH, and the samples were then moved to the next stage of moisture absorption or desorption. The variation in equilibrium moisture content (VEMC) was calculated using Equation (3):
V E M C = | E M C 1 E M C 2 |
where EMC1 and EMC2 represent the EMC of the samples under two consecutive RH conditions, and VEMC is the absolute difference between EMC1 and EMC2. The rate of hygroscopic hysteresis (RHR) was calculated using Equation (4):
R H R = R E M C d e R E M C a b R E M C a b × 100 %
where R E M C d e and R E M C a b denote the EMC during desorption and absorption, respectively, under the same temperature and humidity conditions (%). The moisture sorption samples were cut to dimensions of 50 mm × 50 mm × 4 mm (radial × tangential × longitudinal, Figure 1). A total of 114 samples were prepared, with each experimental group consisting of six replicates.

2.7. Energy Consumption

Taking the calculation of energy consumption for the treatment of a 1 m3 wood sample with an initial moisture content of 12% as an example, and the size of the heat treatment chamber is 2 m × 2 m × 2 m, the specific design parameters refer to Wang et al. [29]. According to the research of Wang et al. [29] and Park et al. [30], the energy consumption during the treatment can be classified into the following seven categories: increase the temperature of wood substance (E1), overcome the absorptive power of bound water (E2), evaporate the water that is eliminated from wood (E3), heat the air and produce the superheated steam in the chamber (E4), descend the temperature of wood samples (E5), heat loss of chamber structure (E6) and fan use (E7). E1 was calculated by Equations (5) and (6):
E 1 = W 0 · C w o o d · ( T 1 T 0 )
C w o o d = 0.268 + 0.00055 ( T 1 + T 0 )
where W0 is the oven dry weight of wood (kg), Cwood is the specific heat of wood substance (kJ∙kg−1∙°C−1), T0 is the initial temperature of wood before heat treatment (°C), and T1 is the final temperature of wood after heat treatment (°C).
E2 was calculated by Equations (7) and (8):
E 2 = W 0 · h d e
h d e = 10 1.2335 5.408 m c 0
where hde is the heat of desorption per unit weight of wood (kJ/kg), and mc0 is the bound water content in the wood.
E3 was calculated by Equations (9) and (10):
E 3 = W 0 · m c · T 1 T a · c w a t e r + h w a t e r
h w a t e r = 598.25 0.61 T 1
where Δmc is the difference between initial and final moisture contents, Ta is the temperature of the air surrounding the chamber (°C); the environmental conditions before treatment are 20 °C and 65% RH), and hwater is the latent heat of vaporization (kJ∙kg−1).
E4 was calculated by Equations (11)–(15):
E 4 = E 4 a + E 4 w + E 4 v + E 4 d
E 4 a = c a i r · m a i r · T a 1 T a 0
E 4 w = W w a t e r · 100 T w 0 · c w a t e r
E 4 v = W w a t e r · h w a t e r
E 4 d = W w a t e r · e 1 e 0
where E4a is the heat energy required to heat the air in the chamber, cair is the specific heat of the air in the chamber (taken as 1.00 kJ∙kg−1∙°C−1), mair is the mass of the air in the chamber (kg), Ta0 is the initial temperature of the air before heat treatment (°C), and Ta1 is the final temperature of the air after heat treatment (°C). Where E4w is the heat energy required to heat the water from the current temperature to 100 °C, Wwater is the amount of distilled water that produces superheated steam in the chamber (kg, according to the product of the specific heat capacity of superheated steam under treatment conditions and the volume of the chamber, it can be calculated that at least 6.57–8.81 kg of distilled water is required for CoTM and SLTM, here taken as 20 kg), Tw0 is the initial temperature of water before heating (°C), and cwater is the specific heat of the water (taken as 4.19 kJ∙kg−1∙°C−1). Where E4v is the heat energy required to convert water at 100 °C to steam at 100 °C. Where E4d is the heat energy required to convert the steam at 100 °C into superheated steam at treatment conditions, e0 is the enthalpy of steam at 0.1 MPa and 100 °C (kJ∙kg−1), and e1 is the enthalpy of superheated steam at treatment conditions (kJ∙kg−1). For CoTM, during the cooling process, it is necessary to control the cooling rate while the heating device is still running. E5 was calculated using Equations (4) and (5). For SLTM, heating and cooling can be implemented through continuous production methods, and E5 also includes infiltration cooling load (Einf), which was calculated by Equations (16) and (17):
E i n f = η G · ρ o u t · c o u t · T o u t T i n + G · ρ o u t · ( d o u t d i n ) · ( r g + r s )
G = 0.221 A · g · H d o o r 1 2 · ρ i n ρ o u t ρ i n 1 2 · ( 2 1 + ρ i n ρ o u t 1 3 ) 2 3
where η is the air curtain coefficient (taken as 0.8 [31]), G is the infiltration flow rate, ρin is the air density outside the cooling chamber, ρin is the air density in the cooling chamber, dout is the moisture content of the air outside the cooling chamber (g∙kg−1), din is the moisture content of the air in the cooling chamber (g∙kg−1), and rg and rs is the latent heat of vaporization and fusion (kJ), respectively. Where A is the door area (taken as 4 m2, the size of the cooling chamber is the same as the heating), H is the height of the door (taken as 2 m), and g is the acceleration due to gravity (assumed to be 9.8 m∙kg−1). The heat treatment chamber structure refers to Wang et al. [29] and the cooling chamber structure refer to Niu et al. [31] and Tian et al. [32]
E6 was calculated by Equation (18):
E 6 = E 6 h + E 6 c = 7.92 · S h · R h · ( T 2 T a ) · t h + S c · R c · ( T o u t T i n ) · t c
where Sh is the surface area of the heat treatment chamber (m2), Sc is the surface area of the cooling chamber (m2), Rh is the thermal resistance of the heat treatment chamber (W∙(m2∙°C)−1), Rc is the thermal resistance of cooling chamber (W∙(m2∙°C)−1), T2 is the temperature of heat treatment chamber after cooling, th is the heat treatment time and tc is the cooling time (h).
E7 was calculated by Equation (19):
E 7 = P f · n · t
where Pf is the power of one fan, n is the number of fans, and t is the work time of the fan.
The CO2 emission intensity of coal-fired thermal power is 0.9–1.0 kg∙(kW∙h)−1 [33,34]. In this study, this value was taken as 0.95.

2.8. Statistical Analysis

Statistical analyses were performed using SPSS 27.0 (IBM Corp., Armonk, NY, USA), and p values 0.05 were used to indicate statistical significance. The color parameters and dimensional stability of the samples under different thermal modification conditions were subjected to univariate post hoc multiple comparison analysis.

3. Results and Discussion

3.1. Mass Change

Figure 2 illustrates the VDP changes in samples before and after thermal treatment, revealing a reduction in density after treatment. At temperatures below 160 °C, chemical transformations in wood components were initiated, with hemicellulose undergoing deacetylation reactions [35]. The acetic acid released during this process not only accelerated the degradation of hemicellulose but also catalyzed the hydrolysis of cellulose [36]. Furthermore, the volatilization of extractives contributed to an increase in ML [37], leading to a consequent reduction in density. By comparing the oven-dry density of the samples before and after treatment, the radial distribution of ML was determined, as depicted by the purple solid line in Figure 2. The results indicated that under various treatment parameters, ML in the radial direction (corresponding to the thickness direction) followed a gradient, with greater ML observed in the surface layer compared to the core layer. These findings confirmed that the cyclic-gradient thermal treatment effectively produced SLTM wood under different treatment conditions.
Table 2 summarizes the effects of SLTM under varying parameters. SLA closely corresponded to SLT, demonstrating the controllability of surface layer thickness preparation at different treatment conditions. As the treatment temperature, time, and target surface layer thickness increased, the proportion of samples (PT) with ML ≥ 3% rose, while the PT with 1% < ML ≤ 2% declined. This trend suggested that the intensity of treatment in the surface layer increased with the severity of the treatment conditions [21]. However, for samples treated at 185 °C with a target surface layer thickness of 6 mm, the PT with ML ≥ 2% did not exhibit a significant increase, and the reduction in the PT with 0% < ML ≤ 1% was negligible. This outcome was attributed to the relatively low treatment temperature, which limited the temperature gradient between the surface and core layers [20], resulting in comparable ML across both regions. Additionally, increasing the target surface layer thickness led to a higher PT with middle ML (1% < ML ≤ 2%), indicating a reduction in the difference in treatment intensity between the surface and core layers.
For CoTM, both the heating and cooling rates during the treatment process were controlled, resulting in a uniform temperature distribution throughout the samples, which in turn led to an even ML. The treatment intensity also increased with the severity of the treatment conditions. The ML of the SLTM samples was between that of CoTM185-2h and CoTM200-2h. Furthermore, the treatment intensity of the target surface layers of most SLTM samples was lower than that of CoTM200-2h (4.24%). Only when the temperature reached 215 °C did the MLSL of some SLTM samples exceed this value. This was mainly influenced by the temperature distribution during the treatment process, as the target surface layer temperature of most SLTM samples did not reach 200 °C, or the exposure time was too short. In the study by Šeda et al. [21], the hot plate method achieved significant surface layer mass loss (4.5%–8.2%) in a short time (4 min–6 min). This was due to the metal plate’s ability to transfer heat rapidly to the wood surface, although the heat transfer depth was relatively shallow (approximately 2 mm). However, the treatment time would need to be extended accordingly to increase the treatment depth.

3.2. Color Changes

The color results of treated samples are presented in Figure 3. Figure 3a–d shows the variations in L*, a*, b*, and ΔE* values for untreated and CoTM samples. As the temperature and time increased, the L* values consistently decreased, while the a* values exhibited no discernible trend. The b* values initially increased and then decreased, and the ΔE* values consistently increased. These results were consistent with previous studies [26]. Wood contained chromophoric groups (carbonyl, carboxyl, unsaturated double bonds, conjugated structures, etc.) and auxochromic groups (hydroxyl groups, etc.), which were primarily found in the lignin structure [38]. As the intensity of the treatment increased, the cellulose and hemicellulose polysaccharides were reduced, leading to the generation of more carbonyl and carboxyl groups [39,40]. In addition, the increase in lignin content and the oxidation reactions in lignin caused changes in the color of the wood [39,41]. The extent of changes in L* and ΔE* values was positively correlated with the treatment intensity [42,43]. Furthermore, the effect of treatment temperature on the color change was found to be more significant than the time [44].
Figure 3e–h displayed the changes in L* and ΔE* values at the surface (Sf), the boundary between the surface and the core layers (Bd), and the core (Co) of SLTM samples. The L* and ΔE* values of SLTM samples exhibited an increasing trend from the surface toward the core. For all SLTM samples, the Sf values of L* and ΔE* were found to fall between those of CoTM200-2h (CoTM at 200 °C for 2 h) and CoTM215-2h (CoTM at 215 °C for 2 h). The L* and ΔE* values at Bd and Co were between those of the untreated samples and CoTM185-2h (CoTM at 185 °C for 2 h). These color changes also reflected differences in the treatment intensity at various positions within the SLTM samples [45,46].
When the target surface layer thickness was 6 mm, the difference in L* values between Bd and Co, as well as the difference in ΔE* value, increased as the treatment temperature and time were raised, indicating that increasing these two treatment parameters enhanced the differences in treatment intensity between the surface and core layers of SLTM wood. In contrast, when the target surface layer thickness was 12 mm, the L* and ΔE* values at Bd and Co showed no significant difference, suggesting that increasing the surface layer thickness reduced the differences in treatment intensity between the surface and the core layers.

3.3. Water Absorption and Dimensional Stability

Figure 4a,d illustrate the variations in water absorption amount of CoTM and SLTM samples over the soaking time, respectively. The water absorption amount of all samples gradually decreased with increasing soaking time and stabilized after 30 days. The results in Table 3 and Table 4 showed that for the CoTM samples, a significant reduction in water absorption occurred when the temperature exceeded 215 °C, while the effect of treatment time on water absorption was negligible [47]. For the SLTM samples, significant differences in water absorption were observed only under extreme conditions (between SLTM215-12-3h with SLTM185-6-2h or SLTM185-6-3h). The target surface layer thickness exhibited no significant influence on water absorption. The impact of thermal treatment on the water absorption properties of wood remains debated. On the one hand, the degradation of the amorphous regions of hemicellulose and cellulose [48], the polymerization and redistribution of lignin within the cell lumens and cell walls, and the closing of pits [49] reduced the water absorption capacity of the treated wood. On the other hand, the increased presence of micropores following thermal treatment generated higher capillary tension, resulting in greater water absorption amount [50,51].
The ASE values of CoTM and SLTM samples, as presented in Figure 4b,e, demonstrated that thermal modification significantly enhanced the dimensional stability of wood. The ASE values of CoTM samples ranged from 18.0% to 54.8%, which were similar to the findings of previous studies [52,53]. For SLTM samples, the ASE values ranged from 17.2% to 43.3%. Notably, the statistical analysis revealed that when the temperature of SLTM was below 215 °C, the effects of temperature, treatment time, and target surface layer thickness on ASE were not significant (Table 4). The ASE of the samples ranged between CoTM185-2h (18.0%) and CoTM200-2h (43.9%). However, when the temperature exceeded 215 °C (including 215 °C), the ASE of the sample increased significantly with the extension of processing time and the increase in target surface layer thickness. Therefore, to further improve the ASE of SLTM samples, increasing the treatment temperature, extending the treatment time at 215 °C, and increasing the target surface layer thickness (≤12 mm) proved to be effective approaches.
During the SLTM process at 215 °C, when the treatment time was 2 h or 3 h, and the target surface thickness increased from 6 mm to 12 mm, the ASE of the samples increased from 26.7% (SLTM215-6-2h) to 38.7% (SLTM215-12-2h), and from 33.3% (SLTM215-6-3h) to 43.3% (SLTM215-12-3h), respectively. Similarly, when the target thicknesses were 6 mm or 12 mm, and the treatment time was increased from 2 h to 3 h, the ASE of the samples increased from 26.7% (SLTM215-6-2h) to 33.3% (SLTM215-6-3h), and from 38.7% (SLTM215-12-2h) to 43.3% (SLTM215-12-3h), respectively. The influence of target surface layer thickness on ASE was more significant than the effect of treatment time.
Previous studies have highlighted the differing treatment intensities between the surface and core layers of SLTM wood, which influence overall dimensional stability [24]. Figure 4c,f depicted the differences in tangential and radial swelling of the treated samples. Unlike previous reports [54,55], the values of differential swelling after thermal modification were higher and did not show significant changes with varying treatment conditions. Nevertheless, the differential shrinkage results indicated that SLTM did not increase the risk of deformation or cracking of the samples. While differences in swelling rates were observed between the surface and core layers of SLTM samples, the surface layer, which received higher treatment intensity, effectively suppressed excessive deformation in the core layer. For CoTM, the value of differential swelling decreased with increasing temperature or time [56,57].

3.4. Moisture Sorption

Figure 5 presents the effects of CoTM and SLTM on the moisture sorption behavior of wood. As shown in Figure 5a1, the absorption and desorption isotherms of CoTM wood followed a typical S-shaped curve, classified as Type II adsorption isotherms according to the IUPAC classification [58]. At the same RH levels, the EMC of thermally modified wood was lower than that of untreated wood, indicating that the hygroscopicity of wood decreased after treatment. Both increased temperature and prolonged time further reduced the EMC of the wood [59,60].
Figure 5a2 shows the VEMC of CoTM and untreated wood during the absorption and desorption. When the RH exceeded 60%, the VEMC increased markedly, and the same phenomenon was observed in the studies by Hill et al. [61] and Čermák et al. [62]. This behavior was attributed to the glass transition of amorphous substances in the cell wall under high RH conditions [63], which weakened the rigidity of the cell wall’s network structure [61]. The increased relative slippage of macromolecular chains exposed more sorption sites, leading to greater absorption of multilayer moisture and a more rapid increase in EMC [59]. As temperature and time increased, the rate of EMC growth slowed, which was most often explained by the decrease in available adsorption sites due to the degradation of hemicellulose and the increase in cellulose crystallinity [64], and there was a negative effect of water molecules adsorbed in the monolayer on the multilayer adsorption when a medium or high RH was applied [65].
After thermal treatment, the RHR of the CoTM samples increased (Figure 5a3). Hysteresis was also due to the number of sorption sites [66]. Moisture adsorption accompanied swelling, creating volume in the cell wall matrix for the accommodation of moisture molecules. Conversely, the cell wall shrinks during desorption, removing accessible sorption sites. Thermal modification further reduced the number of these sites, thereby increasing the hygroscopic hysteresis ratio [11]. Typically, the extent of sorption hysteresis depends on the treatment temperature [59,64]. In this study, When the RH exceeded 60%, the sorption hysteresis of CoTM215 and CoTM200 samples were almost the same, which was consistent with a previous report [56]. Changes in the chemical composition of wood at different temperatures, especially the cross-linking of lignin, significantly impacted the hysteresis behavior of the treated wood [67].
Figure 5b1–d3 shows the moisture sorption behavior of SLTM samples. It can be seen that the moisture sorption of the SLTM sample exhibited the same trend as that of the CoTM sample. At 40 °C and 96% RH, the EMC of all SLTM samples ranged from COTM185-2h (19.5%) to COTM200-2h (14.4%), which was superior to the SLTM samples prepared using the “hot plate method” at 200 °C [23]. For SLTM samples treated at 185 °C and 200 °C, the effect of different treatment conditions on moisture sorption was minimal. Notably, at 215 °C, the sorption isotherms of the SLTM215-12-3h samples, as well as VEMC, decreased significantly, especially under high RH conditions. The hygroscopic of SLTM samples was influenced by both the surface and core layers. When the temperature was high enough (215 °C), with the increase in surface layer thickness and time, the hygroscopic of the core layer also improved significantly, thereby significantly reducing the overall moisture absorption of SLTM samples.
The RHR of SLTM samples showed a decreasing trend with the increase in RH. However, there was no significant change in the effect of treatment conditions on the RHR, which differed from CoTM samples [59]. As mentioned earlier, the RHR of wood was influenced by both the number of sorption sites and the interactions between chemical components, which requires further research.

3.5. Treatment Time and Energy Consumption

Figure 6a–c presents the average time of Stages I (heating), II (effective thermal treatment), and III (cooling) within a single cycle under different SLTM processes. Higher treatment temperatures significantly shortened the time of a single cycle, primarily due to an increased temperature gradient between the specimen’s interior and exterior, which accelerated the heating rate and markedly reduced the time required for Stage I. Conversely, an increase in the target surface layer thickness necessitated a longer Stage II to ensure that the entire surface layer reached the effective treatment temperature, thereby extending the total time for a single cycle. The time of a single cycle remained unaffected by either the effective treatment time or the time of cycles. Additionally, no significant differences were observed in the cooling times across the different treatment processes.
The total treatment time for SLTM and CoTM is shown in Figure 6d. The heating and cooling rates for CoTM followed the parameters reported in previous studies [68,69]. With the exception of the treatment process at 185 °C for 3 h, SLTM reduced the total treatment time by 1.9 h (SLTM185-6-2h) to 10.8 h (SLTM215-12-2h) compared to CoTM conducted under the same temperature and time conditions. In CoTM, lower heating and cooling rates resulted in a longer time for uniformly processing the wood [70,71]. The reason for the longer total treatment time in SLTM at 185 °C for 3 h was that the lower temperature resulted in a reduced heating rate, thereby extending Stage I time. The increased time of Stage II requires more cycle times. Additionally, the target surface layer thickness affected the total treatment time of SLTM. Although increasing the thickness of the target surface layer prolonged the time of a single cycle, it also extended the time of Stage II, reducing the number of cycles and thus shortening the total treatment time.
Table 5 summarizes the energy consumption and CO2 emissions associated with SLTM and CoTM. SLTM not only reduced the total treatment time but also achieved a 12.1% to 49.9% reduction in energy consumption compared to CoTM conducted at the same temperature and time conditions. For every 1 m3 of wood processed, SLTM resulted in a reduction in CO2 emissions by 73 kg to 729 kg compared to CoTM under the same conditions. As shown in Table 5, the cyclic heating-cooling process of SLTM directed most of the energy toward raising the temperature of the wood substance (E1) and lowering the temperature of the specimens (E3). In contrast, CoTM, with its longer heating and cooling phases, consumed a larger proportion of energy in heat loss through the chamber shell (E6) and fan use (E7).

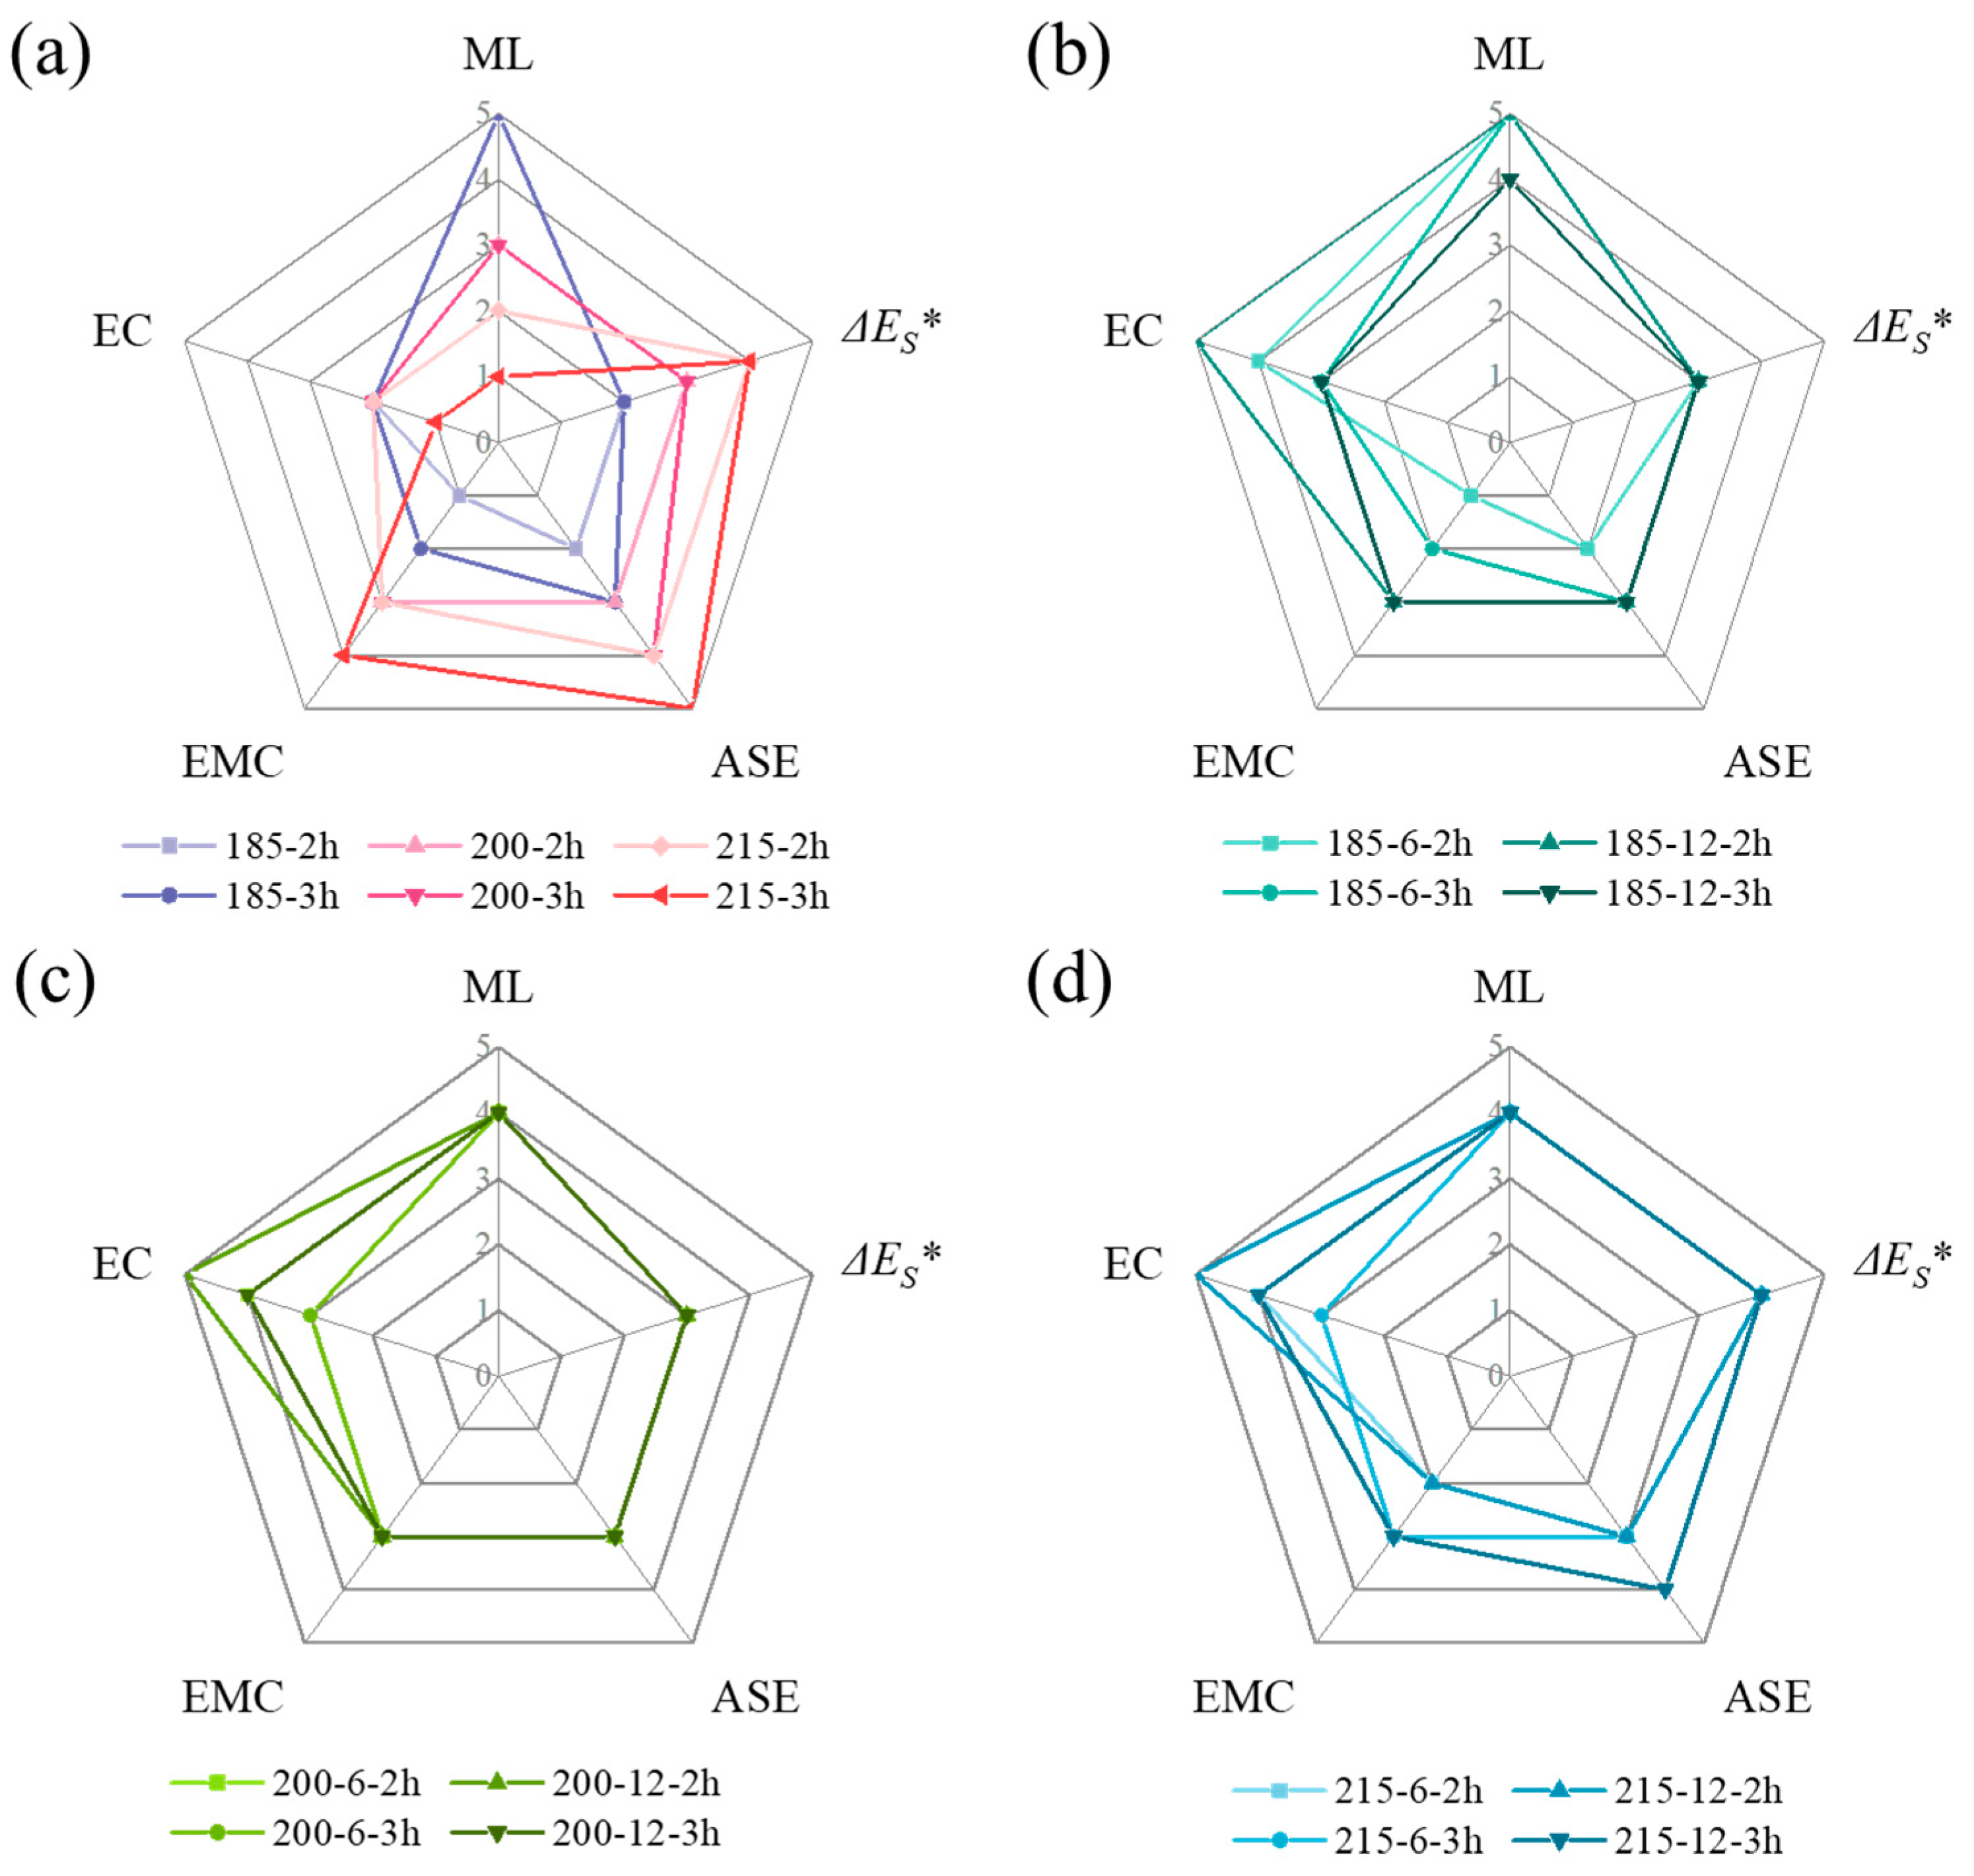
3.6. Evaluation of SLTM and CoTM

Figure 7 provided a comprehensive analysis of the CoTM and SLTM samples, evaluating ML, ΔE* of the sample’s surface, ASE, EMC at 96% RH, and energy consumption, with level 5 representing optimal efficiency or performance. As shown in Figure 7a, the CoTM samples demonstrated excellent performance in individual properties. For example, achieving superior dimensional stability required more energy, resulting in a higher ML. In contrast, maintaining sample density and reducing energy consumption during production resulted in lower dimensional stability. SLTM wood exhibited a more balanced overall performance (Figure 7b–d), making it suitable for applications such as building structures. Moreover, the continuous production mode (which adhered to the cyclic thermal gradient in SLTM) and energy-efficient production processes endowed SLTM with significant potential for further development. Nevertheless, when the SLTM wood was processed, and the core layer was directly exposed to the external environment, other waterproofing methods, including coating, were effective in ensuring the proper use of SLTM wood. SLTM wood was expected to find applications in structural engineering, landscape design, garden construction, dock building, and other fields requiring materials with excellent mechanical strength and dimensional stability.

4. Conclusions

This study prepared SLTM samples using cyclic-gradient thermal treatment under three temperature conditions (185 °C, 200 °C, 215 °C), two time (2 h, 3 h), and two target surface layer thicknesses (6 mm, 12 mm). The differences in ML, color change, water absorption, moisture sorption, and energy consumption between SLTM and CoTM samples were analyzed under various treatment conditions.
The results demonstrated that controlling the thermal gradient between the surface and core layers enabled the controlled preparation of SLTM wood with specific surface layer thicknesses. After treatment, the ML of SLTM samples showed a distribution of large surface layer loss and small core layer loss, and the surface color of the SLTM wood was darkened, enhancing its decorative appearance. The dimensional stability of SLTM wood improved, with the ASE for water absorption increasing by a maximum of 2.4 times compared to CoTM185-2h. When the temperature exceeded 215 °C (including 215 °C), the water absorption ASE of samples significantly increased with the extension of treatment time and the increase in target surface layer thickness. The target surface layer thickness had a more significant influence on water absorption ASE than treatment time. At 96% RH, the EMC of SLTM wood ranged from 16.6% to 19.2%, and the hygroscopicity of SLTM samples decreased to varying degrees compared to CoTM185-2h (19.5%). The hygroscopic of SLTM samples was influenced by both the surface and core layers. When the temperature reached 215 °C, increasing the surface layer thickness and treatment time significantly reduced the hygroscopic of SLTM samples.
Furthermore, SLTM reduced the total treatment time by 1.9 h to 10.8 h and reduced energy consumption by 12.1% to 49.9% compared to CoTM at the same treatment conditions. Considering the water absorption and moisture sorption of SLTM samples were basically between those of CoTM185-2h and CoTM200-2h samples. Except for SLTM215-6-3h, SLTM saved 215 kW∙h to 215 kW∙h of energy, leading to a reduction in CO2 emissions by 73 kg to 729 kg per 1 m3 of wood processed.
Further studies are needed to evaluate the mechanical properties of SLTM wood under different treatment conditions and optimize its performance in all aspects. However, this study provides valuable insights and references for the efficient and energy-saving utilization of plantation wood.

Author Contributions

Conceptualization, J.L., J.T. and T.Z.; methodology, J.T. and Y.X.; software, J.H., H.P. and Y.X.; validation and analysis, J.T. and Y.X.; resources, J.L., J.J. and Z.L.; Formal analysis, J.L., J.T. and T.Z.; data curation, Y.X.; writing—original draft preparation, J.T. and Y.X.; writing—review and editing, J.L., J.T. and T.Z.; supervision, J.L., project administration, J.L. and J.J.; funding acquisition, J.L. and J.J. All authors have read and agreed to the published version of the manuscript.

Funding

This work was financially supported by the National Natural Science Foundation of China (No. 31971591).

Data Availability Statement

Data will be made available on request.

Conflicts of Interest

The authors declare that they have no known competing financial interests or personal relationships that could have appeared to influence the work reported in this paper.

References

  1. Nepal, P.; Johnston, C.M.T.; Ganguly, I. Effects on Global Forests and Wood Product Markets of Increased Demand for Mass Timber. Sustainability 2021, 13, 13943. [Google Scholar] [CrossRef]
  2. Barbu, M.C.; Tudor, E.M. State of the Art of the Chinese Forestry, Wood Industry and Its Markets. Wood Mater. Sci. Eng. 2022, 17, 1030–1039. [Google Scholar] [CrossRef]
  3. McEwan, A.; Marchi, E.; Spinelli, R.; Brink, M. Past, Present and Future of Industrial Plantation Forestry and Implication on Future Timber Harvesting Technology. J. For. Res. 2020, 31, 339–351. [Google Scholar] [CrossRef]
  4. Qian, J.; Yue, K.; Li, X.; Pu, Y.; Chen, K.; Wu, P.; Zhang, Z. Strength Grading of Full-Scale Chinese Fast-Growing Poplar Wood for Structural Building Applications. Forests 2024, 15, 1602. [Google Scholar] [CrossRef]
  5. Julian, T.C.; Fukuda, H.; Novianto, D. The Influence of High-Temperature and -Pressure Treatment on Physical Properties of Albizia Falcataria Board. Forests 2022, 13, 239. [Google Scholar] [CrossRef]
  6. Liu, M.; Lyu, S.; Cai, L.; Peng, L.; Tang, J.; Huang, Z.; Lyu, J. Performance Improvement of Radiata Pine Wood by Combining Impregnation of Furfuryl Alcohol Resin and Densification for Making Fretboard Materials. Ind. Crop. Prod. 2021, 172, 114029. [Google Scholar] [CrossRef]
  7. Guo, D.; Yang, S.; Fu, F.; Guo, N.; Li, G.; Chu, F. Modification Mechanism of Plantation Wood via Grafting Epoxy Monomers onto Cell Walls. Wood Sci. Technol. 2022, 56, 813–831. [Google Scholar] [CrossRef]
  8. Sosins, G.; Grinins, J.; Brazdausks, P.; Zicans, J. Water-Related Properties of Wood after Thermal Modification in Closed Process under Pressure in Nitrogen. Forests 2024, 15, 140. [Google Scholar] [CrossRef]
  9. Yue, K.; Li, X.; Jiao, X.; Fu, F.; Wu, P.; Song, X. Strength grading of Chinese poplar wood for structural use following thermal modification. Polym. Test. 2023, 123, 108032. [Google Scholar] [CrossRef]
  10. Mania, P.; Wróblewski, M.; Wójciak, A.; Roszyk, E.; Moliński, W. Hardness of Densified Wood in Relation to Changed Chemical Composition. Forests 2020, 11, 506. [Google Scholar] [CrossRef]
  11. Hill, C.; Altgen, M.; Rautkari, L. Thermal Modification of Wood—A Review: Chemical Changes and Hygroscopicity. J. Mater. Sci. 2021, 56, 6581–6614. [Google Scholar] [CrossRef]
  12. Mohareb, A.; Sirmah, P.; Pétrissans, M.; Gérardin, P. Effect of Heat Treatment Intensity on Wood Chemical Composition and Decay Durability of Pinus Patula. Eur. J. Wood Prod. 2012, 70, 519–524. [Google Scholar] [CrossRef]
  13. Rowell, R.M.; Ibach, R.E.; McSweeny, J.; Nilsson, T. Understanding Decay Resistance, Dimensional Stability and Strength Changes in Heat-Treated and Acetylated Wood. Wood Mater. Sci. Eng. 2009, 4, 14–22. [Google Scholar] [CrossRef]
  14. Ebner, D.; Stelzer, R.; Barbu, M.C. Study of Wooden Surface Carbonization Using the Traditional Japanese Yakisugi Technique. Pro Ligno 2019, 15, 278–283. [Google Scholar]
  15. Ebner, D.H.; Barbu, M.-C.; Klaushofer, J.; Čermák, P. Surface Modification of Spruce and Fir Sawn-Timber by Charring in the Traditional Japanese Method—Yakisugi. Polymers 2021, 13, 1662. [Google Scholar] [CrossRef]
  16. Sorčan, N. Wood Charring as a Finishing Technique. Master’s Thesis, Univerza v Ljubljani, Ljubljana, Slovenia, 2019. [Google Scholar]
  17. Kampe, A.; Pfriem, A. A Note on Artificial Weathering of Spruce (Picea abies) with a Carbonised Layer. Int. Wood Prod. J. 2018, 9, 86–89. [Google Scholar] [CrossRef]
  18. Hasburgh, L.E.; Zelinka, S.L.; Bishell, A.B.; Kirker, G.T. Durability and Fire Performance of Charred Wood Siding (Shou Sugi Ban). Forests 2021, 12, 1262. [Google Scholar] [CrossRef]
  19. Kymäläinen, M.; Hautamäki, S.; Lillqvist, K.; Segerholm, K.; Rautkari, L. Surface Modification of Solid Wood by Charring. J. Mater. Sci. 2017, 52, 6111–6119. [Google Scholar] [CrossRef]
  20. Kymäläinen, M.; Turunen, H.; Čermák, P.; Hautamäki, S.; Rautkari, L. Sorption-Related Characteristics of Surface Charred Spruce Wood. Materials 2018, 11, 2083. [Google Scholar] [CrossRef]
  21. Šeda, V.; Machová, D.; Dohnal, J.; Dömény, J.; Zárybnická, L.; Oberle, A.; Vacenovská, V.; Čermák, P. Effect of One-Sided Surface Charring of Beech Wood on Density Profile and Surface Wettability. Appl. Sci. 2021, 11, 4086. [Google Scholar] [CrossRef]
  22. Čermák, P.; Dejmal, A.; Paschová, Z.; Kymäläinen, M.; Dömény, J.; Brabec, M.; Hess, D.; Rautkari, L. One-Sided Surface Charring of Beech Wood. J. Mater. Sci. 2019, 54, 9497–9506. [Google Scholar] [CrossRef]
  23. Ding, T.; Cheng, Y.; Jiang, T. Preparation and Characterization of Heat-Treated Douglas Fir Wood with Core–Shell Structure. Forests 2022, 13, 825. [Google Scholar] [CrossRef]
  24. Tang, J.; Zhan, T.; Li, Z.; Jiang, J.; Lyu, J. Optimization of Dimensional Stability and Mechanical Performance of Thermally Modified Wood Using Cyclic-Gradient Thermal Treatment. Constr. Build. Mater. 2025, 458, 139596. [Google Scholar] [CrossRef]
  25. Čermák, P.; Dömény, J.; Brabec, M.; Milch, J.; Baar, J.; Horáček, P.; Rademacher, P. Unevenly Distributed Thermal Treatment of Wood: Preliminary Study—Density Profiles. Eur. J. Wood Prod. 2016, 74, 629–631. [Google Scholar] [CrossRef]
  26. Yue, K.; Qian, J.; Wu, P.; Jiao, X.; Lu, D.; Song, X. Experimental Analysis of Thermally-Treated Chinese Poplar Wood with Focus on Structural Application. Ind. Crop. Prod. 2023, 197, 116612. [Google Scholar] [CrossRef]
  27. ISO/CIE 11664-6:2022; Colorimetry—Part 6: CIEDE2000 Colour-Difference Formula. International Organization for Standardization (ISO): Geneva, Switzerland; International Commission on Illumination (CIE): Vienna, Austria, 2022.
  28. 13061-8:2021; Test Methods for Physical and Mechanical Properties of Small Clear Wood Specimens—Part 8: Determination of Swelling. Standardization Administration of China: Beijing, China, 2021.
  29. Wang, B.; He, Z.; Wang, Z.; Yi, S. Effects of Zinc Chloride Impregnation Treatment on Dimensional Stability and Energy Consumption of Heat-Treated Mongolian Scots Pine. J. Beijing For. Univ. 2024, 46, 123–131. [Google Scholar]
  30. Park, Y.; Han, Y.; Park, J.-H.; Chang, Y.-S.; Yang, S.-Y.; Chung, H.; Yeo, H. Evaluation of the Energy Efficiency of Combined Drying and Heat Treatment by Superheated Steam. Dry. Technol. 2017, 35, 1460–1467. [Google Scholar] [CrossRef]
  31. Niu, H.; Wang, B.; Yang, Z.; Liu, X.; Liu, X.; Shi, W. Impact of Control Strategies on Energy Consumption in Cold Storage Facilities. Energy Build. 2024, 322, 114736. [Google Scholar] [CrossRef]
  32. Tian, S.; Shao, S.; Liu, B. Investigation on Transient Energy Consumption of Cold Storages: Modeling and a Case Study. Energy 2019, 180, 1–9. [Google Scholar] [CrossRef]
  33. Putra, A.S.; Garniwa, I.; Arilanggaaji, E.S.; Pradana, S.S. A Study on Carbon Cap and Trade Effect to Cost of Electricity in Accordance with the Merit Order of 300–400 MW Coal Power Plants. IOP Conf. Ser. Earth Environ. Sci. 2021, 880, 012049. [Google Scholar] [CrossRef]
  34. Kumar, S.; Jain, R.K. Cost of CO2 Emission Mitigation and Its Decomposition: Evidence from Coal-Fired Thermal Power Sector in India. Empir. Econ. 2021, 61, 693–717. [Google Scholar] [CrossRef]
  35. Östberg, G.; Salmén, L.; Terlecki, J. Softening Temperature of Moist Wood Measured by Differential Scanning Calorimetry. Holzforschung 1990, 44, 223–225. [Google Scholar] [CrossRef]
  36. Rayirath, P.; Avramidis, S.; Mansfield, S.D. The Effect of Wood Drying on Crystallinity and Microfibril Angle in Black Spruce (Picea mariana). J. Wood Chem. Technol. 2008, 28, 167–179. [Google Scholar] [CrossRef]
  37. Shen, Y.; Gao, Z.; Hou, X.; Chen, Z.; Jiang, J.; Sun, J. Spectral and Thermal Analysis of Eucalyptus Wood Drying at Different Temperature and Methods. Dry. Technol. 2019, 38, 313–320. [Google Scholar] [CrossRef]
  38. Fengel, D.; Wegener, G. Wood: Chemistry, Ultrastructure, Reactions, 1st ed.; Verlag Kessel: Remagen, Germany, 2003; pp. 154–196. [Google Scholar]
  39. Jurczyková, T.; Šárovec, O.; Kačík, F.; Hájková, K.; Jurczyk, T.; Hrčka, R. Chromophores’ Contribution to Color Changes of Thermally Modified Tropical Wood Species. Polymers 2023, 15, 4000. [Google Scholar] [CrossRef]
  40. Sikora, A.; Kačík, F.; Gaff, M.; Vondrová, V.; Bubeníková, T.; Kubovský, I. Impact of Thermal Modification on Color and Chemical Changes of Spruce and Oak Wood. J. Wood Sci. 2018, 64, 406–416. [Google Scholar] [CrossRef]
  41. Yao, C.; Yongming, F.; Jianmin, G.; Houkun, L. Coloring Characteristics of in Situ Lignin during Heat Treatment. Wood Sci Technol. 2012, 46, 33–40. [Google Scholar] [CrossRef]
  42. González-Peña, M.M.; Hale, M.D.C. Colour in Thermally Modified Wood of Beech, Norway Spruce and Scots Pine. Part 1: Colour Evolution and Colour Changes. Holzforschung 2009, 63, 385–393. [Google Scholar] [CrossRef]
  43. Esteves, B.; Marques, A.V.; Domingos, I.; Pereira, H. Heat-Induced Colour Changes of Pine (Pinus pinaster) and Eucalypt (Eucalyptus globulus) Wood. Wood Sci. Technol. 2008, 42, 369–384. [Google Scholar] [CrossRef]
  44. Matsuo, M.; Yokoyama, M.; Umemura, K.; Gril, J.; Yano, K.; Kawai, S. Color Changes in Wood during Heating: Kinetic Analysis by Applying a Time-Temperature Superposition Method. Appl. Phys. A 2010, 99, 47–52. [Google Scholar] [CrossRef]
  45. Kačíková, D.; Kačík, F.; Čabalová, I.; Ďurkovič, J. Effects of Thermal Treatment on Chemical, Mechanical and Colour Traits in Norway Spruce Wood. Bioresour. Technol. 2013, 144, 669–674. [Google Scholar] [CrossRef] [PubMed]
  46. Brischke, C.; Welzbacher, C.R.; Brandt, K.; Rapp, A.O. Quality Control of Thermally Modified Timber: Interrelationship between Heat Treatment Intensities and CIE L*a*b* Color Data on Homogenized Wood Samples. Holzforschung 2007, 61, 19–22. [Google Scholar] [CrossRef]
  47. Yang, T.-H.; Chang, F.-R.; Lin, C.-J.; Chang, F.-C. Effects of Temperature and Duration of Heat Treatment on the Physical, Surface, and Mechanical Properties of Japanese Cedar Wood. Bioresources 2016, 11, 3947–3963. [Google Scholar] [CrossRef]
  48. Kartal, S.N.; Hwang, W.-J.; Imamura, Y. Water Absorption of Boron-Treated and Heat-Modified Wood. J. Wood Sci. 2007, 53, 454–457. [Google Scholar] [CrossRef]
  49. Kekkonen, P.M.; Ylisassi, A.; Telkki, V.-V. Absorption of Water in Thermally Modified Pine Wood As Studied by Nuclear Magnetic Resonance. J. Phys. Chem. C 2014, 118, 2146–2153. [Google Scholar] [CrossRef]
  50. Scheiding, W.; Direske, M.; Zauer, M. Water Absorption of Untreated and Thermally Modified Sapwood and Heartwood of Pinus sylvestris L. Eur. J. Wood Prod. 2016, 74, 585–589. [Google Scholar] [CrossRef]
  51. Krackler, V.; Ammann, S.; Camathias, U.; Niemz, P. Investigation on Moisture Behaviour and Porosity of Thermally Modified Timber. Bauphysik 2011, 33, 374–381. [Google Scholar] [CrossRef]
  52. Zhou, F.; Fu, Z.; Gao, X.; Zhou, Y. Changes in the Wood-Water Interactions of Mahogany Wood Due to Heat Treatment. Holzforschung 2020, 74, 853–863. [Google Scholar] [CrossRef]
  53. Bessala, L.F.B.; Gao, J.; He, Z.; Wang, Z.; Yi, S. Effects of Heat Treatment on Color, Dimensional Stability, Hygroscopicity and Chemical Structure of Afrormosia and Newtonia Wood: A Comparative Study of Air and Palm Oil Medium. Polymers 2023, 15, 774. [Google Scholar] [CrossRef]
  54. Aytin, A.; Korkut, S. Effect of Thermal Treatment on the Swelling and Surface Roughness of Common Alder and Wych Elm Wood. J. For. Res. 2016, 27, 225–229. [Google Scholar] [CrossRef]
  55. Gunduz, G.; Aydemir, D.; Karakas, G. The Effects of Thermal Treatment on the Mechanical Properties of Wild Pear (Pyrus elaeagnifolia Pall.) Wood and Changes in Physical Properties. Mater. Des. 2009, 30, 4391–4395. [Google Scholar] [CrossRef]
  56. Fu, Z.; Zhou, Y.; Gao, X.; Liu, H.; Zhou, F. Changes of Water Related Properties in Radiata Pine Wood Due to Heat Treatment. Constr. Build. Mater. 2019, 227, 116692. [Google Scholar] [CrossRef]
  57. Olarescu, M.C.; Campean, M.; Ispas, M.; Cosereanu, C. Effect of Thermal Treatment on Some Properties of Lime Wood. Eur. J. Wood Prod. 2014, 72, 559–562. [Google Scholar] [CrossRef]
  58. Sing, K.S. Reporting Physisorption Data for Gas/Solid Systems with Special Reference to the Determination of Surface Area and Porosity (Recommendations 1984). Pure Appl. Chem. 1985, 57, 603–619. [Google Scholar] [CrossRef]
  59. Gao, Y.; Li, Z.; Zhao, L.; Lyu, J. Effect of Heat Treatment on Hygroscopicity of Chinese Fir (Cunninghamia lanceolata [Lamb.] Hook.). Wood. Forests 2024, 15, 630. [Google Scholar] [CrossRef]
  60. Guo, F.; Huang, R.; Lu, J.; Chen, Z.; Cao, Y. Evaluating the Effect of Heat Treating Temperature and Duration on Selected Wood Properties Using Comprehensive Cluster Analysis. J. Wood Sci. 2014, 60, 255–262. [Google Scholar] [CrossRef]
  61. Hill, C.A.S.; Ramsay, J.; Laine, K.; Rautkari, L.; Hughes, M. Water Vapour Sorption Behaviour of Thermally Modified Wood. Int. Wood Prod. J. 2013, 4, 191–196. [Google Scholar] [CrossRef]
  62. Čermák, P.; Baar, J.; Dömény, J.; Výbohová, E.; Rousek, R.; Pařil, P.; Oberle, A.; Čabalová, I.; Hess, D.; Vodák, M.; et al. Wood-Water Interactions of Thermally Modified, Acetylated and Melamine Formaldehyde Resin Impregnated Beech Wood. Holzforschung 2022, 76, 437–450. [Google Scholar] [CrossRef]
  63. Simón, C.; Fernández, F.G.; Esteban, L.G.; Palacios, P.; Hosseinpourpia, R.; Mai, C. Comparison of the Saturated Salt and Dynamic Vapor Sorption Methods in Obtaining the Sorption Properties of Pinus pinea L. Eur. J. Wood Prod. 2017, 75, 919–926. [Google Scholar] [CrossRef]
  64. Olek, W.; Majka, J.; Czajkowski, Ł. Sorption Isotherms of Thermally Modified Wood. Holzforschung 2013, 67, 183–191. [Google Scholar] [CrossRef]
  65. Li, T.; Cheng, D.; Avramidis, S.; Wålinder, M.E.P.; Zhou, D. Response of Hygroscopicity to Heat Treatment and Its Relation to Durability of Thermally Modified Wood. Constr. Build. Mater. 2017, 144, 671–676. [Google Scholar] [CrossRef]
  66. Willems, W. The Water Vapor Sorption Mechanism and Its Hysteresis in Wood: The Water/Void Mixture Postulate. Wood Sci. Technol. 2014, 48, 499–518. [Google Scholar] [CrossRef]
  67. Hou, S.; Wang, J.; Yin, F.; Qi, C.; Mu, J. Moisture Sorption Isotherms and Hysteresis of Cellulose, Hemicelluloses and Lignin Isolated from Birch Wood and Their Effects on Wood Hygroscopicity. Wood Sci. Technol. 2022, 56, 1087–1102. [Google Scholar] [CrossRef]
  68. Čermák, P.; Horáček, P.; Rademacher, P. Measured Temperature and Moisture Profiles during Thermal Modification of Beech (Fagus sylvatica L.) and Spruce (Picea abies L. Karst.) Wood. Holzforschung 2014, 68, 175–183. [Google Scholar] [CrossRef]
  69. Torniainen, P.; Popescu, C.-M.; Jones, D.; Scharf, A.; Sandberg, D. Correlation of Studies between Colour, Structure and Mechanical Properties of Commercially Produced ThermoWood® Treated Norway Spruce and Scots Pine. Forests 2021, 12, 1165. [Google Scholar] [CrossRef]
  70. Pétrissans, A.; Lin, Y.-Y.; Nguyen, T.N.; Colin, B.; Quirino, R.L.; Rios-Teixeira, P.; Chen, W.-H.; Pétrissans, M. Influence of the Heating Rate on the Thermodegradation during the Mild Pyrolysis of the Wood. Wood Mater. Sci. Eng. 2023, 18, 412–421. [Google Scholar] [CrossRef]
  71. Chen, C.; Tu, D.; Zhao, X.; Zhou, Q.; Cherdchim, B.; Hu, C. Influence of Cooling Rate on the Physical Properties, Chemical Composition, and Mechanical Properties of Heat-Treated Rubberwood. Holzforschung 2020, 74, 1033–1042. [Google Scholar] [CrossRef]
Figure 1. Schematic diagrams of the typical thermal modification process and sawing patterns for various test samples.
Forests 16 00427 g001
Figure 2. VDP and corresponding ML of SLTM samples: treatment at 185 °C (ad), 200 °C (eh), 215 °C (il); target surface layer thickness of 6 mm (a,b,e,f,i,j) and 12 mm (c,d,g,h,k,l); treatment time for 2 h (a,c,e,g,i,k) and 3 h (b,d,f,h,j,f).
Forests 16 00427 g002
Figure 3. Color changes in untreated and CoTM samples: L* (a), a* (b), b* (c), and ΔE* (d); changes in L* (e) and ΔE* (f) of SLTM samples with a target surface layer thickness of 6 mm; changes in L* (g) and ΔE* (h) of SLTM samples with a target surface layer thickness of 12 mm. Note: Surface of the samples (Sf), boundary layer between the surface and core layers (Bd), core layer (Co). The same letter in the ench figure indicates no significant difference between the two groups, while different letters indicate a significant difference, significance level of p < 0.05.
Forests 16 00427 g003
Figure 4. Variation in water absorption amount with soaking time for untreated and CoTM samples (a), SLTM samples (d); ASE for untreated and CoTM samples (b), SLTM samples (e); and differential swelling for untreated and CoTM samples (c), SLTM samples (f).
Forests 16 00427 g004
Figure 5. Sorption isotherms of samples: untreated and CoTM samples (a1), SLTM samples at 185 °C (b1), 200 °C (c1), and 215 °C (d1). Changes in equilibrium moisture content during the absorption and desorption: untreated and CoTM samples (a2), SLTM samples at 185 °C (b2), 200 °C (c2), and 215 °C (d2). Hygroscopic hysteresis rates: untreated and CoTM samples (a3), SLTM samples at 185 °C (b3), 200 °C (c3), and 215 °C (d3). Note: The dashed lines in (b1,c1,d1) represent the EMC of COTM samples under various treatment conditions at 96% RH.
Forests 16 00427 g005
Figure 6. Average time of Stages in one typical single-cycle process of various SLTM: Stage I (a), Stage II (b), Stage III (c); total treatment time of various CoTM, SLTM, and corresponding cycle times (d).
Forests 16 00427 g006
Figure 7. Radar map analysis of performance on CoTM (a) and SLTM (bd): the temperature of 185 °C (b); 200 °C (c); 215 °C. Note: Mass loss (ML), ΔE* of the sample surface (ΔEs*), Anti-swelling efficiency (ASE), Equilibrium moisture content at 96% RH (EMC), Energy consumption (EC).
Forests 16 00427 g007
Table 1. Sample information for thermal modification.
Logs IDHeight Above Ground (m)Growth Ring RegionOven-Dry Density (g∙cm−3)Dimensions of Samples (R × T × L, mm3)Number of Samples for CoTMNumber of Samples for SLTM
P11.3–412–170.42 ± 0.0250 × 50 × 3601424
P21.3–413–190.45 ± 0.0450 × 50 × 360712
Table 2. Treatment effects of various SLTM and CoTM samples.
Treatment
Type
Temperature (°C)SLT (mm)Time
(h)
SLA
(mm)
MLSL
(%)
ML
(%)
PT with 0% < ML ≤ 1%
(%)
PT with 1% < ML ≤ 2%
(%)
PT with 2% < ML ≤ 3%
(%)
PT with
3% ≤ ML
(%)
SLTM185628.281.691.3622.0173.954.040
36.502.341.6721.1879.511.010
12210.031.871.57088.6511.350
39.232.662.21057.7235.057.23
200626.442.081.55087.2212.780
35.842.741.96076.5816.077.35
12210.542.381.78063.7931.804.41
311.643.082.38043.3117.3039.39
215626.352.952.00074.0012.7413.26
36.493.742.40071.987.0720.95
12212.752.792.26038.7949.1712.04
312.613.542.96032.5626.7140.73
CoTM185-2--1.38-100--
-3--1.84-100--
200-2--4.24---100
-3--5.68---100
215-2--7.34---100
-3--9.69---100
Note: Target surface layer thickness (SLT); actual surface layer thickness (SLA); average surface layer mass loss (MLSL); and proportion of thickness (PT).
Table 3. Multiple comparisons for the water absorption of CoTM samples at different temperatures and times.
Temperature (°C)Time
(h)
Amax
(%)
Duncan GroupingASE
(%)
Duncan GroupingDifferential SwellingDuncan Grouping
Untreated 86.6A--3.3A
185281.6AB18.0A3.0A
380.1ABC21.4A3.0A
200274.3ABC37.9B2.9A
374.4ABC43.9BC2.8A
215265.2BC49.2BC2.8A
362.9C54.8C2.6A
Note: The same letter in the same column indicates no significant difference between the two groups, while different letters indicate a significant difference, significance level of p < 0.05.
Table 4. Multiple comparisons for the water absorption of SLTM samples at different temperatures and times.
Temperature
(°C)
SLT
(mm)
Time
(h)
Amax
(%)
Duncan GroupingASE
(%)
Duncan GroupingDifferential SwellingDuncan Grouping
1856284.5A17.2A3.3A
383.8A23.5ABC3.2A
12280.7AB21.0AB3.1A
380.8AB25.0BC3.1A
2006279.7AB22.6ABC3.1A
378.9AB25.9BC3.1A
12278.8AB25.0BC3.0A
377.6AB28.7CD3.0A
2156276.0AB26.7BC2.9A
374.4AB33.3BE3.0A
12274.7AB38.7EF2.9A
372.5B43.3F2.9A
Note: The same letter in the same column indicates no significant difference between the two groups, while different letters indicate a significant difference, significance level of p < 0.05.
Table 5. The energy consumption and CO2 emission for SLTM and CoTM.
Treatment TypeTemperature (°C)Target Surface Layer Thickness (mm)Time
(h)
E1
(kJ)
E2
(kJ)
E3
(kJ)
E4
(kJ)
E5
(kJ)
E6
(kJ)
E7
(kJ)
Etotal (kJ)Consumed Electrical Energy (kW∙h)CO2 Production (kg)
SLTM18562144,672161444,56563,3851,117,0741,628,698973,9013,973,90811041049
3212,938161444,56563,3851,755,4011,737,0321,011,9174,826,85113411274
122112,887161444,56563,385797,9101,509,109931,7383,461,207961913
3182,719161444,56563,3851,436,2371,964,6831,092,4424,785,64413291263
20062174,909161444,56565,2481,463,4391,510,883912,0384,172,69611591101
3241,616161444,56565,2482,113,8571,808,3611,008,1155,283,37614681394
122115,247161444,56565,248813,0221,351,204860,5443,251,443903858
3150,950161444,56565,2481,138,2311,569,320931,0463,900,97210841029
21562208,263161444,56567,1091,823,0381,498,720891,3024,534,61012601197
3274,970161444,56567,1092,485,9611,836,157991,8725,702,24715841505
122117,618161444,56567,109828,6541,288,486828,7493,176,794882838
3190,603161444,56567,1091,491,5771,650,179936,5764,382,22212171156
CoTM185-226,386161449,45055,46711,8962,999,0162,413,4405,557,26915441467
326,386161449,45055,46711,8963,096,7942,448,0005,689,60615801501
200-229,408161449,45056,07214,9183,284,9432,499,8405,936,24516491567
329,408161449,45056,07214,9183,391,6102,534,4006,077,47216881604
215-232,535161449,45056,67618,0453,597,5362,586,2406,342,09517621674
332,535161449,45056,67618,0453,713,0922,620,8006,492,21118031713
Disclaimer/Publisher’s Note: The statements, opinions and data contained in all publications are solely those of the individual author(s) and contributor(s) and not of MDPI and/or the editor(s). MDPI and/or the editor(s) disclaim responsibility for any injury to people or property resulting from any ideas, methods, instructions or products referred to in the content.

