Article

Precision Modeling of Fuel Consumption to Select the Most Efficient Logging Method for Cut-to-Length Timber Harvesting

Faculty of Science, Forestry and Technology, University of Eastern Finland, P.O. Box 111, FI-80101 Joensuu, Finland
Forests 2025, 16(2), 294; https://doi.org/10.3390/f16020294
Submission received: 21 January 2025 / Revised: 1 February 2025 / Accepted: 7 February 2025 / Published: 8 February 2025

Abstract

:
The fuel consumption of a harvester–operator system was modeled to select logging methods by comparing the forward felling technique (C) and the sideways techniques at the logging edge (A and D) or inside of the stand (B and E). To that end, trees’ logging cycle process data were collected using a drone for time consumption analysis. The fuel consumption data were recorded automatically from the harvester’s digital monitoring system. The fuel consumption averaged 0.22 L during the logging cycle process of trees on flat terrain and 0.25 L for those on sloping terrain. In stands on flat terrain, logging method C consumed 7.9 L E0h−1 more fuel than method A and 4.9 L E0h−1 more fuel than method B, meaning method A consumed 3.0 L E0h−1 less fuel than method B. On sloping terrain, logging method D consumed 1.4 L E0h−1 less fuel than method E. There was a large variation in fuel consumption between the logging methods, which was explained most efficiently (R2 = 0.70) by the stem processing speed (m E0h−1), the tree’s stem length (m), and effective hours of tree logging cycle processes (E0h). The results reveal that logging methods A and D were the most efficient. This precision modeling structure is recommended for the development of working techniques for harvester operators and for environmental efficiency comparisons of logging methods in different timber harvesting conditions.

1. Introduction

1.1. Background

Timber harvesting agreements between contractors and the forest industry are currently based on tenders of contracts, where a contractor submits an offer for a timber harvesting service [1]. Fuel consumption information can be utilized in this work. Conventionally, it is also used as basic information when planning, negotiating, and agreeing on the rates for contracting. Since 2022, energy prices and costs have increased greatly. Therefore, up-to-date information about the fuel consumption of machinery has a greater effect than in the past on contractors’ business success in forestry. In addition, fuel consumption data can be utilized as background information for the design and development of machines in order to improve their work and environmental efficiencies [2,3].
In fully mechanized tree logging, fuel consumption is impacted by three factors, i.e., the harvester, the operator, and the harvesting conditions (Figure 1). These factors can be further divided into sub-factors. For example, operator characteristics can be divided into physical and psychological performance [4]. In addition, the logging method can be considered, which refers to the way the operator of the harvester performs their harvesting work. This can be self-learned, or the operator can apply a standard logging method they learned in operator training [5]. To improve operators’ work, these methods can be developed and redesigned by applying the findings of time and motion studies [6], which compare the efficiencies of different logging methods in practice (e.g., fuel consumption, productivity). In the process, the influences of all other factors should be identified during data analysis. To that end, Palander [3] proposed that a combined human–machine (harvester–operator) system should be used in research analyses, and we took up their proposal in the present study.

1.2. Fuel Consumption

Studies of cut-to-length harvesters have underlined that the removed tree size, the logging method, timber assortments, the engine power, the type of machine, machine adjustments, tracks, and operator skills all affect the harvesters’ fuel consumption (e.g., refs. [7,8,9,10,11,12,13,14,15,16]). These studies have thus failed to produce clear and precise results that designers can apply in their practical work to develop the sector. For clearer conclusions, it has been suggested that studies should evaluate specific factors, such as the effect of the size of the harvested stems on fuel consumption [7,9,16] or the effect of the operating conditions [15]. In this study, the above-mentioned factors were controlled in our experiments. Furthermore, we investigated the use of different logging methods, defined as the ways operators of harvesters carry out the tree logging cycle using different felling techniques either on flat or sloping terrains.
Previously, Holzleitner [8] calculated the hourly fuel consumption (15.6 L h−1) of wheel harvesters in 2004–2008 in Austria, and Ackerman et al. [17] assessed harvesters’ cubic-meter-based fuel consumption (0.64 L m−3) in 2014–2015 in South Africa. Furthermore, Klvac and Skoupy [18] and Spinelli and De Arruda Moura [15] reported the fuel consumption of excavator-based harvesters. An average consumption of 1.39 L m−3 was measured for excavator-based harvesters in tree plantations [15]. Recent studies of wheel harvesters have reported lower average fuel consumption levels of 0.6–0.8 L m−3 [14,16,17,19]. However, only a few studies have applied a digital monitoring system in tree plantations in order to calculate wheel harvesters’ fuel consumption [20]. To provide more robust conclusions, especially ones that would support the improved design of harvesters, we determined that it was necessary to evaluate the effects of logging methods more precisely by applying a temporal approach to modeling fuel consumption instead of a cubic-meter-based approach. We also implemented precision modeling in the hope that it would provide a novel understanding of the factors affecting fuel consumption, taking into account operators’ felling techniques.
Since the 2000s, fuel consumption studies have been performed automatically using harvesters’ integrated data analysis tools and digital information systems [21], and several productivity studies have been carried out using the same techniques [2,3,22]. This method provides data every second and simplifies the data collection phase compared to conventional studies in which fuel refills by harvester operators are measured by an operator or a researcher shortly after periods of work and recorded afterward [16]. In addition, digital fuel consumption data can be synchronized with data from time and motion studies to ensure their precision [20,23]. This synchronization is advantageous as it provides temporal values that allow for precision modeling of the relationships between fuel consumption and its influencing factors, which are impossible to identify with conventional follow-up data collection methods producing separately measured, discrete, average, cubic-meter-based values.
There is a lack of information to date on harvester fuel consumption on Brazilian tree plantations, and digital data systems have proven valuable in selecting efficient logging methods when comparing different felling techniques in wood procurement. Moreover, precision modeling may be essential to understand the effects of temporal factors identified using digital monitoring systems on the fuel consumption of a harvester–operator system. Therefore, this study aimed to analyze and model the fuel consumption of a harvester–operator system in tree logging cycle processes and to clarify which factors most significantly affect fuel consumption at this precision level. We investigated the tree size, the stem processing speed, the tree’s stem length, and the effective hours of tree logging cycle processes, which were hypothesized to be important factors.

2. Materials and Methods

Tree plantations were investigated in the state of Paraná in southern Brazil, near Argentina and Paraguay. In August 2022, final fellings as part of timber harvesting operations took place on mineral soils over flat and sloping terrain. The stand comprised Eucalyptus (Eucalyptus spp., 66% of the harvested and recorded data) and pine (Pinus spp., 44% share). Data were collected automatically via the harvester’s digital monitoring system.

2.1. Harvester

A Ponsse Ergo wheeled harvester was used to perform the logging experiments, allowing us to decrease the impact of harvester characteristics on the results of this study. Data about the machine were collected (model, dimensions, year of manufacture, operating hours, engine brand, engine power, crane, harvester head, number of wheels and tracks). It was a 2016 model and was serviced before data collection upon reaching 22,235 operating hours. The harvester’s dimensions were as follows: length of 813 cm, width of 263–309 cm, and 60 cm ground clearance. Its engine was an MB OM906LA EU Stage IIIA with power of 205 kW and tractive force of 195 kN. The max torque was reached at 1100 Nm (1200–1600 rpm). The crane’s (C44) slewing torque was 57 kNm, the tilt angle was ±20°, the turning angle was 250, and the lifting torque was 250 kNm. The harvester’s head pump (190 cm3) and crane pump (145 cm3) of the hydraulic system were controlled using PONSSE OptiControl. In addition, the harvester was equipped with the H7 Euca logging device, with a boom reach of 9.5 m, which was developed for processing Eucalyptus trees. The operating mass of the harvester (with accessories) was 24,650 kg. It was equipped with tracks on the front bogie and the rear bogie axle.

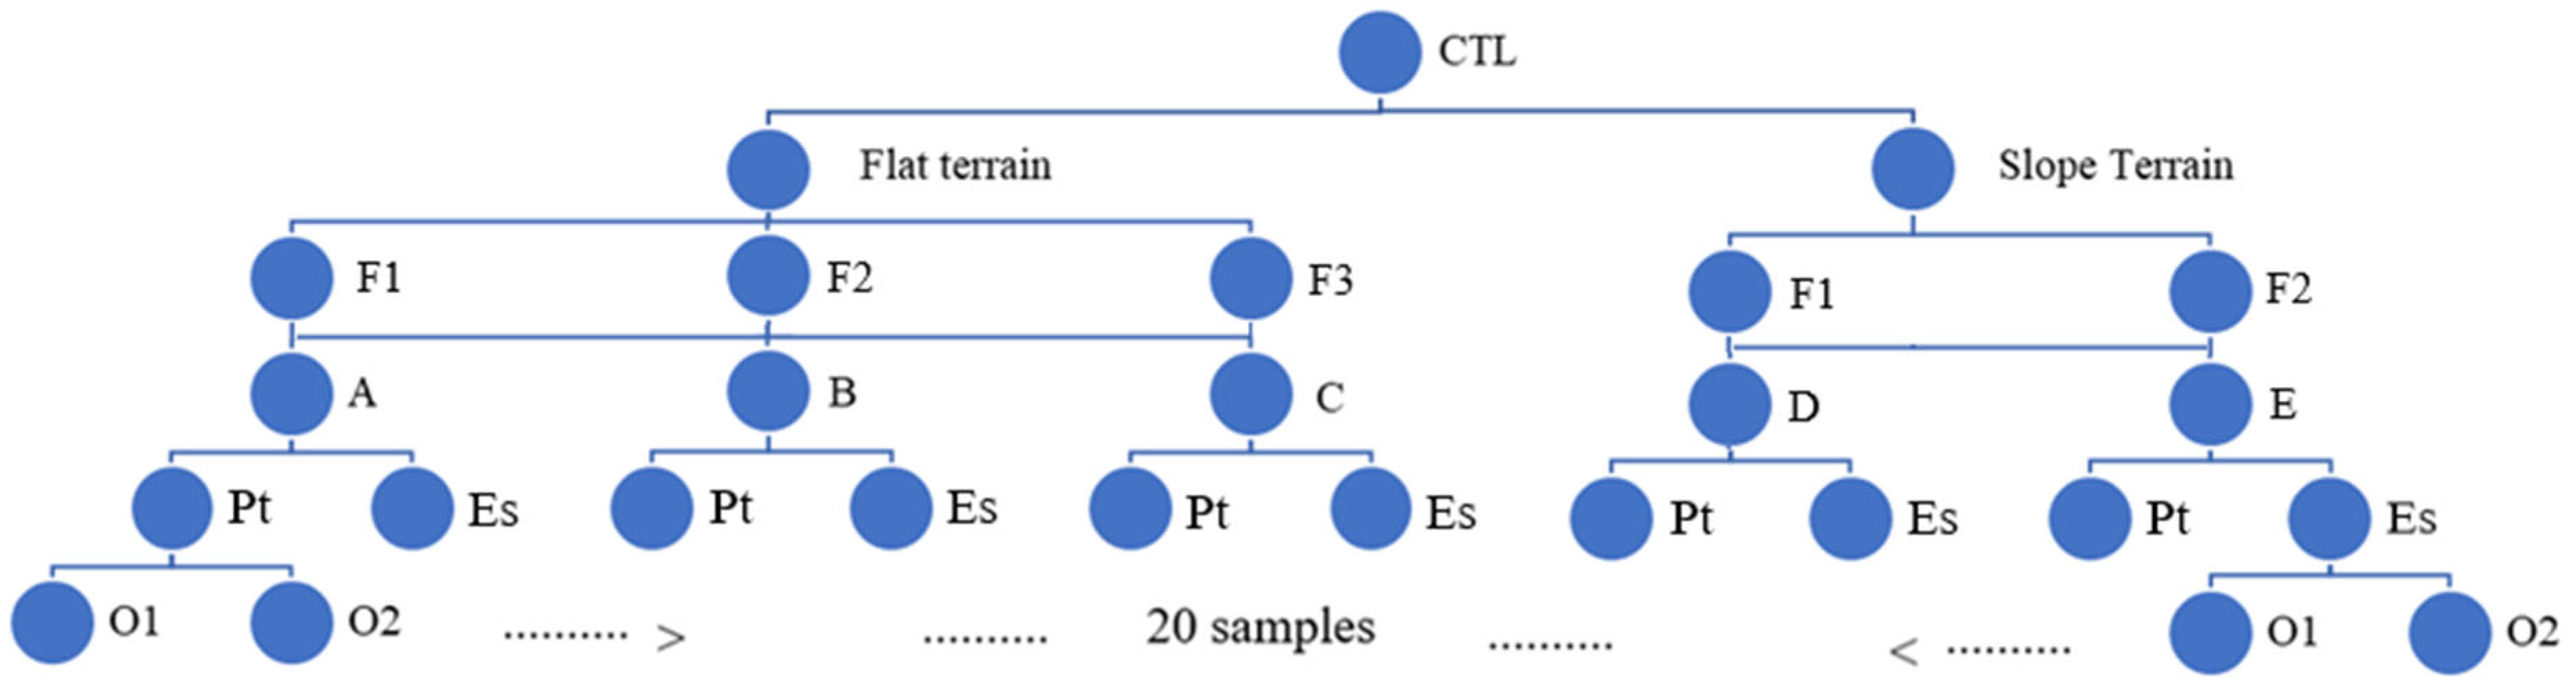
2.2. Study Design of the Logging Experiments

Three tree felling techniques were compared on flat and sloping terrains using a study framework with combinations of five logging methods, two tree species, and two operators (Figure 2). Fuel consumption, working time, and timber harvesting data from each harvesting site were collected in these experiments.
The experiments were performed on four forest stands, the characteristics of which are presented in Table 1. These planted short-rotation forests were not thinned during the growing rotation. Harvesting data were obtained from a Klabin enterprise resource-planning system. Data included the identification number of the site, the logging method, total removals from the site by tree species, the number of stems removed and their size (m3), and timber assortments harvested. The average tree size removed was calculated by dividing the total harvesting volume by the number of stems removed.

2.3. Time and Motion Study

Niebel’s [6] research methods were used for efficiency comparisons of the logging methods. In addition, comparisons were made at the tree level. Work phases were observed visually using video material, which was processed using a video analysis tool developed for the research. During data collection and analyses of the logging methods, we used a designed motion chart, i.e., a dynamic system description of the work phases of the harvester–operator system (Figure 3).
Table 2 describes characteristics of the tree stems cut by the harvester–operator system. These variables were used in the analysis of logging processes of trees for precision modeling of fossil fuel consumption by the harvester–operator system.

2.4. Fuel Consumption of the Harvester–Operator System

Fuel consumption data were obtained from an EcoDrive system (Ponsse plc). The data were collected automatically by the harvester’s digital fuel monitoring system. In total, 496 L of diesel was consumed during logging and 813 m3 of wood was cut. The consumption data of the EcoDrive system were filtered and rounded to suitable decimal places. The fuel consumption calculations used temporal data on the work phases of the tree logging cycle processes, assuming that consumption in separate work phases differed as different felling techniques were used in the operator’s work model. Therefore, a time consumption calculation was performed before the analysis of the logging methods to select the most efficient felling techniques in different harvesting conditions. Our main conclusions were based on the effective hours (E0h), which do not include work breaks.
The average fuel consumption (L tree−1, L E0h−1, L m−3, L m−1) of the harvester–operator system was calculated separately in each experiment based on the terrain type, the tree species, the operator, the felling technique and the logging method (Table 3 and Table 4). Hourly fuel consumption (L E0h−1) was calculated by dividing the total fuel consumption in the experiment by the total effective production hours, while cubic-meter-based fuel consumption (L m−3) was calculated by dividing fuel consumption by the total wood amount harvested.

2.5. Operators

Background data were collected on the operators, describing their age, work experience, and training. Efficient logging requires experienced operators; therefore, we selected efficient operators to reduce the results’ variation. One operator was sourced from a local forest industry company (Klabin), which owns the plantations and forest machines utilized, and another operator was sourced from the forest machinery manufacturer (Ponsse). The former had worked as a forest machine operator for seven years, while the latter had worked for companies for nine years and then as an operator trainer for eight years, thus having seventeen years’ work experience. Both were aged between 40 and 50 years. They had plentiful work experience in mechanized cut-to-length logging operations, which was sufficient for us to surmise that they conducted effective work. They had also been trained in fuel-efficient logging operations.

2.6. Statistical Analysis

The data were collected separately in the experiments. The variables relating to fuel consumption were first described using percentage shares, mean values (average and mode), and standard deviations. A box and whisker plot was used to visualize the data distribution in the experiments on logging methods. Then, data from separate logging method experiments were tested for normal distribution using a Kolmogorov–Smirnov test, which did not provide acceptable results. Therefore, differences between the logging methods were examined with the Kruskal–Wallis test and the Mann–Whitney U test [24].
Next, we combined data. In addition to time-connected data (E0h), the stem volume (m3) and length of the commercial part of the stem (m) were also recorded as continuous tree-related variables in logging method data collection. We did not use the stem volume in our regression analysis as we had performed correlation analyses of the continuous explanatory variables to find the best variables [25]. A correlation analysis was not performed between the terrain, the tree species, the operator, and the logging method as they were considered discrete variables [26].
To select the optimum logging method, a precision model was developed for the harvester–operator system’s fuel consumption at trees’ logging cycle level. For precision modeling, we used mathematical models and statistical assumptions to make predictions about the practice [27]. A multilinear regression analysis was used by first entering the predictor variables that contributed the most to the prediction equation [2]. Variables were selected by utilizing a multiple-correlation analysis [25]. Different transformations were performed to achieve symmetrical residuals for the model and to ensure the greatest statistical significance of the model coefficients. Model suitability with respect to the data was numerically assessed based on the adjusted degree of explanation (adjusted R2). Firstly, a conventional cubic-meter-based fuel consumption model was produced, where tree size was the independent variable. However, it was insufficiently precise to explain the causal relationships between the selected variables and the harvester–operator system’s fuel consumption. To improve on the model, a novel hour-based fuel consumption model was developed. All statistical analyses, which consisted of statistical tests, correlations, and causality analyses, were performed using SPSS-25X Version 28 [28].

3. Results

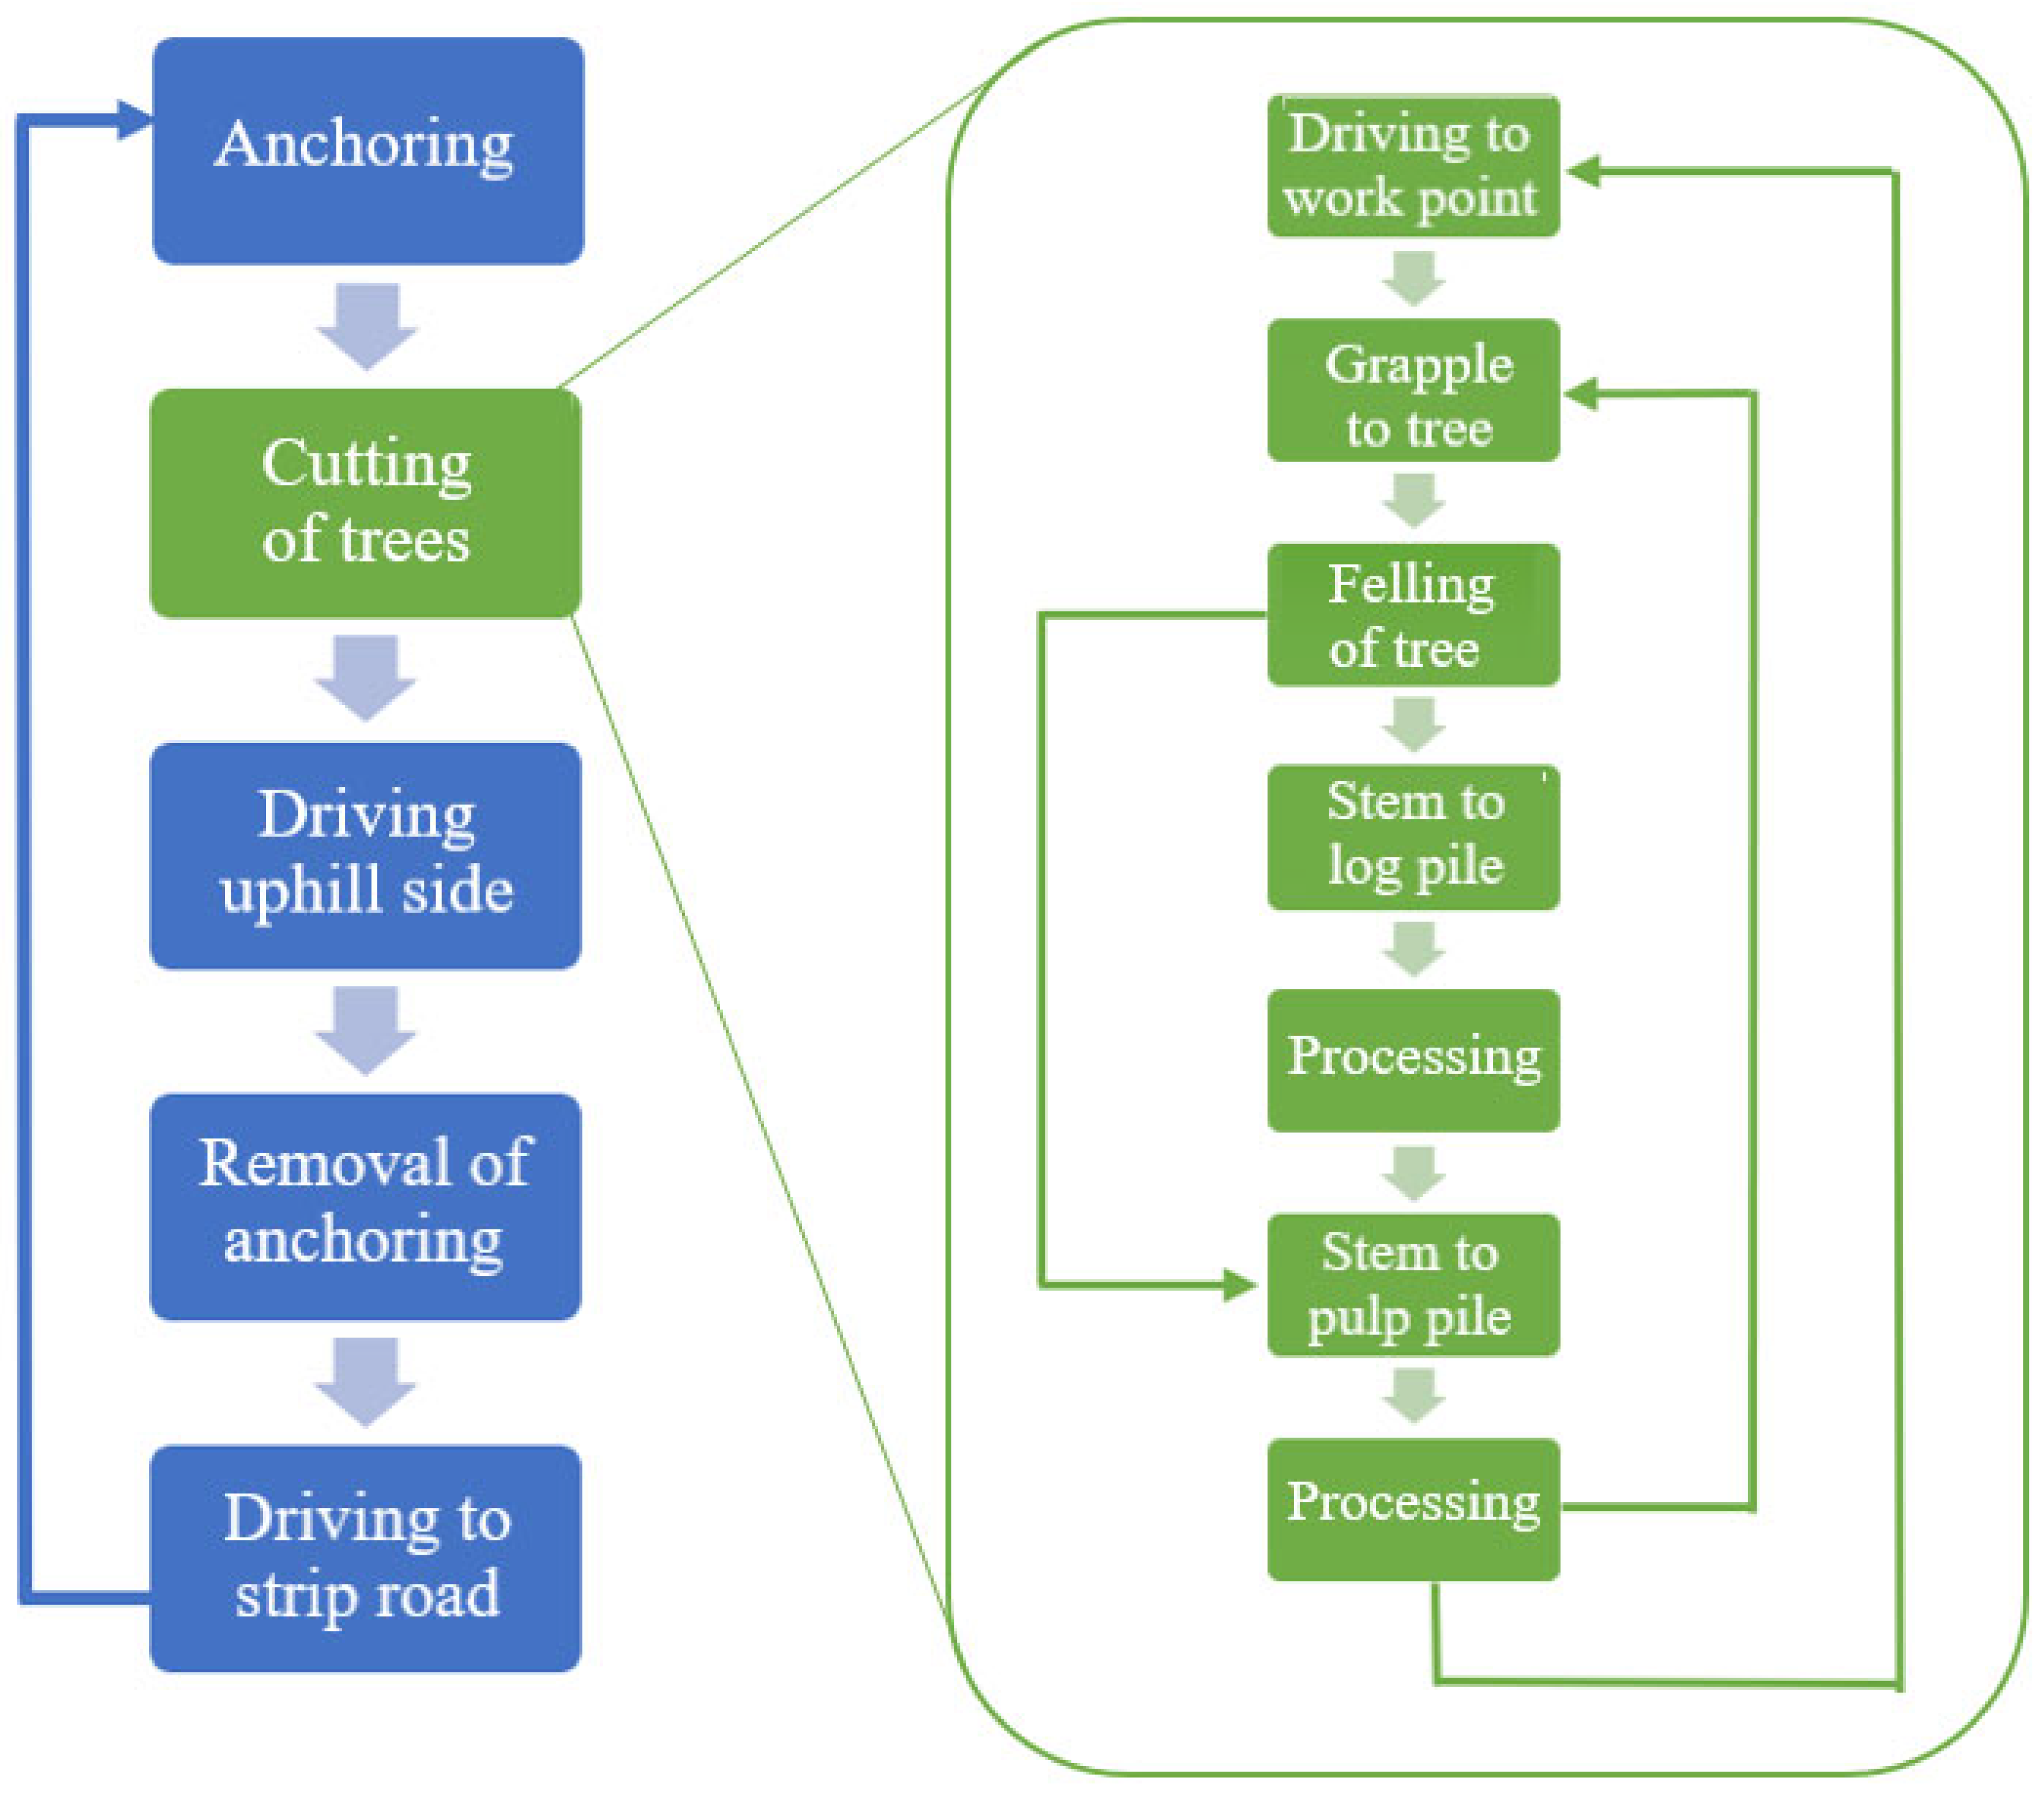
3.1. Fuel Consumption in the Tree Logging Cycle Process

Total fuel consumption averaged 0.61 L m−3 and 34 L E0h−1, while fuel consumption averaged 0.23 L tree−1 during the logging cycle processes with the logging methods (Table 3 and Table 4). Fuel consumption levels per tree were also calculated for the logging methods, which are presented in Figure 4. The boxplot illustrates the average values (median and mathematical average) and deviations from those (vertical black lines) of the logging methods. The boxes show the data distribution in quartiles, highlighting the means. The lines extending vertically, “whiskers”, indicate the variability outside of the upper and lower quartiles of the boxes. The skewness of fuel consumption increased in sloping terrains, with greater fuel consumption. Moreover, the logging methods significantly differed in their fuel consumption (Table 5). When analyzed on flat terrain, we found differences between logging methods C and A and between C and B.

3.2. Hourly and Cubic-Meter-Based Fuel Consumption

The hourly fuel consumption varied between 27.9 and 41.9 E0h−1 for the experimental groups, while consumption per cubic meter varied between 0.5 and 0.8 L m−3 (Table 3 and Table 4). When the average fuel consumption was examined, we noted that the terrain and the operator caused the greatest variations. On sloping terrain, the hourly fuel consumption was 4.5% higher on average than when logging on flat terrain, while the fuel consumption per cubic meter on sloping terrain was 15.7% higher than that on flat terrain. Operator 1’s hourly fuel consumption was 5.0% higher than operator 2’s, and, likewise, operator 1’s fuel consumption per cubic meter was 11.6% higher than operator 2’s. When logging Eucalyptus, the hourly fuel consumption was 2.4% higher than when logging pine, but a negative difference was observed in the consumption per cubic meter, i.e., it decreased by 3.6%. There was little variation in the average tree size (m3) between species, and it was found not to influence fuel consumption.
Next, the average experimental values were analyzed with respect to the felling techniques. When felling technique F3 was used, the hourly fuel consumption was 6.8 and 12.4% higher than F1 and F2, respectively. However, the fuel consumption differences per cubic meter were correspondingly at a lower level, i.e., 2.9 and 2.2% lower. A comparison between logging method C with F3 and A with F1 showed, in contrast, a 19.2% increase in fuel consumption per cubic meter if F3 was used instead of F1, or a 22.7% increase when the hourly fuel consumption was calculated. These observations of the logging methods and the felling techniques were made on flat terrain. On sloping terrain, logging method D with F1 consumed 4.0% less hour-based fuel than method E with F2. However, fuel consumption increased by 3.6% in the cubic-meter-based measure. When felling technique F1 was considered alone with logging methods A (flat) and D (slope), there were increases of 13.4% for cubic-meter-based consumption and 28.1% for hourly consumption.
The divergent results between hourly consumption and cubic-meter-based average fuel consumption indicate a need for more accurate analyses and precision modeling of fuel consumption during the logging cycle process at the tree level in order to compare logging methods. Then, the research data could contribute to logging method redesign, which requires precise information.

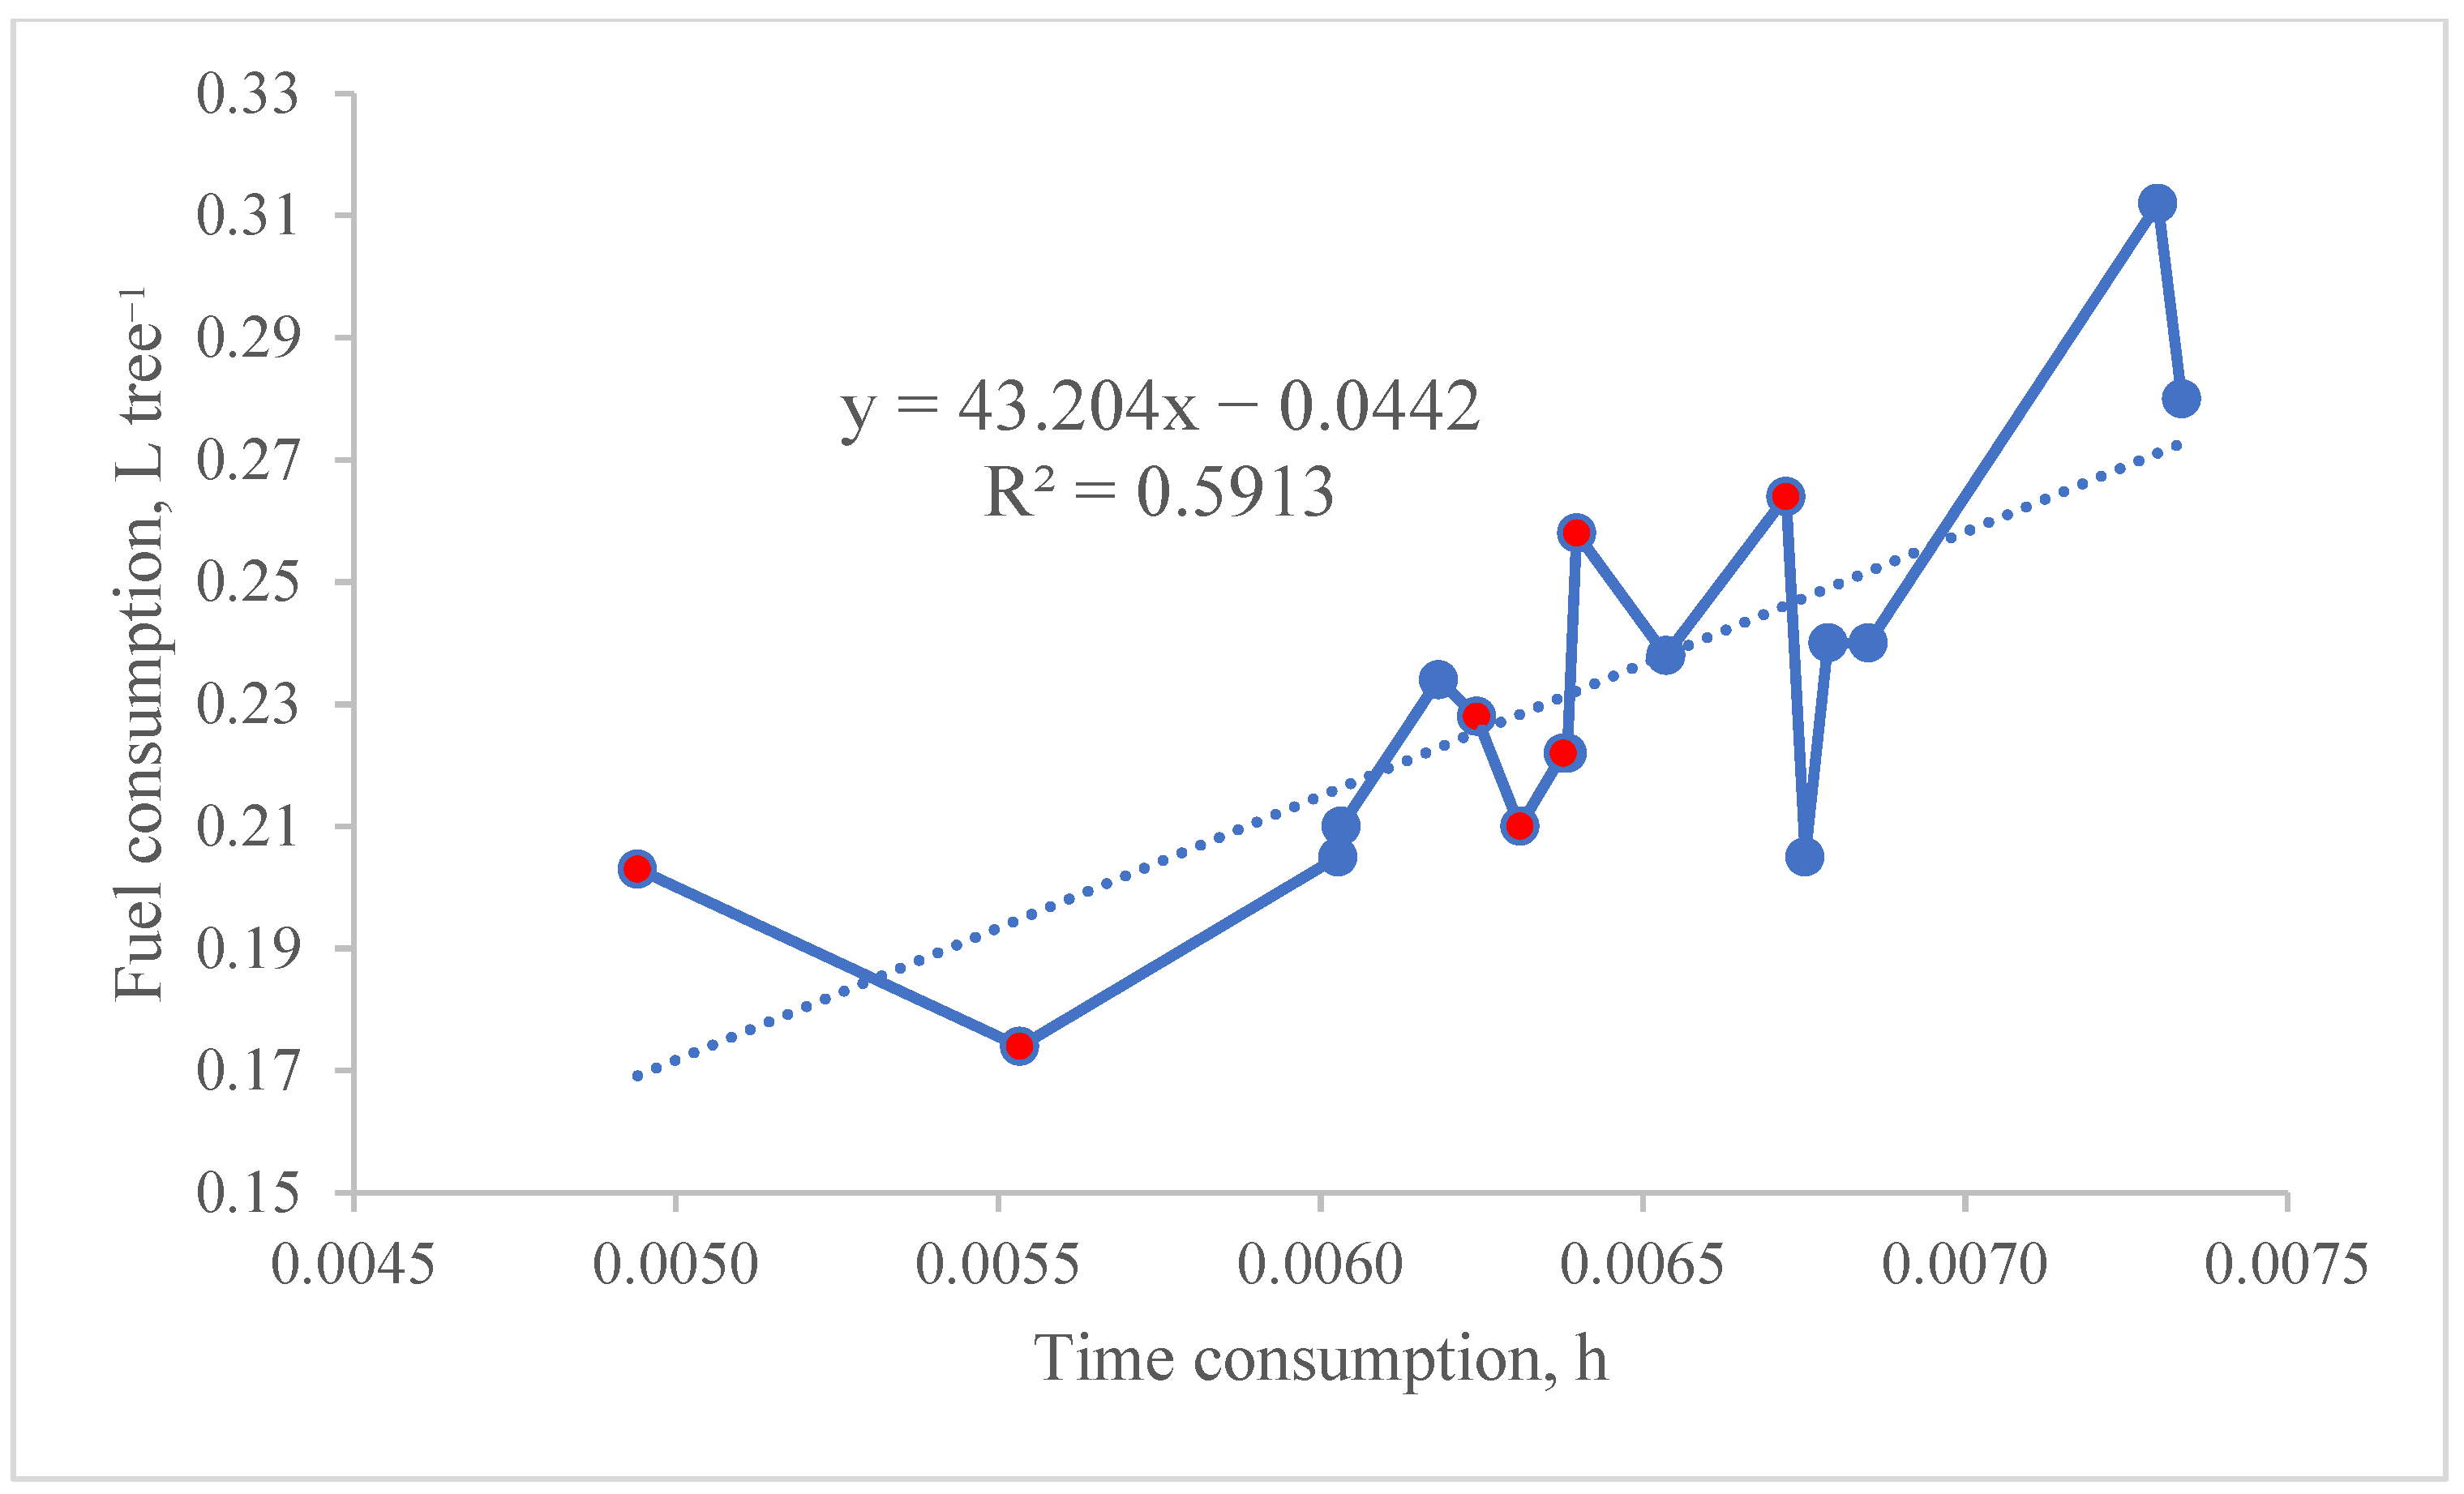
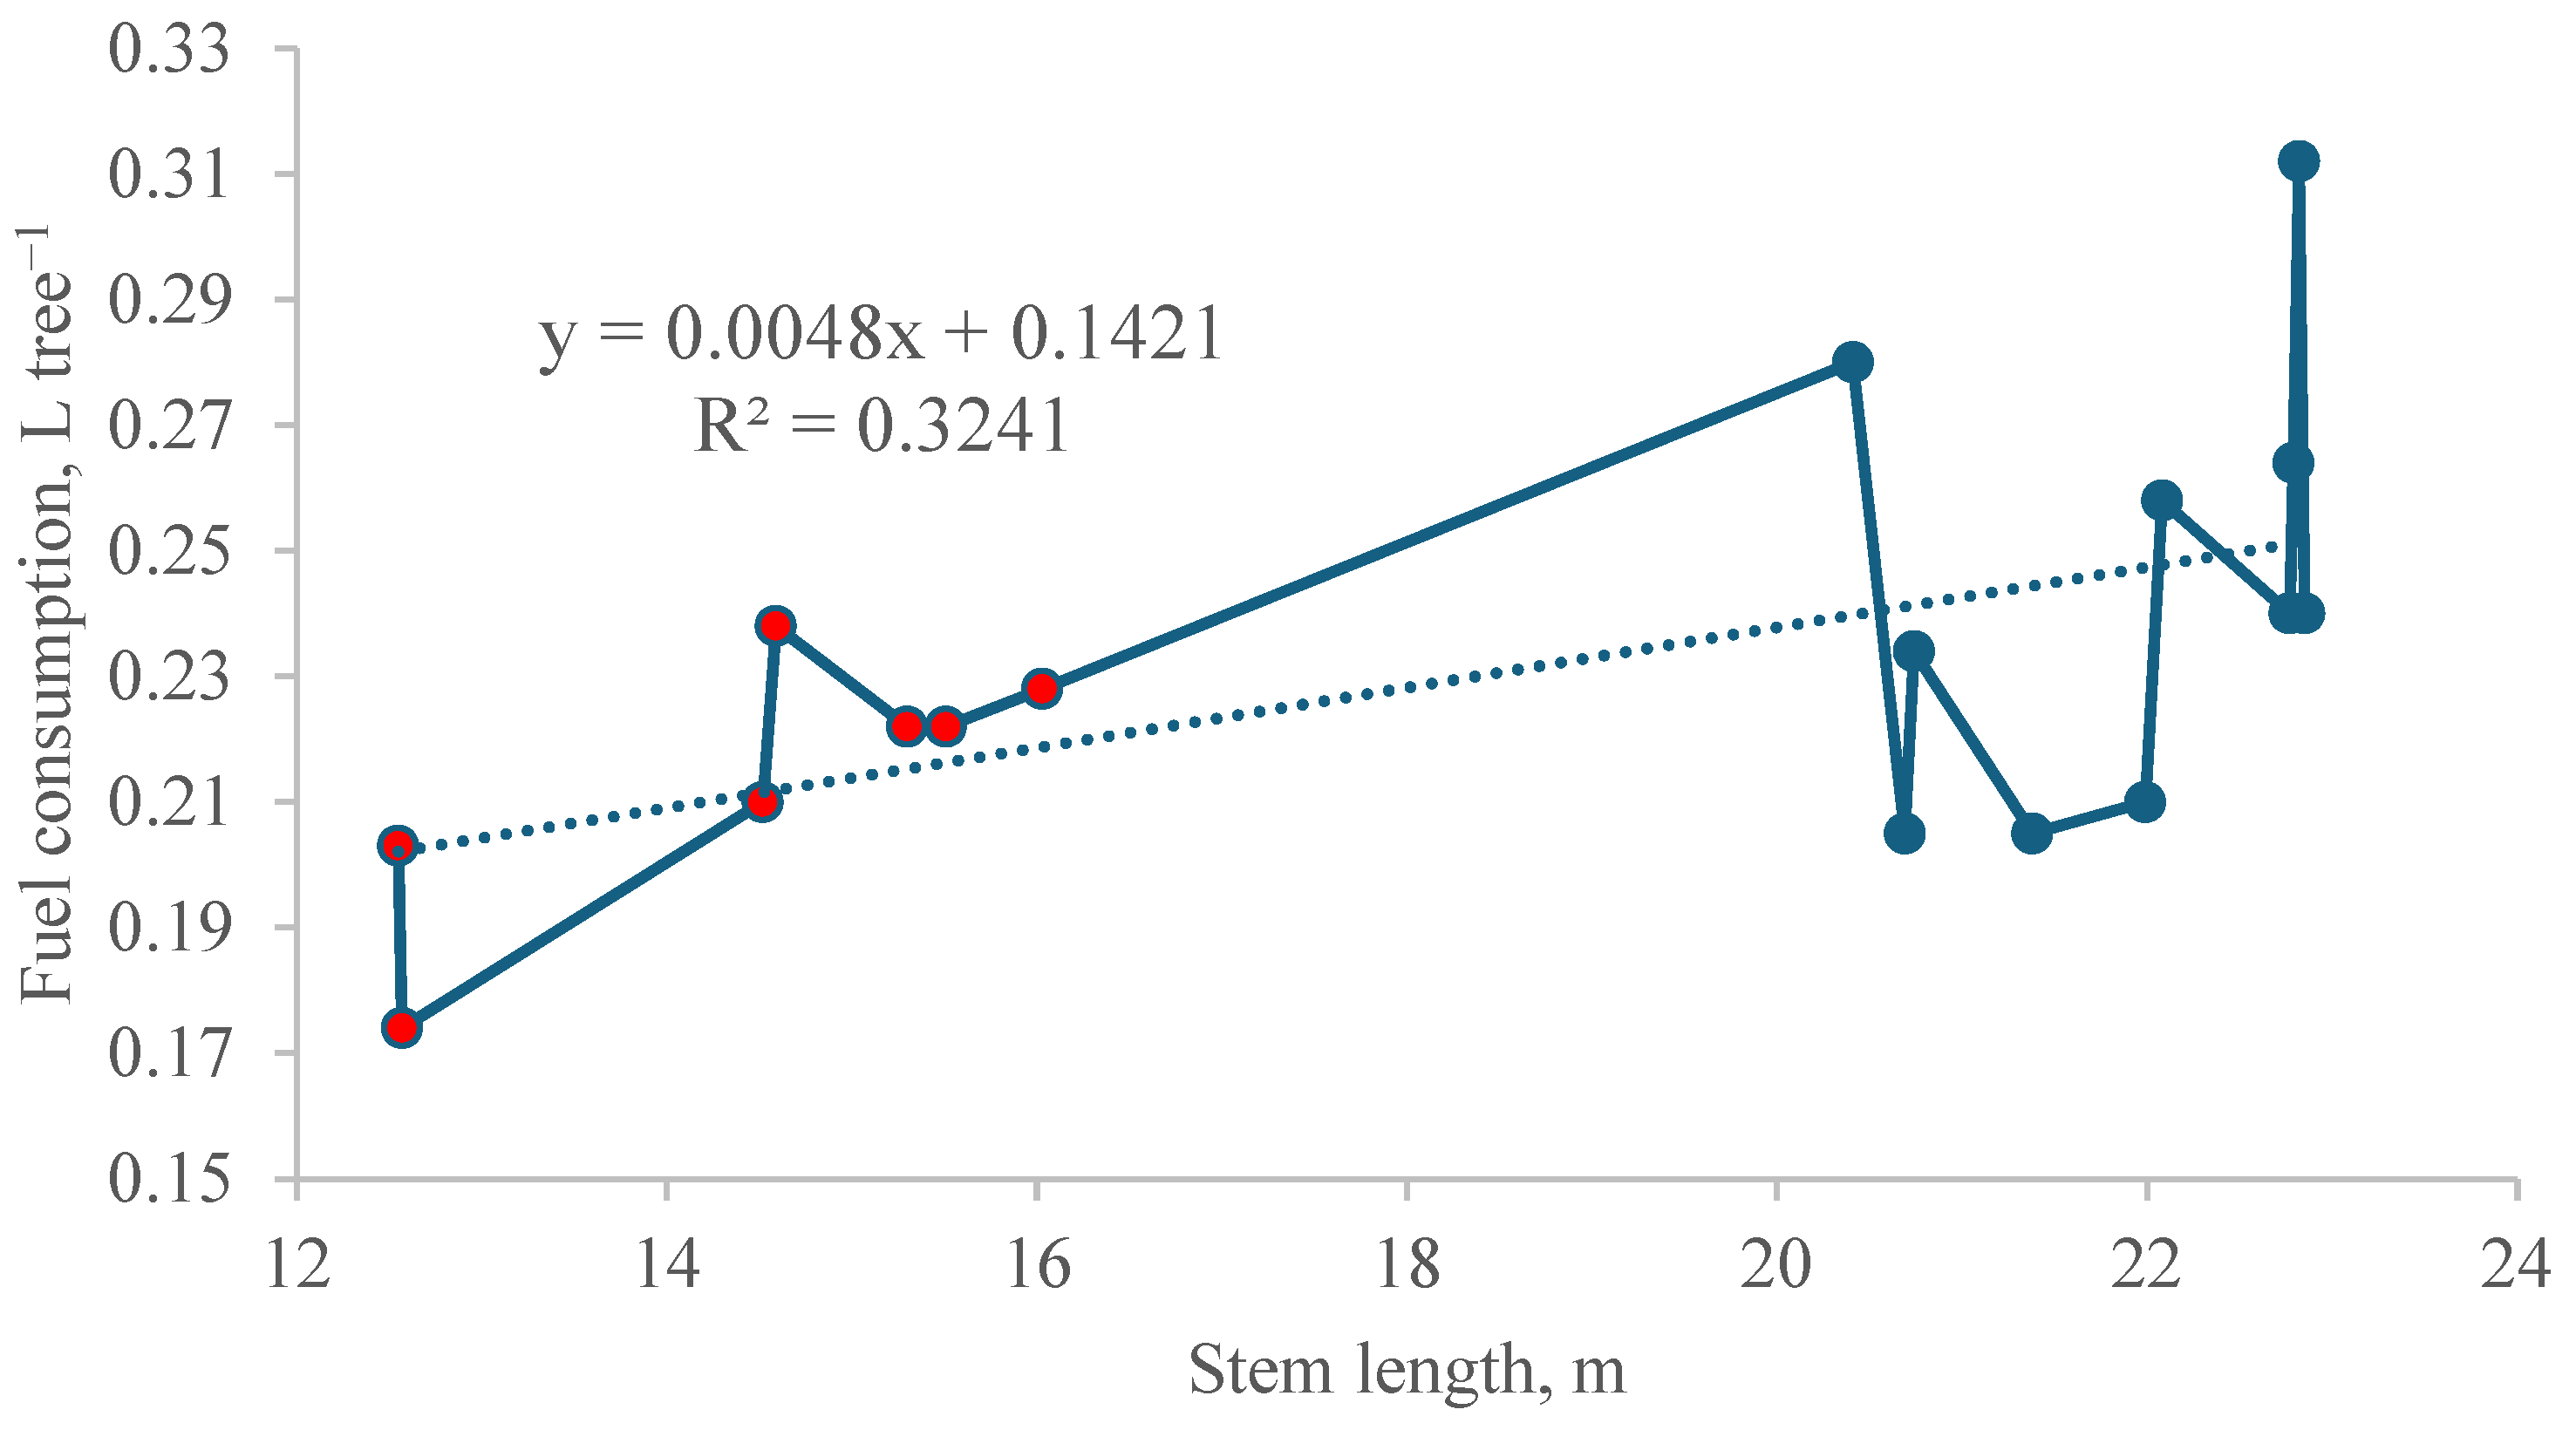
3.3. Explanatory Variables in the Logging Cycle Process

This analysis considered the harvester–operator system’s fuel consumption in the tree logging cycle process based on the average experimental values (Figure 5, Figure 6, Figure 7 and Figure 8). Fuel consumption was depicted in relation to potential regression variables: tree size (m3), effective time consumption (E0h), tree length (m), and tree processing speed (m h−1). The linear regression coefficients of determination (R2) for these were 0.15, 0.59, 0.32, and 0.12, respectively. The combined effects of these continuous variables were analyzed and modeled further, as reported in the next section, to determine their precise importance for tree logging cycle processes.

3.4. Precision Modeling of Fuel Consumption

Table 6 shows the linear dependencies between the continuous variables—tree size (m3), stem length (m), fuel consumption (L), stem processing speed (m h−1), and logging cycle process time (E0h)—which were examined via correlation analysis. We found a significant linear correlation (rs) between these variables, e.g., the logging cycle process time (E0h) increased significantly (0.505, p < 0.05) as the size (m3) of the same tree increased and vice versa. As another example, a strong positive correlation was found whereby the stem processing speed (m h−1) increased almost linearly (0.937, p < 0.001) as the stem length (m) of the same tree increased.
The linear correlation between the tree size (m3) and fuel consumption of the logging cycle process (L) was quite low (0.387), and that between fuel consumption and the stem processing speed (m h−1) was at a similar level (0.344). Both variables were considered for the regression modeling of fuel consumption; however, their correlation was found to be significant. Both continuous variables were therefore assumed to behave in the same way in the regression analysis. In statistical terms, there was a strong multicollinear relationship between them. Because the linear correlation between the stem processing speed (m E0h−1) and the tree logging cycle process time (E0h) was statistically nonsignificant, they were chosen as potential explanatory variables for the regression modeling of fuel consumption. A linear regression model with the stem length, the stem processing speed, and the tree logging cycle process’s time as the predictor variables took the following form:
F i = β 0 + β 1 · L i + β 2 · T i + β 3 · P i + ϵ i
where
  • F i is fuel consumption (L) during the logging cycle process of tree i;
  • L i is the length of the stem (m) of tree i;
  • T i is the time consumption of the logging cycle process of the stem (E0h) of tree i;
  • P i is the processing speed of the stem (m E0h−1) of tree i;
  • β 0 is the constant term;
  • β 1 , β 2 , and β 3 are the regression parameters for the predictor variables L i , T i , and P i ;
  • ϵ i is the residual value.
Table 7 describes the dependence of fuel consumption (L) on the constant term and the three predictor variables described above, which together explained fuel consumption most efficiently based on model 1. This model explained 70% (R2 = 0.703) of the variation observed in the harvester–operator system’s (human–machine system) fuel consumption during the tree logging cycle process based on all data from all study stands and experiments.

4. Discussion

4.1. Evaluation of the Study Data and the Methods

The dataset we collected in this study was large enough to allow us to analyze and model the harvester–operator system’s fuel consumption. Overall, the total timber harvesting volume and fuel consumption were 813.1 m3 and 496.4 L, respectively. The fuel consumption data were collected automatically by the harvester’s digital monitoring system and logged as standardized files, including fuel and time observations [20,21]. Cubic-meter-based data, meanwhile, were collected from the enterprise resource planning system of the forest industry company that supported our research, with easy access to large datasets allowing for experiments on different logging methods. In addition, hour-based data on the work phases of the logging methods were collected manually using an Excel program we developed from videos shot using drones. However, it should be noted that the data collection methods used were not suitable for producing long-term follow-up data or average fuel consumption results for harvesting conditions across all kinds of harvesting sites. Consequently, long-term factors must be assessed in another way, e.g., as cubic-meter-based average values through conventional monitoring files [16].
In summary, the data collection methods used were suitable for producing accurate cubic-meter-based and hourly data about the work phases of different logging methods (Figure 3). When combined with precision modeling, they provided reliable results on a harvester–operator system’s fuel consumption on flat and sloping terrains in tree plantations. Although the datasets from this study were smaller than the long-term follow-up datasets, they were sufficiently large to be representative of the logging method redesign with selected felling techniques based on precision modeling. Note that we used the term “logging method” in a way that differed from the above-mentioned studies (Figure 2 and Figure 3), in which the “logging method” was defined more generally, e.g., thinning, final felling, etc.

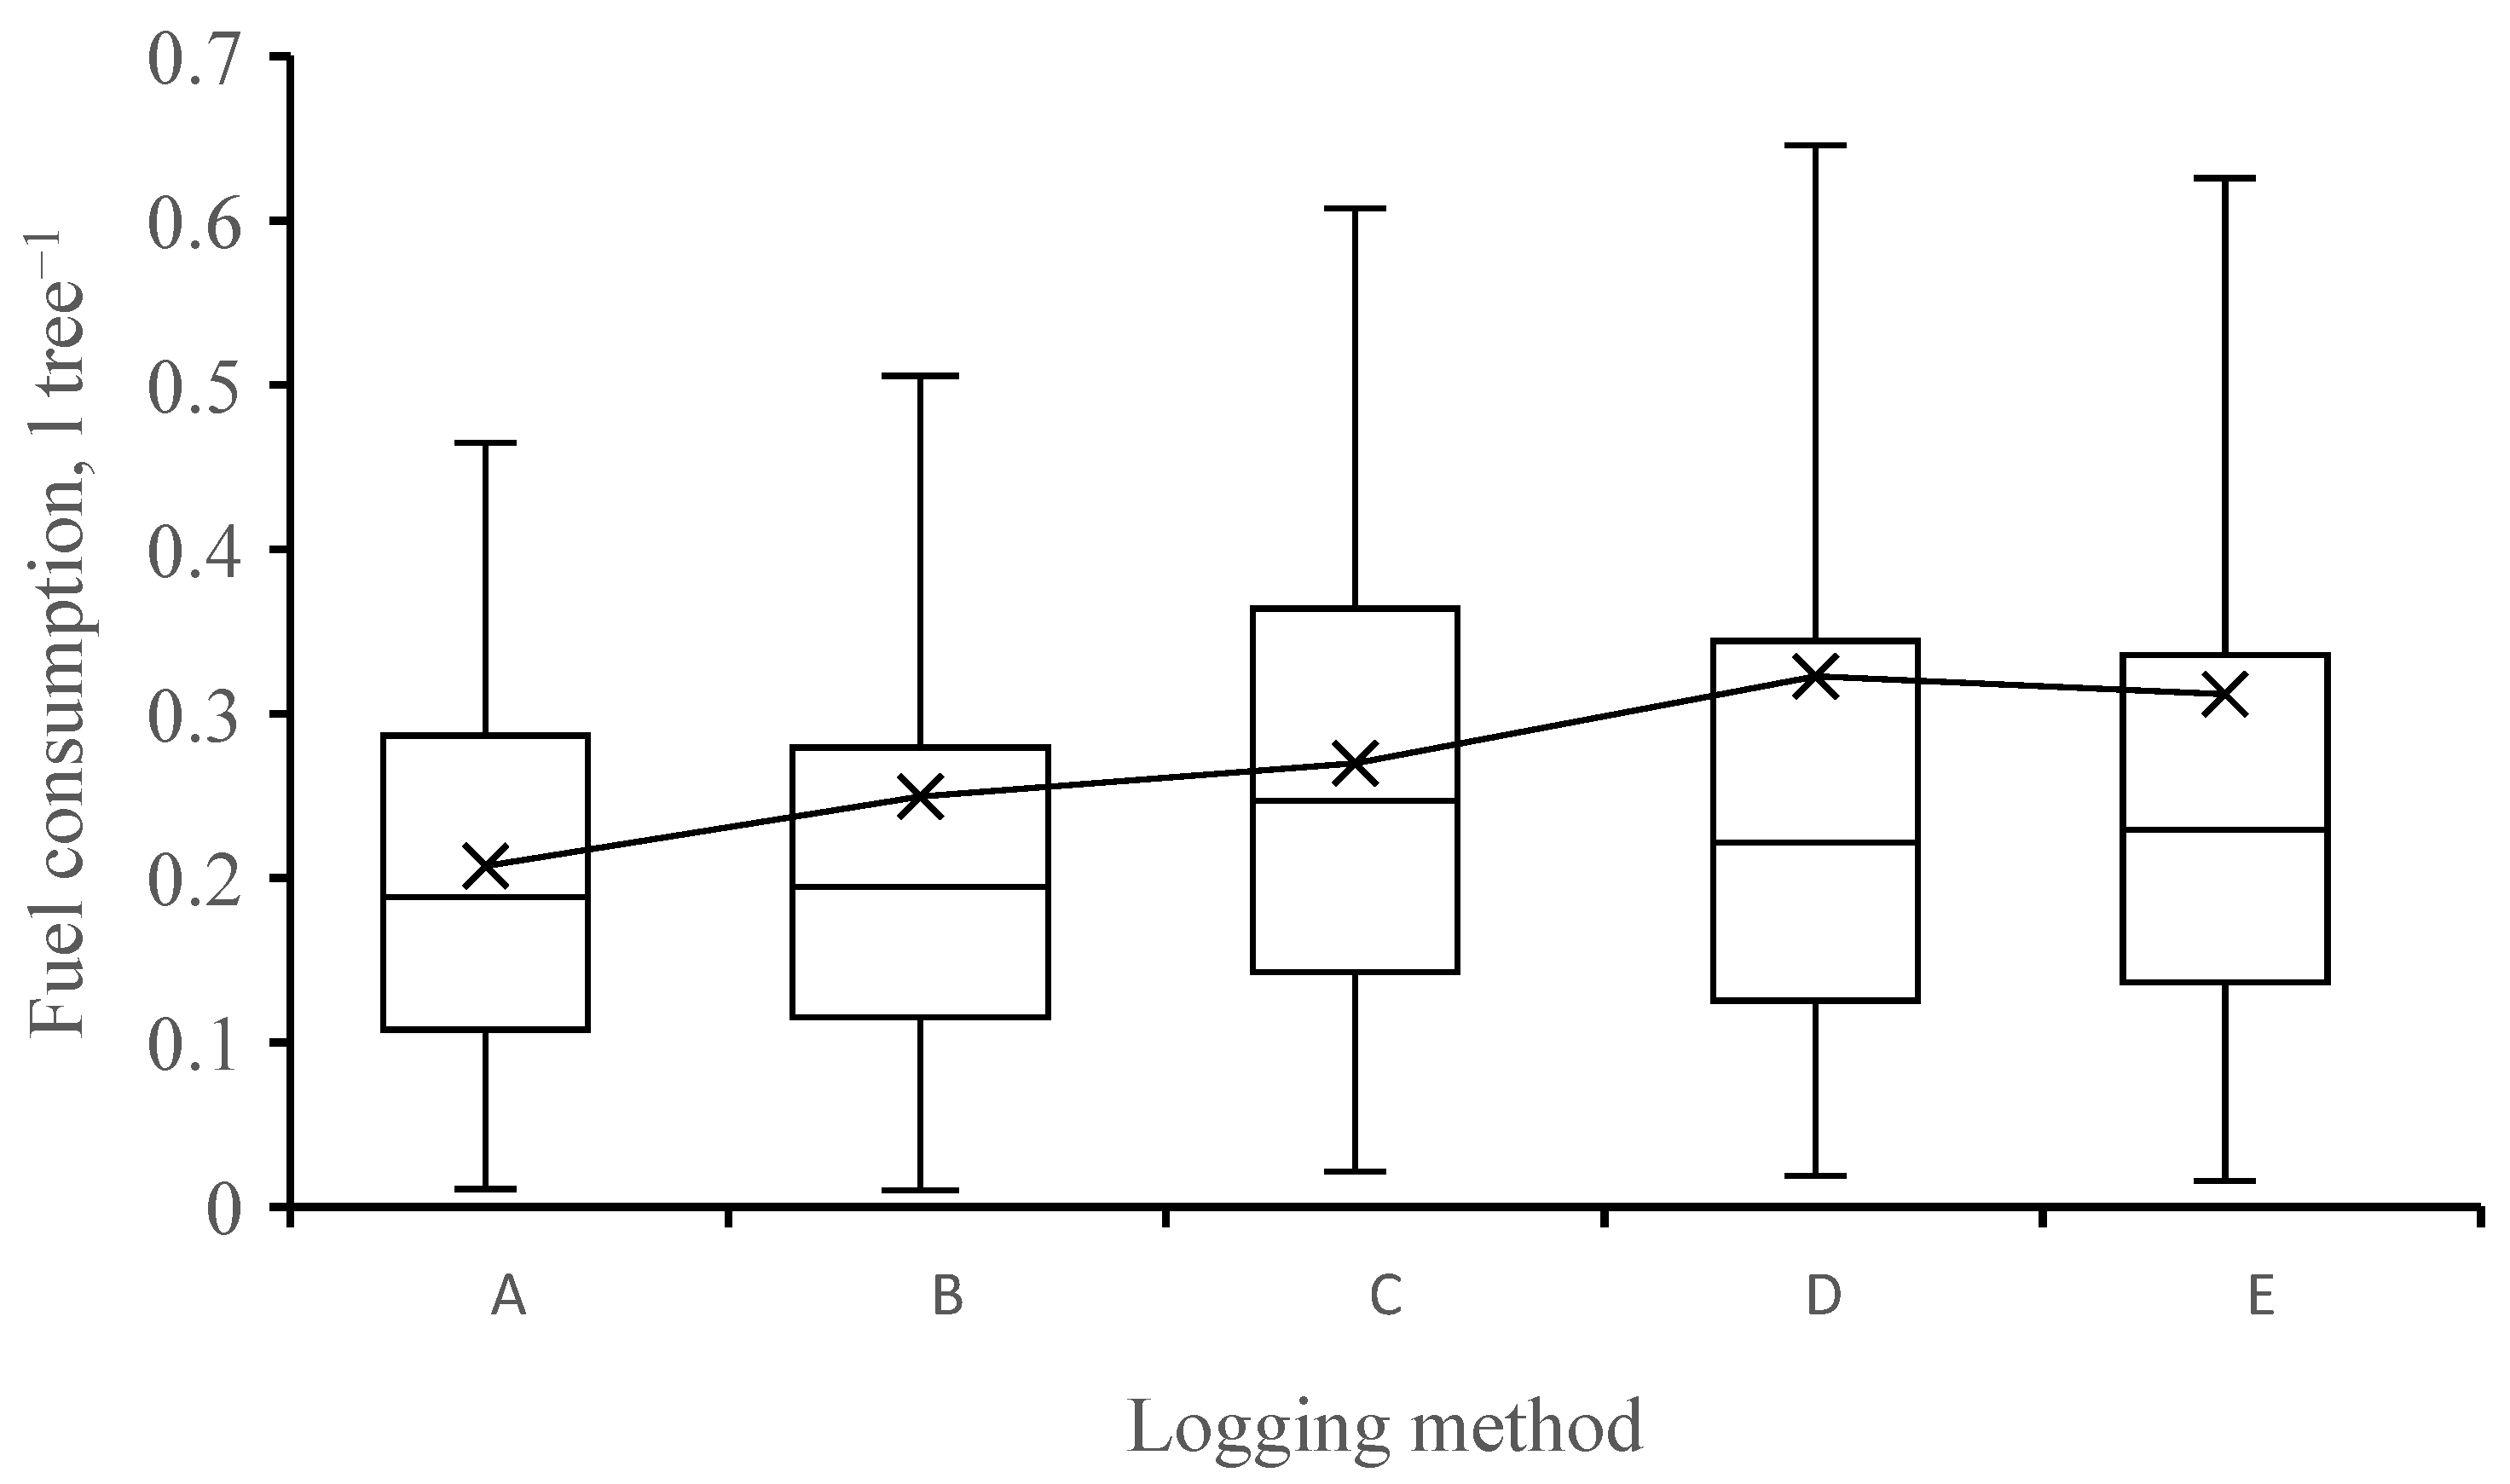
4.2. Fuel Consumption of the Logging Methods

The cubic-meter-based average fuel consumption varied between 0.5 and 0.8 L m−3, which depended on the logging method, the tree species, the operator, and the terrain (flat or sloping). Other harvesting conditions were controlled for the experiments in this study. The experimental conditions were therefore all approximately the same (Table 1). The average fuel consumption measured in previous studies of cut-to-length timber harvesting has been in the same range [14,16,17], although some studies have reported higher consumption, e.g., 0.88 L m−3 [19,20]. The average results of this study also support previous conclusions made that wheel harvesters’ fuel consumption is significantly lower than that of excavator-based harvesters [12,15]. Therefore, a wheel harvester should be selected as a fuel-efficient machine for timber harvesting of tree plantations.
This study used an automatic digital monitoring system [20,21]. Therefore, the calculation of the exact fuel consumption per cubic meter could be based on the fuel consumption (L), the effective working time (E0h) and harvester output (m3) at a single tree level. These elements also provided accurate data on hourly fuel consumption, which was not applied in previous studies. For example, Kärhä et al. [16] modeled the hourly fuel consumption from follow-up data, and the explanation rate was low (R2 = 0.17). The calculations used in this study show that logging method designs with different felling techniques significantly affect the harvester–operator system’s fuel consumption. On flat terrain, this was on average about 22% lower when using the felling technique F1 instead of F3 (Figure 4). The calculations and the Mann–Whitney U test (Table 5) provide new information about the efficiencies of different felling techniques, which were the opposite of the results from Ovaskainen [29], who found that fuel consumption with F3 was 7%–12% lower compared to those for the other logging methods. It is necessary to consider the above-mentioned calculation factors more precisely before drawing absolute conclusions. Moreover, it should be remembered that logging method C with felling technique F3 was a novel technique when applied in this Brazilian study, which may require a longer training period.
For fuel-wasting logging method C, the variation in fuel consumption was larger (5.5–84.5 L E0h−1) than that using fuel-saving method A (1.3–62.3 L E0h−1). The results indicate a variation in fuel consumption between operator felling techniques (F3 and F1) and also highlight the great potential of operator training to reduce fuel consumption on flat terrain. Previously, the harvesting conditions, such as the removed tree size, the hectare-based removal amount, and thinning or final felling, have been found to have the greatest effects (75%) on harvester fuel consumption [20]. While the results of this study also showed that harvesting conditions (flat vs. sloping terrain) most significantly influenced hourly fuel consumption (28.1%), a large variation (22.7%) between logging methods was identified, and, furthermore, the observations were skewed. On sloping terrain, this was more remarkable than on flat terrain (Figure 4). Therefore, sloping terrain conditions may require special training instructions for efficient logging operations in tree plantations.

4.3. Modeling of Fuel Consumption

Currently, more diesel is consumed per hour than two decades ago, while the productivity of logging work has increased significantly [20]. Therefore, we modeled hourly fuel consumption as the dependent variable in our precision modeling. Because up to 53% of the fuel consumed during timber harvesting is consumed during the tree logging cycle [16], we paid special attention to operators’ performance in the work phases of the logging cycle at the tree level in order to control hourly fuel consumption. In this study, the share of consumed fuel was 89.9% with our experimental timber harvesting conditions and based on accurate measurements using the digital monitoring system.
Above, we introduced the low explanatory rate (R2 = 0.17) found for our hourly fuel consumption model based on follow-up data. When comparing hourly fuel consumption modeling in previous studies with the results of this study, it was observed that the engine power and machine hours formed the significant influencing factors in previous studies, instead of the work phases of the logging method, when modeling fuel consumption [8,9,16] These differing results can be explained by follow-up studies’ failure to provide accurate data, allowing for a causality analysis between the selected influencing factors and hourly fuel consumption for the logging method design, although a lot of data are collected from harvesters. Furthermore, huge amounts of observations may allow for conclusions based on small differences in descriptive variables because they become statistically significant. For these reasons, previous studies have regarded logging methods quite generally, e.g., as thinning, final felling, etc.
In this study, it was hypothesized that tree size, stem processing speed, tree stem length, and tree logging cycle process time would be important factors in predicting the harvester–operator system’s fuel consumption when comparing logging methods. After a careful analysis (Figure 5, Figure 6, Figure 7 and Figure 8 and Table 6), tree length, stem processing speed, and effective hours of tree logging cycle processes were selected as the explanatory variables for regression modeling of fuel consumption (Table 7). The multilinear regression model performed quite well (R2 = 0.703). If fuel consumption increased by 1 L, then the average tree length increased by 1.289 m, stem processing speed decreased by 1.052 m h−1, and time increased by 0.430 E0h. The statistical significance values of these variables were 0.045, 0.059, and 0.079, respectively. These results show that it is important to focus on increasing the processing speed by implementing operator training. They also demonstrate that this precision model can be used to test the environmental efficiencies of different logging methods in harvesting conditions for this kind of study. Moreover, they highlight that the effects of felling techniques on the harvester–operator system’s fuel consumption should be an important subject of further research. In different conditions, e.g., in Nordic harvesting conditions, the same model structure can be applied, but it may be necessary to determine suitable parameters for the regression models based on the local harvesting conditions after experimental data collection for each of the logging methods.

4.4. Improving Environmental Efficiency

To improve the environmental efficiency of timber harvesting, investments in operator training are needed in Brazil. Kärhä et al. [16] reported in Finland that 60% of harvester operators had participated in energy efficiency training, although cut-to-length methods had been used for over four decades and the share of these methods was almost 100%. The situation in Brazil is not as advanced, and there is great potential to improve environmental efficiency by training operators to perform efficient work phases in their logging methods [11]. Harvester operators’ assistant systems and digital monitoring applications could also support them to work more efficiently [21].
Furthermore, there are technical possibilities for enhancing harvester-operator systems’ environmental efficiency. If care is taken with each harvester’s maintenance, operational setup, and adjustments, this can reduce fuel consumption [13]. Before this experimental study, the harvester machine was serviced and its setup optimized; in large follow-up fuel consumption studies, these factors vary more and influence the results for several harvesters. Furthermore, fuel consumption can be reduced and environmental efficiency enhanced by suitably equipping a harvester for the harvesting conditions [16], which can be challenging. In this study, for instance, we applied a harvester traction assistant when timber harvesting on sloping terrain.

5. Conclusions

This study presents logging methods’ design under Brazilian harvesting conditions. A harvester–operator system’s fuel consumption was analyzed on flat and sloping terrain in Eucalyptus and pine tree plantations. The influencing factors were modeled, and we determined which had the greatest combined impact on fuel consumption in the tree logging cycle processes. We hypothesized that tree size, stem processing speed, tree stem length, and effective hours of the tree logging cycle process were important factors, and so these were the subjects of our investigation. We found large variations in fuel consumption between logging methods with different felling techniques. Precision modeling explained 70% of this variation. It was revealed that tree size should be left out of the most efficient model. We also noted the effect of the operator, which leads us to recommend that operators must be educated on environmentally efficient work. Furthermore, fuel efficiency could be improved with an advanced logging method design developed by utilizing a precision model, which will improve energy efficiency and lower the carbon footprint in the future, supporting national environmental goals. We recommend applying precision modeling when developing the harvester operators’ working techniques and performing environmental efficiency comparisons of logging methods in different timber harvesting conditions.

Funding

This research received funding from University of Eastern Finland.

Data Availability Statement

Data are unavailable due to privacy restrictions.

Conflicts of Interest

The author declares no conflicts of interest.

References

  1. Palander, T. Outsourcing Issues of Wood Supply Chain Management in the Forest Industry. For. Sci. 2022, 68, 521–532. [Google Scholar] [CrossRef]
  2. Purfürst, T.; Erler, J. The Human Influence on Productivity in Harvester Operations. Int. J. For. Eng. 2011, 22, 15–22. [Google Scholar] [CrossRef]
  3. Palander, T.; Ovaskainen, H.; Tikkanen, L. An Adaptive Work Study Method for Identifying the Human Factors that Influence the Performance of a Human-Machine System. For. Sci. 2012, 58, 377–389. [Google Scholar] [CrossRef]
  4. Ovaskainen, H. Timber harvester operators’ working technique in first thinning and the importance of cognitive abilities on work productivity. Diss. For. 2009, 79, 62. [Google Scholar] [CrossRef]
  5. Ovaskainen, H.; Uusitalo, J.; Sassi, T. Effect of edge trees on harvester positioning in thinning. For. Sci. 2006, 52, 659–669. [Google Scholar] [CrossRef]
  6. Niebel, B. Motion and Time Study; Richard d Irwin: Homewood, IL, USA, 1993. [Google Scholar]
  7. Rieppo, K.; Örn, J. Measuring the Fuel Consumption of Forest Machines. Preliminary Study; Report 148; Metsäteho: Vantaa, Finland, 2003. [Google Scholar]
  8. Holzleitner, F.; Stampfer, K.; Visser, R. Utilization rates and cost factors in timber harvesting based on long-term machine data. Croat. J. For. Eng. 2011, 32, 501–508. [Google Scholar]
  9. Brunberg, T. Fuel Consumption in Forest Machines in 2012; Skogforsk: Uppsala, Sweden, 2013. [Google Scholar]
  10. Kenney, J.; Galagher, T.; Smidt, M.; Mitchel, D.; McDonald, T. Factors that affect fuel consumption in logging systems. In Proceeding of the Conference of the 37th Council on Forest Engineering (COFE) Annual Meeting, Moline, IL, USA, 22–25 June 2014. [Google Scholar]
  11. Ghaffariyan, M.R.; Apolit, R.; Kuehmaier, M. A short review of fuel consumption rates of whole tree and cut-to-length timber harvesting methods. Curr. Investig. Agri. Curr. Res. 2018, 5, 651–653. [Google Scholar] [CrossRef]
  12. Magagnotti, N.; Pari, L.; Spinelli, R. Use, utilization, productivity and fuel consumption of purpose-built and excavator-based harvesters and processors in Italy. Forests 2017, 8, 485. [Google Scholar] [CrossRef]
  13. Prinz, R.; Spinelli, R.; Magagnotti, N.; Routa, J.; Asikainen, A. Modifying the settings of CTL timber harvesting machines to reduce fuel consumption and CO2 emissions. J. Clean. Prod. 2018, 197, 208–217. [Google Scholar] [CrossRef]
  14. Jylhä, P.; Jounela, P.; Koistinen, M.; Korpunen, H. Mechanized Cutting: Follow-Up Study; Natural Resources and Bioeconomy Studies 11; Natural Resources Institute: Helsinki, Finland, 2019. [Google Scholar]
  15. Spinelli, R.; de Arruda Moura, A.C. Decreasing the Fuel Consumption and CO2 Emissions of Excavator-Based Harvesters with a Machine Control System. Forests 2019, 10, 43. [Google Scholar] [CrossRef]
  16. Kärhä, K.; Haavikko, H.; Kääriäinen, H.; Palander, T.; Eliasson, L.; Roininen, K. Fossil-fuel consumption and CO2eq emissions of cut-to-length industrial roundwood logging operations in Finland. Eur. J. For. Res. 2023, 142, 547–563. [Google Scholar] [CrossRef]
  17. Ackerman, P.; Williams, C.; Ackerman, S.; Nati, C. Diesel Consumption and Carbon Balance in South African Pine Clear-Felling CTL Operations: A Preliminary Case Study. Croat. J. For. Eng. 2017, 38, 65–72. [Google Scholar]
  18. Klvac, R.; Skoupy, A. Characteristic fuel consumption and exhaust emissions in fully mechanized logging operations. J. For. Res. 2009, 14, 328–334. [Google Scholar] [CrossRef]
  19. Lijewski, P.; Merkisz, J.; Fuć, P.; Ziółkowski, A.; Rymaniak, Ł.; Kusiak, W. Fuel consumption and exhaust emissions in the process of mechanized timber extraction and transport. Eur. J. For. Res. 2017, 136, 153–160. [Google Scholar] [CrossRef]
  20. Eliasson, L. New Method for Estimating Fuel Consumption in Logging Operations. Skogforsk, Kunskap 4. 2022. Available online: https://www.skogforsk.se/kunskap/kunskapsbanken/2022/ny-metod-for-skattning-av-bransleforbrukning-vid-drivningsarbete (accessed on 10 January 2025).
  21. Tikkanen, L.; Ovaskainen, H.; Palander, T.; Vesa, L. TimberLink as a tool for measuring the fuel consumption of a harvester. In The Nordic-Baltic Conference on Forest Operations; Suadicani, K., Ed.; Forest & Landscape Denmark University of Copenhagen Hørsholm Kongevej: Copenhagen, Denmark, 2008; pp. 70–71. [Google Scholar]
  22. Olivera, A.; Visser, R.; Acuna, M.; Morgenroth, J. Automatic GNSS-enabled harvester data collection as a tool to evaluate factors affecting harvester productivity in a Eucalyptus spp. harvesting operation in Uruguay. Int. J. For. Eng. 2016, 27, 15–28. [Google Scholar] [CrossRef]
  23. Palander, T.; Nuutinen, Y.; Kariniemi, A.; Väätäinen, K. Automatic time study method for recording work phase times of timber harvesting. For. Sci. 2013, 59, 472–483. [Google Scholar] [CrossRef]
  24. Hollander, M.; Wolfe, D.A. Nonparametric Statistical Methods; John Wiley and Sons: New York, NY, USA, 1973. [Google Scholar]
  25. Schober, P.; Boer, C.; Schwarte, L. Correlation Coefficients: Appropriate Use and Interpretation. Anesth. Analg. 2018, 126, 1763–1768. [Google Scholar] [CrossRef] [PubMed]
  26. Heikkilä, T. Statistical Research, 3rd ed.; Oy Edita Ab: Helsinki, Finland, 2001. [Google Scholar]
  27. Henley, S.; Golden, R.; Kashner, T. Statistical modeling methods: Challenges and strategies. Biostat. Epidemiol. 2020, 4, 105–139. [Google Scholar] [CrossRef]
  28. SPSS Inc. Version 28. SPSS-X User’s Guide, 3rd ed.; SPSS Inc.: Chicago, IL, USA, 1988. [Google Scholar]
  29. Ovaskainen, H. Work Models in Mechanized Logging. Metsäteho, Finland, Report 22. 2012. Available online: https://metsateho.fi/wp-content/uploads/2015/02/Raportti_221_Ty%C3%B6mallit_koneellisessa_puunkorjuussa_ho.pdf (accessed on 10 January 2025).
Figure 1. Factors affecting fuel consumption of the human–machine system in timber harvesting.
Forests 16 00294 g001
Figure 2. Study outline of three felling techniques, F1, F2, and F3, with five logging methods, A, B, C, D, and E, to compare them on flat and sloped terrains. Pt = pine (Pinus spp.), Es = Eucalyptus (Eucalyptus spp.), O1 = operator 1, O2 = operator 2.
Forests 16 00294 g002
Figure 3. Work phases of the harvester–operator system described as time study cycles for collecting time consumption data of logging methods.
Forests 16 00294 g003
Figure 4. Average values of fuel consumption of the harvester–operator system by logging methods during the logging cycle process at the tree level. × = mathematical average, box line = median, A = sideways logging at the edge of the logging front, B = sideways logging inside of the logging front, C = forward logging in the middle of the logging front, D = sideways logging at the edge of the logging front with traction assistance on sloping terrain, E = sideways logging inside of the logging front with traction assistance on sloping terrain.
Forests 16 00294 g004
Figure 5. Effect of trees’ size (m3) on fuel consumption of harvester–operator systems during trees’ logging cycle process. Red points depict pine species and blue points depict Eucalyptus species.
Forests 16 00294 g005
Figure 6. Effect of the effective working time (E0h) on fuel consumption of harvester–operator systems during trees’ logging cycle process. Red points depict pine species and blue points depict Eucalyptus species.
Forests 16 00294 g006
Figure 7. Effect of stem length (m) on fuel consumption of harvester–operator systems during trees’ logging cycle process. Red points depict pine species and blue points depict Eucalyptus species.
Forests 16 00294 g007
Figure 8. Effect of stems’ processing speed (m h−1) on fuel consumption of harvester–operator systems during trees’ logging cycle process. Red points depict pine species and blue points depict Eucalyptus species.
Forests 16 00294 g008
Table 1. Characteristics of the four study stands.
Characteristic1234
The main tree speciesEucalyptus salignaPinus taedaEucalyptus salignaPinus taeda
Slope of terrain, %17.522.57.57.5
Age of trees, years7777
Planting geometry, m × m3.0 × 2.03.5 × 2.03.0 × 2.03.5 × 2.0
Trees’ number per ha1650135016501350
Diameter at d1.3, mm184205178210
Stems’ length, m21.313.322.115.1
Trees’ size, m30.4160.3150.3860.366
Table 2. Average characteristics of stems processed by the harvester–operator system. 1, 2, 3, 4 = study stands, F = flat terrain, S = sloped terrain, Es = Eucalyptus, Ps = pine, A = sideways logging at the edge of the logging front (F1) on flat terrain, B = sideways logging inside of the logging front (F2) on flat terrain, C = forward logging in the middle of the logging front (F3) on flat terrain, D = sideways logging at the edge of the logging front (F1) with traction assistance on sloping terrain, E = sideways logging inside of the logging front (F2) with traction assistance on sloping terrain, O1 = operator of Klabin, O2 = operator of Ponsse. The effective hours (E0h) do not include work breaks.
StandTerrainSpeciesFelling
Technique
Logging
Method
OperatorStem Size
m3
Stem Length
m
Work Time
E0h
Stem Speed
m h−1
Productivity
m3 E0h−1
1SEsF1DO10.3520.410.007342776.2043.87
1SEsF1DO20.4022.770.006793442.7956.62
1SEsF2EO10.3922.820.007303138.7451.46
1SEsF2EO20.4022.850.006853391.8154.50
2SPsF1DO10.3414.590.006542272.7750.85
2SPsF1DO20.3715.510.006382462.9854.19
2SPsF2EO10.3816.030.006242402.6054.84
2SPsF2EO20.3715.300.006382487.7358.12
3FEsF1AO10.4120.690.006752980.4755.73
3FEsF1AO20.4121.380.006033569.7865.49
3FEsF2BO10.3920.740.006183251.9458.83
3FEsF2BO20.4221.990.006033346.3563.51
3FEsF3CO10.4422.790.006723265.0759.69
3FEsF3CO20.4322.080.006403454.0963.29
4FPsF1AO20.2912.550.004941887.9349.67
4FPsF2BO20.2912.570.005532409.1652.94
4FPsF3CO20.3514.520.006312327.6351.69
Table 3. Average fuel consumption of the harvester–operator system during the logging cycle process of the tree during sloped terrain experiments. Es = Eucalyptus, Ps = pine, D = sideways logging at the edge of the logging front with traction assistance on sloping terrain, E = sideways logging inside of the logging front with traction assistance on sloping terrain, O1 = operator of Klabin, O2 = operator of Ponsse.
StandSpeciesFelling
Technique
Logging
Method
OperatorFuel
Consumption
(L Tree−1)
Fuel
Consumption
(L E0h−1)
Fuel
Consumption
(L m−3)
Fuel
Consumption
(L m−1)
1EsF1DO10.280035.100.80.0137
1EsF1DO20.240033.970.60.0105
1EsF2EO10.312041.170.80.0137
1EsF2EO20.240032.700.60.0105
2PsF1DO10.238035.600.70.0163
2PsF1DO20.222032.520.60.0143
2PsF2EO10.228032.900.60.0142
2PsF2EO20.222034.870.60.0145
Table 4. Average fuel consumption of the harvester–operator system during the logging cycle process of the tree during flat terrain experiments. Es = Eucalyptus, Ps = pine, A = sideways logging at the edge of the logging front on flat terrain, B = sideways logging inside of the logging front on flat terrain, C = forward logging in the middle of the logging front on flat terrain, O1 = operator of Klabin, O2 = operator of Ponsse.
StandSpeciesFelling
Technique
Logging
Method
OperatorFuel
Consumption
(L Tree−1)
Fuel
Consumption
(L E0h−1)
Fuel
Consumption
(L m−3)
Fuel
Consumption
(L m−1)
3EsF1AO10.205027.870.50.0099
3EsF1AO20.205032.750.50.0096
3EsF2BO10.234035.300.60.0113
3EsF2BO20.210031.760.50.0095
3EsF3CO10.264035.810.60.0116
3EsF3CO20.258037.970.60.0117
4PsF1AO20.203034.770.70.0162
4PsF2BO20.174031.760.60.0138
4PsF3CO20.210031.010.60.0145
Table 5. Comparison of logging methods (Mann–Whitney U–test) with respect to fuel consumption of the harvester–operator system during the logging cycle process of stems. A = sideways logging at the edge of the logging front on flat terrain, B = sideways logging inside of the logging front on flat terrain, C = forward logging in the middle of the logging front on flat terrain, D = sideways logging at the edge of the logging front with traction assistance on sloping terrain, E = sideways logging inside of the logging front with traction assistance on sloping terrain.
MethodsTest StatisticStd. ErrorStd. Test StatisticSignificance
A–B−40.52044.214−0.9160.359
A–D−175.03441.709−4.197<0.001
A–E−205.11341.727−4.916<0.001
A–C−25104244.631−5.625<0.001
B–D−134.51441.830−3.2160.001
B–E−164.59341.848−3.933<0.001
B–C−210.52244.744−4.705<0.001
D–E−30.07839.192−0.7670.443
D–C76.00842.2701.7980.072
E–C45.92942.2891.0860.277
Table 6. Correlation matrix, where continuous variables of tree characteristics and hour-based variables of the logging cycle process of trees are compared with each other as potential regression variables of fuel consumption of the harvester–operator system (bold correlations depict regression variables). S = tree size (m3), L = stem length (m), T = time consumption of logging cycle process of tree (E0h), P = processing speed of stem (m h−1), F = fuel consumption during logging cycle process of trees (L).
VariablesSLTPF
Correlation, rs
S1.0000.851 **0.505 *0.836 **0.387
L0.851 **1.0000.618 *0.937 **0.569 *
T0.505 *0.618 *1.0000.4350.769 **
P0.836 **0.937 **0.4351.0000.344
F0.3870.569 *0.769 **0.3441.000
*, ** = Statistical significance levels <0.05 and <0.001, respectively.
Table 7. The linear regression model for fuel consumption (L) of the harvester–operator system during the logging cycle process of trees. β 0 = constant term, β 1 = regression parameter for time consumption of tree’s logging cycle process (E0h), β 2 = regression parameter for processing speed of the stem (m h−1), β 3 = regression parameter for stem length (m).
Number of TreesParameterEstimatet-Valuep-ValueR2
2130 β 0 0.8690.4010.703 **
β 1 0.4301.9080.079
β 2 −1.052−2.0680.059
β 3 1.2892.2150.045 *
*, ** = Statistical significance levels <0.05 and <0.001, respectively.
Disclaimer/Publisher’s Note: The statements, opinions and data contained in all publications are solely those of the individual author(s) and contributor(s) and not of MDPI and/or the editor(s). MDPI and/or the editor(s) disclaim responsibility for any injury to people or property resulting from any ideas, methods, instructions or products referred to in the content.

