Article

Analysis of Wood Density to Compare the Amount of Accumulated Carbon Dioxide in the Stems of Selected Non-Native Tree Species in Poland

Department of Forest Utilization and Forest Techniques, Faculty of Forestry, University of Agriculture in Krakow, al. 29 Listopada 46, 31-425 Kraków, Poland
Forests 2025, 16(2), 223; https://doi.org/10.3390/f16020223
Submission received: 30 December 2024 / Revised: 16 January 2025 / Accepted: 20 January 2025 / Published: 24 January 2025

Abstract

:
One of the priorities in European policy is the greater use of wood. In this context, it is important to know the total amount of CO2 absorbed by the tree and accumulated in the wood. In the timber industry, butt logs are mainly processed. The aim of this study is to analyze diameter at breast height (DBH), wood density (WD), and the amount of CO2 in grand fir (GF), Douglas fir (DF), northern red oak (NRO), and black locust (BL) wood. The DBH and bark thickness were measured, and cores were taken to study WD and calculate the amount of CO2. Analyses were conducted in three age classes of trees. It was found that in the youngest age class, DF had a significantly larger DBH compared to NRO and BL, and GF had a significantly larger DBH compared to NRO. The wood density of coniferous species was significantly lower compared to broadleaved species. DF absorbed the most CO2. In Class III, DF had significantly larger DBH and significantly lower wood density compared to NRO and BL. DF absorbed significantly more CO2 compared to NRO. In Classes IV and V, DF had larger DBH compared to NRO and lower wood density. The amount of CO2 absorbed by both species was similar. Taking into account the amount of absorbed CO2, the durability of the wood, and aspects related to sustainable forest management of the four studied non-native tree species, Douglas fir seems to be the best choice for cultivation in Polish forests.

1. Introduction

It is estimated that almost 50 alien tree species occur in Poland, and the total area colonized by these species in Polish forests is about 5% [1,2,3]. The most abundant species are northern red oak (Quercus rubra L.), black locust (Robinia pseudoacacia L.), and Douglas fir (Pseudotsuga menziesii Franco). Nationwide, foreign tree species are rare, and their wood is often sold together with that of native species (e.g., Douglas fir with larch, red oak with sessile oak). However, the share of these species is steadily increasing [4]. Therefore, it can be assumed that their share in Polish forests will increase in the future. One of the European Commission’s seven priorities, set for 2024–2029, is the “New Plan for Sustainable Prosperity in Europe and European Competitiveness”, one of the goals of which is the “New Pact for Clean Industry”, which aims, among other things, to reduce emissions by 90% by 2040 [5]. One of the more carbon-intensive sectors of the economy is construction, which accounts for about 37% of global emissions. Concrete and steel, which are the most commonly used construction materials, have some of the highest carbon emission rates. One solution to this problem is to make greater use of wood. Over the life cycle of a wooden building, the carbon footprint is 25% lower compared to a building made using concrete and steel [6]. As trees grow, they absorb CO2 and build the carbon into wood. Once trees are cut down, their wood can be used in a variety of ways. Treating the wood as a fuel will release CO2 into the atmosphere due to the combustion process, while leaving it unprotected in variable moisture conditions in the open air will produce CO2 by fungi and insects, for which the wood tissue provides food. In view of the possibility of reducing the concentration of CO2 in the atmosphere, it is optimal to make products from as much of the harvested wood as possible, which will perform useful functions for as long a time as possible. In this context, it is crucial to know the total amount of CO2 absorbed by the tree and accumulated as organic carbon in the wood. Previous studies indicate that in most species, the rate of biomass growth, and therefore, the amount of organic carbon sequestered, increases with tree age [7]. However, analyses of the amount of CO2 absorbed and stored as organic carbon tend to be estimates based on mathematical models [8,9]. An accurate estimate of the amount of carbon accumulated in biomass depends primarily on the plant species [10].
It follows from the above that different tree species will absorb different amounts of CO2 to produce wood. The main differentiating factor will be the amount of dry-wood mass per unit volume expressed through wood density [11].
The aim of this publication is to study the wood density and diameter at breast height of selected non-native tree species growing in Polish forests for comparison of the amount of accumulated CO2 in the lower parts of their stems.
It was hypothesized that the amount of CO2 absorbed by these species would vary, and the analyses were designed to identify the species with the greatest potential to accumulate CO2 in wood.

2. Materials and Methods

The study was conducted on 15 research plots located in stands in southern Poland. The wood of four North American tree species was studied: grand fir (Abies grandis Lindl.) (GF), Douglas fir (DF), northern red oak (NRO), and black locust (BL). Analyses were carried out in 4 age classes of trees, the median values of which were 30, 50, 70, and 90 years. Since non-native tree species in Polish forests account for a small share [4], the main criterion for selecting test plots here was the presence of at least 15 trees of a given species in the species composition of the stand. If the description of the stand’s species composition included information that a non-native species was present—at least in places—it was assumed that there would be a sufficient number of trees. This thesis was verified in the field. The second criterion for the selection of sample plots was the age of the trees of a given alien species, which could not be less than 30 years old.
Selected characteristics of the stands in which the test plots were established are summarized in Table 1.
Four research plots each fell into the following species: GF, DF, and NRO. In the case of BL, there were three study plots.

2.1. Field Work

In each sample plot, the DBH of all trees of the species under study was measured in the N–S direction using a caliper gauge with an accuracy of 1 mm. Then, using Draudt’s method, 15 to 30 sample trees were selected (depending on the number of trees of non-native species in the study plot) in proportion to the number of all trees of non-native species in the DBH intervals. Using a bark gauge with an accuracy of 1 mm, the bark thickness of each sample tree was measured in the N and S directions. Using a Pressler drill, one core was taken from each tree at a height of 1.3 m above the ground on the north side of the trunk, using a minimally invasive method that minimally disturbs the tissues of the living organism.

2.2. Laboratory Work

Each core was placed in a special holder, and a sharp knife was used to cut a layer of wood about 1 mm thick perpendicular to the grain to obtain a cross-section. The cores prepared in this way were scanned with a resolution of 1200 dpi on an Epson model Expression 12000 XL scanner (EPSON EURO B.V., Amsterdam, The Netherlands). The widths of the annual rings were measured to the nearest 0.01 mm on the electronic images obtained [12,13,14]. The measurement was made from the bark to the pith. The core was then divided into sections of 5 annual increments each, starting from the perimeter. The last section, closest to the core, usually contained less than 5 increments. For the obtained sections, the basic wood density (BWD), which is the quotient of the weight of the wood absolutely dry and its volume in the state of maximum swelling, was determined. The wood was first dried to absolute dryness in a POL-EKO model SLW 400 STD (POL-EKO-APARATURA SP.J., Wodzisław Śl., Poland) dryer and weighed on a RADWAG model WPS 210/C (RADWAG wagi elektroniczne, Radom, Poland) scale with an accuracy of 0.001 g. The wood was then placed in tubes of water until it sank spontaneously, after which the volume of the section was measured by the hydrostatic method [15], again using the above scale.

2.3. Calculation Work

The BWD of the tree breast height was calculated as the average of the BWD of the individual core sections, weighted by their share in the cross-sectional area of the stem [16]. This cross-sectional area was calculated as the area of a circle whose diameter was the barkless diameter at breast height (BDBH). It was calculated by subtracting the bark thickness in the N and S directions from the DBH. The resulting BWD was converted to the oven-dry wood density (ODWD) according to Formula (1) [17]:
ODWD = B W D 1 ( α 100 )   [ kg · m 3 ]
α—volumetric shrinkage [%]
The following α values were assumed for the studied species [18]: GF—10.4%, DF—11.6%, NRO—13.7%, BL—10.2%. The volume of butt log (VBL) was then counted. In this study, a 2 m long log was assumed for comparison. If it is assumed that a stump of about 30 cm in height will remain after a tree is felled, the calculated BDBH value will be the center diameter for a 2 m long log. The VBL was, therefore, calculated using the midsection Formula (2):
V B L = π · ( B D B H ) 2 4000 · 2   [ m 3 ]
Next, the mass of the absolutely dry wood [kg] of the butt log was calculated as the product of VBL and ODWD. The next step of the work was to calculate the organic carbon content of the butt log wood. It was assumed that this element accounts for about 50% of the dry mass of the wood [17], but these values may actually vary slightly by 1%–3% [19]. Based on the calculated mass of carbon, the mass of CO2 absorbed was estimated. Burning 1 kg of pure carbon yields 3.66 kg of CO2, so to accumulate 1 kg of pure carbon in the wood, the tree must absorb 3.66 kg of CO2. Comparative analyses were conducted in 4 age classes, according to the following division: Class II—trees aged 21 to 40 years (mean 30 years), Class III—41–60 years (mean 50 years), Class IV—61–80 years (mean 70 years), and Class V—81–100 years (mean 90 years). The GF trees studied were the youngest trees. Since their planting was documented, their age is consistent with the data in the stand descriptions. In two sample plots (1 and 2), the GF trees were 30 years old; in the other two (3 and 4), they were 35 years old. In order to standardize the data for GF for all trees considered in the analyses, the studied traits for age 30 were calculated for each sample tree from study plots 3 and 4. The BDBH for age 30 was calculated by subtracting from the BDBH for age 35 the double length of the 1st section covering the youngest 5 annual rings. When calculating wood density, the data of this trait for the youngest section were not included, and the shares of the other sections were recalculated, taking into account the cross-sectional area calculated from the BDBH for age 30. For the remaining tree species, there was no certainty about the age of all sample trees. Therefore, the age of each sample tree was determined by adding to the total number of annual rings in the core a constant (different for each species) number of years it takes on average for a young tree of a given species to grow to a height of 1.3 m. In the case of DF, 6 years were added, and for NRO and BL, 4 years [20,21]. On this basis, the age class membership of each tree was determined.
As previously mentioned, comparative analyses of BDBH, ODWD, and the amount of CO2 absorbed by the butt logs were conducted in 4 age classes. In the youngest age, Class II, comparative analyses were carried out for all sample trees, except that the data for trees of older age classes were converted for the mean of this class, i.e., for an age of 30 years. BDBH was calculated by subtracting double the summed width of the corresponding number of annual rings produced after the tree’s 30th year, while for the purpose of calculating ODWD for age 30, sections produced after the tree’s 30th year were omitted, and the shares of the remaining sections in the cross-sectional area of the stem were recalculated, taking into account the area of this cross-section calculated on the basis of BDBH for 30 years. In the case of Class III, the obtained data of all trees from this class (trees aged 41–60 years) were considered for comparative analyses, while the analyzed characteristics of trees of older age classes were calculated similarly to the previous age class, with the exception that BDBH and ODWD were calculated for the mean age of Class III, i.e., for 50 years.
In the case of Class IV, the obtained data for all trees of this class (trees aged 61–80 years) were considered for comparative analyses, while the studied characteristics of trees of older age classes were calculated similarly to the previous two classes, calculating the values of these characteristics for the mean age of Class IV, i.e., for 70 years.
The oldest analyzed trees belonged to Class V. In comparative analyses, the characteristics obtained for sample trees aged 81 to 100 years were considered.
The analyzed data were summarized for each age class, and mean and coefficients of variation (CoV) were calculated.

2.4. Statistical Analysis

The following procedures were used in the statistical analyses [22]. The normality of the distributions of the data was assessed using the Shapiro–Wilk test. When the normality criterion of the distributions was met, the significance of differences between two groups of data was verified with the t-test (t-test), or when there were more groups of data compared, analysis of variance (ANOVA). When the distribution of at least one data point did not meet the criterion of normal distribution, the significance of differences was analyzed using non-parametric tests, respectively, the U-test (U-test) or the Kruskal–Wallis test (K-W test) and the multiple comparisons test (M-C test). A significance level of p = 0.05 was used in statistical analyses.

3. Results

A total of 339 trees were studied, including 119 GF, 75 DF, 104 NRO, and 41 BL.

3.1. Results of Analyses for Trees of Class II (30 Years)

Table 2 shows that at 30 years of age, conifer stems had a higher average BDBH. The average BDBH of DF stems was 22.6 cm, while GF trees had a lower average BDBH by 2 cm. For broadleaved species, the values for NRO were 18.2 cm and for BL, 18.0 cm. A smaller variation in this feature between sample plots occurred for DF (CoCoV = 6.2%) and BL (CoCoV = 8.0%), greater variation occurred for NRO (CoCoV = 12.7%), and the greatest for GF (CoV = 16.1%).
It was found that at 30 years of age, GF stems had significantly larger BDBH compared to NRO, while DF stems had significantly larger BDBH compared to both analyzed broadleaved species (Table 3, Figure 1).
A larger average ODWD was found in the stems of the studied broadleaved trees. For BL, it was 674.4 kg·m−3, while for NRO, it was 668.6 kg·m−3 (Table 2). Significantly lower values of the feature occurred in coniferous species. For DF, it amounted to 547.0 kg·m−3, and for GF, 392.0 kg·m−3. The variation of this feature between the sample plots was small; depending on the species, the coefficient of variation was from 2.3% (BL) to 6.5% (NRO). Statistical analysis showed that significantly higher ODWD was characteristic for wood of broadleaved species, i.e., NRO and BL, compared to both coniferous species—DF and GF (Table 4; Figure 2). No significant differences were found between the studied broadleaved species, while the ODWD of DF was found to be significantly higher compared to GF.
The highest average amount of absorbed CO2 in the wood of the butt logs of the four studied tree species at the age of 30 years was shown by DF—89.1 kg; slightly lower average values were shown by broadleaved species: NRO—72.7 kg and BL—71.2 kg (Table 2). The lowest average value was found for GF—52.9 kg, where, at the same time, the variation of this feature between sample plots was the highest (CoV = 28.3%). Slightly less variation was found for NRO (CoV = 25.9%) and for BL (CoV = 18.6%), while the feature showed the least variation for DF (CoV = 15.6%). It was found that the butt logs of GF trees at 30 years of age absorbed significantly less CO2 compared to DF and NRO. There were no significant differences in this feature between the other species (Table 5; Figure 3).

3.2. Results of Analyses for Trees of Class III (50 Years)

Of the studied trees, a total of 183 trees met the age criterion, including 73 DF, 89 NRO, and 21 BL.
Table 6 shows that at the age of 50 years, the largest BDBHs were characterized by DF stems; the average was 31.5 cm. In the case of deciduous species, the values were significantly lower and amounted to 25.1 cm for NRO and for BL—25.0 cm. The smallest variation of this feature between sample plots was found for DF (CoV = 8.8%) and the largest for NRO (CoV = 15.1%). It was found that the stems of DF had significantly higher BDBH compared to both deciduous species, i.e., NRO and BL (Table 7; Figure 4).
The highest ODWD was characterized by BL stems, for which the feature’s average was 677.9 kg·m−3, a slightly lower average was found for NRO—664.4 kg·m−3, while the lowest was for DF—566.5 kg·m−3 (Table 6). As in the case of the analyses for trees aged 30 years, the smallest variation in the feature between sample plots was recorded for BL (CoV = 2.8%) and the largest for NRO (CoV = 6.2%). The ODWD of the stems of deciduous species, i.e., NRO and BL, was found to be significantly higher compared to DF (Table 8; Figure 5).
The highest average amount of absorbed CO2 in the wood of stubby logs at 50 years of age was shown by DF, 170.8 kg, while for deciduous species, the average features were significantly lower and amounted to 135.4 kg for BL and for NRO—134.2 kg. The greatest variation in this feature between sample plots occurred for NRO (CoV = 31.0%) and the smallest for DF (CoV = 16.6%). It was found that DF butt logs at 50 years of age absorbed a significantly higher amount of CO2 compared to NRO. No significant feature differences were found between DF and BL or between NRO and BL (Table 9; Figure 6).

3.3. Results of Analyses for Trees of Class IV (70 Years)

Of the studied trees, 71 DF trees and 33 NRO trees met the age 70 criterion, for a total of 104 trees.
Table 10 shows that at the age of 70, slightly larger BDBHs were characterized by DF stems compared to NRO. The averages were, respectively, 34.6 cm and 33.1 cm. The variation of this feature between sample plots in this case was much lower for NRO (CoV = 3.3%), as the age criterion was met by trees from the two sample plots, where the average values of the feature were similar. For DF, the variation was much higher (CoV = 14.5%), which was influenced by the significantly lower mean value of the feature for sample plot No. 4. There were no significant BDBH differences between DF and NRO stems for the analyzed age of 70 years (U-test: p = 0.4762).
The average ODWD for DF at age 70 was 573.8 kg·m−3, which was lower than the average obtained for NRO, which reached 657.4 kg·m−3 (Table 10). The variation of this feature between the sample plots for both species was low; the coefficients of variation were, respectively, 2.8% and 0.8%. It was found that NRO had a significantly higher ODWD compared to DF (t-test: p = 0.0000; Figure 7).
The average amount of CO2 absorbed by girdled NRO logs was 227 kg, while DF logs absorbed an average of 210.5 kg (Table 10). Clearly, greater variation in the feature occurred for DF (CoV = 30.4%), while it was significantly smaller for NRO (CoV = 12.7%). There were no significant differences in the amount of CO2 absorbed between NRO and DF butt logs (U-test: p = 0.6004).

3.4. Results of Analyses for Trees of Class V (90 Years)

Of the studied trees, 64 DF trees and 19 NRO trees met the age criterion of 90 years, for a total of 83 trees.
Table 11 summarizes the studied averages of the analyzed features for the 83 studied trees. It shows that the average BDBH for DF was 42.2 cm and was slightly higher compared to the average, which was obtained for NRO, which reached 40.5 cm. A slightly greater variation in BDBH between sample plots was found in DF, for which CoV = 9.7%; in the case of NRO, CoV = 6.2%. No significant differences in the feature between both species were found for the analyzed age (U-test: p = 0.6804).
The mean ODWD was similar to the values obtained for Class IV and amounted to 575.1 kg·m−3 for DF and 655.3 kg·m−3 for NRO (Table 11). The variation of this feature between sample plots was small, with CoV = 2.5% for DF and CoV = 1.3% for NRO. NRO was found to have a significantly higher ODWD compared to DF (t-test: p = 0.0000; Figure 8).
The average amount of CO2 absorbed by the wood of NRO butt logs at 90 years of age was 329.9 kg, while for DF, it was 306.4 kg (Table 11). The variation of the feature for both species was similar, with CoV = 18.6% for NRO and CoV = 19.9% for DF. There were no statistically significant differences in the amount of CO2 absorbed between the butt logs of the two species analyzed (U-test: p = 0.5475).

4. Discussion

Alien tree species were initially planted in Europe for their ornamental value. Over time, foresters observed rapid growth rates in some of them, which in many cases were higher compared to native tree species. Rapid tree growth is associated with intensive CO2 uptake and the incorporation of carbon into the wood structure. The rapid increase in stem thickness is due to the tree’s formation of wide annual rings, which usually affects wood density. In coniferous species, wood with wider rings tends to have lower density [23,24], while in broadleaf ring-porous species, wider annual rings tend to correspond to higher wood density [25,26].
Wood density is considered an indicator of the technical quality of wood [17]. Wood with a higher density is usually characterized by higher mechanical parameters. In 1 m3 of volume, it contains more dry matter, which translates into a higher total carbon content. Tree species forming higher-density wood, therefore, absorb a higher amount of CO2 to produce 1 m3 of raw material compared to species with lighter wood.
The present study compares the BDBH, ODWD, and CO2 absorbed in butt logs, 2 m in length, of four alien tree species growing in Poland: GF, DF, NRO, and BL.

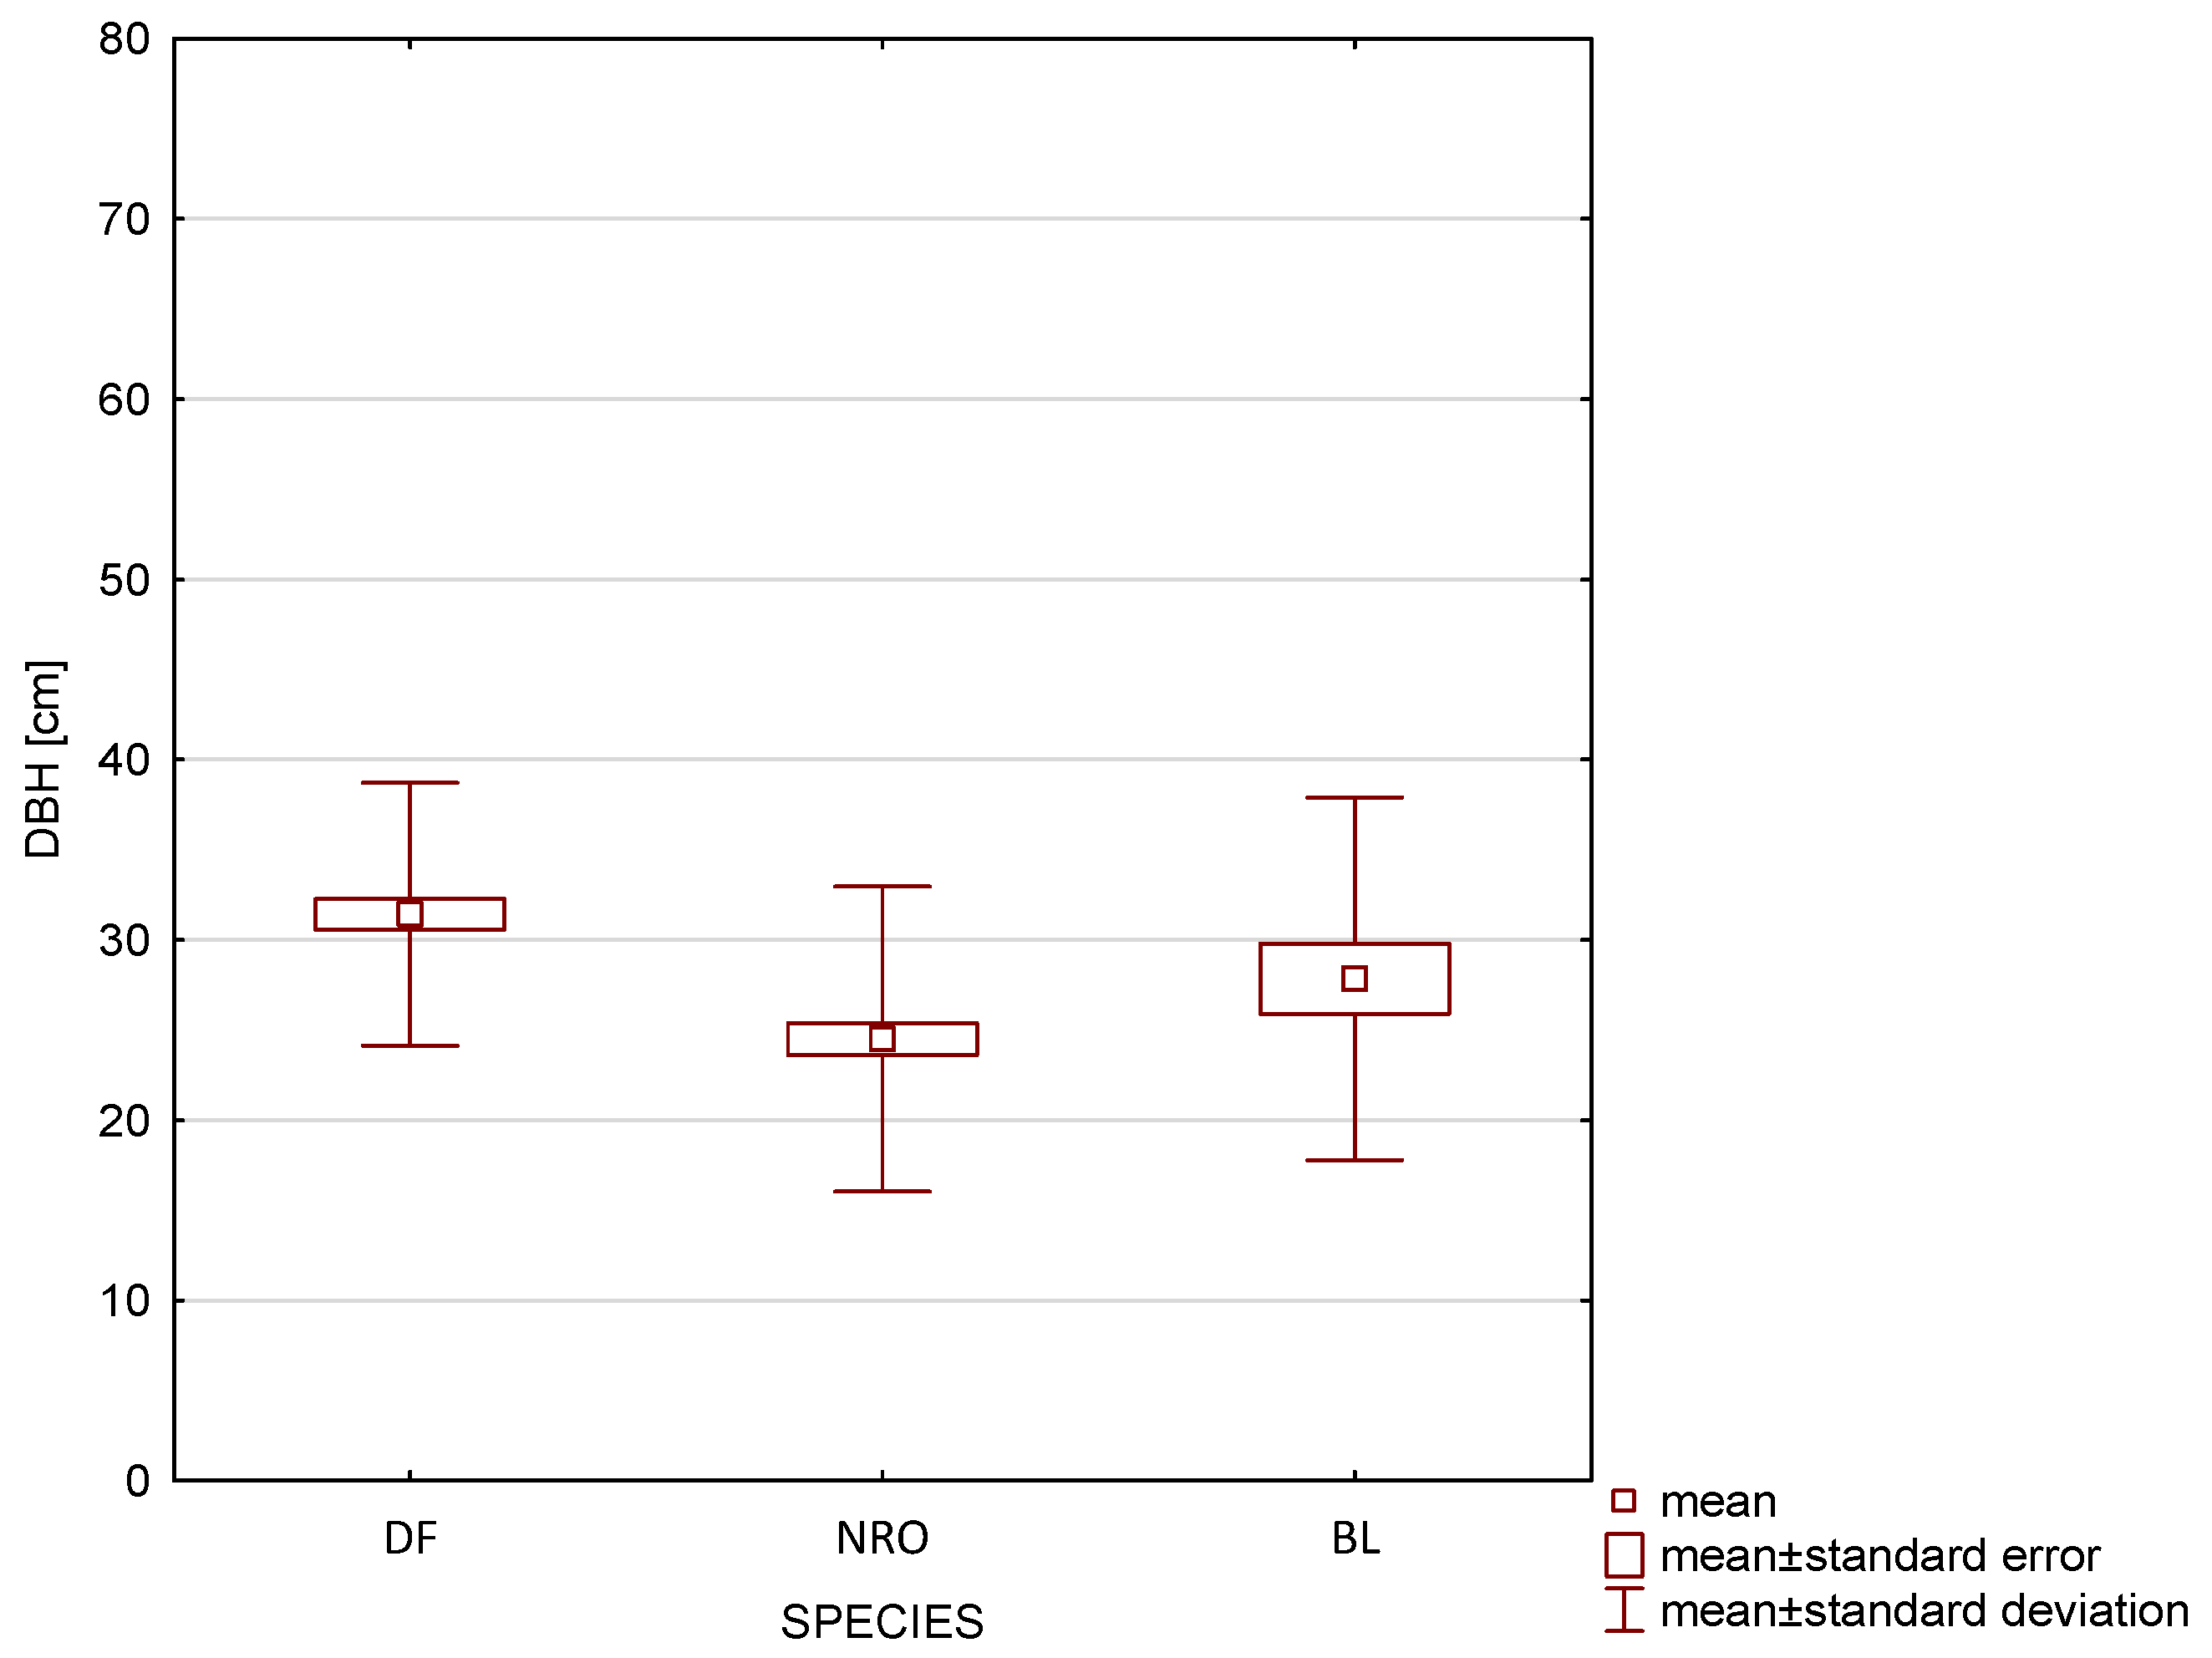
4.1. Barkless Diameter at Breast Height (BDBH)

For the Class II trees (mean 30 years), DF had the highest average BDBH with 22.6 cm, while GF had a slightly lower average with 20.6 cm. The averages obtained indicate that in the first 30 years of life, DF grows on average about 7.5 mm in thickness per year, while GF grows just under 7 mm. A lower rate of thickness growth during the first 30 years of life was characteristic of NRO and BL, for which the average breast height was, respectively, 18.2 cm and 18.0. These breast height diameters were, therefore, about 20% smaller compared to DF and about 10% smaller compared to GF. The rate of average stem thickness increment per year in the two broadleaved species was about 6 mm. Statistical analyses showed that DF at 30 years of age had significantly larger BDBH compared to the two broadleaved species studied, while GF had significantly larger BDBH compared to NRO. The implication is that the dynamics of thickness increment during this period are greater in coniferous species, especially in DF.
In Class III (mean 50 years), three species were compared: DF, NRO, and BL. During this period, DF continued to show a high rate of thickness growth, resulting in significantly higher mean BDBH compared to NRO and BL. The mean BDBH for DF was 31.5 cm, which was more than 25% greater than that of the two broadleaved species, which reached mean values at this age of NRO—25.1 cm, BL—25.0 cm. The average width of annual rings of the studied trees at about age 50 was for DF just over 6 mm, while for both studied broadleaved species it was about 5 mm.
In Class IV (mean age 70 years), only two species were compared: DF and NRO. The average BDBH of both species was similar at this age and was 34.6 cm for DF and for NRO—33.1 cm. The small differences were not statistically significant. At the age analyzed, both species were still characterized by a relatively good average annual ring width of almost 5 mm per year.
In the last age class, Class V (mean 90 years), DF was still characterized by a marginally higher mean BDBH (42.2 cm) compared to NRO (40.5 cm), and these differences were not statistically significant. Both species at this age maintained a relatively high average annual ring width of less than 5 mm. It should be noted that all the species studied at a young age, i.e., in the first 30 years of life, formed rings with an average value above 3 mm. This value is conventionally considered to be the boundary between narrow-ringed wood and course-grained wood, characteristic of fast-growing species [13]. Each of the four species studied can, therefore, be considered fast-growing in the initial 30 or so years of life. In the other three age classes, the studied tree species also showed average width of annual ring rates above 3 mm per year. Although the age of the BL trees studied did not exceed Class III, the average BDBH obtained in this class—25 cm, which was almost identical to that of NRO, allows us to assume that in the following years, the dynamics of BL thickness increment should not be inferior to that of NRO. In the oldest—Class V (mean 90 years), the two species studied, DF and NRO, were still characterized by a good average width of annual rings, exceeding the value of 3 mm per year. The implication is that even at older ages when these species can be used by clear-felling, any retention on the stem should not result in less thickness increment, which is particularly important when there is a periodic decrease in demand for timber and trees need to be left on the stem.

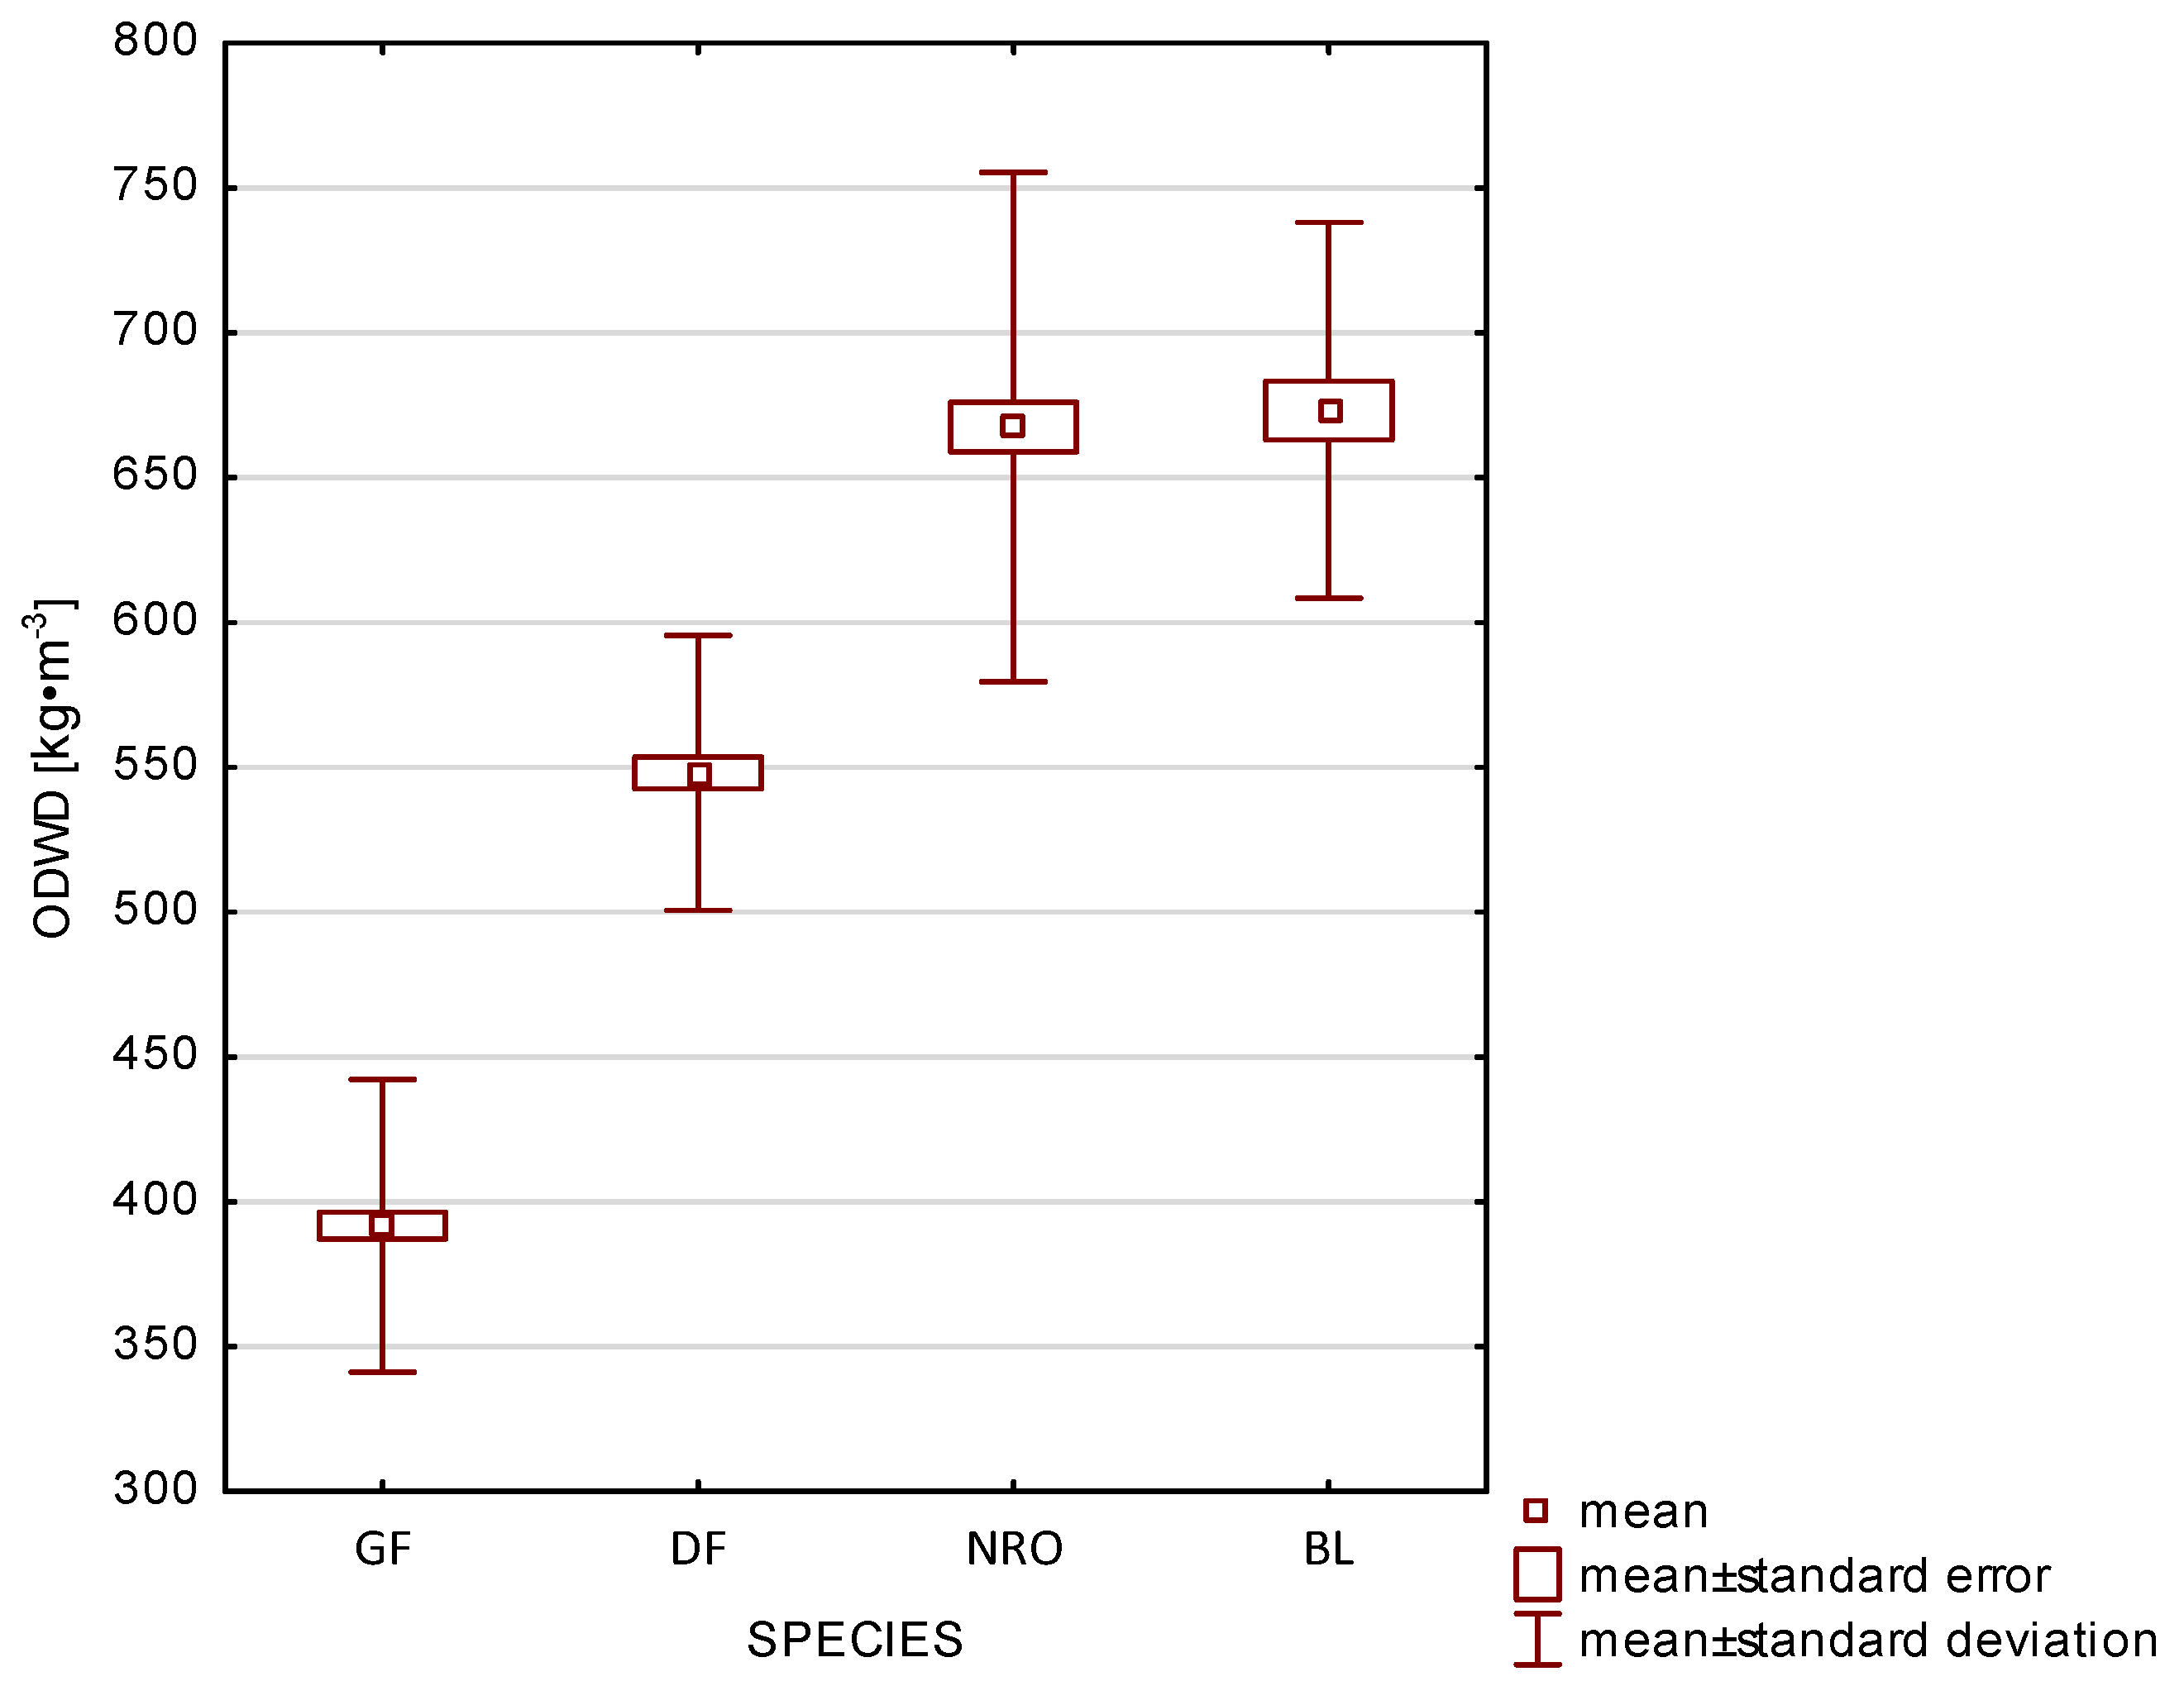
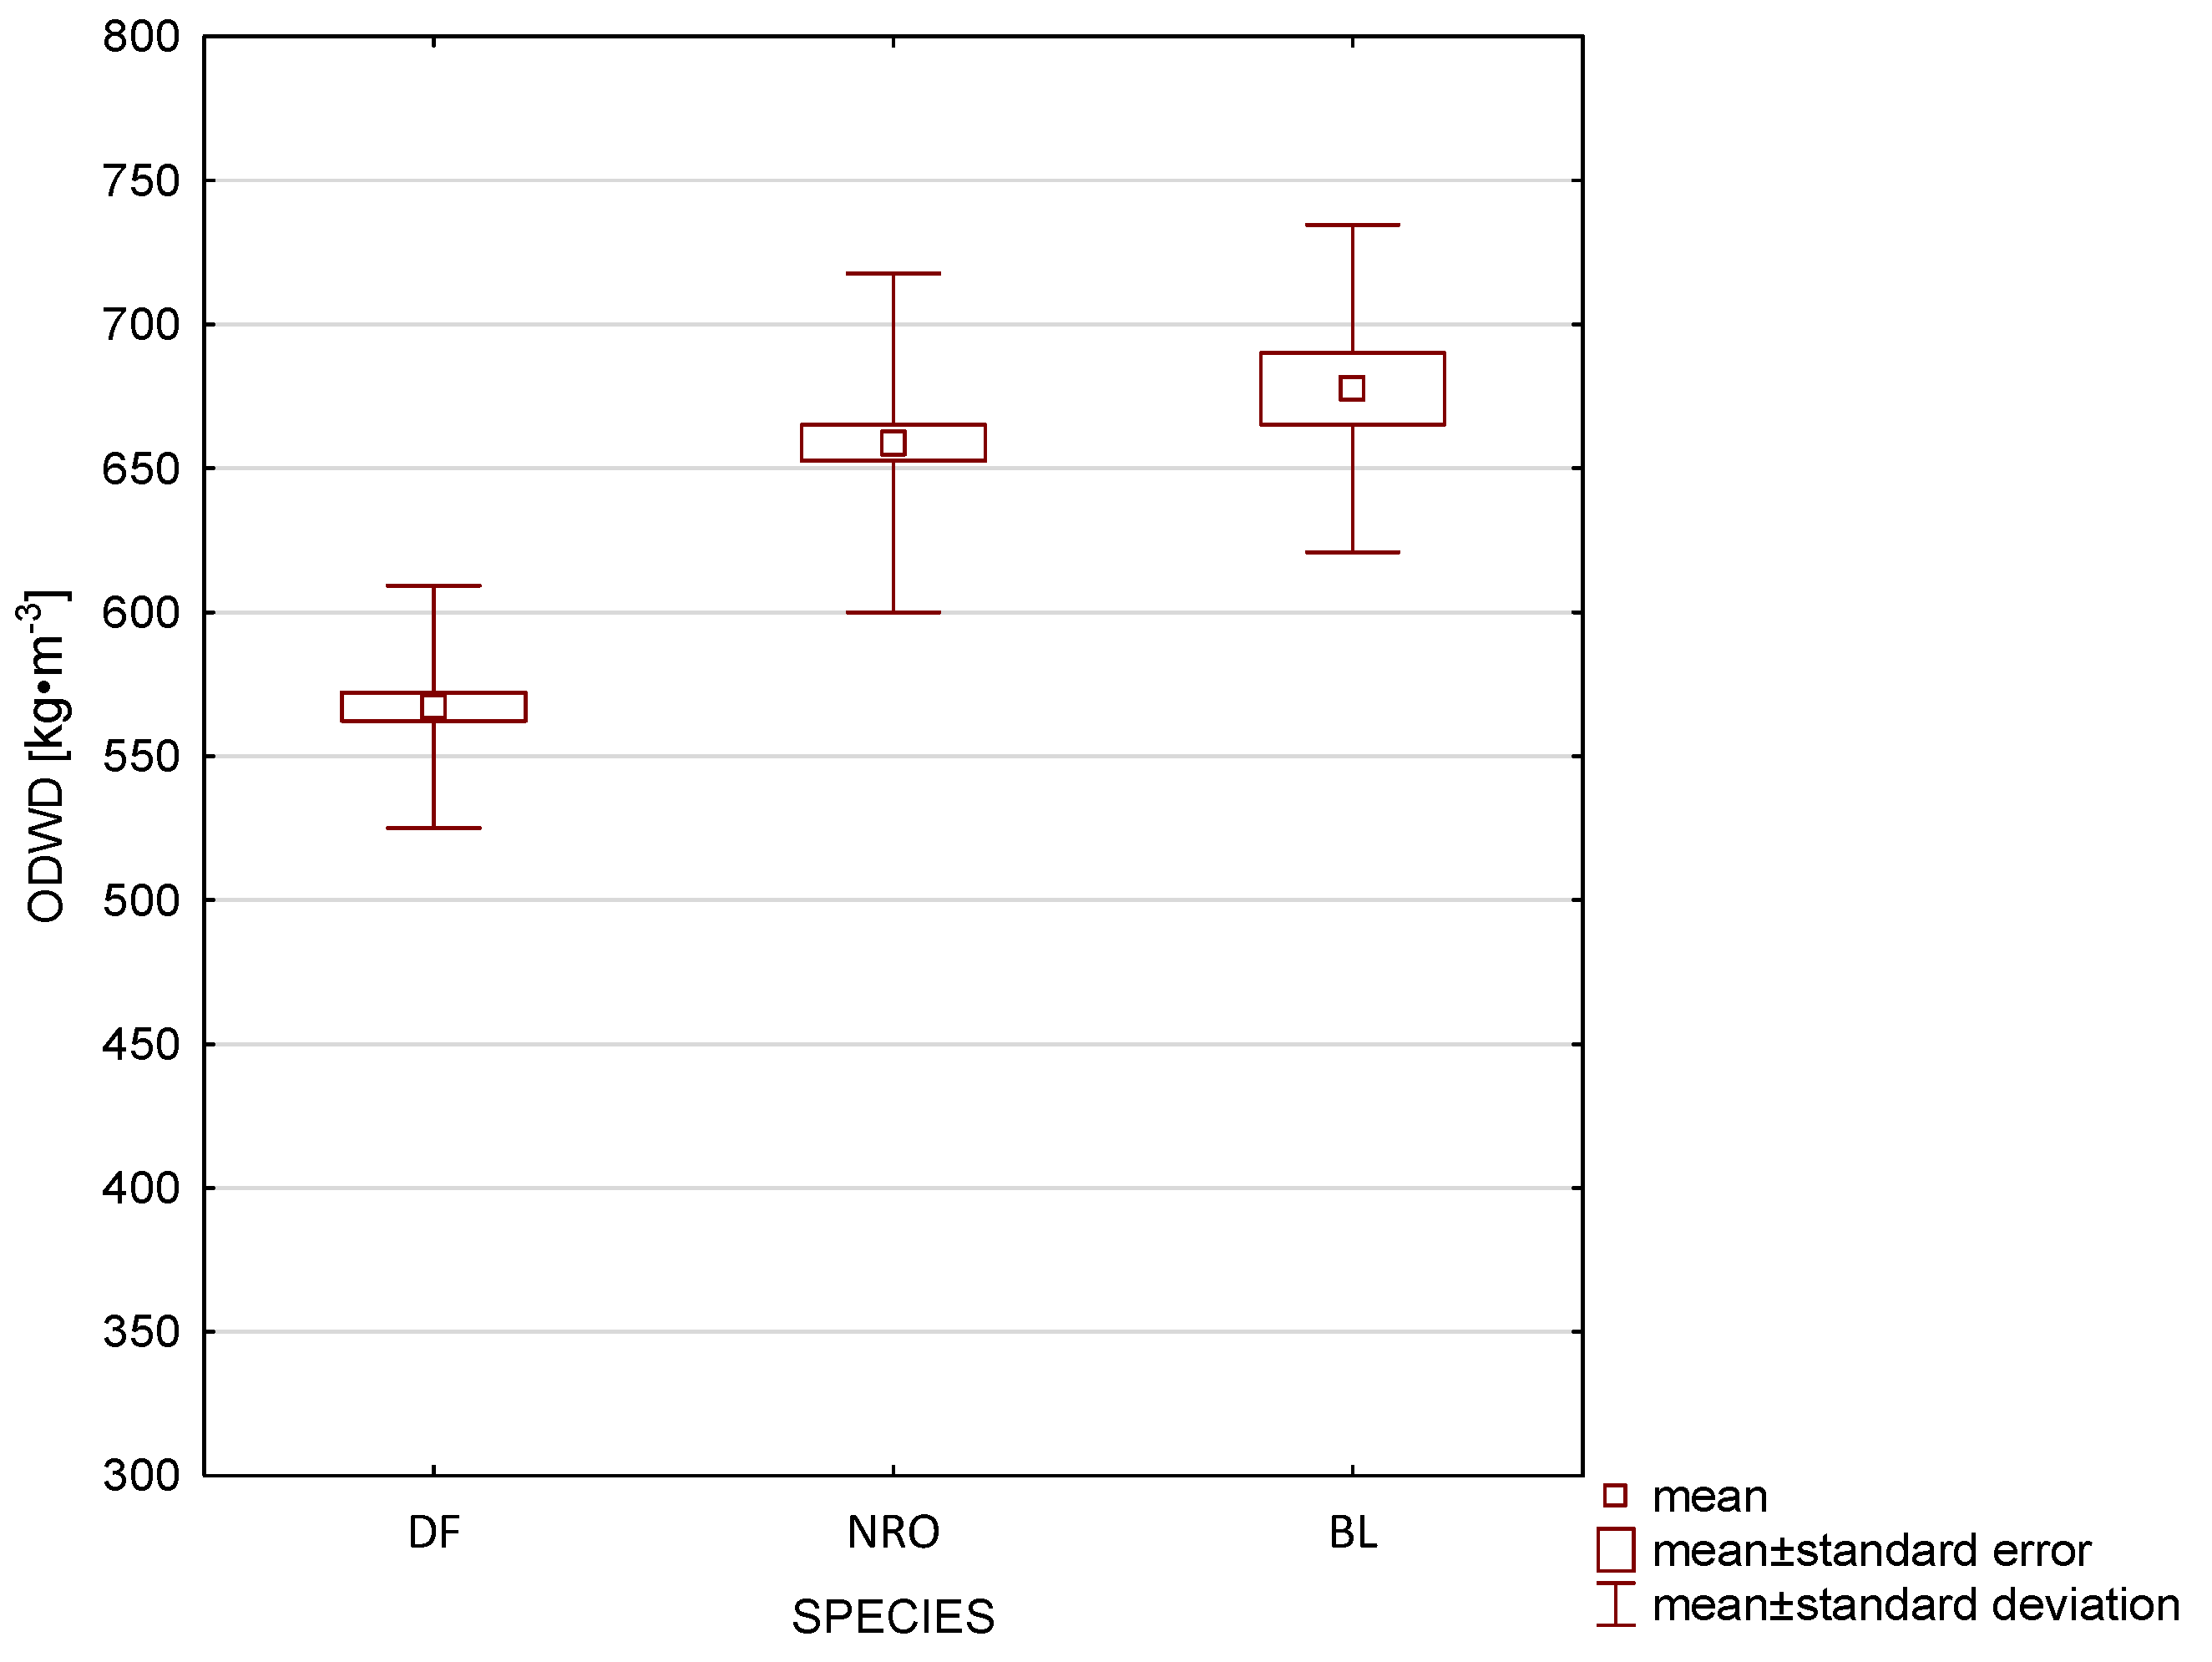
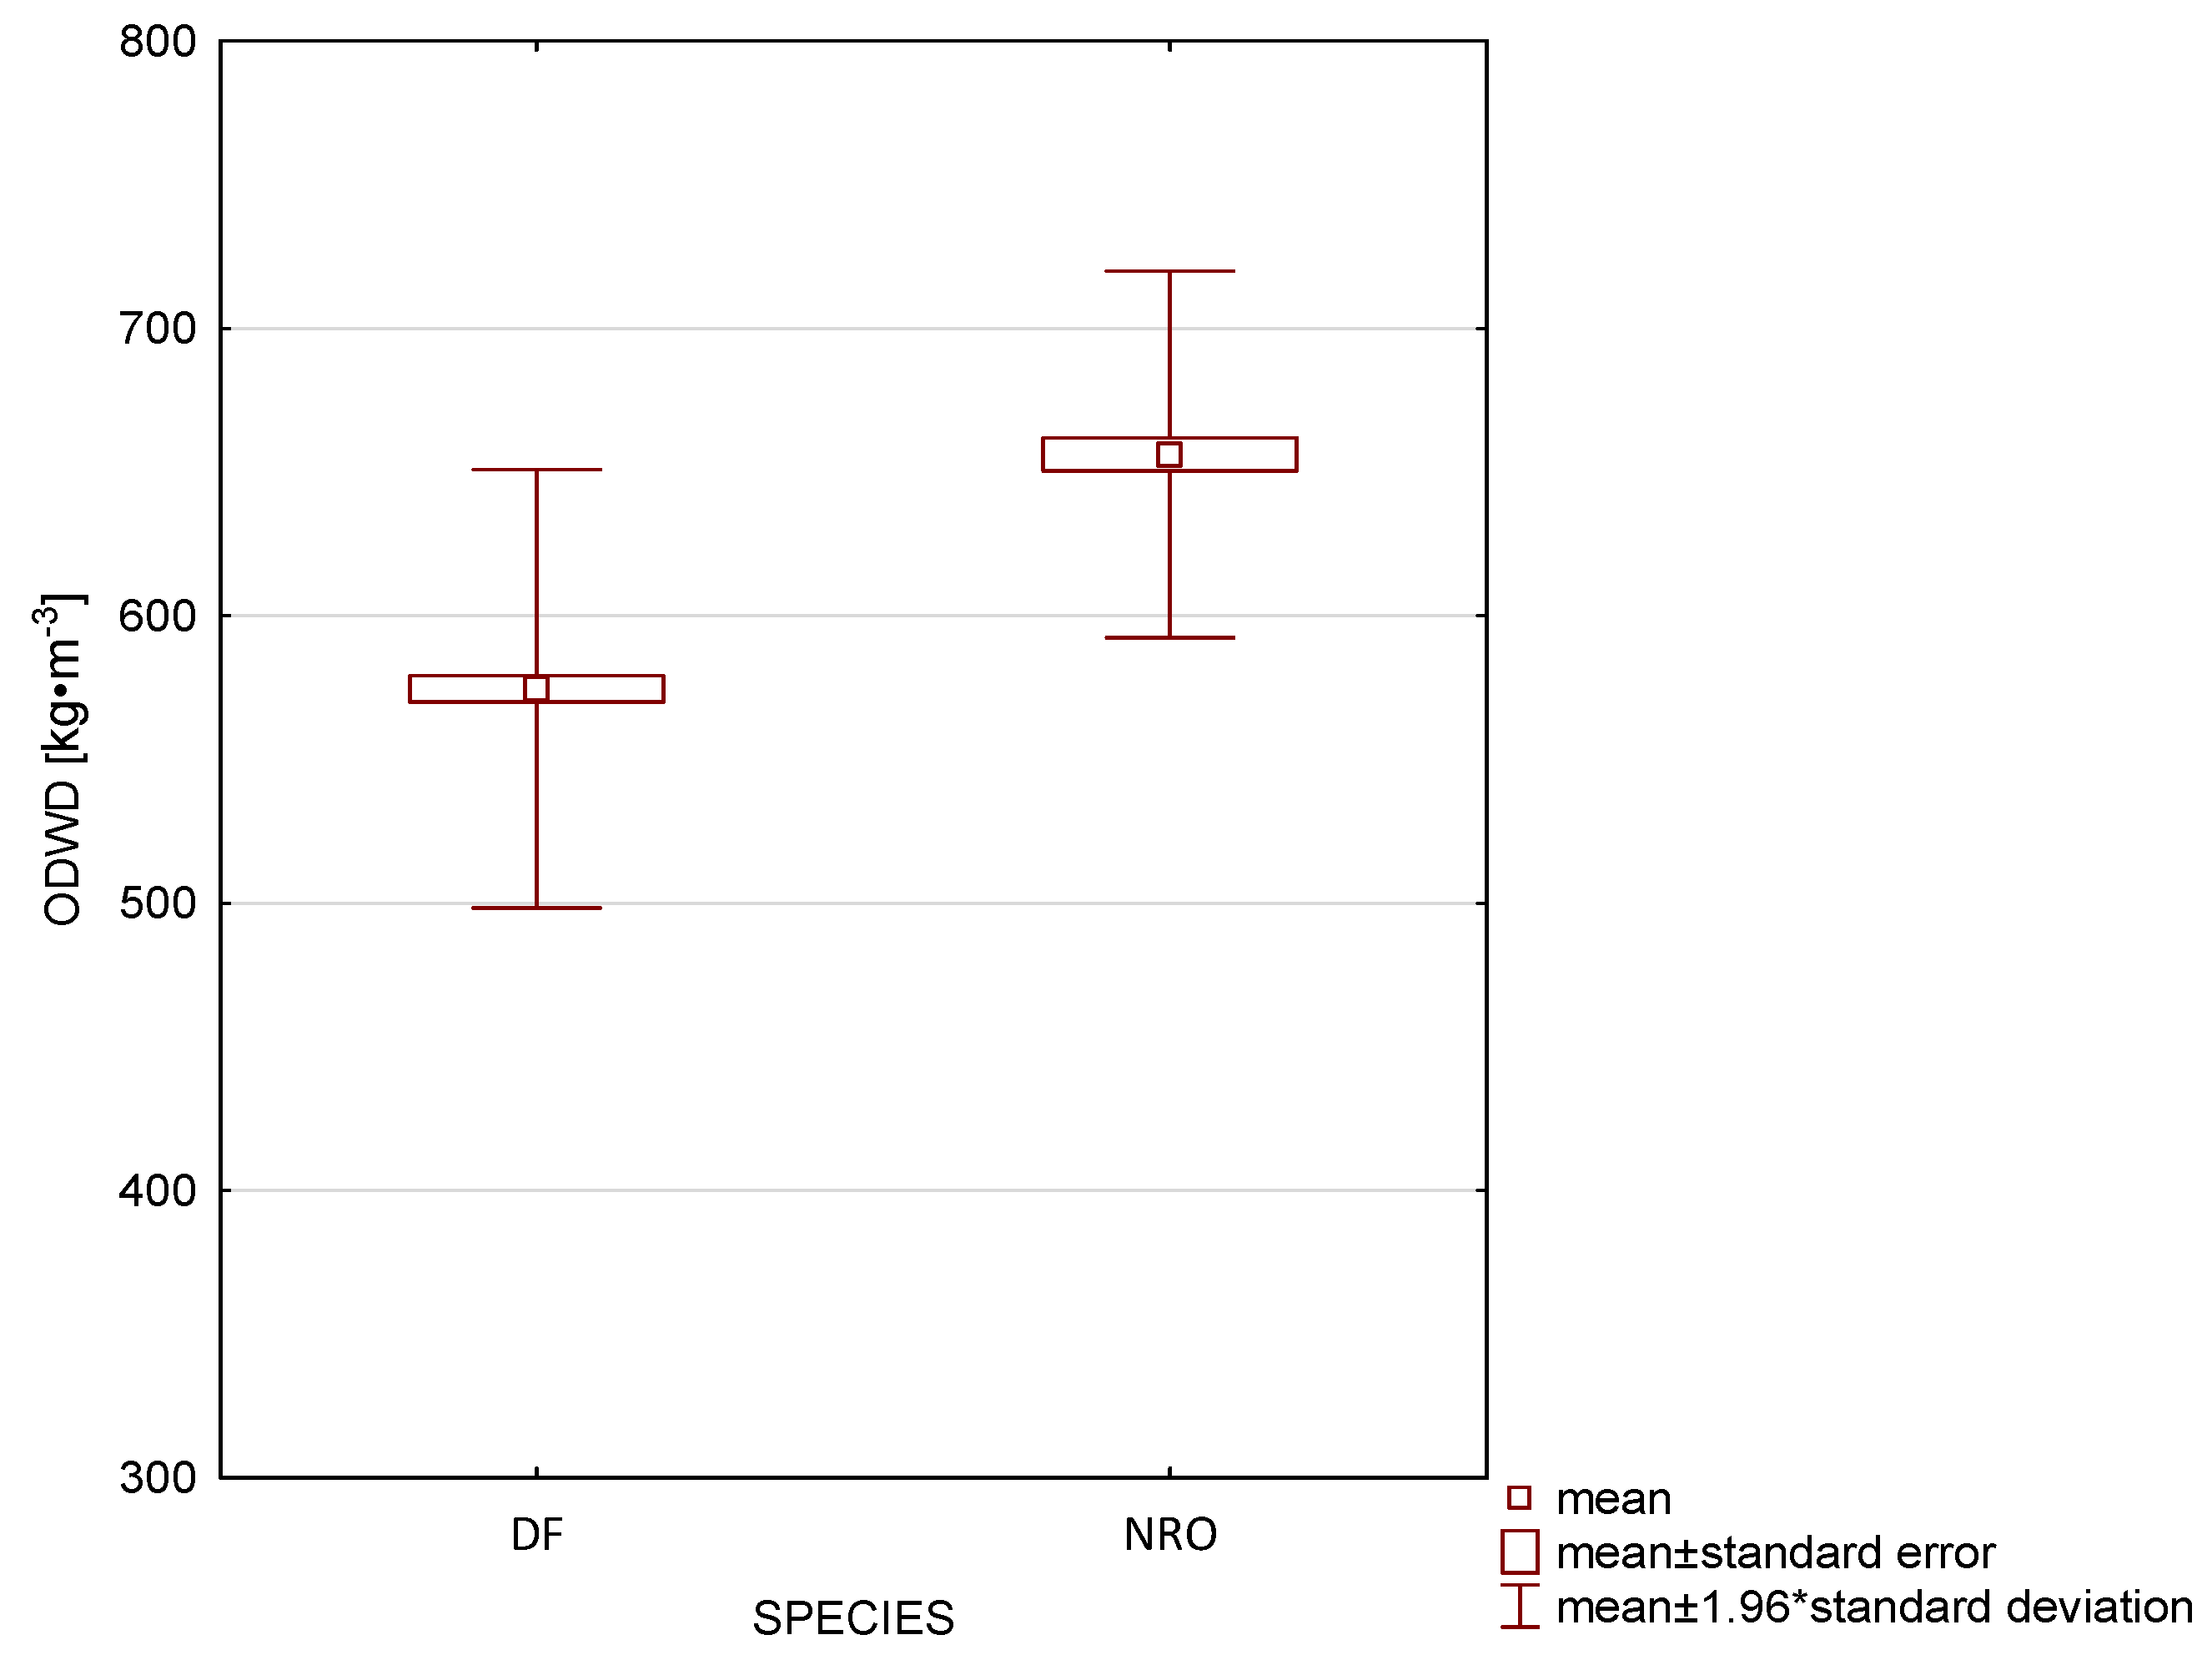
4.2. Oven-Dry Wood Density (ODWD)

There are six classes of wood density [17]: very light—with a density below 400 kg·m−3, light—410–500 kg·m−3, moderately light—510–600 kg·m−3, moderately heavy—610–700 kg·m−3, heavy—710–800 kg·m−3, and very heavy with a density above 800 kg·m−3.
ODWD during the first 30 years of life was significantly higher in deciduous species. In the case of NRO, it was 668.6 kg·m−3, while for BL, it was slightly higher and reached 674.4 kg·m−3. Thus, according to the cited classification given by Krzysik [17], NRO, in the first 30 years of life, formed moderately heavy wood, while BL formed heavy wood. DF formed moderately light wood in the youngest years of life, obtaining an average ODWD of 547 kg·m−3, while GF formed very light wood with an ODWD of 392 kg·m−3. The low ODWD of coniferous species at a young age is due to the high proportion of juvenile wood, which is characterized by wide annual rings and a low proportion of latewood. This is a typical characteristic of most coniferous species, especially those characterized by dynamic thickness increments at a young age [27,28,29]. In the case of GF, this proportion could be higher, as the juvenile wood zone in this species contains approximately 10 to 20 annual increments [30]. In broadleaved tree species with ring-porous wood structures, the youngest rings tend to have a higher density due to the anatomical structure of these species. This is because the wide rings are characterized by a wide zone of high-density latewood and a narrow zone of porous and light earlywood, formed by large-diameter pores that are visible on the cross-section of the wood with the naked eye. In both studied broadleaved species, the regularity described above was observed at the youngest age (30 years). Both studied coniferous species had significantly lower ODWD than broadleaved species; moreover, GF had significantly lower ODWD compared to DF. It follows that at the age of about 30 years, wood harvested from NRO and BL should have better strength parameters compared to both coniferous species. Indeed, wood density is correlated with mechanical properties [31]. In the next analyzed period, i.e., Class III, DF was still characterized by a significantly lower ODWD compared to the deciduous species tested. The mean ODWD obtained for DF during this period was 566.5 kg·m−3 and was about 15% lower compared to NRO and just over 16% lower than BL. In Class IV, the ODWD for DF was 573.8 kg·m−3 and it was less than 13% lower than the mean obtained for NRO, and these differences were statistically significant. In the last period analyzed, Class V, the mean ODWD for DF was 575.1 kg·m−3 and was just over 12% lower compared to NRO. Still, the two species in terms of this feature differed statistically significantly.
Two regularities emerge from the above analyses of the development of ODWD of the studied species in different age classes. In the case of the coniferous species DF, the feature increases slightly with the age of the trees. Indeed, in Class V, the average ODWD was slightly more than 5% higher than in Class II. In the case of NRO, the feature for trees in Class V had a lower average value by about 2% compared to Class II. The ODWD values for DF obtained in the present study are slightly higher than those reported for trees growing in North America, where the density for air-dry wood (12% moisture content) is 510 kg·m−3 [18]. However, similar values were obtained for trees growing in Poland [32]. The average ODWD value obtained in the present study for GF growing in Poland was lower than that reported for air-dry wood of GF growing in North America, which is 450 kg·m−3 [18]. A similar (380 kg·m−3) wood density value is reported for GF growing in Europe [30].
The average ODWD obtained for NRO was slightly lower than that reported for air-dry (12% moisture content) wood of this species from North America at 700 kg·m−3 [18,33]. NRO trees growing in other parts of Europe also obtained a slightly higher density with a range of 680–720 kg·m−3 [34]. For the second studied broadleaved species, BL, the ODWD obtained in the present study is close to the lower values of the range reported for BL from southwestern Poland, ranging from 677.1 to 711.8 kg·m−3 [35]. Higher density values for air-dry wood (12% moisture content) are reported for BL from North American areas (770 kg·m−3), Greece (750 kg·m−3), and Belgium (734 kg·m−3) [18,36,37].

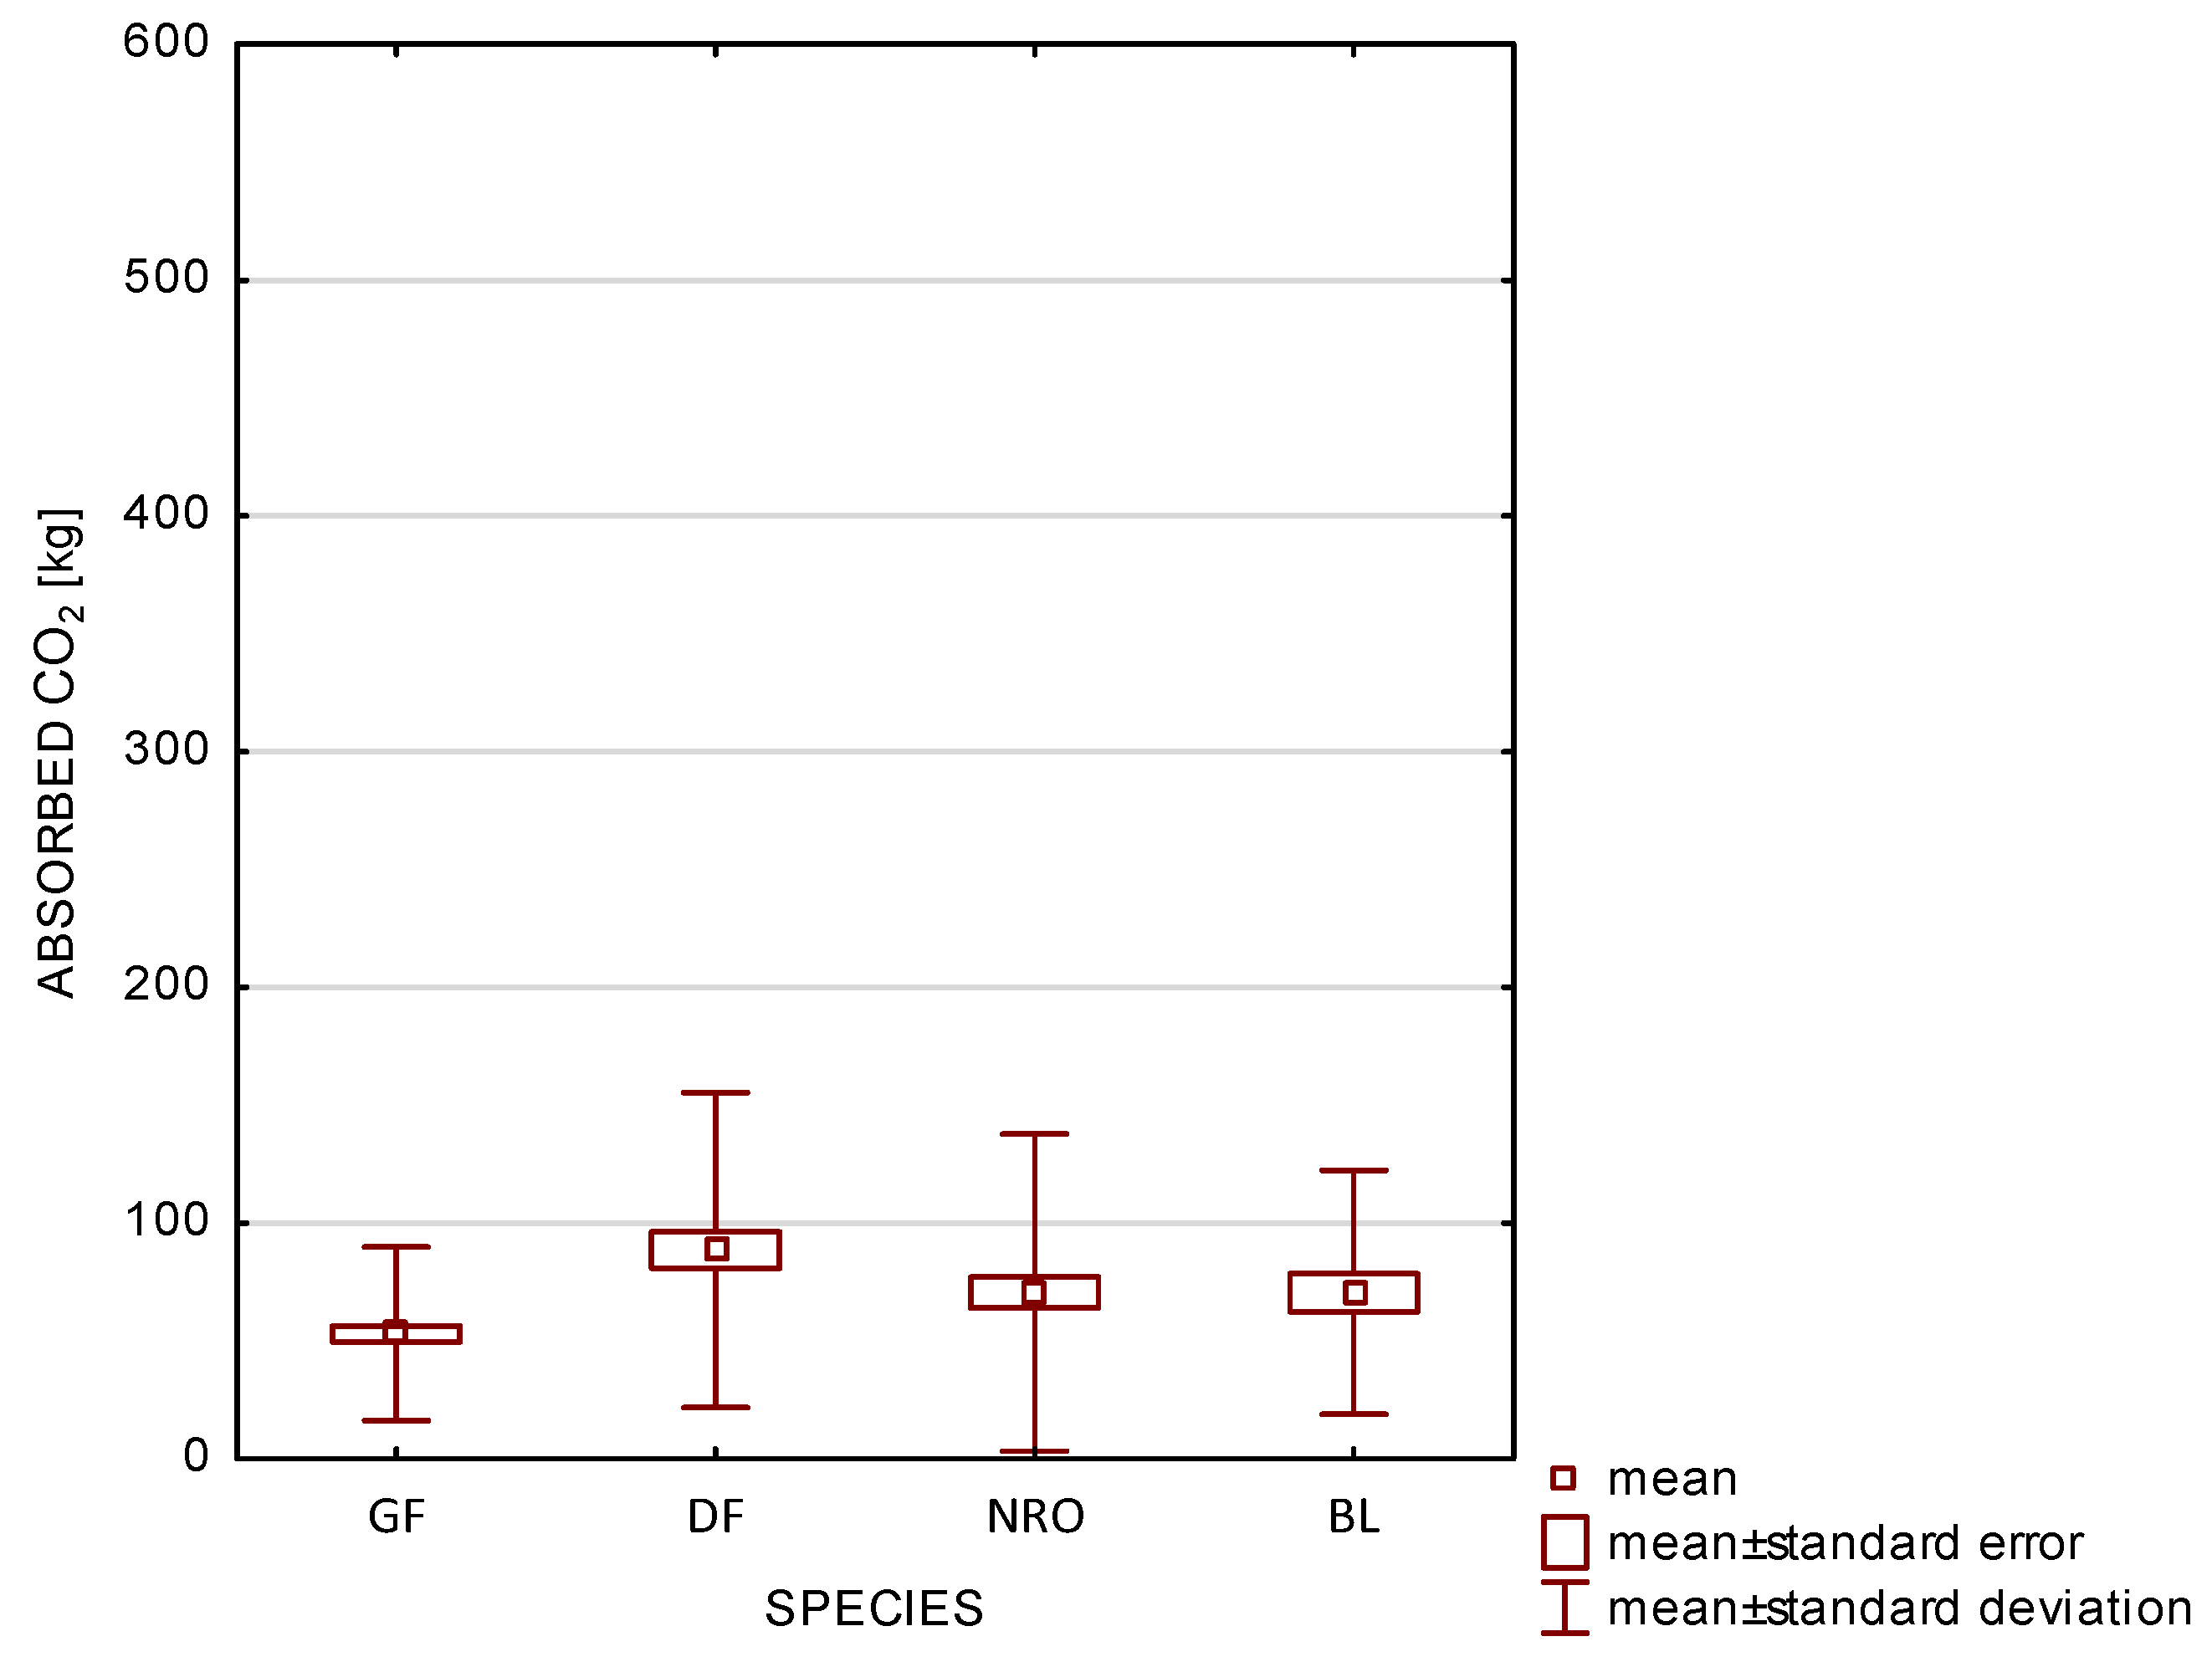
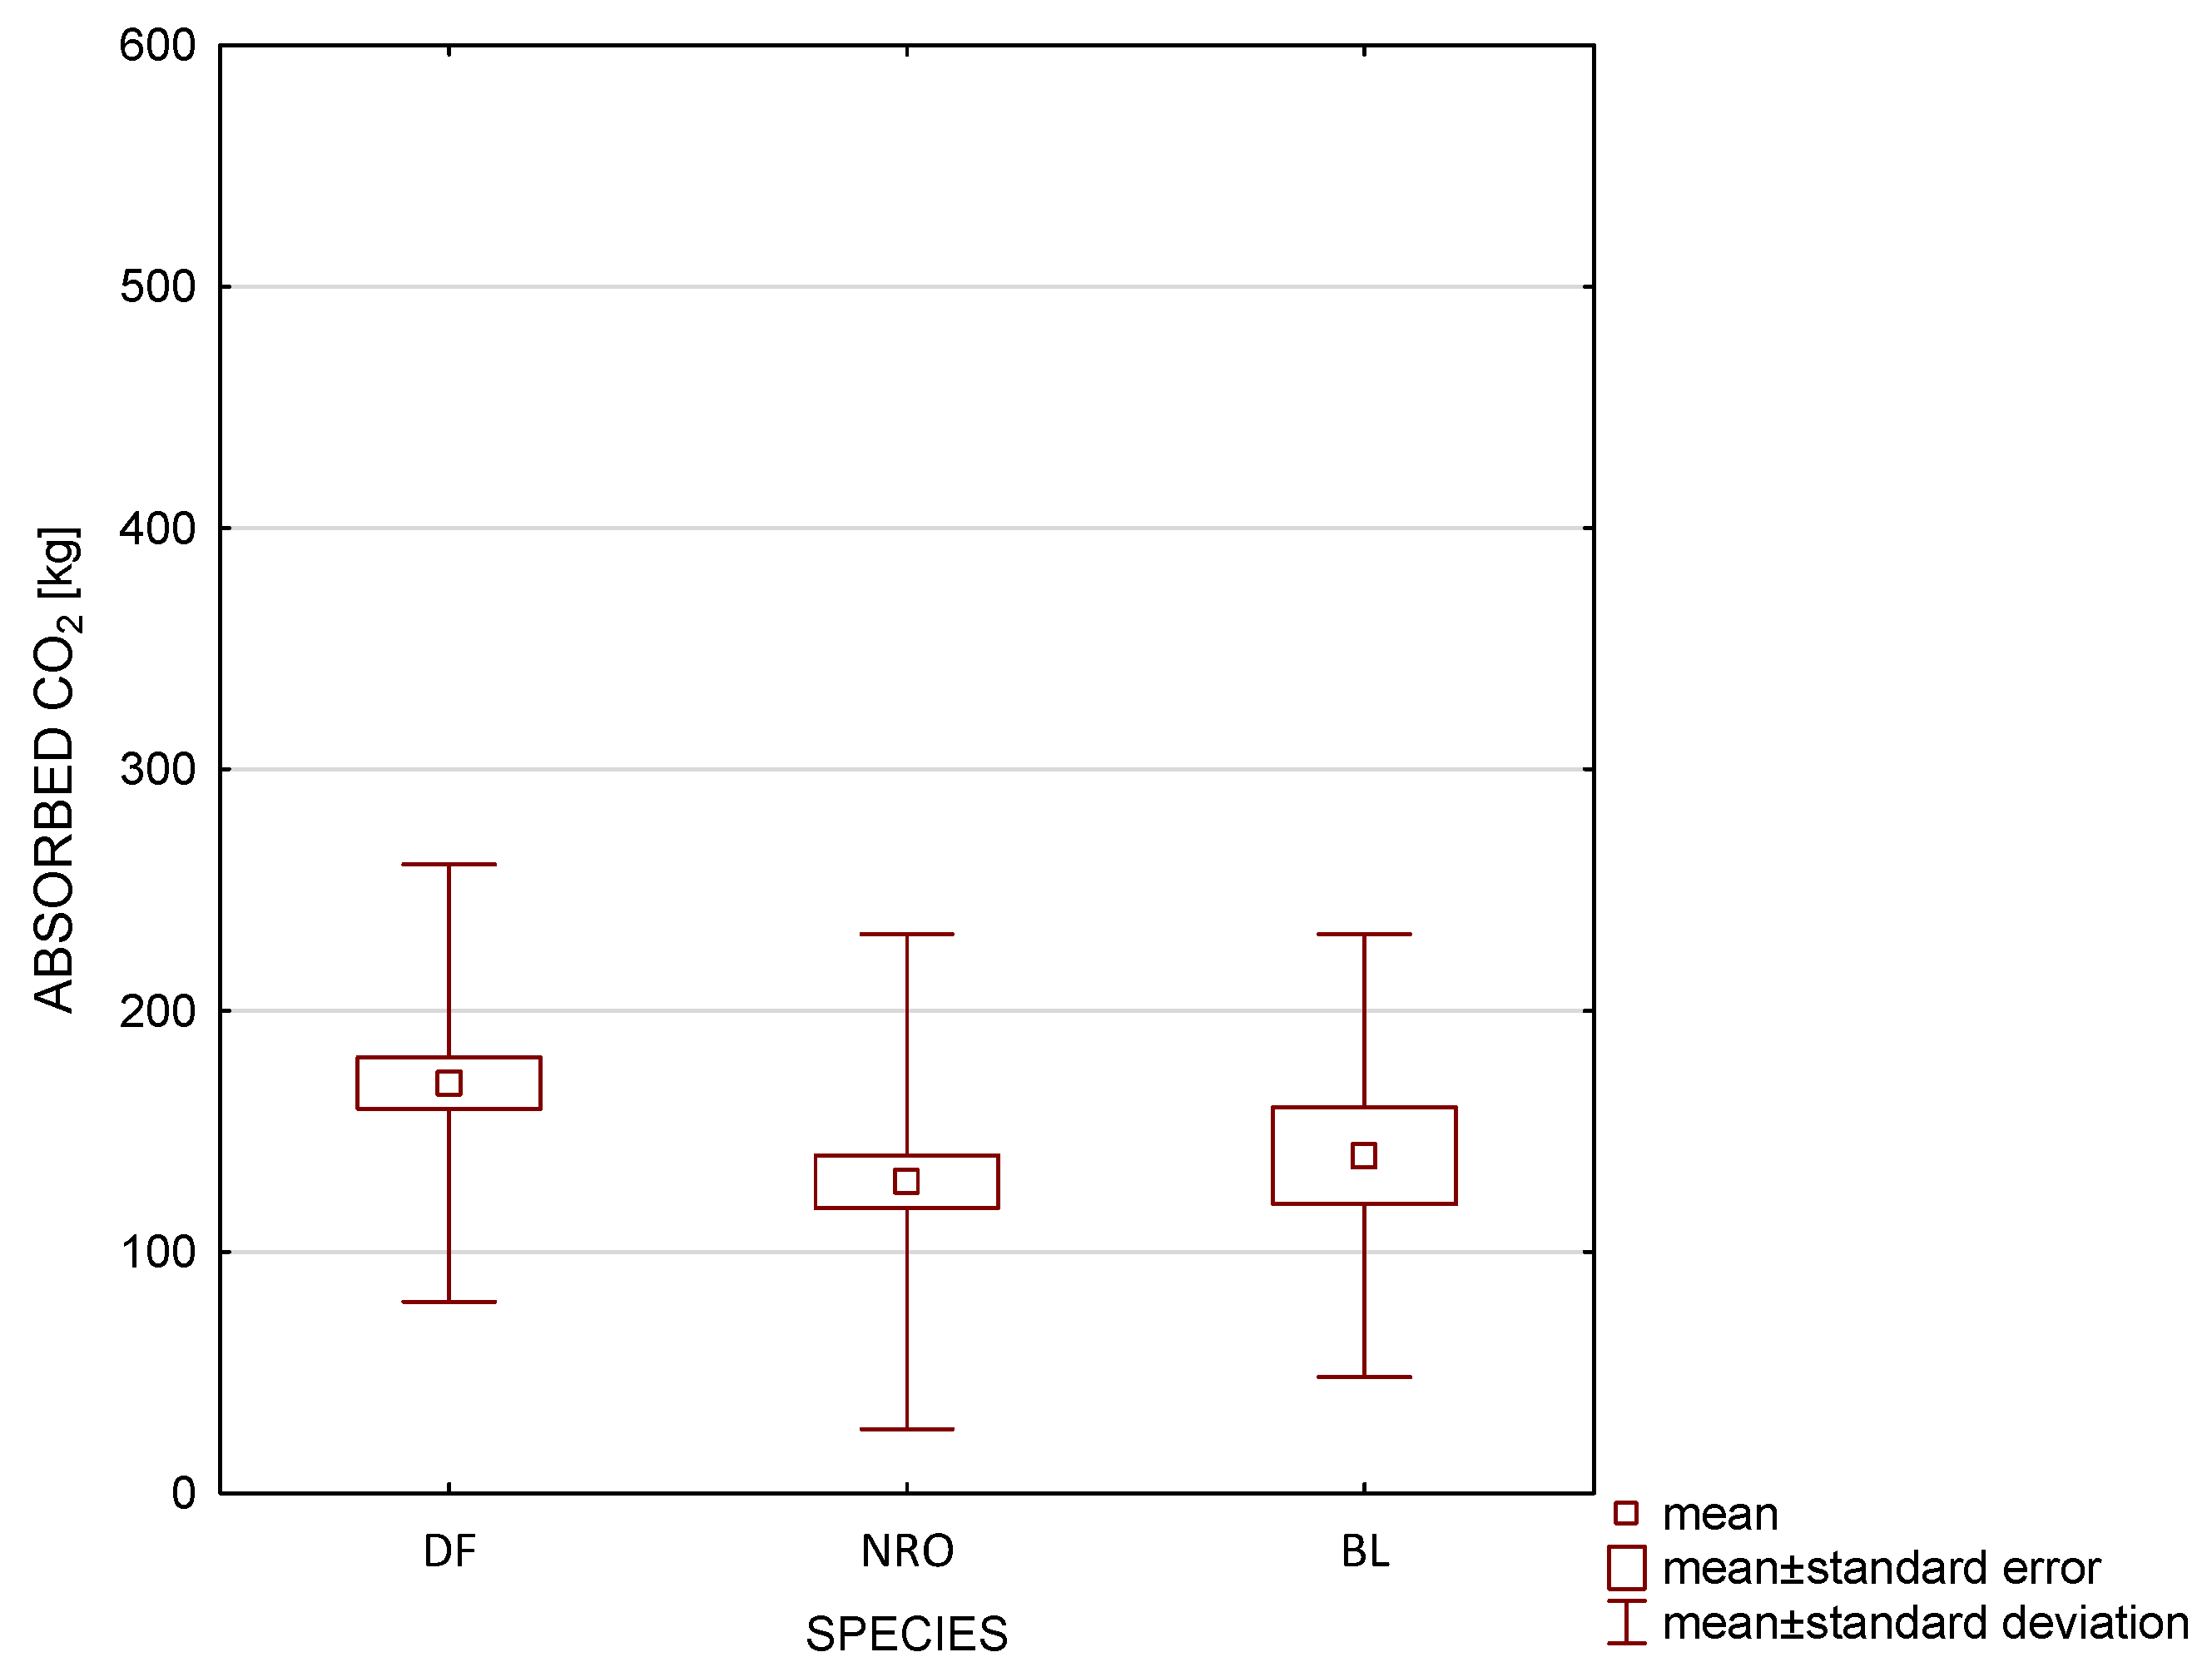
4.3. Amount of Absorbed CO2

In the presented study, four non-native tree species growing in Polish forests were compared. Due to differences in the age of the studied trees, a comparison of the amount of CO2 absorbed and stored in the form of organic carbon contained in the wood was possible only for the age of 30 years. This was the age of the youngest studied GF trees. However, as with the other two features, comparative analyses for a smaller number of species were conducted for the three older age classes.
Comparing the butt logs of approximately 90-year-old and 70-year-old NRO and DF trees, there were no significant differences in CO2 absorption between the two species. Although DF trees were characterized by larger breast height, NRO showed significantly higher wood density. Thus, at older ages, the average amount of CO2 absorbed by both species to produce butt logs is similar.
For slightly younger, 50-year-old trees, the highest amount of CO2 absorbed to produce butt logs was calculated for DF. This amount was significantly higher compared to NRO, which is due to the faster rate of thickness growth at this age in DF trees. The difference in average BDBH at this age was more than 6 cm in favor of DF. There were no significant differences between BL and DF or between BL and NRO.
The analysis shows that at the age of about 30 years, DF trees stored the most CO2 in 2 m butt logs—an average of almost 90 kg. Slightly less was stored by NRO logs—almost 73 kg and BL logs—slightly more than 71 kg. The differences between the above species were not statistically significant. On the other hand, the smallest amount of CO2 was found in GF logs, and it was statistically significantly less compared to DF and NRO. The average amount of CO2 absorbed by GF logs was just under 53 kg, and this was, on average, more than 40% less compared to the average, obtained for DF, more than 27% less compared to NRO, and more than 25% less than BL. It should be added that among the species studied, GF does not form colored heartwood, and its wood is considered perishable, meaning that its natural durability, i.e., resistance to the activity of rot fungi and insects, is less than 5 years [18]. NRO wood is similarly classified, even though the species forms colored heartwood. DF heartwood is rated as moderately durable (natural durability—10–15 years), while BL is rated as very durable (natural durability—over 25 years) [18]. The longer natural durability of the wood has a positive effect on the time during which the absorbed CO2 will be stored as organic carbon in products made from this wood.
Thus, when considering the possibility of introducing any of the four studied non-native tree species into Polish forests, GF is not recommended for reasons of the least amount of CO2 absorbed and low wood durability. Although NRO used significantly more CO2 for the production of 30-year-old stub logs compared to GF, taking into account the low durability of its wood, it seems that it is also not advisable to introduce this species into Polish forests. BL absorbed slightly less CO2 compared to NRO, but its wood shows the greatest natural durability, so products made from the wood of this species will accumulate absorbed carbon for a long time. However, as NRO, BL is considered an invasive species in Poland [38], so the intentional introduction of these two species into forests would be highly doubtful and probably opposed by environmental organizations. DF showed, at 30 years of age, the highest average amount of absorbed CO2 in the butt-end logs. Its wood is considered moderate-durability, and at the same time, very importantly from the perspective of long-term sustainability, it is not considered an invasive species [38]. However, it is emphasized that in stands with highly distorted natural phytocenoses (habitat degradation through pine monoculture cultivation), the introduction of DF contributes to enhancing stand productivity and improving soil edaphic properties [32].
It should be added that DF wood finds wider application compared to NRO and BL wood. The wood of both hardwood species is used for interior finishes, veneers, furniture, or flooring components. In addition to these four directions mentioned above, DF wood is also used in buildings as construction wood [18,32] mainly due to the fact that DF trees usually have straight stems, while NRO and BL trunks often have a curvature, as observed during field measurements. In addition, the technical quality of DF stems, which is mainly affected by knots, can be increased by pruning the trees until they are about 30 years old, and the green branches obtained during pruning can be sold (especially during the Christmas season) earning additional income [32]. Taking into account four aspects, including the amount of absorbed CO2, the durability of the wood, the profitability of cultivation, and the potential ecological risks, it seems that among the four analyzed non-native tree species, DF will be the best choice.
It seems that the wood of the butt-end logs of the studied GF trees in older age classes will be characterized by a higher density, as with each year, the proportion of mature wood, with narrower rings and a higher proportion of latewood, will increase in the wood. It would be advisable to carry out similar comparative analyses of BDBH, WD, and the amount of absorbed CO2 in a decade or so when the studied GF trees reach an age of about 50 years.

5. Conclusions

Douglas fir trees studied at the ages of 90 and 70 years (Class V and IV) showed a larger barkless diameter at breast height compared to northern red oak but had significantly lower wood density. The amount of CO2 absorbed by both tree species to produce butt log wood was similar, and the differences between them were statistically insignificant.
At the age of 50 years (Class III), the studied Douglas fir trees had a significantly larger barkless diameter at breast height and significantly lower wood density compared to northern red oak trees and back locust trees. At this age, the Douglas fir absorbed an average of about 170 kg of CO2 to produce butt log wood, significantly more compared to the northern red oak.
At the age of 30 years (Class II), the Douglas fir trees had a significantly larger barkless diameter at breast height compared to northern red oak trees and black locust trees, while the grand fir trees had a significantly larger barkless diameter at breast height compared to northern red oak trees. The wood density of both coniferous species was significantly lower compared to both broadleaved species; moreover, the wood density of giant fir was significantly lower compared to Douglas fir.
Douglas fir trees absorbed the most CO2 to produce butt log wood, with an average of almost 90 kg. Giant fir trees absorbed the least CO2—less than 53 kg on average; this was significantly less compared to Douglas fir and northern red oak.
Taking into account the amount of CO2 absorbed in the wood of the butt logs, the durability of the wood, and the economic and ecological aspects of conducting long-term sustainable forest management, considering the four studied non-native tree species, for breeding in Polish forests, Douglas fir seems to be the best choice. It would be advisable to conduct similar comparative studies in the future when grand fir trees reach 50 years of age, and their trunks have a higher proportion of mature wood with higher density, which should result in a higher amount of accumulated organic carbon.

Funding

This Research was financed by the Ministry of Science and Higher Education of the Republic of Poland.

Data Availability Statement

The data presented in this study are available on request from the corresponding author. The data are not publicly available due to employer requirements.

Conflicts of Interest

The author declares no conflicts of interest.

References

  1. Szymanowski, T. Zagadnienie aklimatyzacji obcych drzew w Polsce [The issue of acclimatisation of non-native trees in Poland]. Ochr. Przyr. 1959, 26, 261–319. [Google Scholar]
  2. Bialobok, S.; Chylarecki, H. Badania nad uprawą drzew obcego pochodzenia w Polsce w warunkach środowiska leśnego [Research on the cultivation of non-native trees in Poland under forest environment conditions]. Arbor. Kórn. 1965, 10, 211–277. [Google Scholar]
  3. Gazda, A. Stan badań nad obcymi gatunkami drzew w polskich lasach [Alien tree species in Polish forests: The state of the research]. Stud. Mater. CEPL Rogowie 2012, 14, 44–52. [Google Scholar]
  4. Gazda, A.; Miścicki, S.; Wąsik, R.; Goczał, J.; Kedra, K. 2017 Poland–Country report. In Non-Native Tree Species for European Forests—Experiences Risks and Opportunities, 3rd ed.; Hasenauer, H., Gazda, A., Konnert, M., Lapin, K., Mohren, F., Spiecker, H., van Loo, M., Pötzelsberger, E., Eds.; University of Natural Resources and Life Sciences: Vienna, Austria, 2017; pp. 284–297. [Google Scholar]
  5. Nowy Plan Na Rzecz Trwałego Dobrobytu W Europie I Konkurencyjności Europy [A New Plan for Sustainable Prosperity in Europe and European Competitiveness]. Available online: https://commission.europa.eu/priorities-2024-2029/competitiveness_pl (accessed on 28 December 2024).
  6. Zielony Ład—Zastał Polskę Betonową, a Zostawi Drewnianą? [Green Deal—Has He Found a Concrete Poland and Will He Leave a Wooden One?]. Available online: https://akademiaesg.pl/zielony-lad-zastal-polske-betonowa-a-zostawi-drewniana/ (accessed on 28 December 2024).
  7. Stephenson, N.L.; Das, A.J.; Condit, R.; Russo, S.E.; Baker, P.J.; Beckman, N.G.; Coomes, D.A.; Lines, E.R.; Morris, W.K.; Rüger, N.; et al. Rate of tree carbon accumulation increases continuously with tree size. Nature 2014, 507, 90–93. [Google Scholar] [CrossRef]
  8. Pan, Y.; Birdsey, R.A.; Fang, J.; Houghton, R.; Kauppi, P.E.; Kurz, W.A.; Phillips, O.L.; Shvidenko, A.; Lewis, S.L.; Canadell, J.G.; et al. A large and persistent carbon sink in the world’s forests. Science 2011, 333, 988–993. [Google Scholar] [CrossRef]
  9. Coomes, D.; Holdaway, R.; Kobe, R.; Lines, E.; Allen, R. A general integrative framework for modelling woody biomass production and carbon sequestration rates in forests. J. Ecol. 2012, 100, 42–64. [Google Scholar] [CrossRef]
  10. Gwiazdowicz, M.; Kowalczewski, T. Rola lasów w polityce klimatycznej [The role of forests in climate policy]. Studia BAS 2012, 1, 55–84. [Google Scholar]
  11. Toochi, E.C. Carbon sequestration: How much can forestry sequester CO2. For. Res. Eng. Int. J. 2018, 2, 148–150. [Google Scholar] [CrossRef]
  12. Biotronik. Przyrostomierz “Przyrost WP” (An Increment Meter “Przyrost WP”) Computer Software; Biotronik: Warsaw, Poland, 2001. [Google Scholar]
  13. Cybis Elektronik & Data AB. Cybis CooRecorder—Image Coordinate Recording Program, Version 7.6 21 October 2012; Cybis Elektronik & Data AB: Stockholm, Sweden, 2012.
  14. Cybis Elektronik & Data AB. CDendro 7.6 TEST—Cybis Dendro Dating Program, Version 7.6 21 October 2012; Cybis Elektronik & Data AB: Stockholm, Sweden, 2012.
  15. Olesen, P.O. Water displacement method, a fast and accurate method of determining the green volume of wood samples. For. Tree Improv. 1971, 3, 3–23. [Google Scholar]
  16. Ericson, B. Determination of basic density in small wood samples. An examination of some sources of error. Rapp. Uppsats. Inst. Skogsprod. Skoshogsk Stockh. 1966, 9, 1–3. [Google Scholar]
  17. Krzysik, F. Nauka o Drewnie [Wood Science]; Państwowe Wydawnictwo Naukowe: Warsaw, Poland, 1974; pp. 44–50; 403–428. [Google Scholar]
  18. The Wood Database. Available online: https://www.wood-database.com (accessed on 20 December 2024).
  19. Sowa, J.; Barszcz, A.; Kulak, D.; Stańczykiewicz, A.; Wąsik, R.; Michalec, K.; Gach, M.; Mateusiak, Ł.; Pasiowiec, W.; Kowalski, T.; et al. Zasady Kolekcjonowania Zaabsorbowanego Węgla w Drewnie Gorszej Jakości Pochodzącego z Posuszowych Drzewostanów Świerkowych I Sosnowych—Raport Końcowy [Principles for the Collection of Absorbed Carbon in Lower Quality Wood from Downy Spruce and Pine Stands—Final Report]. 2022. Available online: https://tbr.lasy.gov.pl/apex/f?p=102:3:::::P3_TEMAT:4104 (accessed on 20 December 2024).
  20. Szymański, S. Wzrost niektórych gatunków drzew leśnych w pierwszych 10 latach życia na siedlisku boru mieszanego świeżego [Growth of some forest tree species in the first 10 life years on moderately poor coniferous forest site]. Sylwan 1982, 126, 11–28. [Google Scholar]
  21. Jaworski, A. Podstawy Przyrostowe i Ekologiczne Odnawiania Oraz Pielęgnacji Drzewostanów [Basics of Incremental and Ecological Regeneration and Maintenance of Tree Stands], 1st ed.; Państwowe Wydawnictwo Rolnicze i Leśne: Warsaw, Poland, 2005; pp. 41–49. [Google Scholar]
  22. TIBCO Software Inc. Statistica (Data Analysis Software System), Version 13; TIBCO Software Inc.: Palo Alto, CA, USA. Available online: https://www.tibco.com/ (accessed on 10 October 2017).
  23. Wąsik, R. Zmienność wybranych cech makrostruktury i gęstości drewna daglezji zielonej (Pseudotsuga menziesii var. viridis Franco) na terenie Polski [Variability of macrostructure features and wood density of Douglas fir (Pseudotsuga menziesii var. viridis Franco) growing in Poland]. Drew. Prac. Nauk. Doniesienia Komun. 2007, 50, 57–85. [Google Scholar]
  24. Wasik, R.; Michalec, K.; Barszcz, A. The variability of certain macrostructural features and the density of grand fir (Abies grandis Lindl.) wood from selected stands in southern Poland. Drew. Prac. Nauk. Doniesienia Komun. 2015, 58, 45–58. [Google Scholar] [CrossRef]
  25. Adamopoulos, S.; Chavenetidou, M.; Passialis, C.; Voulgaridis, E. Effect of cambium age and ring width on density and fibre length of black locust and chestnut wood. Wood Res. 2010, 55, 25–36. [Google Scholar]
  26. Sousa, V.; Silva, M.E.; Louzada, J.L.; Pereira, H. Wood Density and Ring Width in Quercus rotundifolia Trees in Southern Portugal. Forests 2021, 12, 1499. [Google Scholar] [CrossRef]
  27. Jakubowski, M. Udział Bielu, Twardzieli Drewna Młodocianego i Dojrzałego w Strzałach Sosen Zwyczajnych (Pinus sylvestris L.) Wyrosłych w Różnych Warunkach Siedliskowych [The Share of Sapwood, Heartwood Juvenile Wood and Mature Wood in Pine Stems (Pinus sylvestris L.) in Relation to Site Conditions]. Sylwan 2004, 8, 16–24. [Google Scholar]
  28. Mutz, R.; Guilley, E.; Sauter, U.H.; Nepveu, G. Modelling juvenile-mature wood transition in Scots pine (Pinus sylvestris L.) using nonlinear mixed-effects models. Ann. For. Sci. 2004, 61, 831–841. [Google Scholar] [CrossRef]
  29. Fabisiak, E. Zmiennosc podstawowych elementow anatomicznych i gestosci drewna wybranych gatunkow drzew [Variation in basic anatomical elements and wood density of selected tree species]. Rocz. Akad. Rol. Poznaniu. Rozpr. Nauk. 2005, 369, 1–176. [Google Scholar]
  30. Hapla, F.; Kubalek, S.; Bak, M.; Nemeth, R. Timber grade oriented analysis of Abies grandis trees’ ovendry density with different growth rates part Il: Effect of the trees’ social position in the forest on the variability of ovendry density. Wood Res. 2013, 58, 361–368. [Google Scholar]
  31. Niklas, K.J. Mechanical properties of black locust (Robinia pseudoacacia) wood: Correlations among elastic and rupture moduli, proportional limit, and tissue density and specific gravity. Ann. Bot. 1997, 79, 479–485. [Google Scholar]
  32. Chylarecki, H. Daglezja w Lasach Polski: Potencjaĺ ‚Produkcyjny, Wymagania Ekologiczne, Biologia (Douglas-Fir in Polish Forests: Production Potential, Ecological Requirements, Biology), 1st ed.; Bogucki Wydawnictwo Naukowe: Poznań, Poland, 2004; pp. 1–137. [Google Scholar]
  33. Miles, P.D.; Smith, W.B. Specific Gravity and Other Properties of Wood and Bark for 156 Tree Species Found in North America, 1st ed.; U.S. Forest Service: Delaware, OH, USA, 2009; pp. 1–35.
  34. Nicolescu, V.-N.; Vor, T.; Mason, W.L.; Bastien, J.-C.; Brus, R.; Henin, J.-M.; Kupka, I.; Lavnyy, V.; La Porta, N.; Mohren, F.; et al. Ecology and management of northern red oak (Quercus rubra L. syn. Q. borealis F. Michx.) in Europe: A review. For. Int. J. For. Res. 2020, 93, 481–494. [Google Scholar] [CrossRef]
  35. Bijak, S.; Lachowicz, H. Impact of tree age and size on selected properties of black locust (Robinia pseudoacacia L.) wood. Forests 2021, 12, 634. [Google Scholar] [CrossRef]
  36. Adamopoulos, S.; Passialis, C.; Voulgaridis, E. Strength properties of juvenile and mature wood in black locust (Robinia pseudoacacia L.). Wood Fiber Sci. 2007, 39, 241–249. [Google Scholar]
  37. Pollet, C.; Verheyen, C.; Hébert, J.; Jourez, B. Physical and mechanical properties of black locust (Robinia pseudoacacia) wood grown in Belgium. Can. J. For. Res. 2012, 42, 831–840. [Google Scholar] [CrossRef]
  38. Tokarska-Guzik, B.; Dajdok, Z.; Zając, M.; Zając, A.; Urbisz, A.; Danielewicz, W.; Hołdyński, C. Rośliny Obcego Pochodzenia w Polsce ze Szczególnym Uwzględnieniem Gatunków Inwazyjnych [Alien Plants in Poland with Special Emphasis on Invasive Species], 1st ed.; Generalna Dyrekcja Ochrony Środowiska: Warsaw, Poland, 2012; pp. 109–166. [Google Scholar]
Figure 1. BDBH of the studied tree species in Class II (30 years).
Forests 16 00223 g001
Figure 2. ODWD of the studied tree species in Class II (30 years).
Forests 16 00223 g002
Figure 3. Absorbed CO2 in the butt logs of the studied tree species in Class II (30 years).
Forests 16 00223 g003
Figure 4. BDBH of the studied tree species in Class III (50 years).
Forests 16 00223 g004
Figure 5. ODWD of the studied tree species in Class III (50 years).
Forests 16 00223 g005
Figure 6. Absorbed CO2 in the butt logs of the studied tree species in Class III (50 years).
Forests 16 00223 g006
Figure 7. ODWD of the studied tree species in Class IV (70 years).
Forests 16 00223 g007
Figure 8. ODWD of the studied tree species in Class V (90 years).
Forests 16 00223 g008
Table 1. Characteristics of stands 1 where sample plots were established.
Sample Plot Number,
RDSF 2, Forest District, Forest Subdistrict
Species Composition 3 (Canopy)Age of Alien Tree SpeciesForest Type 4
GRAND FIR
1,
Kraków, Myślenice, Tokarnia
4Jd, 2GF, 1Bk, 1Św, 1 Md, 1Jd30LMG
2,
Kraków, Myślenice, Kornatka
6Jd, 4GF30LM wyż
3,
Kraków, Nawojowa, Kamianna
10GF35LG
4,
Kraków, Nawojowa, Feleczyn
8GF, 1Wz, 1DF35LG
DOUGLAS FIR
5,
Wrocław, Bardo Śląskie, Dębowina
6DF, 3Św, 1Bk90LG
6,
Wrocław, Jugów, Ścinawka Dolna
6DF, 3Św, 1Md90LMG
7,
Zielona Góra, Sława Śląska, Stare Strącze,
7DF, 2Św, 1Db86Lśw
8,
Zielona Góra, Nowa Sól, Mirocin,
4Db, 3DF, 2 So, 1Md88LMśw
NORTHERN RED OAK
9,
Lublin, Świdnik, Milejów
8NRO, 2So93LMśw
10,
Lublin, Gościeradów, Antoniów
10So, Db (MJS), NRO (MJS)65BMśw
11,
Lublin, Nowa Dęba, Poręby
8So, 1Db, 1NRO66LMw
12,
Krosno, Leżajsk, Sarzyna
6So, 2NRO67BMśw
BLACK LOCUST
13,
Katowice, Świerklaniec, Wymysłów
4Ol, 2Brz, 2Wb, 2BL61LMw
14,
Katowice, Ustroń, Dzięgielów
2Jw, 2Tp, 1Św, 2Brz, 1BL, 1Ol, 1Md67LW
15,
Kraków, Piwniczna, Zubrzyk
5Gb, 3Bk, 1Ol, 1BL71LG
1—data from Forest Data Bank: www.bdl.lasy.gov.pl/portal/en (accessed on 10 December 2024); 2—RDSF—Regional Directorate of State Forest; 3—Jd—silver fir, Bk—beech, Św—spruce, Md—larch, Wz—elm, Db—oak, So—pine, Brz—birch, Ol—alder, Wb—willow, Jw—sycamore, Tp—poplar, Gb—hornbeam, MJS—in places; 4—LMG—mixed mountain forest, LM wyż—mixed upland forest, LG—mountain forest, Lśw—fresh broadleaved forest, LMśw—mixed fresh broadleaved forest, BMśw—mixed fresh coniferous forest, LMw—mixed moist broadleaved forest, LW—upland forest.
Table 2. Basic statistics of the studied features for the trees of Class II (30 years).
SpeciesNumber of Sample PlotNumber of Sample TreesBDBH
[cm]
ODWD
[kg·m−3]
Amount of Absorbed CO2
[kg]
GF13024.4388.772.9
22916.4418.736.9
33019.9388.149.1
43021.5372.552.7
Totalmean20.6392.052.9
CoV [%]16.14.928.3
DF51823.6524.588.53
61723.4536.5104.7
72022.8575.992.2
82020.5551.371.0
Totalmean22.6547.089.1
CoV [%]6.24.015.6
NRO92916.5666.674.82
101520.6676.887.8
113019.7718.682.7
123015.9612.445.7
Totalmean18.2668.672.7
CoV [%]12.76.525.9
BL131516.4662.055.97
141418.8669.180.2
151218.9691.977.4
Totalmean18.0674.471.2
CoV [%]8.02.318.6
Table 3.p” values of M-C test, feature: BDBH (K-W test: p = 0.0000), Class II (30 years).
SpeciesGFDFNRO
DF0.2380
NRO0.02890.0000
BL0.14810.00151.0000
Table 4.p” values of M-C test, feature: ODWD (K-W test: p = 0.0000), Class II (30 years).
SpeciesGFDFNRO
DF0.0000
NRO0.00000.0000
BL0.00000.00001.0000
Table 5.p” values of M-C test, feature: absorbed CO2 (K-W test: p = 0.0000), Class II (30 years).
SpeciesGFDFNRO
DF0.0000
NRO0.02570.1241
BL0.42130.21941.0000
Table 6. Basic statistics of the studied features for the trees of Class III (50 years).
SpeciesNumber of Sample PlotNumber of Sample TreesBDBH
[cm]
ODWD
[kg·m−3]
Amount of Absorbed CO2
[kg]
DF51834.2544.5186.1
61732.8554.6193.5
71931.2594.8173.5
81927.8572.2130.2
Totalmean31.5566.5170.8
CoV [%]8.83.916.6
NRO93024.0646.3138.7
101530.5671.9185.7
111924.6718.2128.0
122521.5621.184.6
Totalmean25.1664.4134.2
CoV [%]15.16.231.0
BL13522.1661.998.6
141026.0672.9150.0
15626.8698.9157.6
Totalmean25.0677.9135.4
CoV [%]10.22.823.7
Table 7.p” values of M-C test, feature: DBH (K-W test: p = 0.0000), Class III (50 years).
SpeciesDFNRO
NRO0.0000
BL0.04700.3441
Table 8.p” values of M-C test, feature: ODWD (K-W test: p = 0.0000).
SpeciesDFNRO
NRO0.0000
BL0.00001.0000
Table 9.p” values of M-C test, feature: absorbed CO2 (K-W test: p = 0.0003), Class III (50 years).
SpeciesDFNRO
NRO0.0002
BL0.14501.0000
Table 10. Basic statistics of the studied features for the trees of Class IV (70 years).
SpeciesNumber of Sample PlotNumber of Sample TreesBDBH
[cm]
ODWD
[kg·m−3]
Amount of Absorbed CO2
[kg]
DF51634.2559.4191.5
61739.5565.4278.9
71936.9595.6240.7
81927.8574.8130.7
Totalmean34.6573.8210.5
CoV [%]14.52.830.4
NRO92233.9653.8247.4
101132.3660.9206.7
Totalmean33.1657.4227.0
CoV [%]3.30.812.7
Table 11. Basic statistics of the studied features for the trees of Class V (90 years).
SpeciesNumber of Sample PlotNumber of Sample TreesBDBH
[cm]
ODWD
[kg·m−3]
Amount of Absorbed CO2
[kg]
DF51545.3558.2339.34
61545.3583.0364.5
71641.3590.0296.4
81836.7569.1225.2
Totalmean42.2575.1306.4
CoV [%]9.72.519.9
NRO91442.3649.5373.2
10538.7661.2286.6
Totalmean40.5655.3329.9
CoV [%]6.21.318.6
Disclaimer/Publisher’s Note: The statements, opinions and data contained in all publications are solely those of the individual author(s) and contributor(s) and not of MDPI and/or the editor(s). MDPI and/or the editor(s) disclaim responsibility for any injury to people or property resulting from any ideas, methods, instructions or products referred to in the content.

