Article

Optimizing UAV-LiDAR Point Density for Eucalyptus Height Estimation in Agroforestry

by
Ernandes Macedo da Cunha Neto
1,*,
Emmanoella Guaraná
2,
Marks Melo Moura
1,
Hudson Franklin Pessoa Veras
3,
Angélica Maria Almeyda Zambrano
4,
Eben North Broadbent
5,
Emanuel Maia
6,
Allan Libanio Pelissari
1,
Luciano Rodrigo Lanssanova
7,
Carlos Roberto Sanquetta
1 and
Ana Paula Dalla Corte
1
1
Biofix Lab, Department of Forest Science, Federal University of Paraná, Av. Prefeito Lothário Meissner, 632-Jardim Botânico, Curitiba 80210-170, PR, Brazil
2
Department of Forest Science, Federal Rural University of Pernambuco, Rua Manuel de Medeiros, s/n-Dois Irmãos, Recife 52171-900, PE, Brazil
3
Department of Forest Science, Federal Institute of Education Science and Technology of Acre, Av. Brazil, 920-Xavier Maia, Rio Branco 69906-310, AC, Brazil
4
Spatial Ecology and Conservation Lab, Latin American Studies, University of Florida, Gainesville, FL 32611, USA
5
Spatial Ecology and Conservation Lab, School of Forest Resources and Conservation, University of Florida, Gainesville, FL 32611, USA
6
Laboratory of Economics and Carbon in Agroecosystems (LECarbon), Department of Forest Science, Federal University of Rondônia, Av. Norte Sul, nº 7300, Nova Morada, Rolim de Moura 76940-000, RO, Brazil
7
Science and Technology of Mato Grosso, Federal Institute of Education, Juína 78320-000, MT, Brazil
*
Author to whom correspondence should be addressed.
Forests 2025, 16(11), 1747; https://doi.org/10.3390/f16111747
Submission received: 21 October 2025 / Revised: 7 November 2025 / Accepted: 13 November 2025 / Published: 19 November 2025

Abstract

The demand for forest materials necessitates advancements in forest management and inventory practices. We explore the integration of Unmanned Aerial Vehicles (UAVs) equipped with LiDAR sensors as a cost-effective alternative for precise forest monitoring. It evaluates the impact of varying point cloud densities on the accuracy of individual tree height estimation in Eucalyptus benthamii within Crop–Livestock–Forestry systems (15.9 ha and 357 individuals·ha−1). We use a DJI M600 Pro UAV with a Velodyne 32c Ultra Puck LiDAR sensor at the Center for Technological Innovation in Agriculture (NITA) in Brazil. The resulting point clouds were processed to generate Digital Terrain Models and Canopy Height Models at densities ranging from 5 to 2000 points per square meter (pts·m−2). Statistical analyses, including Pearson correlation, root mean square error, and bias, were conducted to compare UAV-LiDAR-derived heights with field measurements. We found that reduced point densities, particularly around 100 pts·m−2, maintained high accuracy in height estimation (RMSE = 17.129%, BIAS = −7.889%), with more than 90% in trees’ detection. UAV-LiDAR systems with optimized point cloud densities offer a viable solution for forest monitoring. 100 pts·m−2 is an optimal density, promoting faster data collection, lower battery consumption, and reduced computational costs on trees’ height estimates.

1. Introduction

The increasing demand for wood materials has necessitated significant advancements in traditional forest management (rational use of forest resources) and inventory practices, driven by the need to acquire accurate and comprehensive forest information promptly and cost-effectively [1]. As global forestry operations strive for efficiency, accuracy, and cost-effectiveness, the integration of cutting-edge technologies becomes imperative [2,3]. Recent developments have propelled forest management towards the 4.0 frontier, leveraging sophisticated tools and advanced technology for comprehensive forest information acquisition. This includes phytosanitary monitoring and mortality inventory of the stand, necessitating the collection of highly detailed information remotely [2,3,4,5,6].
Integrating data from traditional forest inventory with the demands of geospatial mapping can pose additional challenges for precision forestry management. Consequently, employing technologies like remote sensing and Light Detection and Ranging (LiDAR), when precisely calibrated, can be more seamlessly integrated with data gathered by contemporary harvesting equipment. This integration provides a dataset that better supports spatiotemporal analysis and enhances the efficiency of large-scale (>1000 ha) plantation operations [7,8].
One of the significant advantages of these techniques is their spatial resolution, which allows for periodic measurement of the entire forest (census), unlike conventional techniques that rely on sampling units [9,10]. Among these tools, active remote sensing, particularly LiDAR, has been consistently applied to measure large forest areas (>1000 ha) [10,11]. This technology facilitates the measurement of various forest metrics (e.g., tree height, volume, basal area, and tree diameter) and the three-dimensional representation of both individual trees and entire groups [4,11,12,13,14,15].
Despite its versatility, ALS remains an expensive technology, limiting its application in large areas and continuous forest inventories that operate on a multi-temporal scale [16]. Thus, the use of unmanned aerial vehicles (UAVs) equipped with cameras offers a cost-effective alternative for periodic forest monitoring [17,18,19,20,21]. However, the UAV + camera system does not match the accuracy of ALS, as passive sensors fail to capture precise information from the ground and within the forest [22,23,24,25]. To address this issue and reduce data acquisition costs, LiDAR sensors have recently been integrated with UAVs [12,26,27].
The pioneering project that combined LiDAR sensors with UAVs was conducted by [28], which achieved point clouds with densities ranging from 100 to 1500 points·m−2, utilized to identify individual trees. Since then, numerous studies have explored the potential of UAV-LiDAR, including the measurement of tree diameter at breast height [4]. Therefore, it is essential to assess the impact of point density on the accuracy of forest metrics, particularly for individual trees, to determine the density thresholds that can be reduced without compromising accuracy [26,29,30]. Also, few studies have systematically quantified the minimum viable LiDAR density in tropical agroforestry systems.
ALS systems seldom achieve high densities (>10 pts·m−2); hence, it is critical to evaluate the impact of point density on UAV-LiDAR systems, which typically result in point clouds with extremely high densities (>800 pts·m−2) [4]. This evaluation will aid in defining operational costs for data acquisition and ensuring accuracy in forest measurements, thereby promoting the development of Forest Management and Inventory 4.0 [4,10,31].
In this context, this study hypothesizes that there exists an optimal density of UAV-LiDAR point clouds that provide accuracy comparable to the maximum cloud density. Therefore, the objective of this work was to evaluate the performance of different densities of UAV-LiDAR point clouds in estimating the individual height of Eucalyptus benthamii Maiden et Cambage in Crop–Livestock–Forestry systems.

2. Materials and Methods

2.1. Study Area, Forest Inventory and UAV-LIDAR

The study was conducted at the Center for Technological Innovation in Agriculture (NITA) project, located at the Canguiri experimental station in the municipality of Pinhais, Paraná, Brazil (Figure 1), with central coordinates 25°23′30″ S and 49°07′30″ W. The region’s climate is classified as humid subtropical-Cfb according to the Köppen classification, with an average annual precipitation of 1550 mm, an average temperature of 17 °C, and an altitude of 935 m [32]. The predominant soils in the region are Cambisols, Oxisols, Organosols, and Gleisols [33]. NITA comprises 35 ha; however, in this study, only 15.79 ha were evaluated. The assessed area includes three management systems containing the forestry component: Livestock-Forest (PF), Crop-Forest (LF), and Crop-Livestock-Forest (LPF). Approximately 5.27 ha for each system.
In these three systems, the forest component comprises the species Eucalyptus benthamii Maiden et Cambage, planted along a contour line in 2012, with a simple row arrangement, and an initial spacing of 14 m between rows and 2 m between plants (357 individuals·ha−1) [34]. It is worth noting that the stand was thinned after 44 months, with the intensity of 44% [34].
A comprehensive inventory of the area was conducted in September 2019, measuring the circumference at 1.30 m from the ground (CBH), which was converted to diameter at breast height (DBH) after dividing it by pi, and the total height (h) of all the trees (census) using a centimeter tape and a SWE Haglöf Vertex IV® hypsometer (resolution of 0.1 m − error range = ±1–2 m). Additionally, the geographic position of the trees (1869 trees) was recorded using a BRA Garmin 62CSX GPS (accuracy ± 1 m).
The UAV-LiDAR data were collected in September 2019 using the GatorEye system, which consists of a USA DJI M600 Pro UAV, USA Velodyne 32c Ultra Puck LiDAR sensor, USA STIM300 inertial system, L1/L2 receiver, and SSD. This system features 32 lasers with a range of up to 220 m, and produces almost 1.2 million points per second [4,35]. The flight was conducted at a speed of 8 m/s, with 15 m between flight lines (90% overlap) and a flight height of 45 m, generating 120.66 million points with a maximum density of 2000 points.m−2. Approximately 25 flights were operated.

2.2. Comparison Between Heights Derived from the Point Cloud and Field Measures

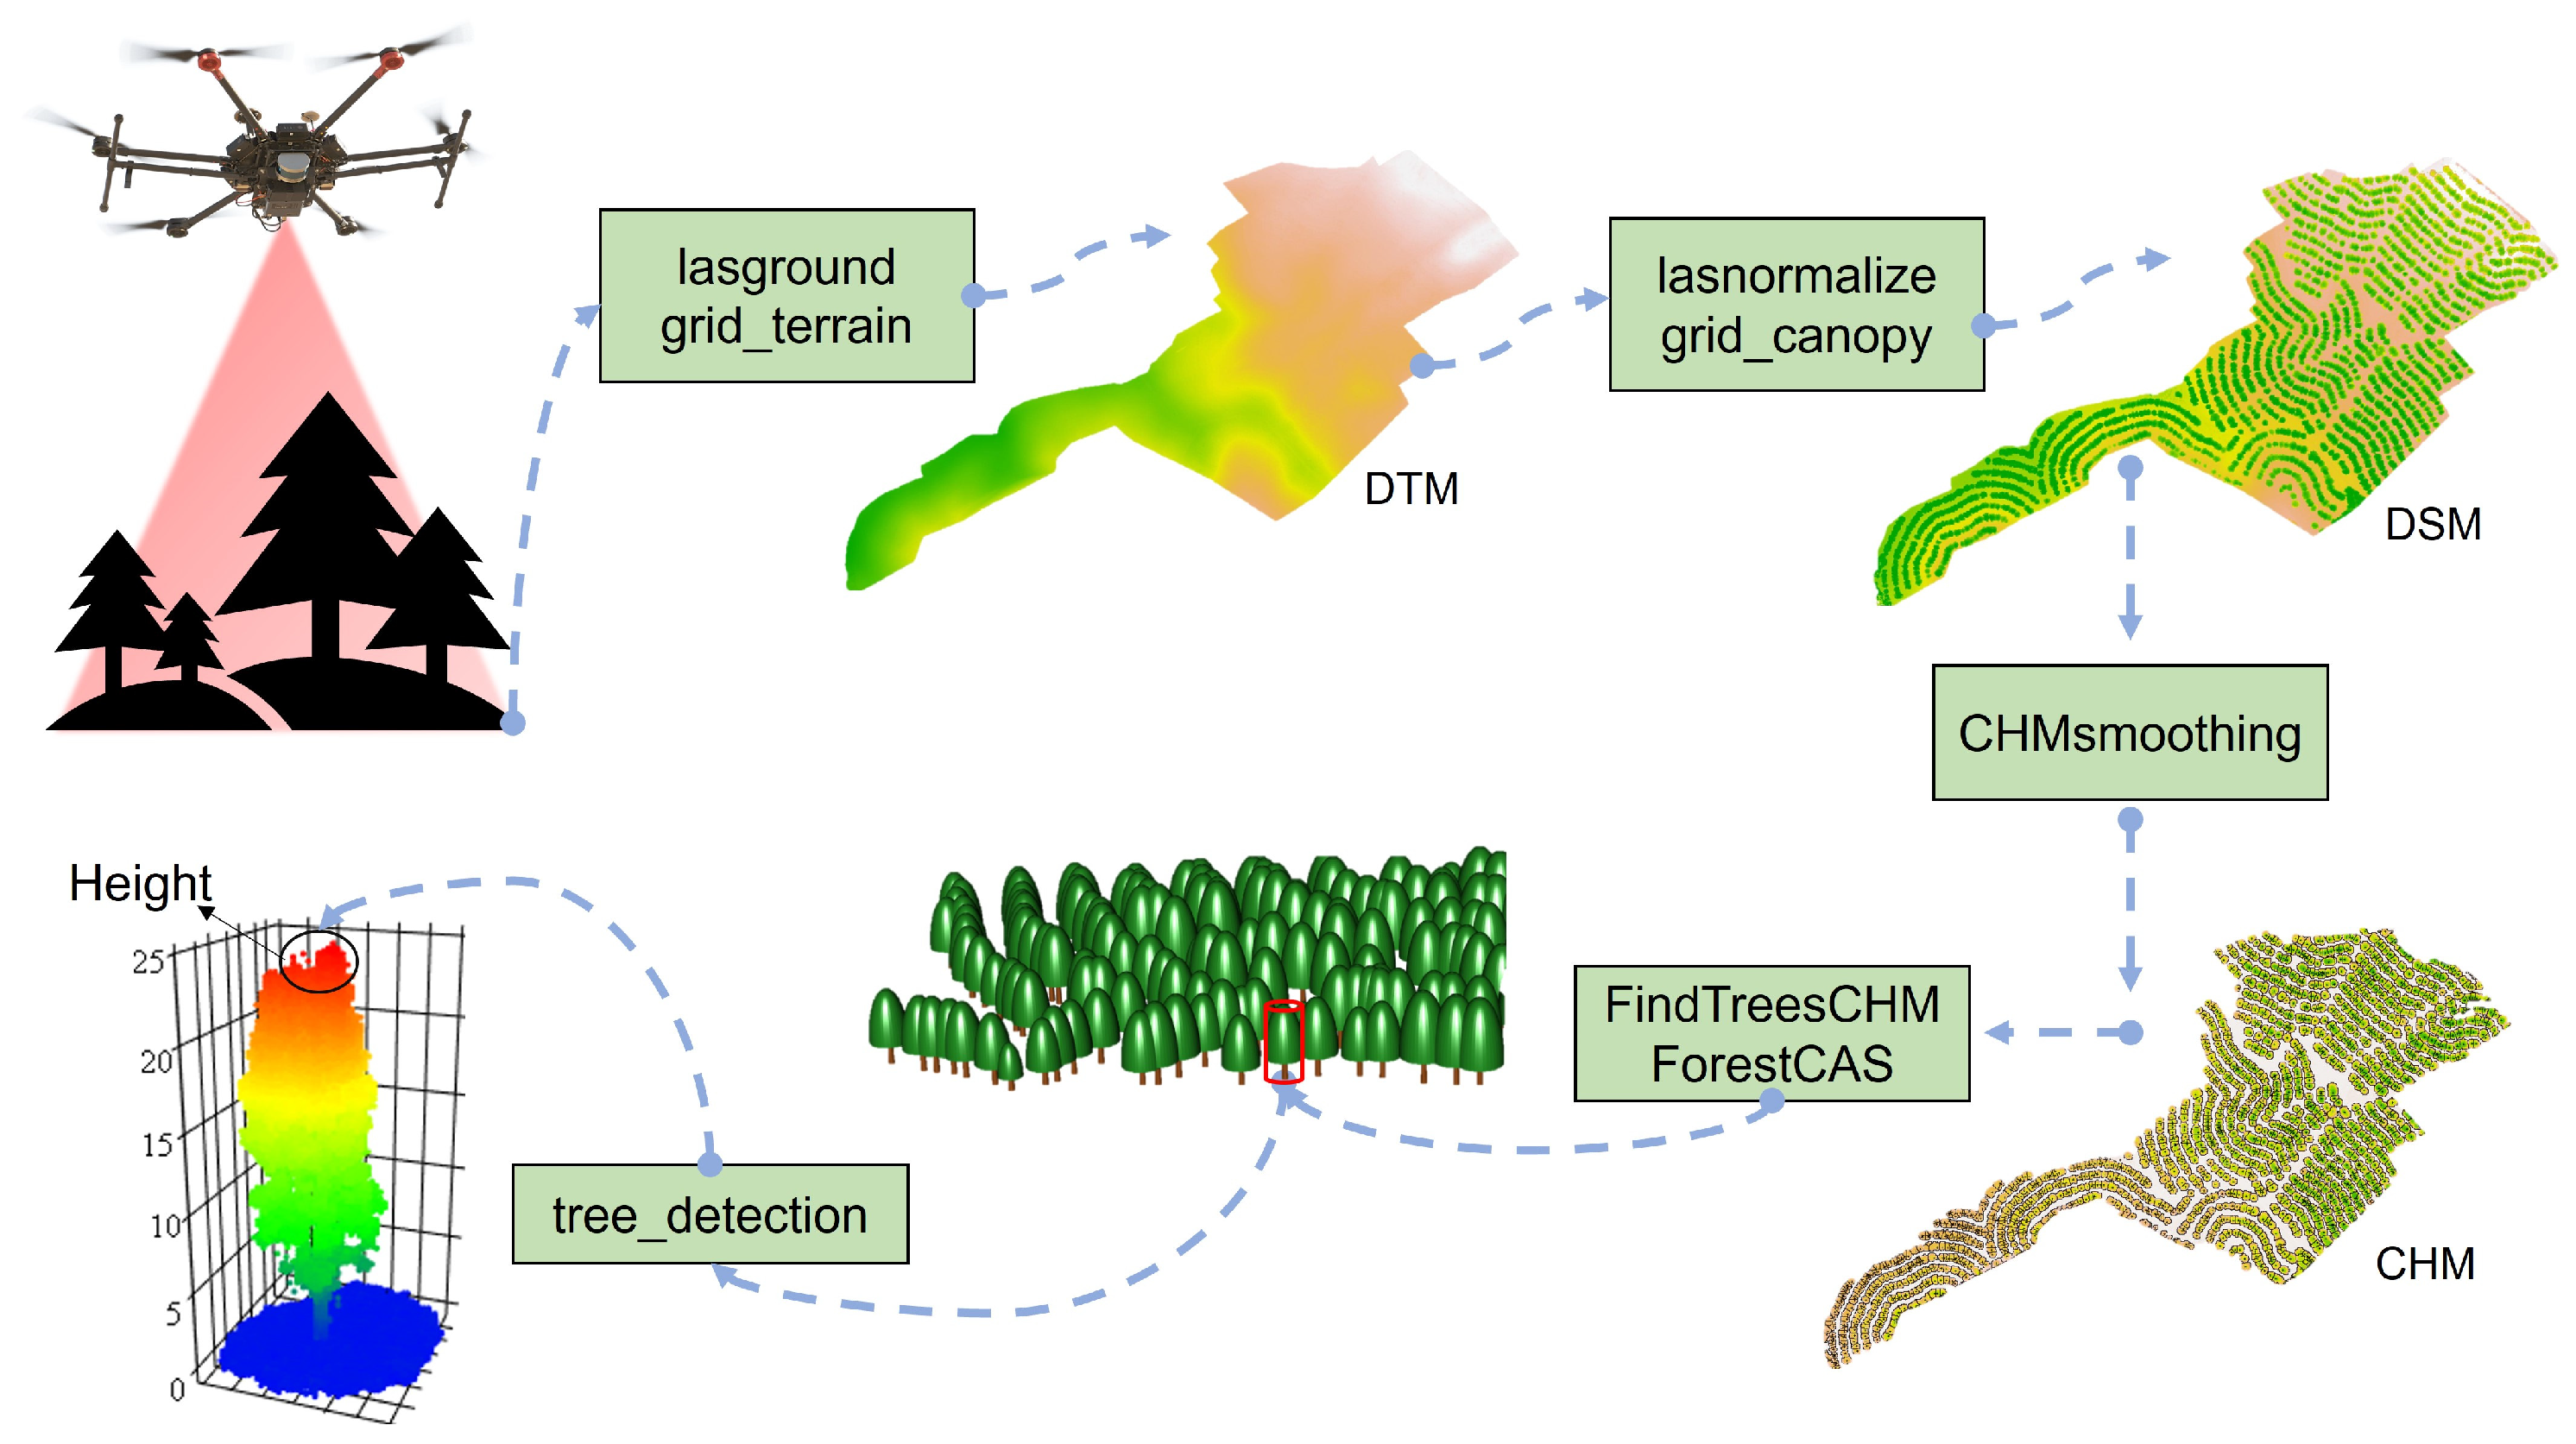
Pre-processing of the point cloud was performed using LASTOOLS software Version 1.8, where the cloud was merged and cropped to the study area using the LASMERGE and LASCLIP functions [36]. Subsequently, the data were processed in the R programming language [37] using the lidR [38] and rLiDAR [39] packages (Figure 2). We use an Avell notebook with 64 GB of RAM, an Intel Core i9 processor, 36 MB of cache, and an NVIDIA GeForce RTX 4080 graphics card with 8 GB (NVIDIA, Santa Clara, CA, USA).
The point cloud was homogenized into nine densities, commonly found in the literature: 2000, 1500, 1000, 500, 250, 100, 50, 25, and 5 points·m−2 using the ‘lasfilterdecimate’ function by spatially uniform selection, ensuring the robustness of the database [38]. The points were classified and separated according to terrain and surface to generate the Digital Terrain Model (DTM) and normalize the cloud [38]. The functions ‘lasground’, ‘lasnormalize’, ‘grid_terrain’, and ‘grid_canopy’ were used.
Subsequently, the Digital Surface Model (DSM) and Canopy Height Model (CHM) were generated, applying a Gaussian-type smoothing filter with sigma 0.5 by the function ‘CHMsmoothing’ to remove possible noises and trees with a height below those measured in the field [40]. The normalized clouds and Smoothed CHMs were combined to derive the trees’ crown area, treetop and assess individual tree heights with the ‘FindTressCHM’ function. So, we use a spatial join function to join by position the heights measured in the field and derived by UAV-Lidar
The algorithm use the maximum height of the trees was then extracted based on the highest pixel present in the tree crown areas on the CHM and the normalized cloud, which also facilitated the counting of individuals [39].
The precision and accuracy of the tree heights derived from the UAV-LiDAR and those measured in the field were evaluated using statistical metrics: Pearson correlation coefficient (r)—Equation (1), root mean square error (RMSE)—Equation (2), bias—Equation (3), graphical analysis, and paired t-test [4,25,31,40]. The t-test was applied to test the following hypotheses: H0 = the heights derived by the UAV-LiDAR system are statistically similar to the heights measured in the field, H1 = the heights derived by the UAV-LiDAR system are statistically different from the heights measured in the field. To evaluate the performance of heights derived from the point cloud by height class, bias and RMSE metrics were applied.
r = i = 1 n y i y ¯ y i ^ y ^ ¯ i = 1 n y i y ¯ 2 i = 1 n y i ^ y ^ ¯ 2
R M S E   ( % ) = 100 y ¯ i = 1 n ( y i y ^ i ) 2 n
B i a s   ( % ) = 100 y ¯   i = 1 n ( y i y ^ i ) n
where y i is the field-based tree height of the ith tree; y ¯ is mean of field-based tree heights; y ^ i is UAV-Lidar-derived tree height of the ith tree; and n is the sample size (1869 trees).
The Tukey test at a 5% significance level was used to determine whether there were differences between the heights derived at different point densities, enabling the definition of an ideal density. Additionally, to assess the influence of heights derived from point clouds, these measurements were incorporated into the individual tree volume formula, allowing for the inference of their impact on the forest’s volumetric stock, using a shape factor of 0.45 (v = DBH × h × ff) [41,42]. We obtained wood stock by the product of the trees’ number (n) and those mean individual volume (Vmi). The volume by area (V), we found by the Quotient of wood stock and the field area.

3. Results

3.1. Evaluation of Height Estimated on Forest Inventory and UAV-Lidar

The minimum height measured in the forest inventory was 11.10 m, while the maximum was 26.20 m. The heights derived by LiDAR presented values similar to the forest inventory (Table 1). The standard deviations (SD) of the derived heights ranged between 3.66 and 4.45, with standard errors (SE) between 0.088 and 0.017. The highest coefficient of variation (CV) was evident for the density of 25 pts·m−2, while 2000 and 1500 pts·m−2 obtained CV similar to the field data (Table 1). In general, all densities underestimated heights in the classes with class centers at 17.5 m and 22.5 m, while they overestimated the classes at 7.5 m, 12.5 m, and 27.5 m, except for 2000 pts·m−2, which underestimated the frequency of individuals in the 7.5 m class.
The density with the lowest error in the total number of individuals was 25 pts·m−2, followed by 1000 pts·m−2. The densities 1500, 1000, 100 and 25 pts·m−2 obtained a difference of less than 140 trees identified on the crop system. However, all the densities are overestimated on the 7.5, 12.5 m and 27.5 m classes, as well as underestimate in the 17.5 m, and 22.5 m classes (Table 2). In general, the UAV-LiDAR was able to identify more than 90% of individuals from Eucalyptus benthamii.
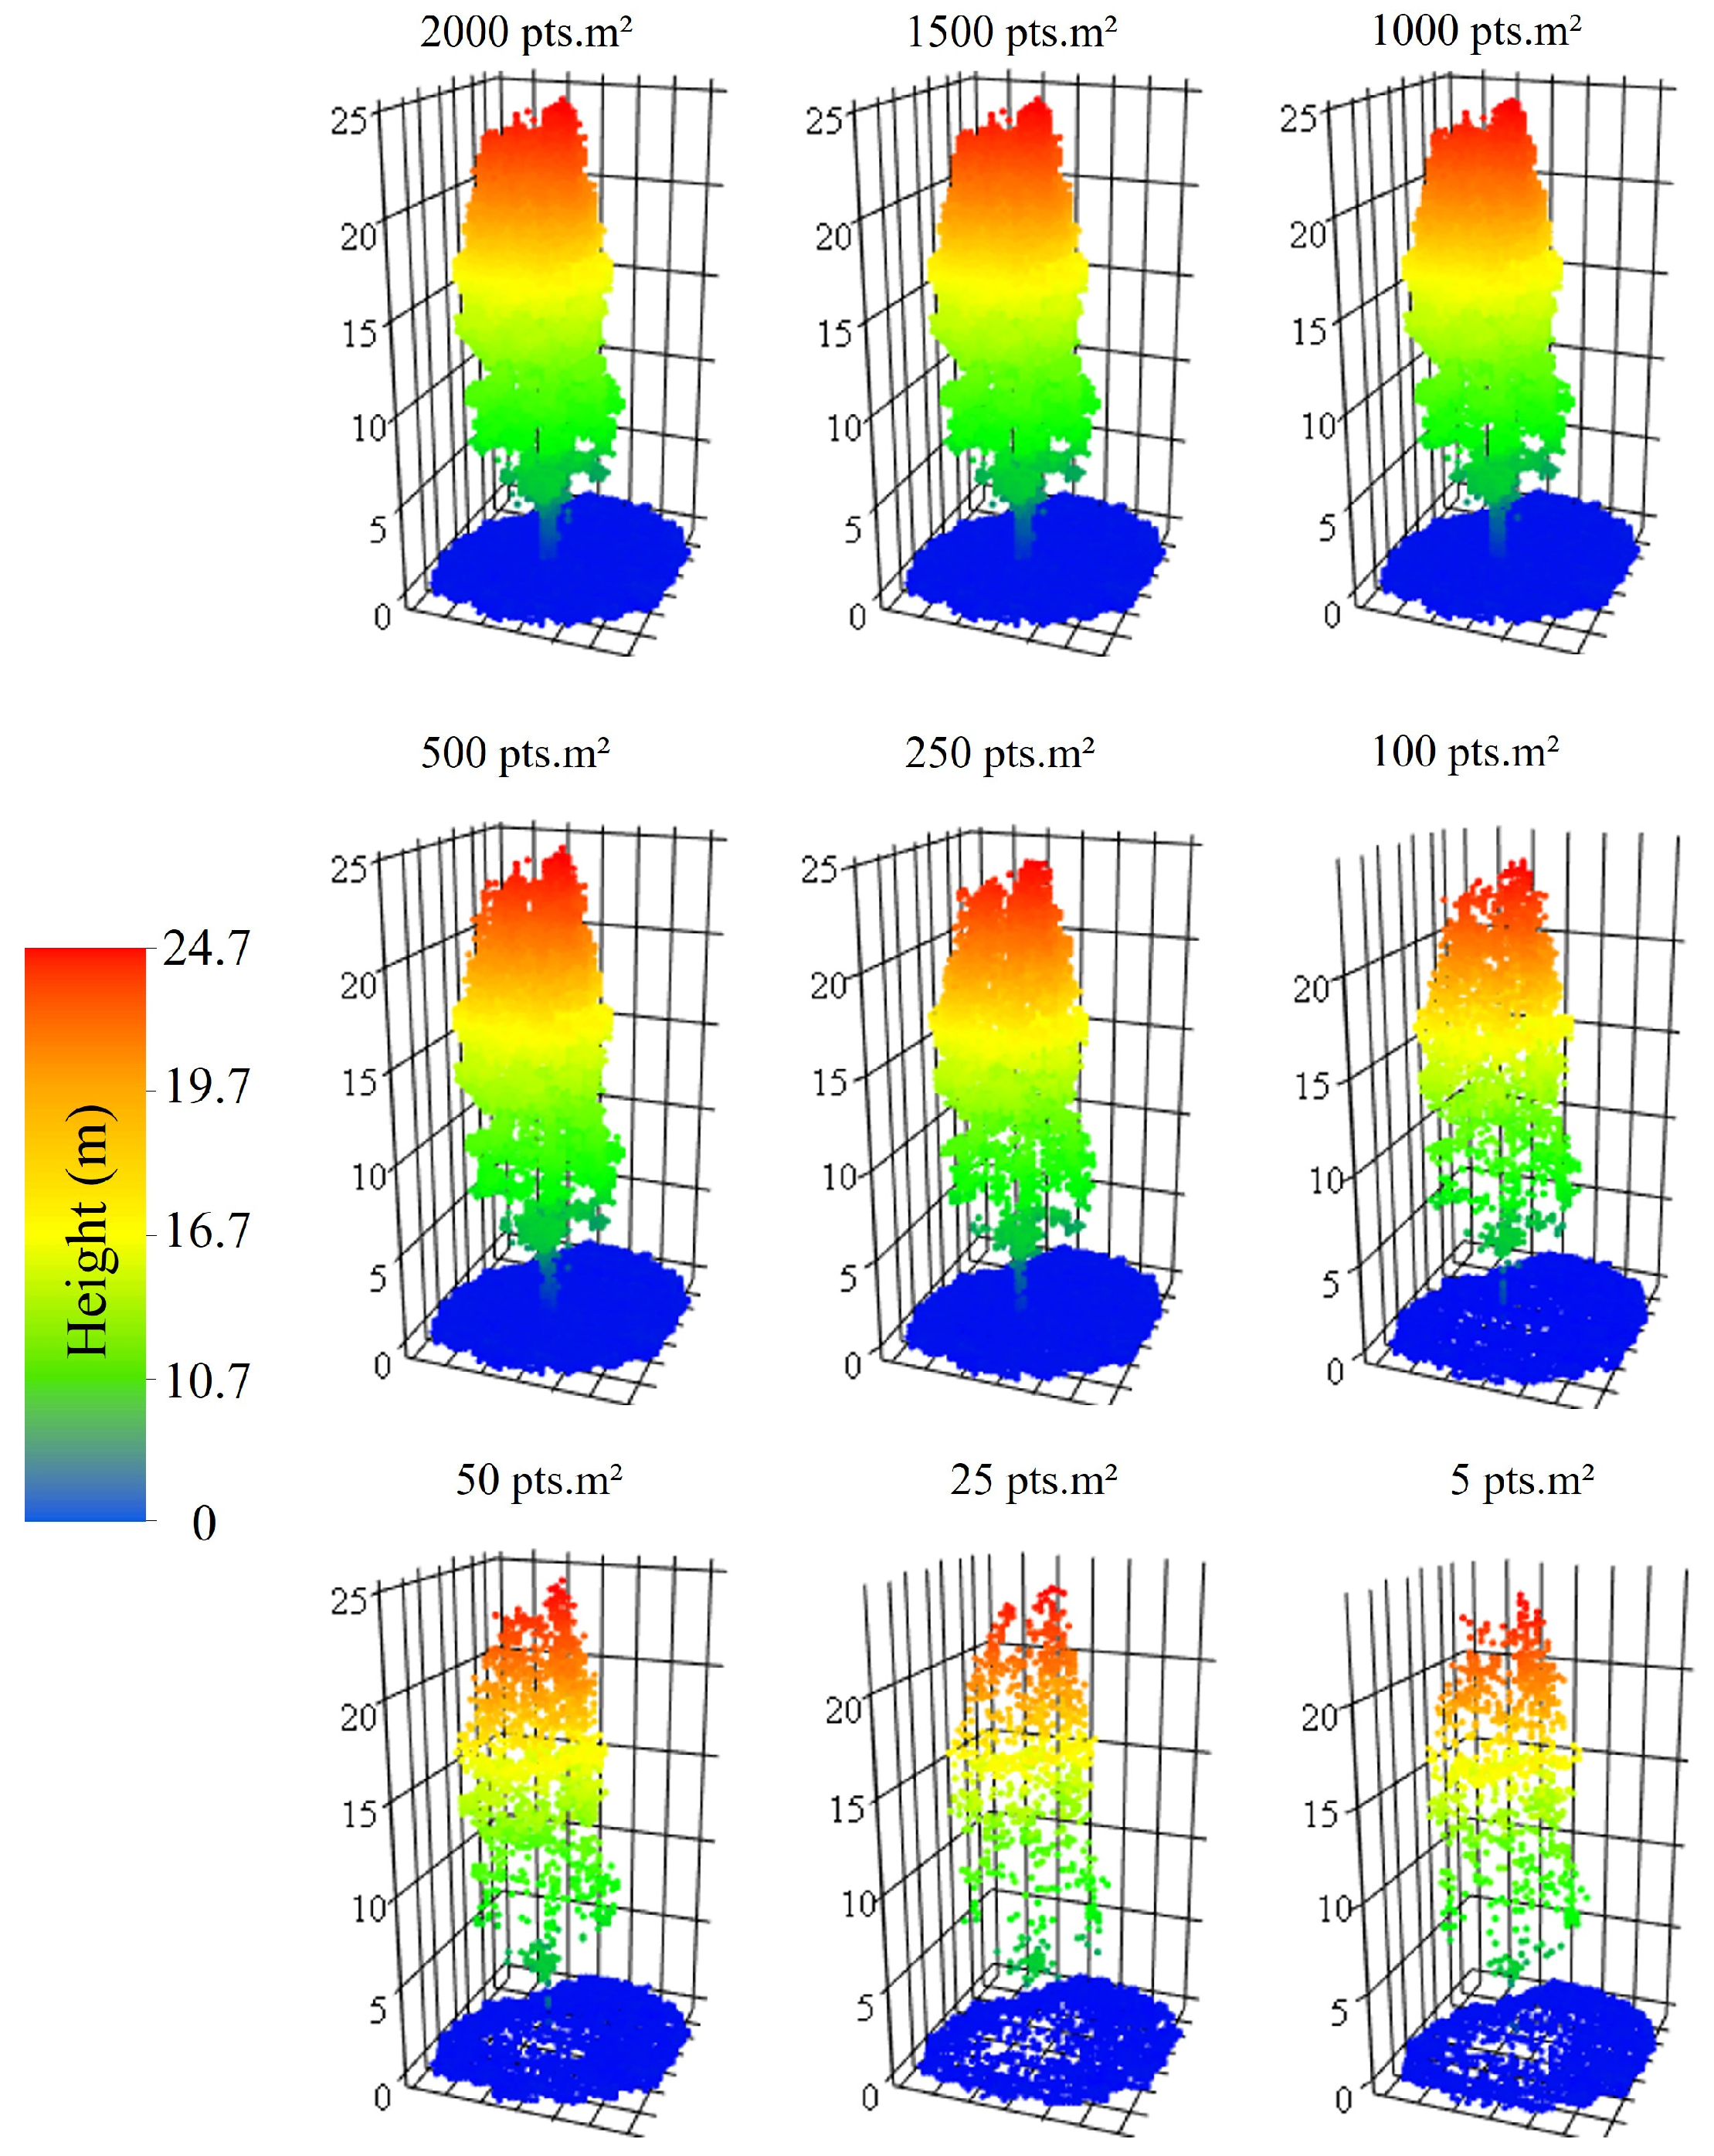
It was found that 2000 pts·m−2 represented the shape of the tree and the relief in detail, so that when reducing the density of points, information on the shape of the stem, crown and height of the tree is lost, as well as returns that favor the representation of the relief (Figure 3).
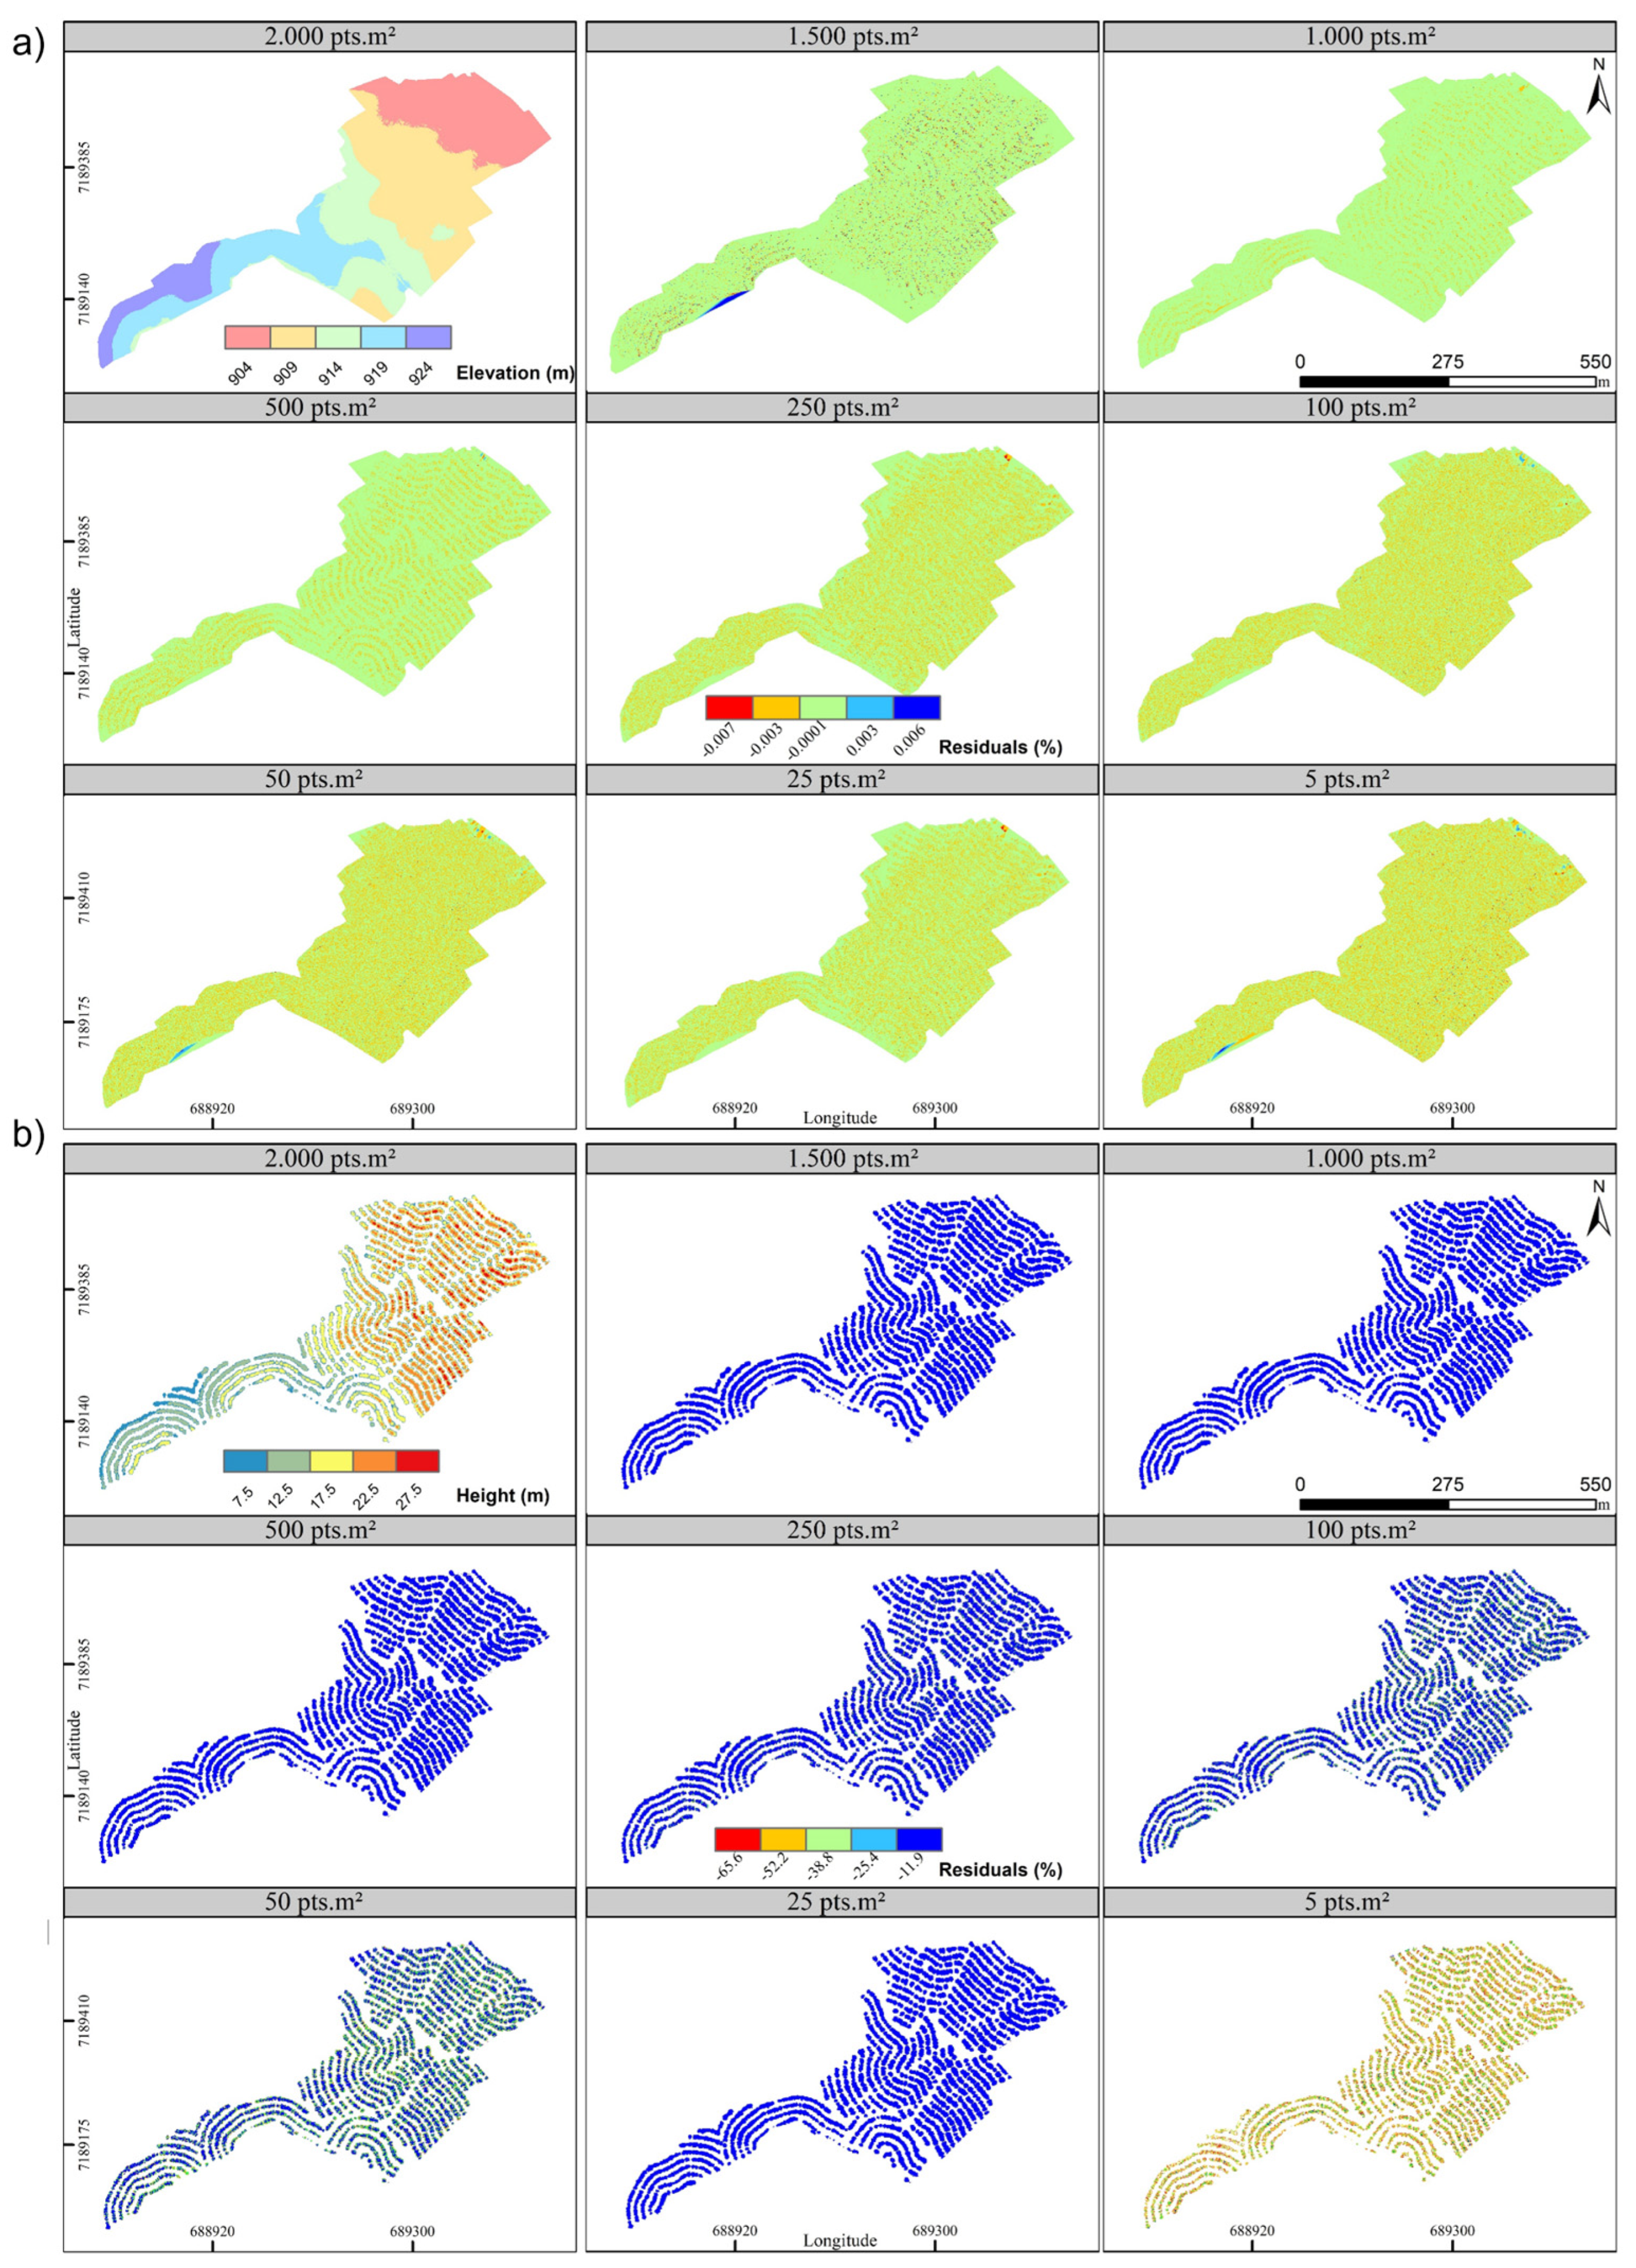
In addition to the representation of the tree, the density of points caused few differences in the digital terrain model (DTM) (Figure 4a), with discrepancies of up to 0.06% between the elevation of the highest density (2000 pts·m−2) and the others. Between 2000 and 1500 pts·m−2, the differences remain close to 0%, while 1000, 500, 250, and 100 pts·m−2 are close to 0.003%, which are located southwest of the study area. For 50 pts·m−2, 25 pts·m−2, and 5 pts·m−2, the differences are around −0.007%, also located in the southwest of the project as the other densities.
In the digital canopy model, the density of 2000 pts·m−2 showed heights of up to 27.5 m (Figure 4b). For densities down to 25 pts·m−2, there is a predominance of differences on height close to the −11.9% error class, with some pixels showing greater differences distributed throughout the area. On another hand, 5 pts·m−2 showed predominant differences of −52.2% relative to the density of 2000 pts·m−2 (Figure 4b).

3.2. Comparison Between Heights Derived from the Point Cloud and Field Measures

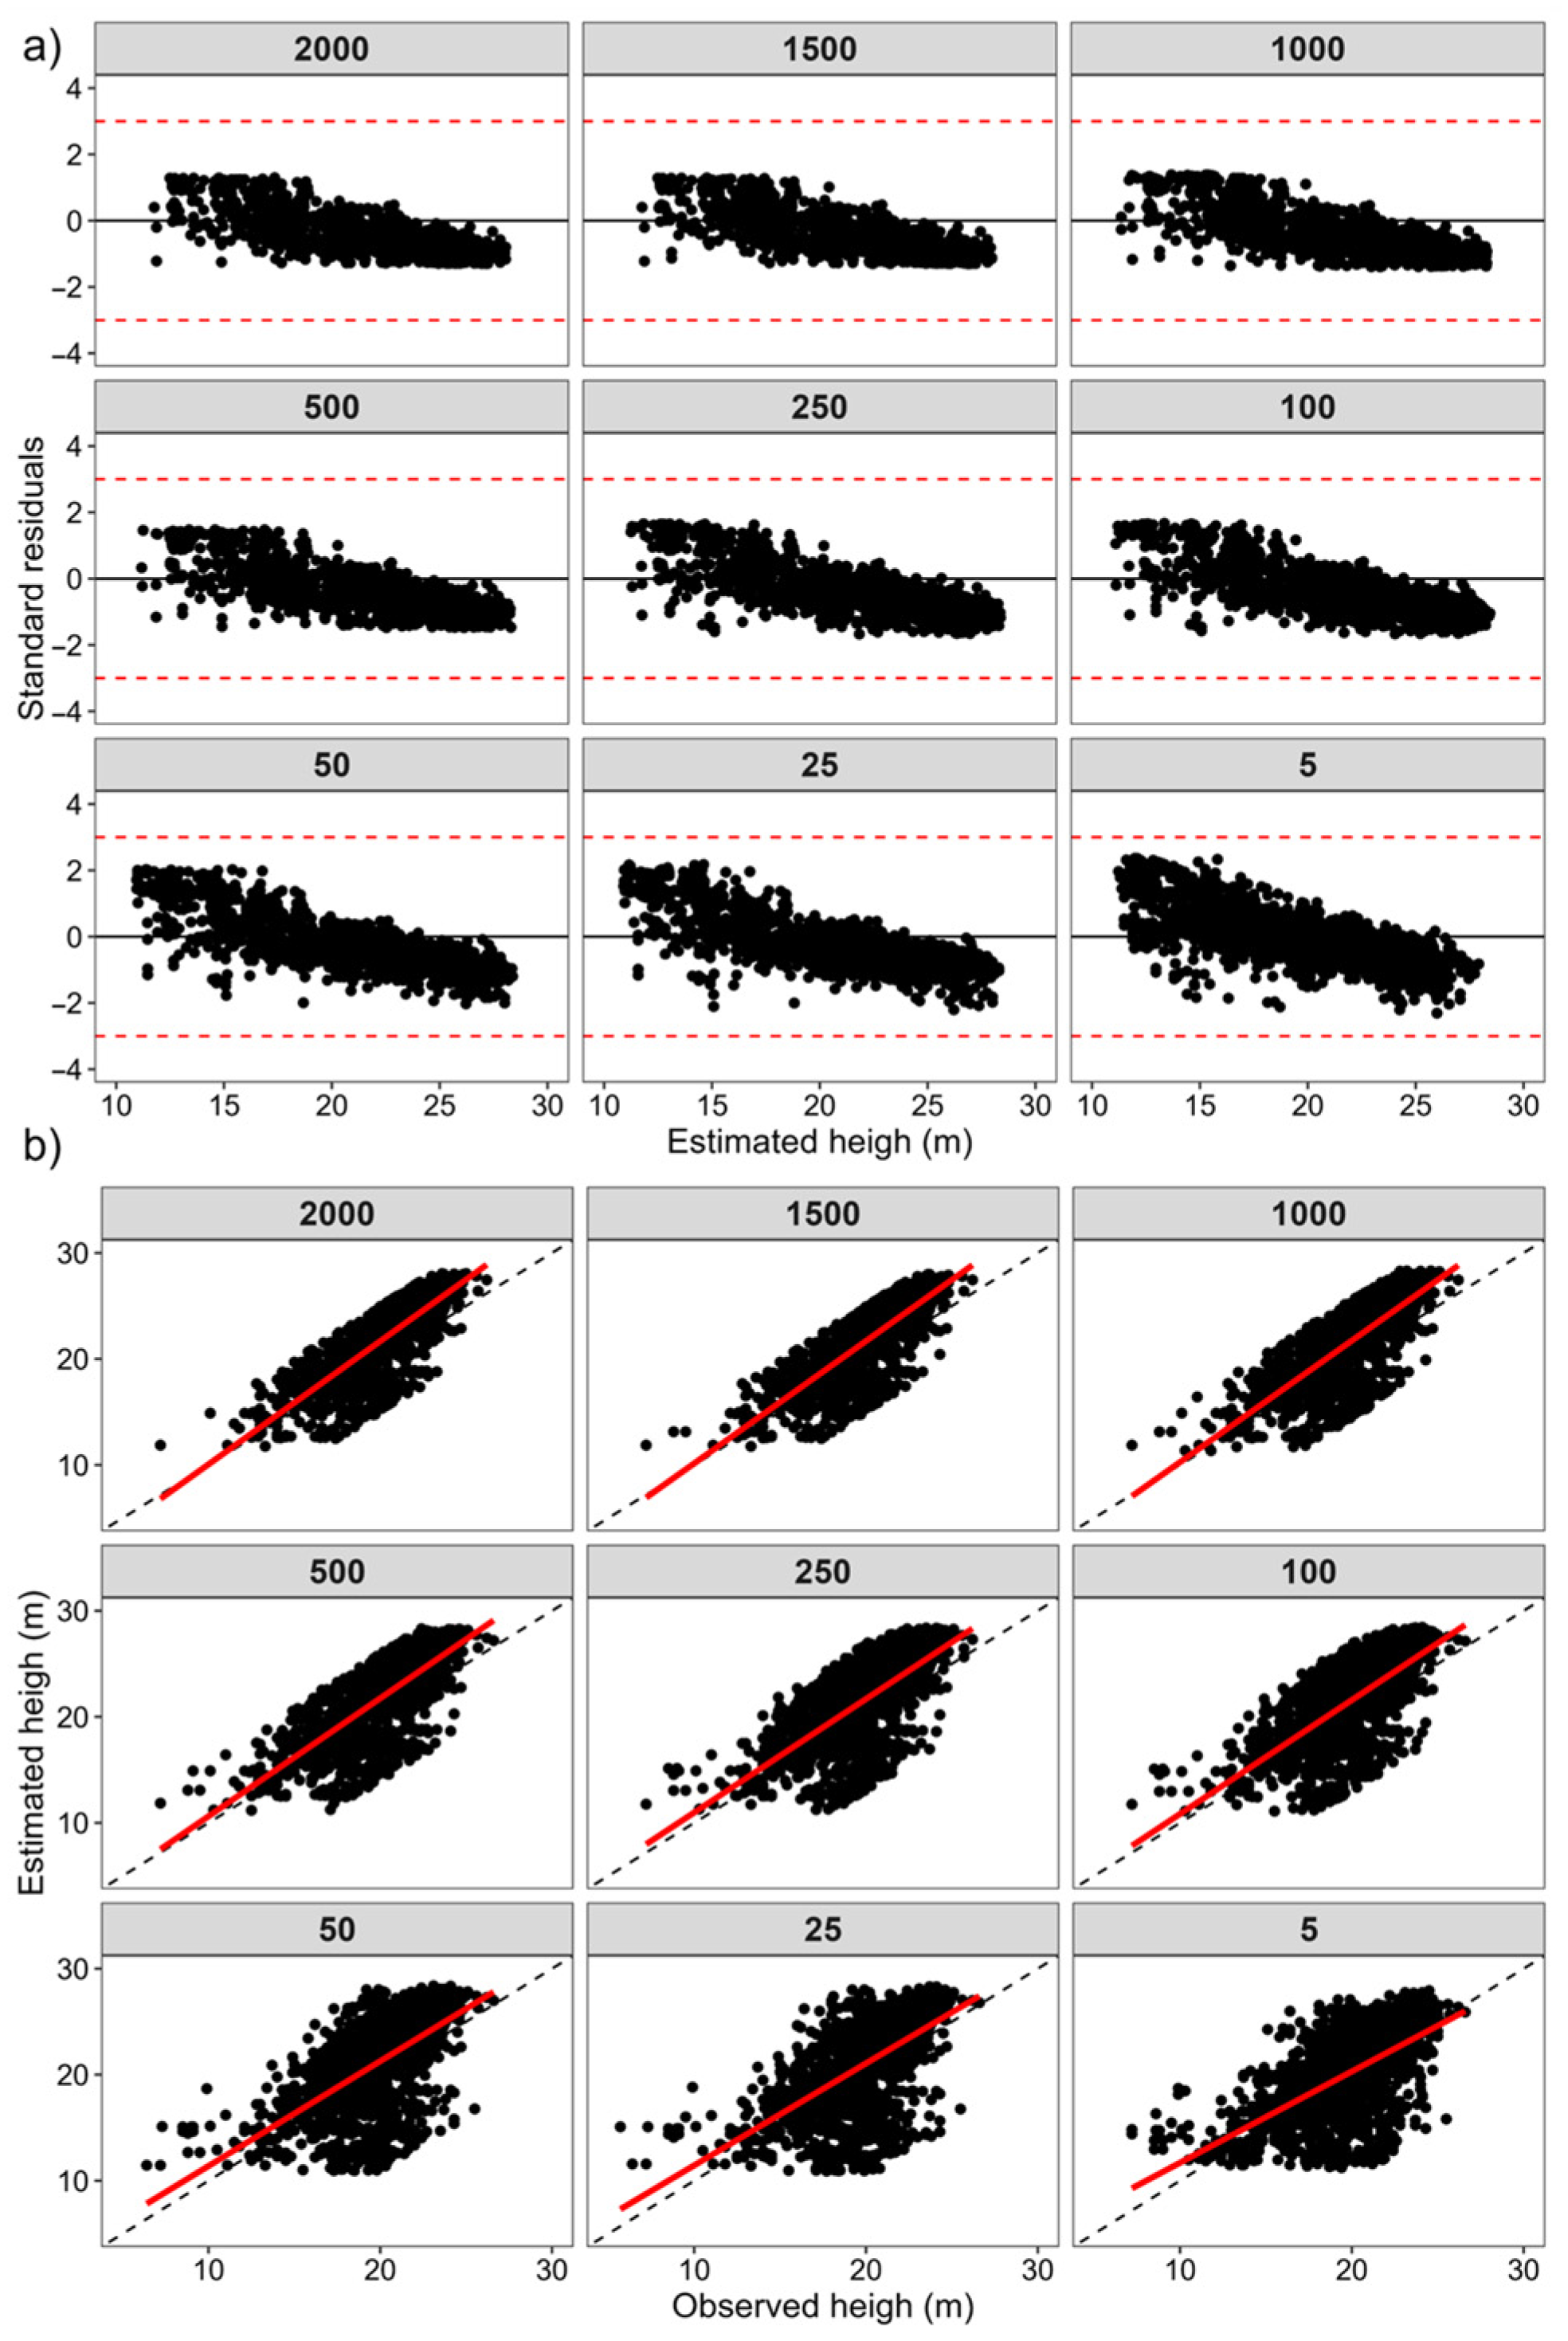
The greatest correlation between the heights measured in the field inventory (FI) and those derived by the UAV-LiDAR was evident for the density of 2000 pts·m−2; as density decreased, so did the correlation. The lowest RMSE was 14.55% for the density of 2000 pts·m−2. As density decreased, RMSE increased. All densities tended to overestimate heights (Table 1 and Figure 5). Despite this, at all densities, the derived and measured heights were statistically similar (Table 3).
Overall, the residuals showed trends on the dispersion, concentrating between −3 and 3 deviations (Figure 5a), particularly at the lowest densities (50 pts·m−2, 25 pts·m−2, and 5 pts·m−2). The dispersion of heights denotes the accuracy of densities 2000 pts·m−2, 1500 pts·m−2, and 1000 pts·m−2, as well as biased estimates for densities 50 pts·m−2, 25 pts·m−2, and 5 pts·m−2, tending to overestimate heights (Figure 5b).
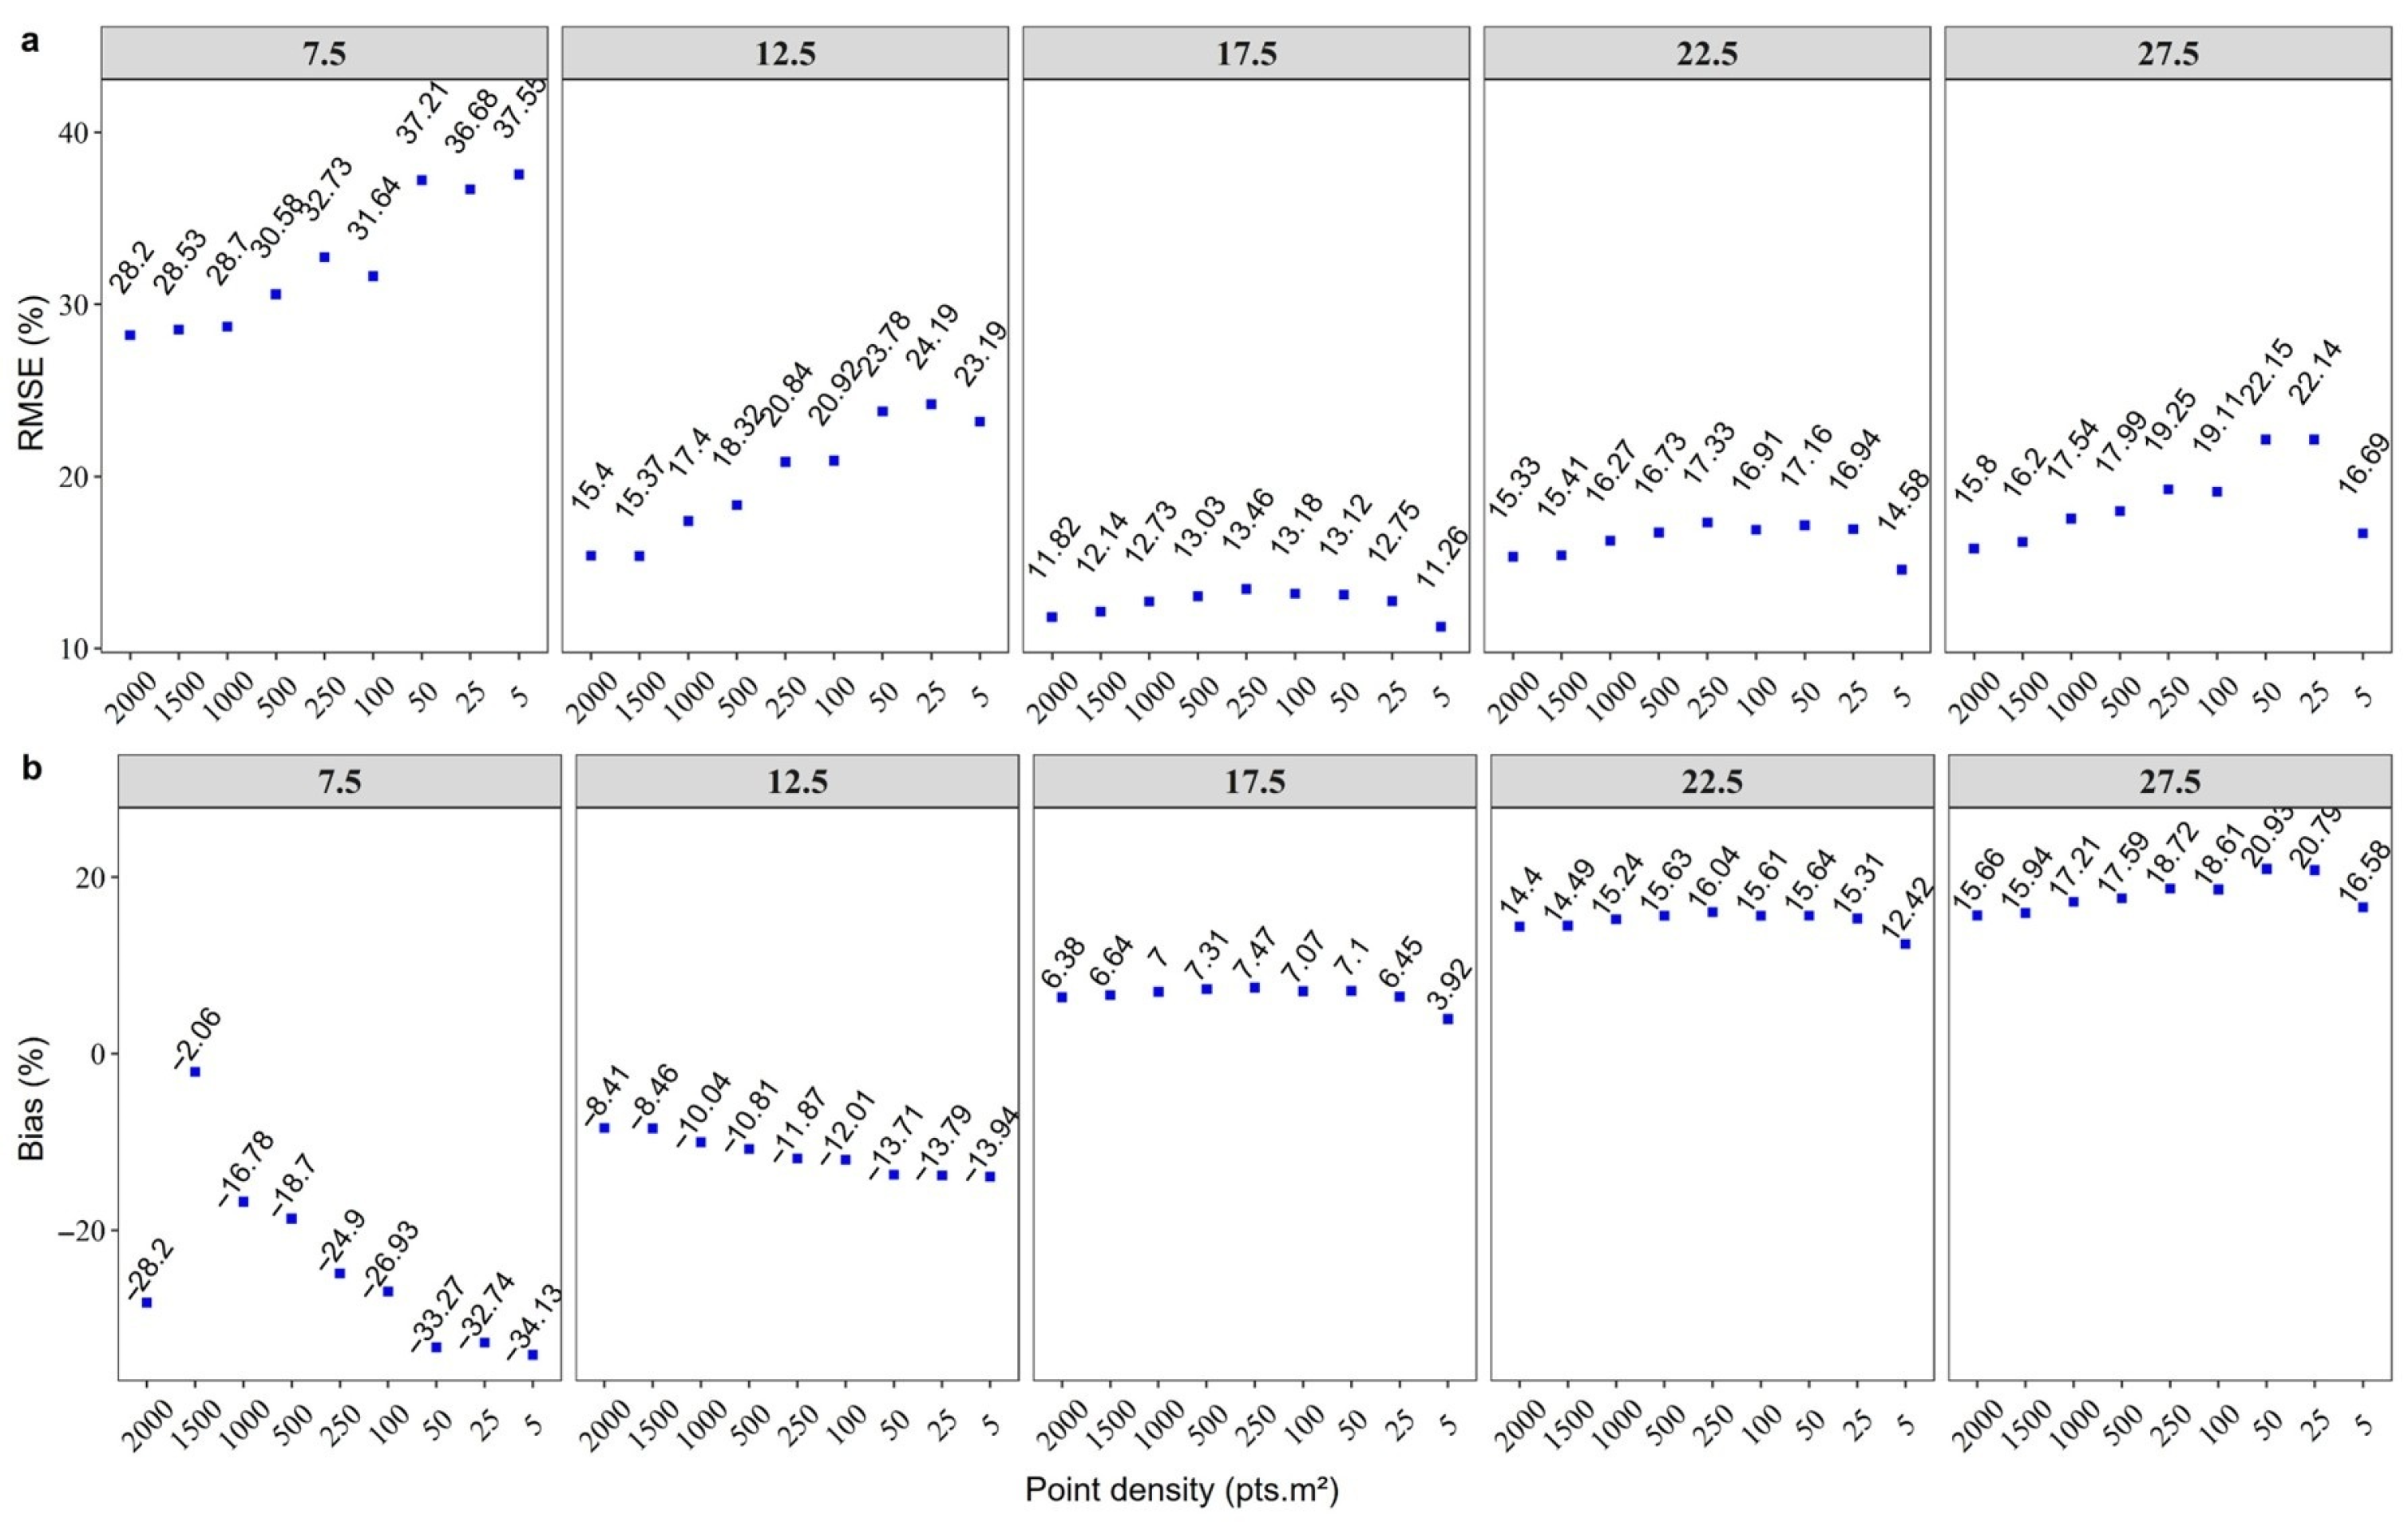
In general, all densities exhibited higher RMSE and Bias for the height classes 7.5 m and 27.5 m, while in the central classes these statistical measures presented moderate values. The highest densities (2000 pts·m−2, 1500 pts·m−2, and 1000 pts·m−2) obtained lower values for the RMSE and Bias metrics in the height classes (Figure 6).
Using the Tukey test at a 95% probability, densities from 2000 pts·m−2 to 100 pts·m−2 resulted in similar heights, which differed from the others. The densities of 50 pts·m−2 and 25 pts·m−2 are also similar, while 5 pts·m−2 differs from the others (Figure 7). The derived heights, despite overestimating the field heights, have a similar distribution, with a median close to the center and a negatively skewed distribution.
The heights derived by the UAV-LiDAR tended to overestimate the average mean individual volume (Vmi), except for the density of 5 pts·m−2, which underestimated the Vmi. The differences varied between 1.21% for 5 pts·m−2 and −9.38% for 2000 pts·m−2. Despite this, due to the number of individuals accounted for by each point cloud density, there is low variation between the volume stocks calculated with the height derived from the UAV-LiDAR and the field data, with the largest divergence (−25.75%) obtained by the density of 5 pts·m−2, which overestimated the number of individuals in the area. Stocks with densities of 2000 pts·m−2 and 100 pts·m−2 are the closest to the stock quantified with field data (Table 4).

4. Discussion

4.1. Forest Inventory and UAV-Lidar

The reduction in point density caused greater divergences in the representation of the tree profile, especially at the top. However, despite the smaller number of points, there are no major differences in the elevation model. As a result, the reduction in point density directly influences the digital canopy model, causing differences in the height derived for each density [13,15,43].
There were no changes in the point cloud that would distort the relief classification. Therefore, at all densities, the Digital Terrain Model (DTM) is of high quality, with a low incidence of errors, which favors reducing the density of the point cloud without compromising the precision and accuracy of the derived heights [30]. Additionally, the cloud with the lowest density in our study (5 pts·m−2) is equivalent to the maximum density obtained in the literature, with densities ranging from 5.7 pts·m−2 to 37.5 pts·m−2 [30,44,45]. Although this density is considered low for the conditions of this study, it was effective for identifying forest species and measuring height and biomass in other research [28,44,45,46,47].
The DTMs derived from various point densities were consistently of high quality, capturing essential topographical features accurately even at reduced densities. While the reduction in point density affected the digital canopy model, the overall accuracy of height estimation remained high when compared with other studies [4,8,25,30,31].

4.2. Comparison Between Heights Derived from the Point Cloud and Field Measures

This method of data acquisition has obtained accurate heights with a strong correlation up to densities of 100 pts·m−2 to 2000 pts·m−2 and moderate for all densities lower than 100 pts·m−2. In studies with lower point densities (<100 pts·m−2), correlations remain between moderate and strong [25,31,48], which explains why low densities present a correlation between 0.5 and 0.7.
The height derivations obtained in this study presented RMSE and bias similar to other studies, with RMSE values between 14% and 18% and bias ranging from −1% to 8%, indicating that this system is accurate for height estimates [26,31,49]. The greatest divergences in the height classes 7.5 m and 27.5 m may be related to the fact that height measurements in the field are subject to equipment and operator bias, which affects the accuracy in determining this variable [50,51,52,53]. Additionally, the digital devices for measuring height, such as the Vertex IV (error range = ±1–2 m), have lower performance for measuring taller trees, which may have occurred under the conditions of this study, as minimal oscillations in the view of the tree lead to large errors in estimating total height [54,55,56]. These errors could potentially be minimized if direct measurements of some trees were conducted to adjust a hypsometric equation [55,56].
The importance of height as a variable for forest management cannot be overstated, as it is used to determine the productive capacity of the site, model volume, biomass, carbon, and forest production [57,58,59,60]. However, this variable is difficult to measure and subject to various errors [50]. Therefore, the results obtained by the UAV-LiDAR sensor used in this study proved to be satisfactory for collecting tree heights more quickly and with less influence of errors [4,31,58,61,62,63].
Accurate determination of the number of individuals and their heights is essential for quantifying the forest timber volume. At densities ranging from 2000 pts·m−2 to 50 pts·m−2, the precise number of individuals resulted in a little difference in total wood volume compared to field data, indicating the accuracy of data derived from the UAV-LiDAR system. Higher point densities can lead to more accurate measurements [64,65]. However, in this study, differences were found up to 100 pts·m−2, significantly reducing the number of flights and the machine operational costs during data processing.
Such a reduction is viable, as it is possible to plan the flight to acquire data with lower density, favoring an increase in speed and altitude of the sensor, consequently reducing battery consumption [12]. This procedure allows for faster processing and lower computational costs [66,67]. Consequently, reducing the density of points lowers the costs inherent to acquiring UAV-LiDAR data, as increased speed and altitude improve system autonomy, enabling flights over larger areas within a similar time interval required to generate a high-density point cloud over a smaller area. However, supplementary experiments are required to validate this in the field, with a flight plan based on lower densities.
UAV-LiDAR is still a new system and faces some obstacles [49], such as the need for an extremely stable platform for collecting LiDAR data (flight stability and wind resistance, navigation accuracy and quality (GNSS + IMU), and operational safety—return to home), where gusts of wind can create different point densities in the same location [68]. Therefore, homogenization of the point cloud is an essential processing step.
However, the UAV DJI M600 Pro, as a multi-rotor platform, reduces vibration during the flight plan, favoring the acquisition of LiDAR data [16]. Despite covering many points in the forest area, the high overlap can produce some noise, which could originate from tree branches and leaves or possibly from equipment vibrations and strong winds, generating UAV displacement and consequently altering pulse collection direction. Therefore, the high density of points and data acquisition costs make UAV-LiDAR a viable alternative for measuring forest variables (e.g., height, DBH, basal area, crown’s diameter, and area) in small areas [4,16,29,31,62,69,70,71,72,73].
Furthermore, determining the optimal point cloud density is essential for obtaining other important metrics, such as crown diameter, crown height, and crown area [72], which can be used to estimate DBH [4], basal area [70], tree volume [26,74], the forest’s wood stock, and biomass [71,74,75]. But in future studies, we recommend assessing other forest types, including native forests and pure stands, to check if this behavior is the same in denser forests with different species and more complex canopy and terrain structures [31].

5. Conclusions

This study confirms the hypothesis that an optimal density of UAV-LiDAR point clouds can provide accuracy comparable to the maximum cloud density. Lower point densities were found to yield precise measurements for estimating the height of Eucalyptus benthamii in Crop–Livestock–Forestry systems, particularly around 100 pts·m−2, balancing accuracy with minimized data collection efforts.
The UAV-LiDAR-derived heights showed a strong correlation with field measurements at higher densities and a moderate to strong correlation even at lower densities, validating the reliability of UAV-LiDAR systems for height estimation. Accurate determination of individual tree heights is crucial for quantifying forest variables, such as volume and aboveground biomass.
By demonstrating the feasibility of using reduced point densities without compromising the tree’s height estimates, this study lays a solid foundation for optimizing UAV-LiDAR usage in forestry. The density of 100 pts·m−2 is an optimal and cost-efficient density, promoting practical benefits such as faster data collection, lower battery consumption, and reduced computational costs. Thus, UAV-LiDAR emerges as a viable and cost-effective tool for forest monitoring and management, supporting efficient and accurate forest inventory practices.

Author Contributions

E.M.d.C.N.: Conceptualization, Data curation, Software, Formal analysis, Investigation, Methodology, Project administration, Resources, Writing—original draft; E.G.: Data curation, Writing—original draft; M.M.M.: Data curation, Writing—original draft; H.F.P.V.: Data curation, Writing—original draft; A.M.A.Z.: Investigation, Writing—review and editing; E.N.B.: Investigation, Writing—review and editing; E.M.: Writing, review and editing; A.L.P.: Formal analysis, Methodology, Resources, Writing—review and editing; L.R.L.: Formal analysis, Methodology, Resources, Writing—review and editing; C.R.S.: Formal analysis, Methodology, Resources, Writing—review and editing; A.P.D.C.: Conceptualization, Formal analysis, Investigation, Methodology, Project administration, Resources, Writing—review and editing. All authors have read and agreed to the published version of the manuscript.

Funding

EM da CN was financed by the National Council for Scientific and Technological Development (CNPq) and the Graduate Program in Forest Engineering at the Federal University of Paraná. This study was financed in part by the Coordination of Improvement of Higher Education Personnel—Brasil (CAPES)—Finance Code 001 (88887.373249/2019−00) and CNPq (408785/2018-7 and 302891/2018-8).

Data Availability Statement

The datasets presented in this article are not readily available because our data is from a research project.

Acknowledgments

We are grateful to Federal University of Rondônia (UNIR) for providing this paper’s translation. Also, we are grateful to Emmanoella Guaraná for her efforts in helping to collect this data.

Conflicts of Interest

The authors declare no conflicts of interest.

References

  1. Hayashi, R.; Weiskittel, A.; Kershaw, J.A. Influence of Prediction Cell Size on LiDAR-Derived Area-Based Estimates of Total Volume in Mixed-Species and Multicohort Forests in Northeastern North America. Can. J. Remote Sens. 2016, 42, 473–488. [Google Scholar] [CrossRef]
  2. Yunjie, X. Wireless sensor monitoring system of Canadian Poplar Forests based on Internet of Things. Artif. Life Robot. 2019, 24, 471–479. [Google Scholar] [CrossRef]
  3. Fan, Y.; Feng, Z.; Mannan, A.; Khan, T.U.; Shen, C.; Saeed, S. Estimating tree position, diameter at breast height, and tree height in real-time using a mobile phone with RGB-D SLAM. Remote Sens. 2018, 10, 1845. [Google Scholar] [CrossRef]
  4. Corte, A.P.D.; Rex, F.E.; de Almeida, D.R.A.; Sanquetta, C.R.; Silva, C.A.; Moura, M.M.; Wilkinson, B.; Zambrano, A.M.A.; Cunha Neto, E.M.; Veras, H.F.P.; et al. Measuring individual tree diameter and height using gatoreye high-density UAV-lidar in an integrated crop-livestock-forest system. Remote Sens. 2020, 12, 863. [Google Scholar] [CrossRef]
  5. Parthiban, M.; Dharani, M.; Kathiga, S.; Keruthika, M. IOT based anti-poaching sensor system for trees in forest. Int. J. Innov. Technol. Explor. Eng. 2019, 8, 172–176. [Google Scholar] [CrossRef]
  6. Saikumar, S.T.; Sriramya, P. Iot enabled forest fire detection and altering the authorities. Int. J. Recent Technol. Eng. 2019, 7, 429–433. [Google Scholar]
  7. Rossit, D.A.; Olivera, A.; Viana Céspedes, V.; Broz, D. A Big Data approach to forestry harvesting productivity. Comput. Electron. Agric. 2019, 161, 29–52. [Google Scholar] [CrossRef]
  8. Shan, C.; Bi, H.; Watt, D.; Li, Y.; Strandgard, M.; Ghaffariyan, M.R. A new model for predicting the total tree height for stems cut-to-length by harvesters in Pinus radiata plantations. J. For. Res. 2021, 32, 21–41. [Google Scholar] [CrossRef]
  9. Alonzo, M.; McFadden, J.P.; Nowak, D.J.; Roberts, D.A. Mapping urban forest structure and function using hyperspectral imagery and lidar data. Urban For. Urban Green. 2016, 17, 135–147. [Google Scholar] [CrossRef]
  10. Veras, H.F.P.; Ferreira, M.P.; da Cunha Neto, E.M.; Figueiredo, E.O.; Corte, A.P.D.; Sanquetta, C.R. Fusing multi-season UAS images with convolutional neural networks to map tree species in Amazonian forests. Ecol. Inform. 2022, 71, 101815. [Google Scholar] [CrossRef]
  11. Yoga, S.; Bégin, J.; St-Onge, B.; Riopel, M. Modeling the effect of the spatial pattern of airborne lidar returns on the prediction and the uncertainty of timber merchantable volume. Remote Sens. 2017, 9, 808. [Google Scholar] [CrossRef]
  12. Ruiz, L.A.; Hermosilla, T.; Mauro, F.; Godino, M. Analysis of the influence of plot size and LiDAR density on forest structure attribute estimates. Forests 2014, 5, 936–951. [Google Scholar] [CrossRef]
  13. Campbell, M.J.; Dennison, P.E.; Hudak, A.T.; Parham, L.M.; Butler, B.W. Quantifying understory vegetation density using small-footprint airborne lidar. Remote Sens. Environ. 2018, 215, 330–342. [Google Scholar] [CrossRef]
  14. Kukunda, C.B.; Duque-Lazo, J.; González-Ferreiro, E.; Thaden, H.; Kleinn, C. Ensemble classification of individual Pinus crowns from multispectral satellite imagery and airborne LiDAR. Int. J. Appl. Earth Obs. Geoinf. 2018, 65, 12–23. [Google Scholar] [CrossRef]
  15. Kükenbrink, D.; Schneider, F.D.; Leiterer, R.; Schaepman, M.E.; Morsdorf, F. Quantification of hidden canopy volume of airborne laser scanning data using a voxel traversal algorithm. Remote Sens. Environ. 2017, 194, 424–436. [Google Scholar] [CrossRef]
  16. Wallace, L.; Lucieer, A.; Watson, C.; Turner, D. Development of a UAV-LiDAR system with application to forest inventory. Remote Sens. 2012, 4, 1519–1543. [Google Scholar] [CrossRef]
  17. Surový, P.; Ribeiro, N.A.; Panagiotidis, D. Estimation of positions and heights from UAV-sensed imagery in tree plantations in agrosilvopastoral systems. Int. J. Remote Sens. 2018, 39, 4786–4800. [Google Scholar] [CrossRef]
  18. Birdal, A.C.; Avdan, U.; Türk, T. Estimating tree heights with images from an unmanned aerial vehicle. Geomat. Nat. Hazards Risk 2017, 8, 1144–1156. [Google Scholar] [CrossRef]
  19. Nevalainen, O.; Honkavaara, E.; Tuominen, S.; Viljanen, N.; Hakala, T. Individual Tree Detection and Classification with UAV-Based Photogrammetric Point Clouds and Hyperspectral Imaging. Remote Sens. 2017, 9, 185. [Google Scholar] [CrossRef]
  20. Ota, T.; Ogawa, M.; Mizoue, N.; Fukumoto, K.; Yoshida, S. Forest Structure Estimation from a UAV-Based Photogrammetric Point Cloud in Managed Temperate Coniferous Forests. Forests 2017, 8, 343. [Google Scholar] [CrossRef]
  21. Dempewolf, J.; Nagol, J.; Hein, S.; Thiel, C.; Zimmermann, R. Measurement of Within-Season Tree Height Growth in a Mixed Forest Stand Using UAV Imagery. Forests 2017, 8, 231. [Google Scholar] [CrossRef]
  22. Simpson, J.E.; Smith, T.E.L.; Wooster, M.J. Assessment of errors caused by forest vegetation structure in airborne LiDAR-derived DTMs. Remote Sens. 2017, 9, 1101. [Google Scholar] [CrossRef]
  23. White, J.C.; Wulder, M.A.; Vastaranta, M.; Coops, N.C.; Pitt, D.; Woods, M. The utility of image-based point clouds for forest inventory: A comparison with airborne laser scanning. Forests 2013, 4, 518–536. [Google Scholar] [CrossRef]
  24. Ota, T.; Ogawa, M.; Shimizu, K.; Kajisa, T.; Mizoue, N.; Yoshida, S.; Takao, G.; Hirata, Y.; Furuya, N.; Sano, T.; et al. Aboveground biomass estimation using structure from motion approach with aerial photographs in a seasonal tropical forest. Forests 2015, 6, 3882–3898. [Google Scholar] [CrossRef]
  25. Cunha Neto, E.M.D.; Veras, H.F.P.; Moura, M.M.; Berti, A.L.; Sanquetta, C.R.; Pelissari, A.L.; Corte, A.P.D. Combining ALS and UAV to derive the height of Araucaria angustifolia in the Brazilian Atlantic Rain Forest. An. Acad. Bras. Cienc. 2023, 95, e20201503. [Google Scholar] [CrossRef]
  26. Sankey, T.; Donager, J.; Mcvay, J.; Sankey, J.B. Remote Sensing of Environment UAV lidar and hyperspectral fusion for forest monitoring in the southwestern USA. Remote Sens. Environ. 2017, 195, 30–43. [Google Scholar] [CrossRef]
  27. Wallace, L.; Lucieer, A.; Watson, C.S. Evaluating Tree Detection and Segmentation Routines on Very High Resolution UAV LiDAR Data. IEEE Trans. Geosci. Remote Sens 2014, 52, 7619–7628. [Google Scholar] [CrossRef]
  28. Jakubowski, M.K.; Guo, Q.; Kelly, M. Tradeoffs between lidar pulse density and forest measurement accuracy. Remote Sens. Environ. 2013, 130, 245–253. [Google Scholar] [CrossRef]
  29. Guo, Q.; Su, Y.; Hu, T.; Zhao, X.; Wu, F.; Liu, J.; Chen, L.; Xu, G.; Lin, G.; Zheng, Y.; et al. An integrated UAV-borne lidar system for 3D habitat mapping in three forest ecosystems across China. Int. J. Remote Sens. 2017, 38, 2954–2972. [Google Scholar] [CrossRef]
  30. Watt, M.S.; Meredith, A.; Watt, P.; Gunn, A. The influence of LiDAR pulse density on the precision of inventory metrics in young unthinned Douglas-fir stands during initial and subsequent LiDAR acquisitions. N. Z. J. For. Sci. 2014, 44, 18. [Google Scholar] [CrossRef]
  31. Cunha Neto, E.M.; Rex, F.E.; Veras, H.F.P.; Moura, M.M.; Sanquetta, C.R.; Käfer, P.S.; Sanquetta, M.N.I.; Zambrano, A.M.A.; Broadbent, E.N.; Corte, A.P.D. Using high-density UAV-Lidar for deriving tree height of Araucaria Angustifolia in an Urban Atlantic Rain Forest. Urban For. Urban Green. 2021, 63, 127197. [Google Scholar] [CrossRef]
  32. Alvares, C.A.; Stape, J.L.; Sentelhas, P.C.; De Moraes Gonçalves, J.L.; Sparovek, G. Köppen’s climate classification map for Brazil. Meteorol. Zeitschrift 2013, 22, 711–728. [Google Scholar] [CrossRef] [PubMed]
  33. Santos, H.G.; Jacomine, P.K.T.; Anjos, L.H.C.; Oliveira, V.Á.; Lumbreras, J.F.; Coelho, M.R.; Almeida, J.A.; Araújo Filho, J.C.; Oliveira, J.B.; Cunha, T.J.F. Sistema Brasileiro de Classificação de Solos, 5th ed.; Mattos, J.S.R., Ed.; Embrapa: Brasília, Brazil, 2018; ISBN 978-85-7035-800-4. [Google Scholar]
  34. De Moraes, A.; Pelissari, A.; Lustosa, S.B.C.; Portugal, T.B.; Schuster, M.Z.; Kruchelski, S.; Dominschek, R. Apresentação geral da área experimental do NITA. In Sistemas Integrados de Produção Agropecuária na Promoção da Intensificação Sustentável; Dominschek, R., Kruchelski, S., Deiss, L., Portugal, T.B., Denardin, L.G., Martins, A.P., Lang, C.R., Moraes, A.d., Eds.; Universidade Federal do Paraná: Curitiba, Brazil, 2018; pp. 54–67. ISBN 9788573353198. [Google Scholar]
  35. Wilkinson, B.; Lassiter, H.A.; Abd-Elrahman, A.; Carthy, R.R.; Ifju, P.; Broadbent, E.; Grimes, N. Geometric targets for UAS lidar. Remote Sens. 2019, 11, 3019. [Google Scholar] [CrossRef]
  36. Isenburg, M. Lastools—Efficient Lidar Processing Software, Version 2019; Rapidlasso GmbH: Gilching, Germany, 2019.
  37. Core Team. R: A Language and Environment for Statistical Computing, Version 3.6.2; R Foundation for Statistical Computing: Vienna, Austria, 2019.
  38. Roussel, J.-R.; Auty, D. lidR: Airborne LIDAR Data Manipulation and Visualization for Forestry Applications, Version 2.0.2; R-Lidar/Laval University: Quebec City, QC, Canada, 2019.
  39. Silva, C.A.; Crookston, N.L.; Hudak, A.T.; Vierling, L.A.; Klauberg, C.; Cardil, A. rLiDAR: LiDAR Data Processing and Visualization, Version 0.1.1; R Foundation for Statistical Computing: Vienna, Austria, 2017.
  40. Mohan, M.; Silva, C.A.; Klauberg, C.; Jat, P.; Catts, G.; Cardil, A.; Hudak, A.T.; Dia, M. Individual tree detection from unmanned aerial vehicle (UAV) derived canopy height model in an open canopy mixed conifer forest. Forests 2017, 8, 340. [Google Scholar] [CrossRef]
  41. Miranda, D.L.C.; Junior, V.B.; Gouveia, D.M. Fator de forma e equações de volume para estimativa volumétrica de árvores em plantio de Eucalyptus urograndis. Sci. PLENA 2015, 11, 1–8. [Google Scholar]
  42. Da Oliveira, J.T.S.; Hellmeister, J.C.; Simões, J.W.; Tomazello Filho, M. Characterization of seven eucalypt wood species to civil construction: 1-dendrometrics evaluations of the trees. Sci. For. 1999, 1, 113–124. [Google Scholar]
  43. Hamraz, H.; Contreras, M.A.; Zhang, J. Forest understory trees can be segmented accurately within sufficiently dense airborne laser scanning point clouds. Sci. Rep. 2017, 7, 6770. [Google Scholar] [CrossRef]
  44. Silva, C.A.; Hudak, A.T.; Vierling, L.A.; Klauberg, C.; Garcia, M.; Ferraz, A.; Keller, M.; Eitel, J.; Saatchi, S. Impacts of airborne lidar pulse density on estimating biomass stocks and changes in a selectively logged tropical forest. Remote Sens. 2017, 9, 1068. [Google Scholar] [CrossRef]
  45. Wannasiri, W.; Nagai, M.; Honda, K.; Santitamnont, P.; Miphokasap, P. Extraction of mangrove biophysical parameters using airborne LiDAR. Remote Sens. 2013, 5, 1787–1808. [Google Scholar] [CrossRef]
  46. Rex, F.E.; Corte, A.P.D.; Machado, S.D.A.; Silva, C.A.; Sanquetta, C.R. Estimating Above-Ground Biomass of Araucaria angustifolia (Bertol.) Kuntze Using LiDAR Data. Floresta E Ambiente 2019, 26, e20171107. [Google Scholar] [CrossRef]
  47. Rex, F.E.; Corte, A.P.D.; Machado, S.D.A.; Sanquetta, C.R. Identificação e extração de copas de Araucaria angustifolia (Bertol.) Kuntze a partir de dados LiDAR. Adv. For. Sci. 2018, 5, 319–323. [Google Scholar] [CrossRef]
  48. Sankey, T.; Shrestha, R.; Sankey, J.B.; Hardegree, S.; Strand, E. Lidar-derived estimate and uncertainty of carbon sink in successional phases of woody encroachment. J. Geophys. Res. Biogeosci. 2013, 118, 1144–1155. [Google Scholar] [CrossRef]
  49. Yin, D.; Wang, L. Individual mangrove tree measurement using UAV-based LiDAR data: Possibilities and challenges. Remote Sens. Environ. 2019, 223, 34–49. [Google Scholar] [CrossRef]
  50. Larjavaara, M.; Muller-landau, H.C. Measuring tree height: A quantitative comparison of two common field methods in a moist tropical forest. Methods Ecol. Evol. 2013, 4, 793–801. [Google Scholar] [CrossRef]
  51. Munroe, D.K.; Nagendra, H.; Southworth, J. Monitoring landscape fragmentation in an inaccessible mountain area: Celaque National Park, Western Honduras. Landsc. Urban Plan. 2007, 83, 154–167. [Google Scholar] [CrossRef]
  52. Southworth, J.; Tucker, C. The Influence of Accessibility, Local Institutions, and Socioeconomic Factors on Forest Cover Change in the Mountains of Western Honduras. Mt. Res. Dev. 2001, 21, 276–283. [Google Scholar] [CrossRef]
  53. Teixeira, A.M.G.; Soares-Filho, B.S.; Freitas, S.R.; Metzger, J.P. Modeling landscape dynamics in an Atlantic Rainforest region: Implications for conservation. For. Ecol. Manag. 2009, 257, 1219–1230. [Google Scholar] [CrossRef]
  54. Da Silva, G.F.; de Curto, R.A.; Soares, C.P.B.; de Piassi, L.C. Avaliação de métodos de medição de altura em florestas naturais. Rev. Arvore 2012, 36, 341–348. [Google Scholar] [CrossRef]
  55. da Silva, G.F.; de Oliveira, O.M.; de Souza, C.A.M.; Soares, C.P.B.; Lemos, R. Influência de diferentes fontes de erro sobre as medições de alturas de árvores. Cerne 2012, 18, 397–405. [Google Scholar] [CrossRef]
  56. Lauro, A.C.; Curto, R.D.A.; Tonini, H.; Biazatti, S.C.; Kohler, S.V. Operacionalidade de instrumentos na obtenção da altura total de árvores em sistema agrossilvipastoril. Adv. For. Sci. 2018, 5, 445–451. [Google Scholar] [CrossRef]
  57. Rahman, M.Z.A.; Bakar, M.A.A.; Razak, K.A.; Rasib, A.W.; Kanniah, K.D.; Kadir, W.H.W.; Omar, H.; Faidi, A.; Kassim, A.R.; Latif, Z.A. Non-destructive, laser-based individual tree aboveground biomass estimation in a tropical rainforest. Forests 2017, 8, 86. [Google Scholar] [CrossRef]
  58. Brede, B.; Calders, K.; Lau, A.; Raumonen, P.; Bartholomeus, H.M.; Herold, M.; Kooistra, L. Non-destructive tree volume estimation through quantitative structure modelling: Comparing UAV laser scanning with terrestrial LIDAR. Remote Sens. Environ. 2019, 233, 111355. [Google Scholar] [CrossRef]
  59. Silva, C.A.; Klauberg, C.; Hudak, A.T.; Vierling, L.A.; Liesenberg, V.; Carvalho, S.P.C.E.; Rodriguez, L.C.E. A principal component approach for predicting the stem volume in Eucalyptus plantations in Brazil using airborne LiDAR data. Forestry 2016, 89, 422–433. [Google Scholar] [CrossRef]
  60. Dube, T.; Mutanga, O.; Abdel-Rahman, E.M.; Ismail, R.; Slotow, R. Predicting Eucalyptus spp. stand volume in Zululand, South Africa: An analysis using a stochastic gradient boosting regression ensemble with multi-source data sets. Int. J. Remote Sens. 2015, 36, 3751–3772. [Google Scholar] [CrossRef]
  61. Liu, Y.; Noguchi, N.; Liang, L. Development of a positioning system using UAV-based computer vision for an airboat navigation in paddy field. Comput. Electron. Agric. 2019, 162, 126–133. [Google Scholar] [CrossRef]
  62. Wang, D.; Wan, B.; Liu, J.; Su, Y.; Guo, Q.; Qiu, P.; Wu, X. Estimating aboveground biomass of the mangrove forests on northeast Hainan Island in China using an upscaling method from field plots, UAV-LiDAR data and Sentinel-2 imagery. Int. J. Appl. Earth Obs. Geoinf. 2020, 85, 101986. [Google Scholar] [CrossRef]
  63. Brede, B.; Lau, A.; Bartholomeus, H.M.; Kooistra, L. Comparing RIEGL RiCOPTER UAV LiDAR derived canopy height and DBH with terrestrial LiDAR. Sensors 2017, 17, 2371. [Google Scholar] [CrossRef]
  64. Li, J.; Hu, B.; Noland, T.L. Classification of tree species based on structural features derived from high density LiDAR data. Agric. For. Meteorol. 2013, 171–172, 104–114. [Google Scholar] [CrossRef]
  65. Da Silva, M.N.; Tereza, A.; da Bezerra, D.S.B.; Pereira, L.; de Eloi, C.M.A.; dos Santos, A.L.S.S. A seca no Maranhão no período de 2010 a 2016 e seus impactos. Parcer. Estratégicas 2017, 22, 119–138. [Google Scholar]
  66. Aji, A.; Wang, F.; Vo, H.; Lee, H.; Liu, Q.; Zhang, X.; Saltz, J. Hadoop gis: A high performance spatial data warehousing system over mapreduce. Proc. VLDB Endow. 2013, 6, 1009–1020. [Google Scholar] [CrossRef]
  67. Hongchao, M.; Wang, Z. Distributed data organization and parallel data retrieval methods for huge laser scanner point clouds. Comput. Geosci. 2011, 37, 193–201. [Google Scholar] [CrossRef]
  68. Yang, G.; Liu, J.; Zhao, C.; Li, Z.; Huang, Y.; Yu, H.; Xu, B.; Yang, X.; Zhu, D.; Zhang, X.; et al. Unmanned aerial vehicle remote sensing for field-based crop phenotyping: Current status and perspectives. Front. Plant Sci. 2017, 8, 1111. [Google Scholar] [CrossRef] [PubMed]
  69. Jaakkola, A.; Hyyppä, J.; Kukko, A.; Yu, X.; Kaartinen, H.; Lehtomäki, M.; Lin, Y. A low-cost multi-sensoral mobile mapping system and its feasibility for tree measurements. ISPRS J. Photogramm. Remote Sens. 2010, 65, 514–522. [Google Scholar] [CrossRef]
  70. Paula, A.; Corte, D.; Ernandes, M.; Neto, C.; Rex, F.E.; Souza, D.; Behling, A.; Mohan, M.; Niroh, M.; Sanquetta, I.; et al. High-Density UAV-LiDAR in an Integrated Crop-Livestock-Forest System: Sampling Forest Inventory or Forest Inventory Based on Individual Tree Detection (ITD). Drones 2022, 6, 48. [Google Scholar]
  71. Leitold, V.; Keller, M.; Morton, D.C.; Cook, B.D.; Shimabukuro, Y.E. Airborne lidar-based estimates of tropical forest structure in complex terrain: Opportunities and trade-offs for REDD+. Carbon Balance Manag. 2015, 10, 3. [Google Scholar] [CrossRef]
  72. Veras, H.F.P.; da Cunha Neto, E.M.; Brasil, I.D.S.; Madi, J.P.S.; Araujo, E.C.G.; Camaño, J.D.Z.; Figueiredo, E.O.; de Almeida Papa, D.; Ferreira, M.P.; Corte, A.P.D.; et al. Estimating tree volume based on crown mapping by UAV pictures in the Amazon Forest. Sci. Electron. Arch. 2023, 16, 16720231742. [Google Scholar] [CrossRef]
  73. Goodbody, T.R.H.; Coops, N.C.; Marshall, P.L.; Tompalski, P.; Crawford, P. Unmanned aerial systems for precision forest inventory purposes: A review and case study. For. Chron. 2017, 93, 71–81. [Google Scholar] [CrossRef]
  74. Lin, J.; Wang, M.; Ma, M.; Lin, Y. Aboveground tree biomass estimation of sparse subalpine coniferous forest with UAV oblique photography. Remote Sens. 2018, 10, 1849. [Google Scholar] [CrossRef]
  75. Mascaro, J.; Detto, M.; Asner, G.P.; Muller-Landau, H.C. Evaluating uncertainty in mapping forest carbon with airborne LiDAR. Remote Sens. Environ. 2011, 115, 3770–3774. [Google Scholar] [CrossRef]
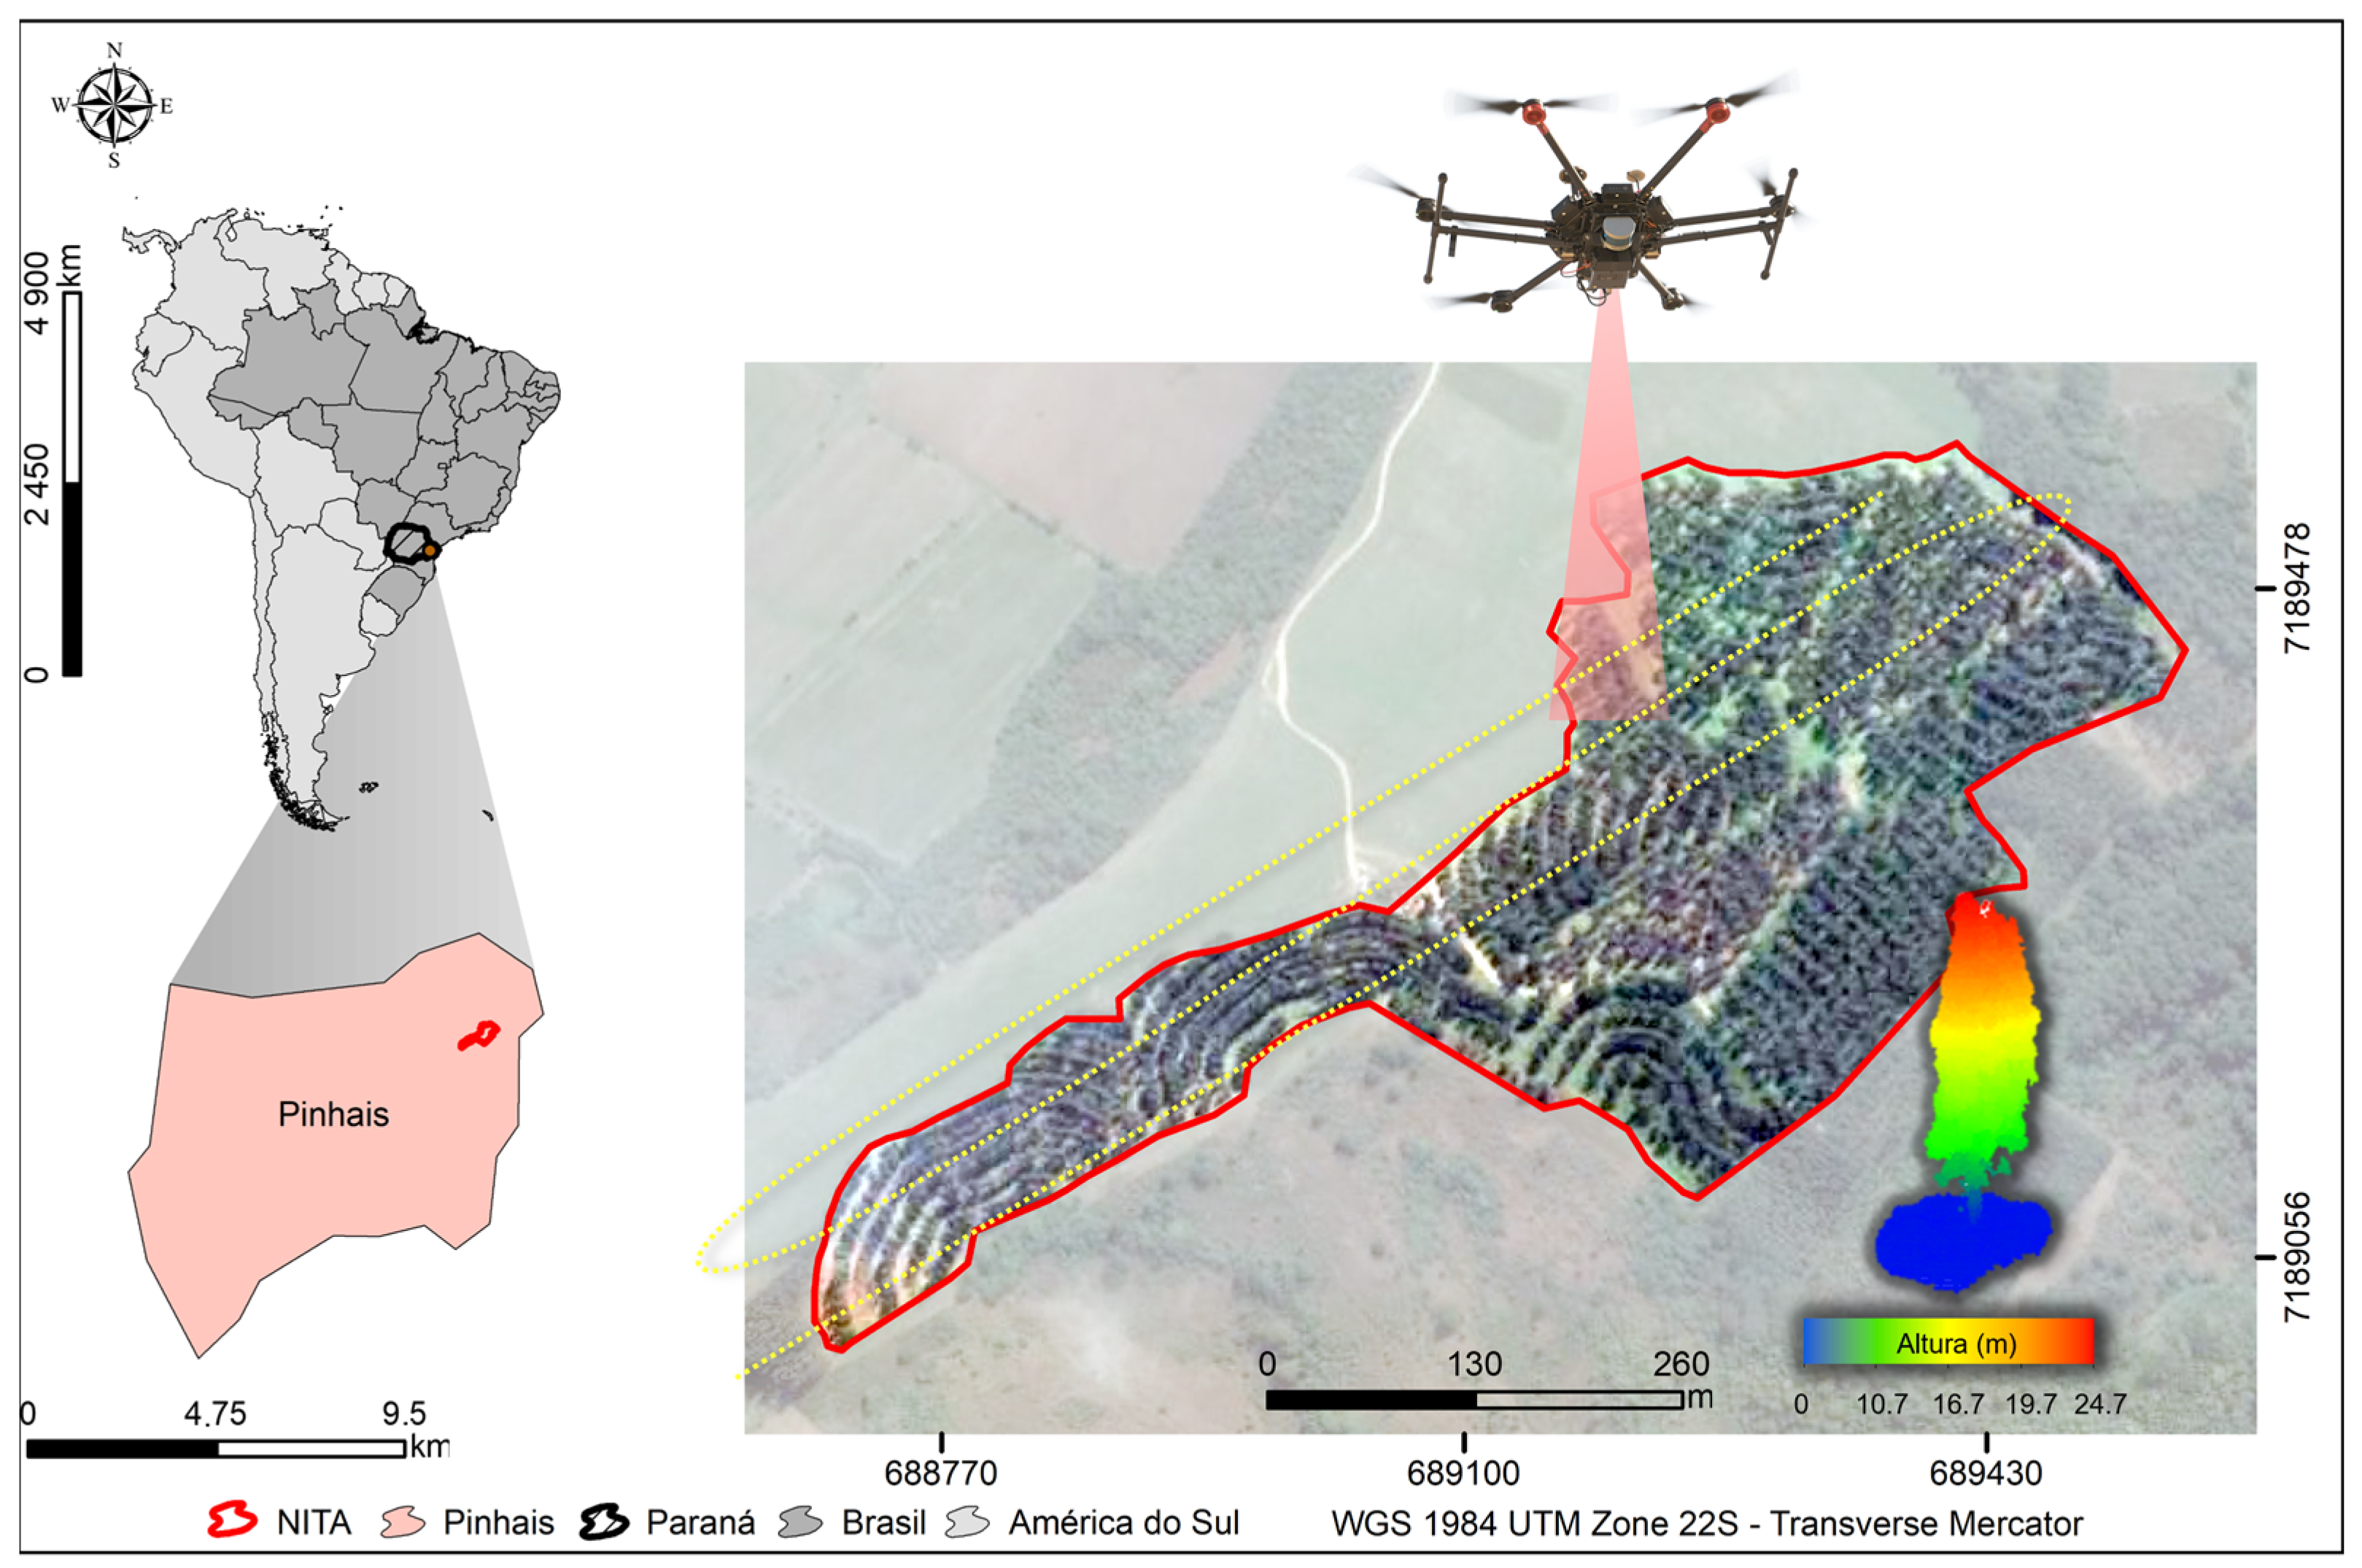
Figure 1. Location map of the NITA Project at the Canguiri Experimental Farm, in Pinhais, Paraná, Brazil.
Forests 16 01747 g001
Figure 2. UAV-LiDAR processing flowchart of the NITA Project at the Canguiri Experimental Farm, in Pinhais, Paraná, Brazil.
Forests 16 01747 g002
Figure 3. Specimen representation of Eucalyptus benthamii at different point cloud densities in the NITA project, Pinhais, Paraná, Brazil.
Forests 16 01747 g003
Figure 4. CHM (a) and DTM (b) of each UAV-LiDAR point density in the NITA project, Pinhais, Paraná, Brazil.
Forests 16 01747 g004
Figure 5. Scatterplot of standard residuals per estimated heights (a), scatterplot of estimated heights per observed heights (b) for UAV-LiDAR point densities in the derivation of Eucalyptus benthamii height at the NITA project, Pinhais, Paraná, Brazil. The dashed line is the perfect correlation. The red line shows the estimated height averages.
Forests 16 01747 g005
Figure 6. Root mean square error (RMSE) (a) and bias (b) between derived heights for UAV-LiDAR point densities in the derivation of Eucalyptus benthamii height at the NITA project, Pinhais, Paraná, Brazil.
Forests 16 01747 g006
Figure 7. Tukey’s test for UAV-LiDAR point densities in the derivation of Eucalyptus benthamii height at the NITA project, Pinhais, Paraná, Brazil. Equal letters indicate no significant difference by Tukey’s test at the 5% significance level. F value = 3.022. p-value = 0.00372.
Forests 16 01747 g007
Table 1. Descriptive statistics of individual heights across different point cloud densities in the NITA Project, Pinhais, Paraná, Brazil.
ScenariosHeight (m)Statistical Metric
Min X ¯ ± SDMaxSECV (%)
Field11.1019.92 ± 2.6526.200.063017.75
Point cloud density (pts/m2)200011.7621.39 ± 3.6628.060.104817.47
150011.7621.62 ± 3.8227.970.104717.67
100011.3521.64 ± 3.9928.300.104418.43
50011.1821.65 ± 4.0228.300.104118.54
25011.2521.55 ± 4.1528.380.104419.26
10011.1021.44 ± 4.1728.440.104119.44
5010.9521.12 ± 4.4028.380.107720.85
2510.9120.90 ± 4.4528.300.108821.30
511.2320.12 ± 4.1627.920.088620.65
Min is the minimal height, X ¯   is the mean of heights, Max is the maximum height, SD is the standard deviation, SE’s the standard error, and CV is the coefficient of variation.
Table 2. Number of Eucalyptus benthamii identified across different point cloud densities in the NITA Project, Pinhais, Paraná, Brazil.
Height’s Center Class (m)Number of Individuals (n)
FieldPoint Cloud Density (pts·m−2)
20001500100050025010050255
7.51341820202023213260
12.587208206214207211225248281438
17.5788395401404391386400392394646
22.59746236326426426706917037081004
27.57468478475452428405381342231
Total1869169817351755171217151744174517572379
Difference (n)171134114157154125124112−510
Difference (%)9.157.176.108.408.246.696.635.99−27.29
Table 3. Pearson correlation coefficient (r), root mean square error (RMSE), bias and t-test probability value for each point density of the Eucalyptus benthamii height derivation from the NITA project, Pinhais, Paraná, Brazil.
Point Cloud Density (pts·m−2)rRMSE (m)RMSE (%)Bias (m)Bias (%)t (p-Value)
20000.7922.90414.547−1.675−8.3890.839
15000.7872.92214.660−1.681−8.4330.874
10000.7573.14115.763−1.713−8.5980.891
5000.7363.24116.270−1.737−8.7200.849
2500.6903.44017.315−1.673−8.4180.846
1000.6903.40517.129−1.568−7.8890.869
500.6173.69318.609−1.277−6.4330.868
250.5983.72618.791−1.073−5.4120.878
100.5783.72418.811−0.484−2.4470.297
50.5793.42617.314−0.334−1.6880.839
Table 4. Mean individual volume (Vmi), volume of the area (V), total number of trees (n), and height inference of Eucalyptus benthamii in the NITA project, Pinhais, Paraná, Brazil.
ScenarioStands VariablesDifference (%)
Vmi (m3·tree−1)nV (m3·ha−1)Stock (m3)VmiStock
Field0.6963186982.421301.38--
Point cloud density (pts·m−2)20000.7616169881.901293.24−9.380.63
15000.7595173583.451317.70−9.07−1.25
10000.7546175583.871324.32−8.37−1.76
5000.7551171281.871292.72−8.440.67
2500.7517171581.641289.16−7.960.94
1000.7452174482.311299.62−7.020.14
500.7388174581.641289.16−6.100.94
250.7228175780.431269.99−3.812.41
50.68792379103.641636.481.21−25.75
Disclaimer/Publisher’s Note: The statements, opinions and data contained in all publications are solely those of the individual author(s) and contributor(s) and not of MDPI and/or the editor(s). MDPI and/or the editor(s) disclaim responsibility for any injury to people or property resulting from any ideas, methods, instructions or products referred to in the content.