Article

Full Orthotropic Mechanical Characterization of Pinus radiata Plywood Through Tensile, Compression and Shear Testing with Miniaturized Specimens

by
Moisés Sandoval
1,2,
Masoud Javadi
3,
Paula Soto-Zúñiga
4,
Juan Pablo Cárdenas-Ramírez
5,
Michael Arnett
6,
Angelo Oñate
7,
Rodrigo Cancino
2,
Erick I. Saavedra Flores
3 and
Víctor Tuninetti
8,*
1
Master Program in Engineering Sciences, Faculty of Engineering, Universidad de La Frontera, Temuco 4811230, Chile
2
R&D Innovation Department, Eagon Lautaro S.A., Ruta 5 Sur Km 644, Lautaro 4860000, Chile
3
Departamento de Ingeniería en Obras Civiles, Universidad de Santiago de Chile, Avenida Ecuador 3659, Estación Central, Santiago 9170022, Chile
4
Program of Civil Engineering, Universidad de La Frontera, Temuco 4811230, Chile
5
Escuela de Construcción Civil, Facultad de Ingeniería, Universidad de Valparaíso, General Cruz 222, Valparaíso 2341266, Chile
6
Facultad de Arquitectura, Construcción y Medio Ambiente, Universidad Autónoma de Chile, Temuco 4810101, Chile
7
Department of Materials Engineering (DIMAT), Faculty of Engineering, Universidad de Concepción, Edmundo Larenas 315, Concepción 4070138, Chile
8
Department of Mechanical Engineering, Universidad de La Frontera, Temuco 4811230, Chile
*
Author to whom correspondence should be addressed.
Forests 2025, 16(11), 1676; https://doi.org/10.3390/f16111676
Submission received: 5 October 2025 / Revised: 25 October 2025 / Accepted: 30 October 2025 / Published: 3 November 2025

Abstract

This study introduces and validates a miniaturized testing methodology for the complete orthotropic characterization of structural plywood, including out-of-plane directions that are typically difficult to access. Novel small-scale geometries were developed for tension and shear configurations, with compliance corrections applied to ensure accurate stress–strain responses. The method proved reliable and sensitive to mechanical differences arising from veneer architecture, adhesive type, and interfacial bonding. Two sets of 18 mm structural plywood panels—manufactured with distinct adhesive systems, one bio-based (F1) and one phenol-formaldehyde (F2)—were systematically tested under tensile, compressive, and shear loading in ten orthogonal configurations (Tx, Ty, Tz, Cx, Cy, Cz, τxy, τyx, τxz, τyz), following standards NCh 3617, EN 789, and ASTM B831. Tensile moduli were approximately twice the corresponding compressive values, while out-of-plane moduli reached only 6–11% of in-plane values. F1 exhibited higher stiffness in both tension and compression, particularly in transverse directions, due to thicker perpendicular veneers enhancing bending restraint and shear coupling. In contrast, F2 achieved greater peak shear strength owing to its more uniform veneer structure, which improved stress distribution and delayed interlaminar failure. Observed asymmetry between tension and compression reflected microstructural mechanisms such as fiber alignment and cell-wall buckling. The miniature-specimen data provide reliable input for constitutive calibration and finite-element modeling, while revealing clear links between veneer-thickness distribution, shear-transfer efficiency, and macroscopic performance. The proposed framework enables efficient, reproducible orthotropic characterization for optimized, lightweight, and carbon-efficient timber systems.

1. Introduction

The construction industry is a major source of anthropogenic CO2 emissions, responsible for about 40 percent of global greenhouse gas output [1,2]. Its substantial resource consumption and waste generation, accounting for 40 to 60 percent of raw material use and about 35 percent of landfill waste, emphasize the need for sustainable building practices and progress toward net-zero carbon goals [3]. Cement production alone accounts for an estimated 5–8% of global CO2 emissions [4,5,6], highlighting how traditional materials exacerbate the environmental burden. These challenges are compounded by inefficient construction processes and the slow adoption of advanced technologies in the building sector [7,8]. In response, modular construction has emerged to improve efficiency and reduce waste via controlled off-site fabrication, while also providing a platform to integrate Industry 4.0 technologies for better resource management [7,8]. However, as a relatively new approach, modular construction lacks fully established design guidelines, often resulting in structural systems being deployed without comprehensive performance evaluation [9].
Reducing the environmental impact of construction requires substituting carbon-intensive materials with engineered wood products. Cross-laminated timber (CLT), glulam, plywood, laminated veneer lumber (LVL), and laminated veneer board offer substantially lower embodied carbon and provide carbon sequestration potential compared to steel and concrete [10,11]. Thinley and Hengrasmee [12] found that mass timber in residential buildings reduced life-cycle CO2 emissions by 111 to 525 percent relative to reinforced-concrete structures. Engineered timber systems also align with modular construction, as prefabricated components shorten schedules and reduce material waste [13,14,15,16,17]. These characteristics make engineered timber a strong candidate for low-carbon modular building.
In particular, plywood has gained attention as a standardized, high-performance panel suited to modular applications. Standard panels of about 1.2 by 2.4 m and thicknesses of 12 to 18 mm [18] simplify design and assembly. Produced under strict quality control, plywood provides consistency and reliability in structural use. Effective integration in modular systems requires an understanding of its mechanical response under varying load orientations [19]. Because wood composites are anisotropic, their properties depend on grain direction and layer configuration [20]. Complete orthotropic characterization, defining elastic and strength parameters in all principal directions, enables accurate modeling, material optimization, and reliable performance in sustainable modular construction.
Enhanced mechanical characterization, particularly with respect to orthotropic shear behavior, can improve product quality control by enabling tighter monitoring of critical production parameters, ensure consistent product performance, and support accurate structural modeling and analysis. This, in turn, allows engineers to optimize the design of plywood-based components and structures, enhancing both material efficiency and structural reliability.
The production of structural plywood panels is a complex process influenced by multiple factors, including wood species [21,22,23,24], peeling method [25], temperature [21,26,27], moisture content [28], number and thickness of plies [24,29,30], structural composition [30], adhesive type [27,30,31,32,33,34,35,36], and curing/pressing schedules [30,32,37,38,39]. These panels are designed to deliver high mechanical performance in three orthogonal directions, taking advantage of the orthotropic behavior of the material. While theoretical analyses typically assume a predictable anisotropic response under idealized conditions [40], real-world structural applications often reveal non-uniform and complex mechanical behavior. Moreover, recent studies have enhanced the understanding of plywood deformation behavior through digital image correlation (DIC) and computed tomography (CT), enabling more accurate assessment of local strains and global deformation patterns [41].
Mechanical characterization is essential for understanding plywood’s structural performance, advancing numerical modeling and virtual testing. Parameters such as elastic modulus, shear modulus, and strength in relation to grain orientation are critical for describing the linear-elastic response of wood and wood-based materials [42]. However, conventional tests often rely on large-scale specimens [43,44], which require specialized equipment, considerable laboratory space, and significant resources, posing limitations for smaller research facilities. Shear testing is especially challenging due to the high degree of anisotropy and heterogeneity in wood [42,45,46,47].
Standardized testing methods such as PS1 [48], EN 789 [49], and EN 310 [50] generally focus on mechanical characterization in the planar directions (parallel and perpendicular to the face grain), often neglecting full orthotropic characterization. Shear properties are typically evaluated using EN 789 [49], ASTM D1037 [51], or ASTM D5456 [52], with ISO 12465 [53] offering methods for shear testing of wood products. These standards are focused primarily on bracing performance and do not capture the full anisotropic shear behavior [54]. Furthermore, universal testing machines often require customized jigs and fixtures, increasing procedural complexity [55]. Notably, tensile testing in the thickness direction is not directly addressed by these standards, with tests such as EN 314-1 [56] focusing on bonding quality instead. Compressive testing, as described in EN 789, requires composite specimens formed by assembling multiple elements with adhesives to meet dimensional requirements. Nevertheless, there is a lack of solutions addressing miniaturized specimens for comprehensive shear evaluation.
Miniaturized sample testing for wood-based materials presents significant challenges. Some researchers have proposed modified small-scale specimens for shear testing, although these often require customized equipment and only assess specific directions or bonding quality [19,55]. Common configurations include specimens for parallel-grain shear and modified Iosipescu samples. Overlap-shear tests are used to assess bond-line strength, but are limited to localized areas near the tested veneer, potentially overlooking weaker joints [57]. Reported shear-strength values vary widely depending on the material and method: 2.8 MPa and 2.2 MPa for 0° and 90°, respectively [20]; 0.97 MPa and 0.82 MPa for planar shear parallel and perpendicular to the grain [58]; and 2.41 MPa for phenol–formaldehyde-bonded plywood [59]. Laboratory-scale plywood often shows lower values (1.3 MPa per EN 314-1) than industrial panels (2.7 MPa) [38]. More recent studies have used reduced-size samples for tensile and compressive testing [19,60], exploring in-plane behavior at varying grain angles, though no direct methods exist for characterizing out-of-plane properties.
Various techniques have been employed for strain measurement in wood and wood-based materials. Traditional approaches include mechanical extensometers, which provide high-accuracy axial strain readings over defined gauge lengths but are limited by specimen geometry and gripping constraints. Surface-mounted strain gauges offer localized strain data but require careful bonding and are sensitive to wood’s surface texture and moisture content. Digital Image Correlation (DIC) enables full-field, non-contact strain mapping and has seen increased use in recent years, though it demands precise calibration and optical setup. Crosshead displacement tracking, while more indirect, is widely applied in compression and small-scale tests, especially when corrected for system compliance. In this study, we combine extensometer-based measurements for in-plane tension with crosshead-based readings for compression and shear, following compliance corrections based on full-size reference tests, to ensure accurate mechanical characterization of miniaturized specimens.
Fracture prediction in anisotropic, heterogeneous materials is inherently challenging and requires constitutive models that remain valid across loading paths and degradation regimes, supported by comprehensive experimental evidence. Accurate strategies for anisotropic fracture have been developed, including micromechanical formulations that capture localized damage phenomena at small scales [61,62]. In wood-based materials, damage and fracture are strongly direction-dependent and further conditioned by processing variables such as cutting and veneer manufacturing [20,25]. Interfacial bonding also governs system-level response and is typically assessed through micro- and macro-scale techniques, including acoustic-emission monitoring and fragmentation-based testing [63].
Based on a comprehensive literature review, current standards and publications still lack protocols for fabricating miniaturized specimens that enable orthotropic shear characterization in all three principal directions—measurements essential for constitutive descriptions of highly anisotropic plywood panels. Although adaptations of the Iosipescu shear test exist for wood materials, they typically probe only two directions and often require extensive sample preparation and specialized fixtures [47]. The absence of standardized miniaturized protocols continues to hinder the characterization of thin or small-scale panels [49,50,52].
These gaps underscore the need for reliable, scalable procedures to capture full orthotropic behavior, particularly for earthquake-resistant structural design and Industry 4.0 integration. Accordingly, the present study is strictly experimental and focuses on the development and validation of miniaturized test specimens and procedures for the full orthotropic characterization of Pinus radiata plywood.
Although miniaturized specimens enable comprehensive multi-directional testing with efficient material use, scaling effects must be considered when relating their mechanical responses to those of full-size industrial panels. Prior investigations on wood and plywood have shown that strength tends to decrease with increasing specimen size, whereas stiffness parameters are comparatively less sensitive, a trend explained by weakest-link and Bažant-type statistical frameworks [64,65,66]. When geometric similarity, veneer lay-up, fiber orientation, and bonding quality are preserved, miniaturized tests have been demonstrated to reproduce local deformation and failure mechanisms representative of larger structural members [20,47]. The weakest-link theory interprets size dependence in timber by recognizing that a larger volume contains a greater number of potential defects, such as knots or grain deviations, thereby increasing the probability of encountering a critical flaw and reducing overall strength [66]. Consistent with this theoretical framework, these findings support that small-scale experimental results can effectively inform the orthotropic mechanical parameters of industrial-scale plywood while minimizing the influence of natural defects such as knots, thereby reinforcing the relevance and reliability of the present methodology.
Altogether, this study introduces a unified miniature-specimen methodology for complete orthotropic mechanical characterization of plywood, capturing axial and shear properties in all principal material directions using only standard laboratory equipment. The approach overcomes current limitations in standardized testing by enabling direct measurement of out-of-plane and multi-directional shear responses. The resulting dataset provides high-fidelity input for orthotropic constitutive modeling and supports advanced numerical simulation, virtual testing, and performance-driven structural design of plywood.

2. Materials and Methods

2.1. Materials

Two types of structural plywood panels, manufactured by national suppliers EAGON Lautaro S.A. (Manufacturer 1) and ARAUCO S.A. (Manufacturer 2), were selected for orthotropic mechanical characterization. Both products, commercially available across Chile, were sourced from the La Araucanía region. Each panel had a nominal thickness of 18 mm and consisted of seven layers of Pinus radiata veneers bonded perpendicularly with structural adhesive. Manufacturer 1 reported the use of a bio-based adhesive as specified in the product datasheet, with no further information available on its composition. Manufacturer 2 used a conventional phenol formaldehyde resin. Two panels per manufacturer were tested, each with nominal dimensions of 1220 mm × 2440 mm.
Figure 1 illustrates the heterogeneity in veneer thickness within the selected panels. F1 is characterized by thicker perpendicular veneers, whereas F2 displays a more uniform configuration. Such structural differences are directly reflected in their strength performance as shown in the Results section.
Moisture content was determined via oven-dry testing on five specimens per manufacturer, yielding an average value of 10.5 ± 0.5%. Panels were stored in sealed pack-aging under indoor conditions prior to testing.
All mechanical tests were conducted in a temperature-controlled environment (20 ± 2 °C). Tensile tests in the parallel (Tx) and perpendicular (Ty) directions to the face grain were performed on an INSTRON 8801 testing machine (100 kN capacity), equipped with contact extensometers for in-plane measurements. Out-of-plane tension (Tz) and compression tests in the three principal material directions (Cx, Cy, Cz), and shear tests (τxy, τyx, τxz, τyz) were performed on an INSTRON 3369 universal testing machine (50 kN capacity).

2.2. Samples Geometries and Manufacturing Toolpaths of Miniature Specimens

In this study, a global orthogonal coordinate system and orthotropic material directions for plywood are adopted—X parallel to the face grain, Y perpendicular to the face grain, and Z through the panel thickness. The stress tensor notation follows the standard Cartesian form and underpins the specimen geometry and testing configuration. Specimen designs were based on EN 789, NCh 3617, and ASTM B831 [49,67,68].
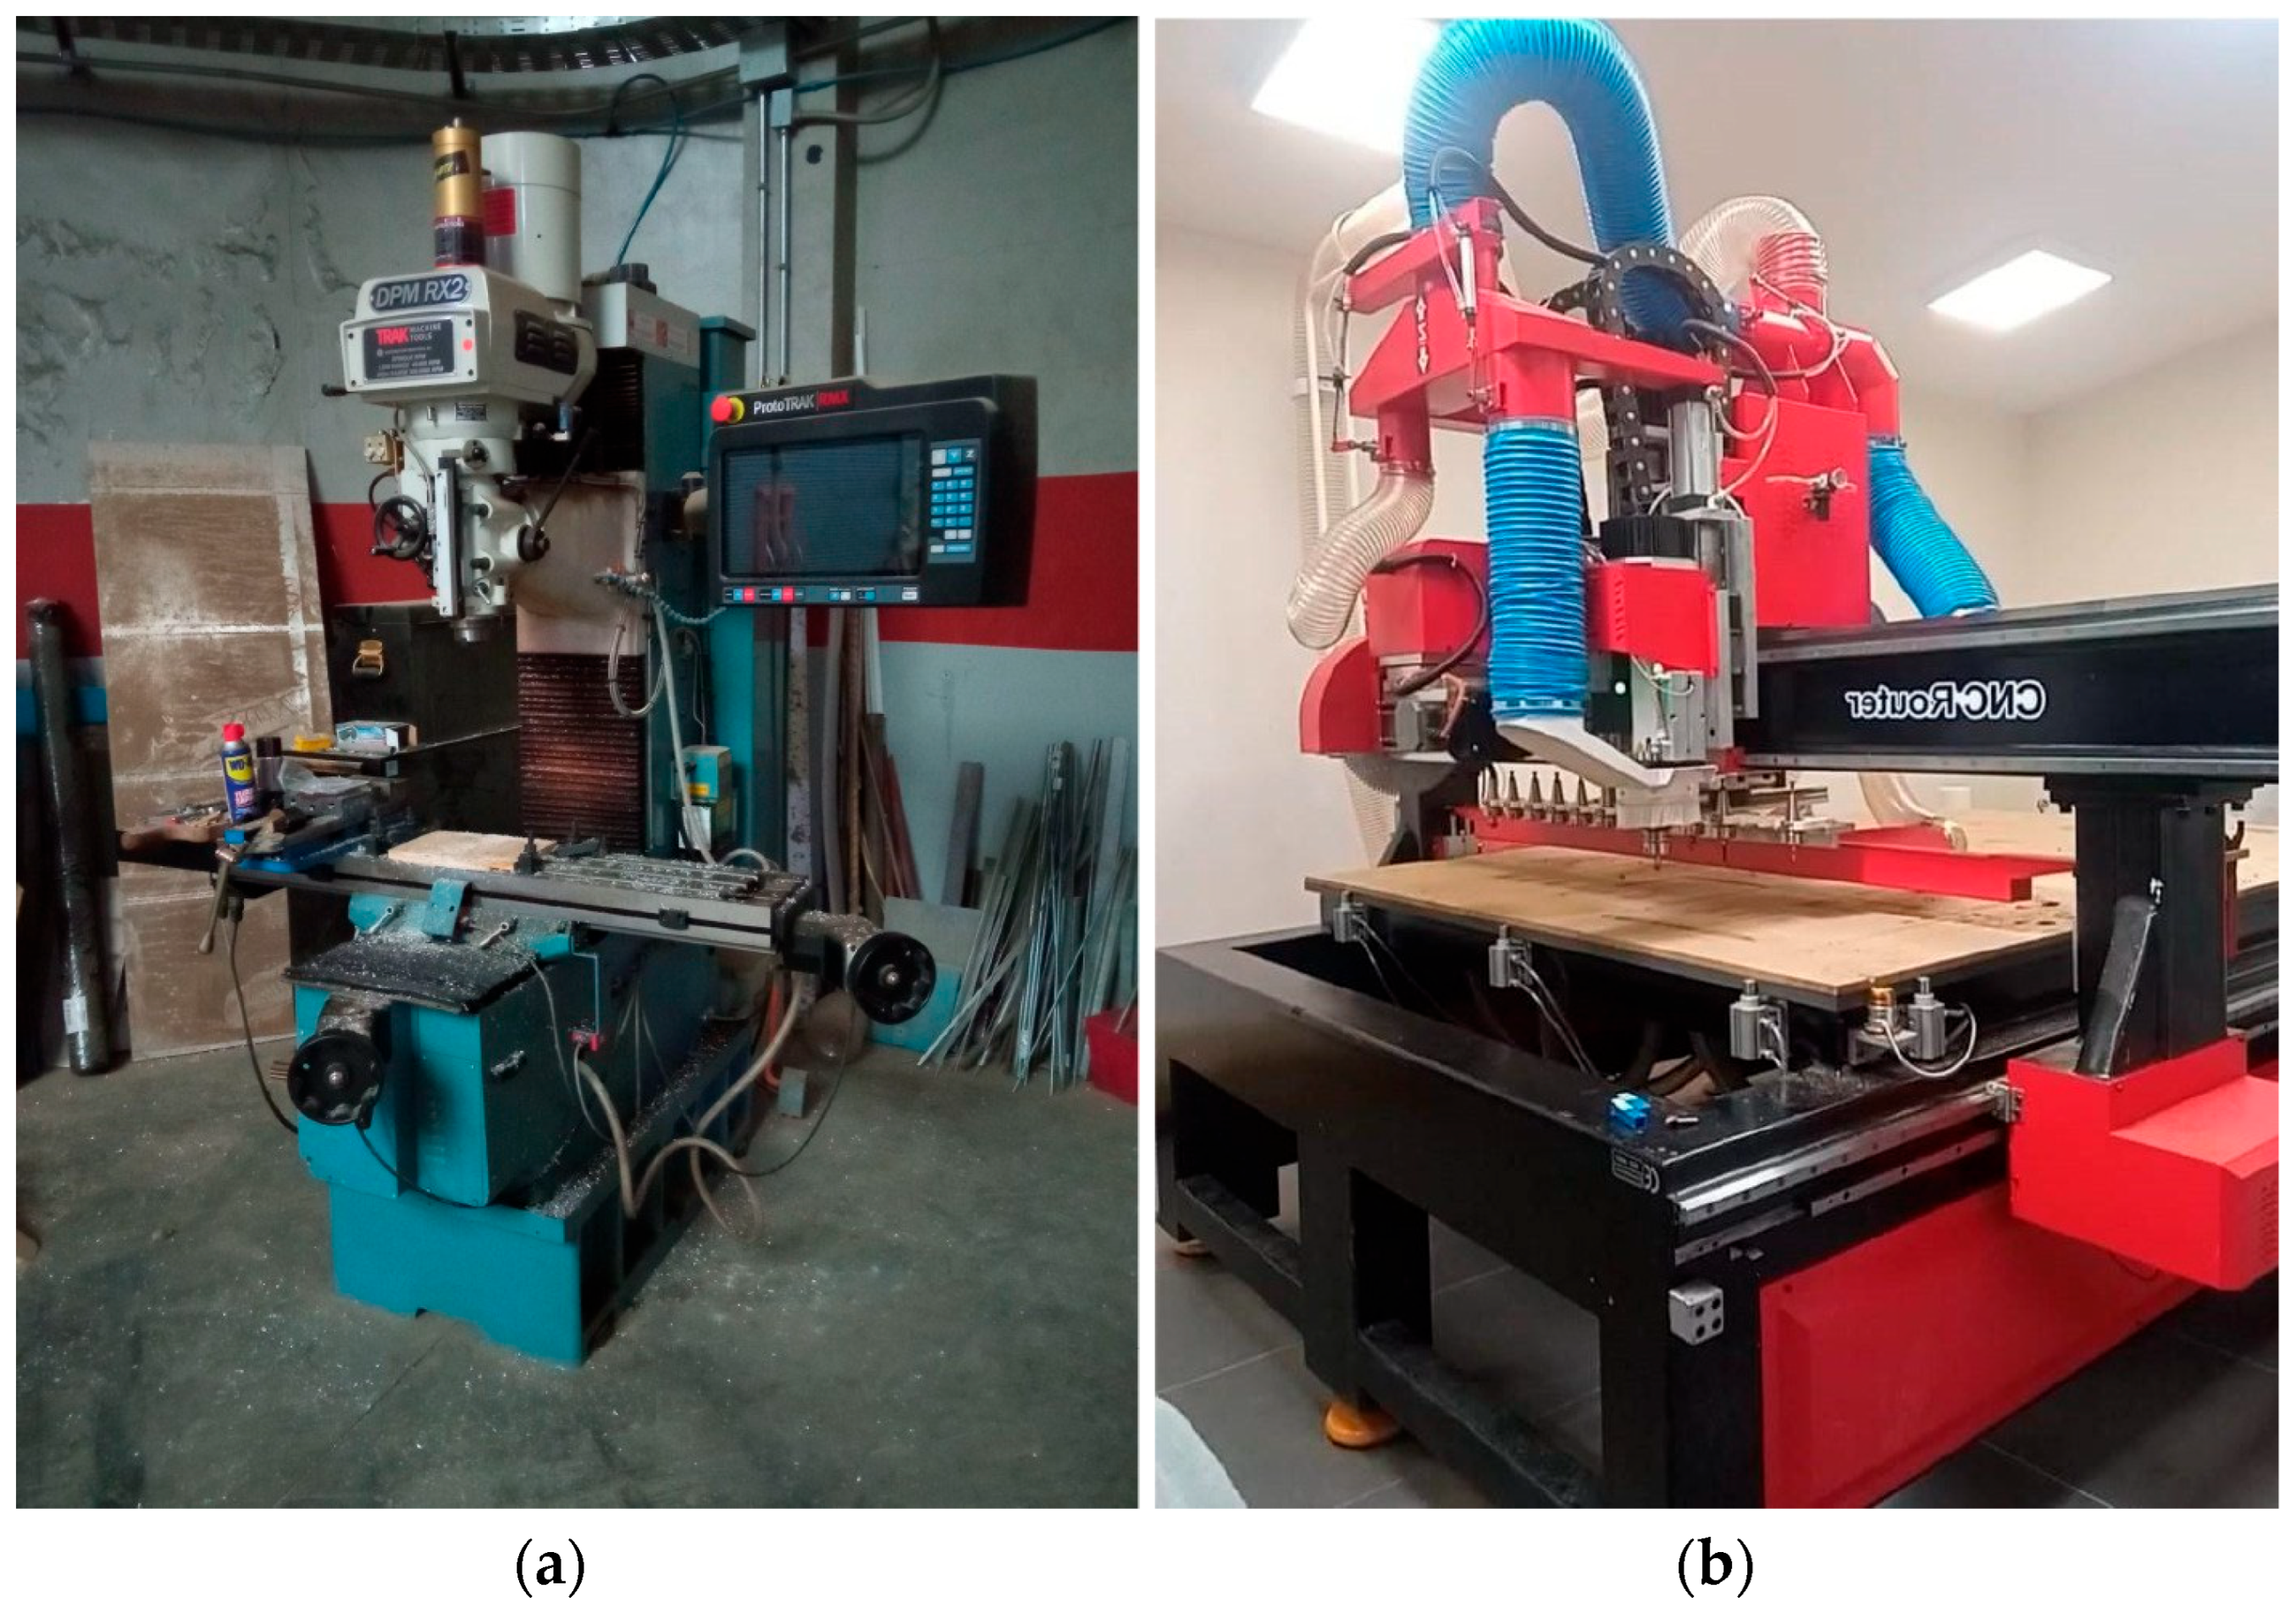
Initially, all tests required for orthotropic property determination were identified: compression, tension, and shear. Flexural testing was excluded, as it does not generate a uniform stress state over a sufficiently homogeneous region to calibrate a material model. Furthermore, manufacturer-reported data and quality control records already contain extensive bending test results. Miniature geometries were defined to eliminate the need for additional mounting accessories while ensuring localized failure in the gage section. CNC manufacturing toolpaths were prepared and post-processed to G-code for the specific router used. Figure 2 shows the CNC equipment employed, primarily a bed-type router (Figure 2a).
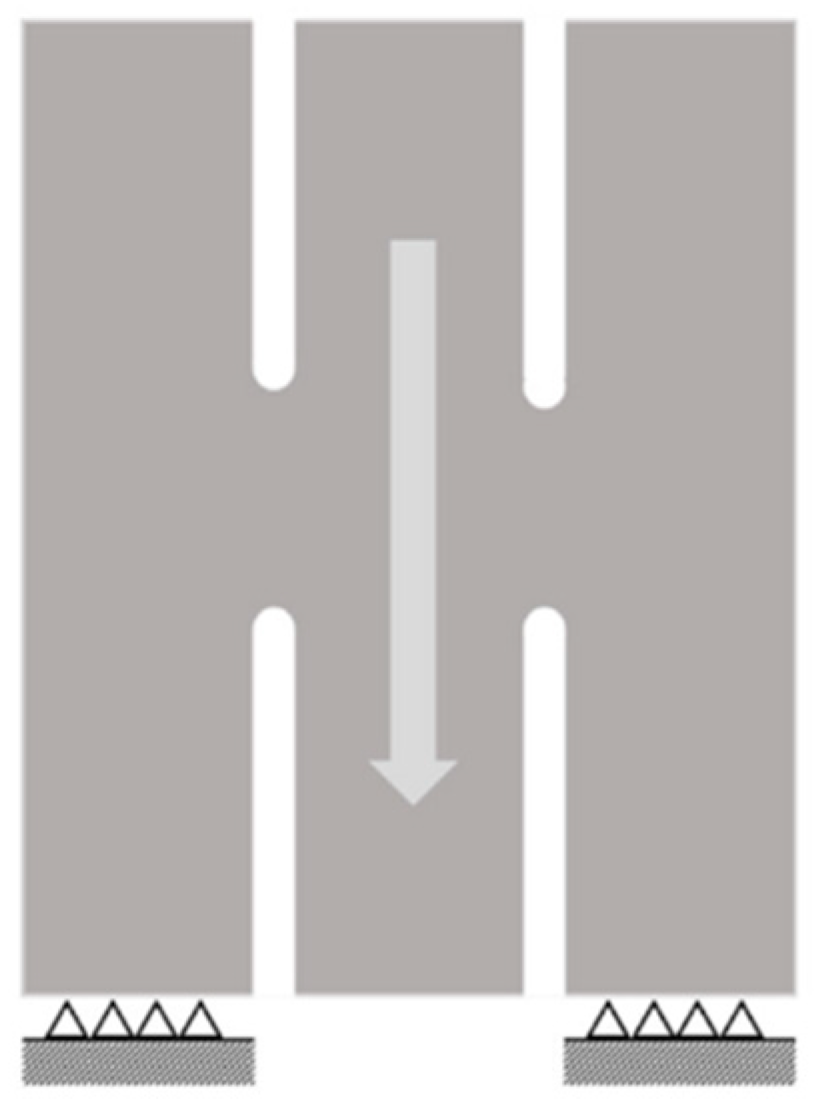
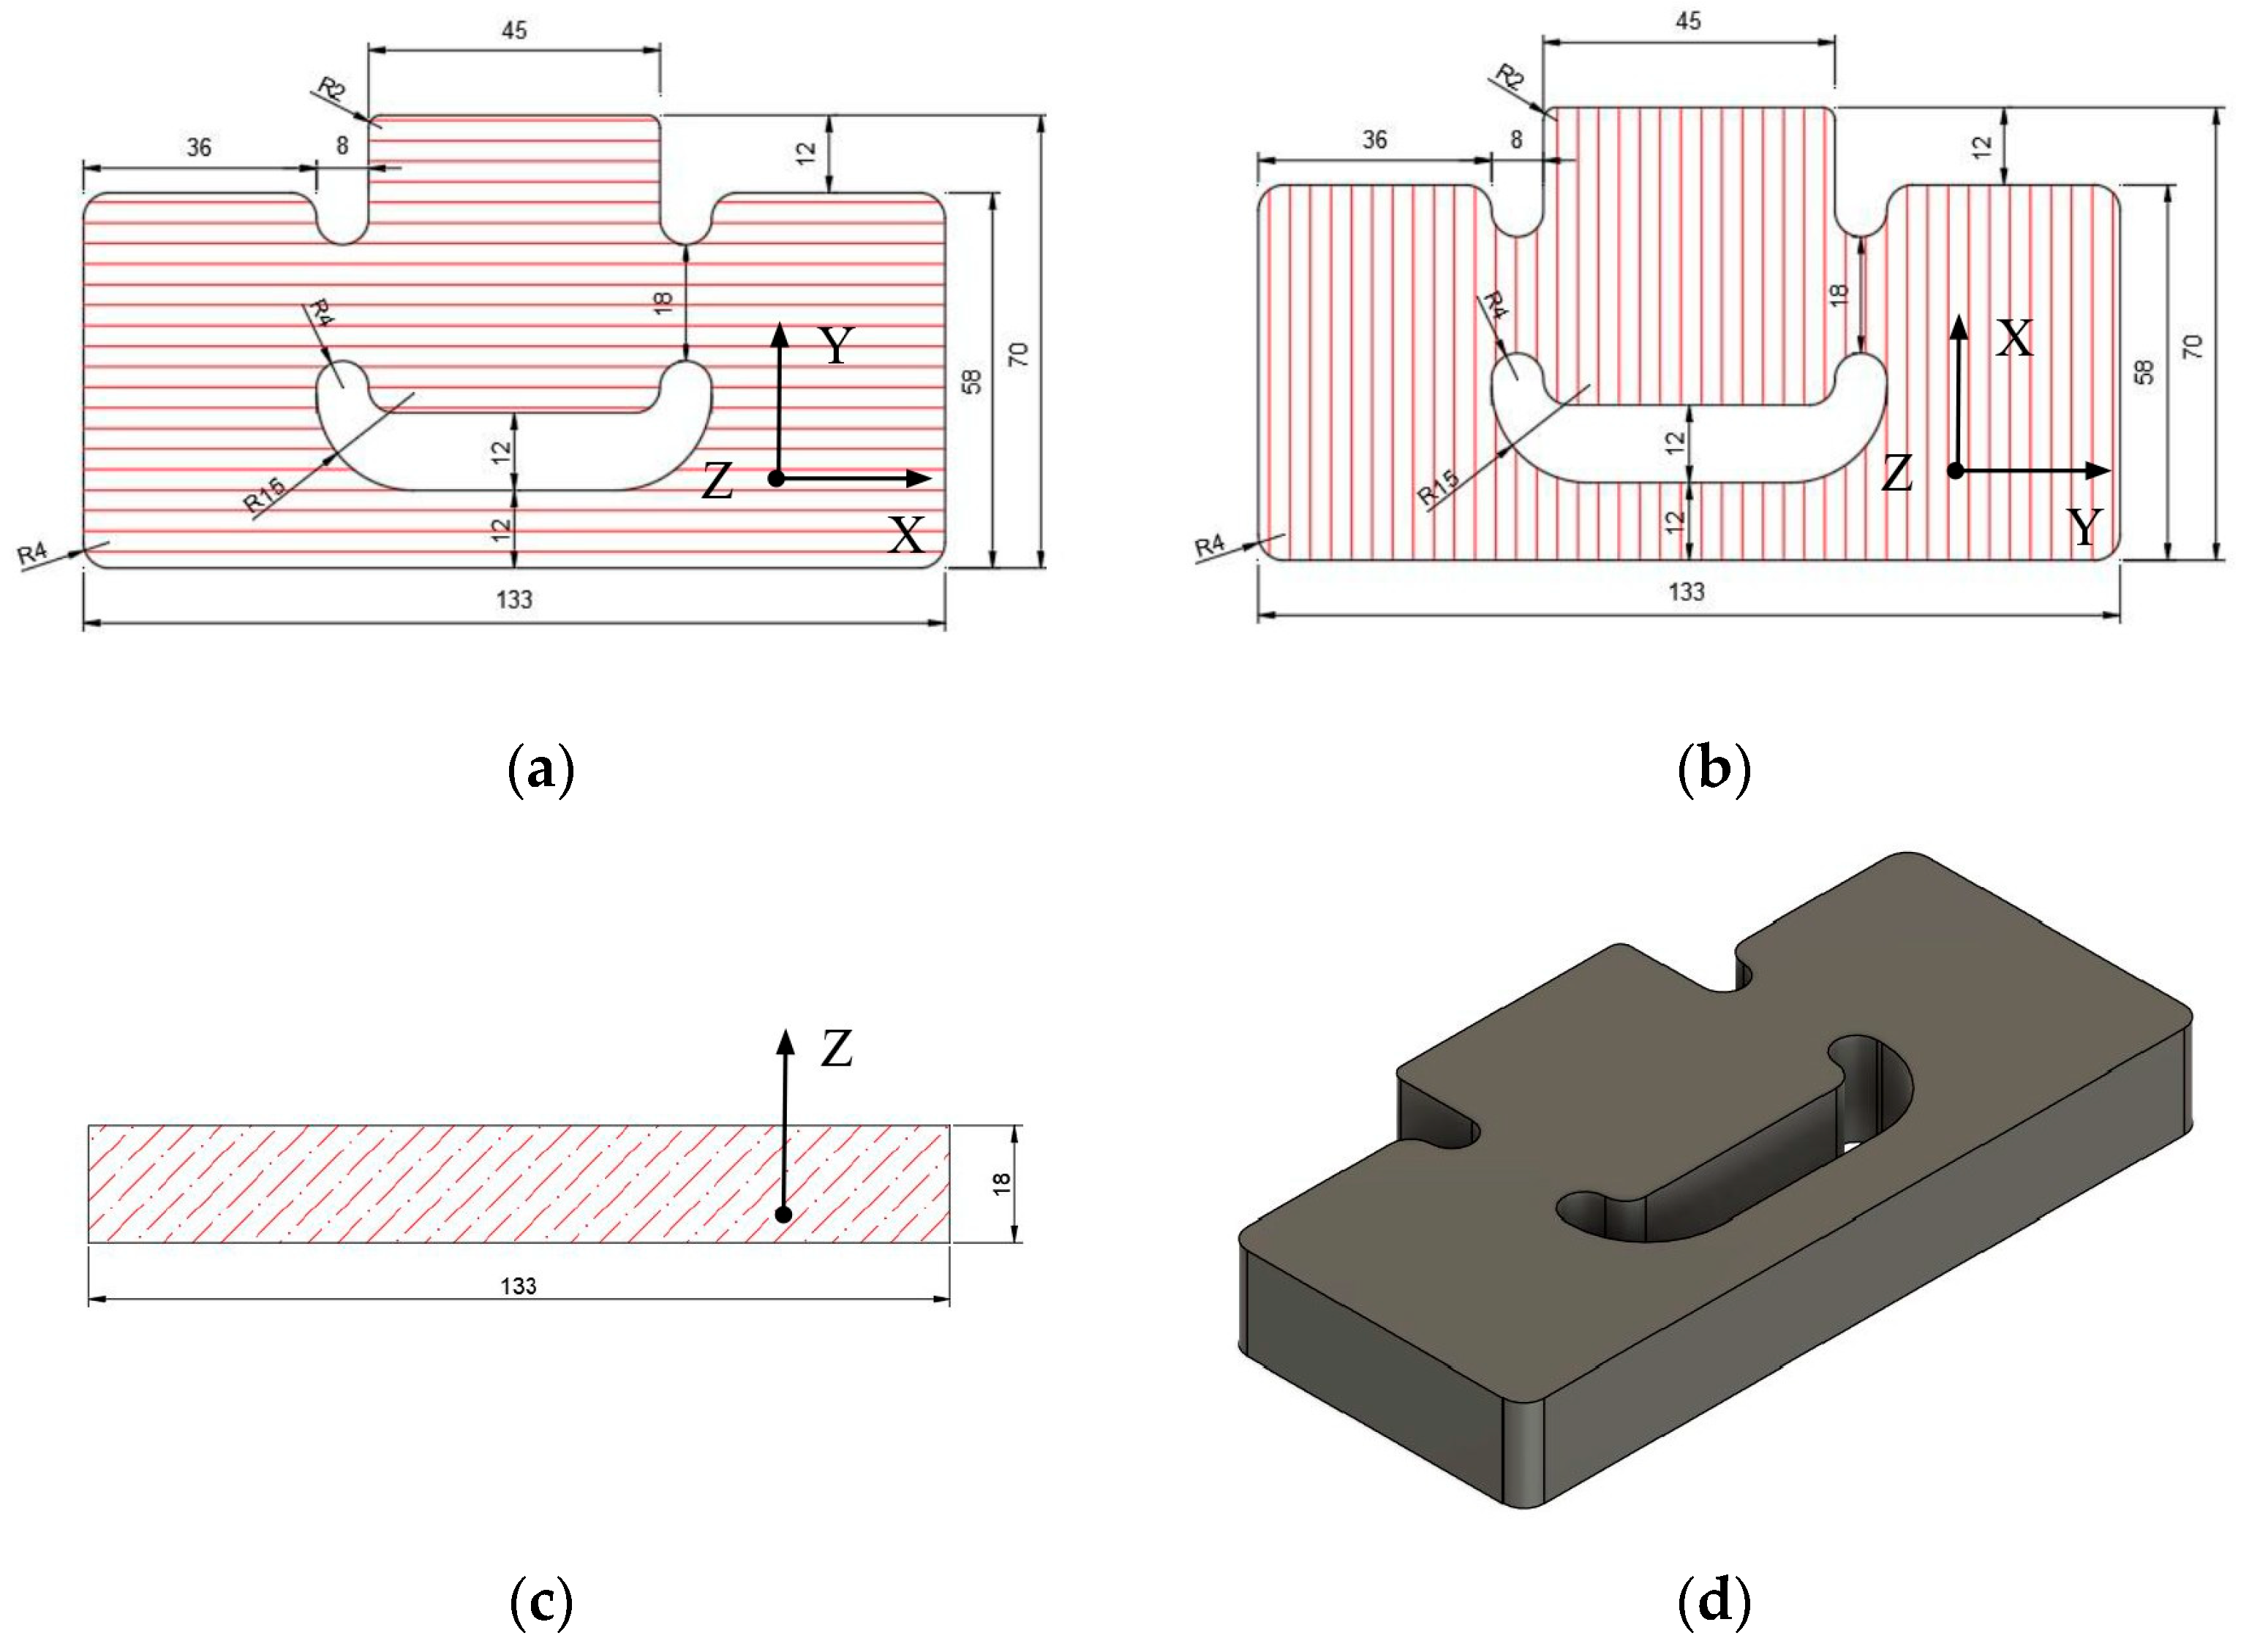
Shear specimens’ designs were inspired by the Miyauchi geometry [69] (Figure 3), with two shear zones where the inner section is compressed to generate pure shear between the three parallel bars. The original 900 mm height and 440 mm width were reduced to 200 mm and 91 mm, respectively, to improve handling and fixture compatibility.
Compression specimens (Cx, Cy, Cz) followed EN 789 recommendations but were scaled to match the orthotropic characterization requirements. Tensile specimens along X and Y directions were shortened from EN 789 dimensions while retaining a slender section suitable for extensometer attachment. Out-of-plane tension specimens were designed according to the work of Bitar et al. [70], maintaining a 2:1 length-to-width ratio. Due to their reduced size, Tz specimens required low-cost, easily sourced PLA grips manufactured by additive manufacturing.
All specimen designs ensured failure occurred within the gage section and excluded specimens with knots or manufacturing defects in the test area. Toolpaths were developed for each geometry following EN 789 recommendations for representative extraction across the panel area. Final designs included complete geometry specifications and CNC manufacturing toolpaths for each specimen type.
Two panels per manufacturer were tested. From each panel, five miniature specimens were prepared and tested per mechanical configuration and loading direction to ensure statistical reliability.
Although specimen dimensions were miniaturized, all tests were performed under quasi-static conditions with strain rates consistent with standard-scale protocols to ensure mechanical equivalence. The reduced geometry may influence the spatial distribution of stress and strain but not the rate-dependent behavior. The relationship between miniature and full-scale results, including potential limitations and scale effects, is discussed in Section 4.
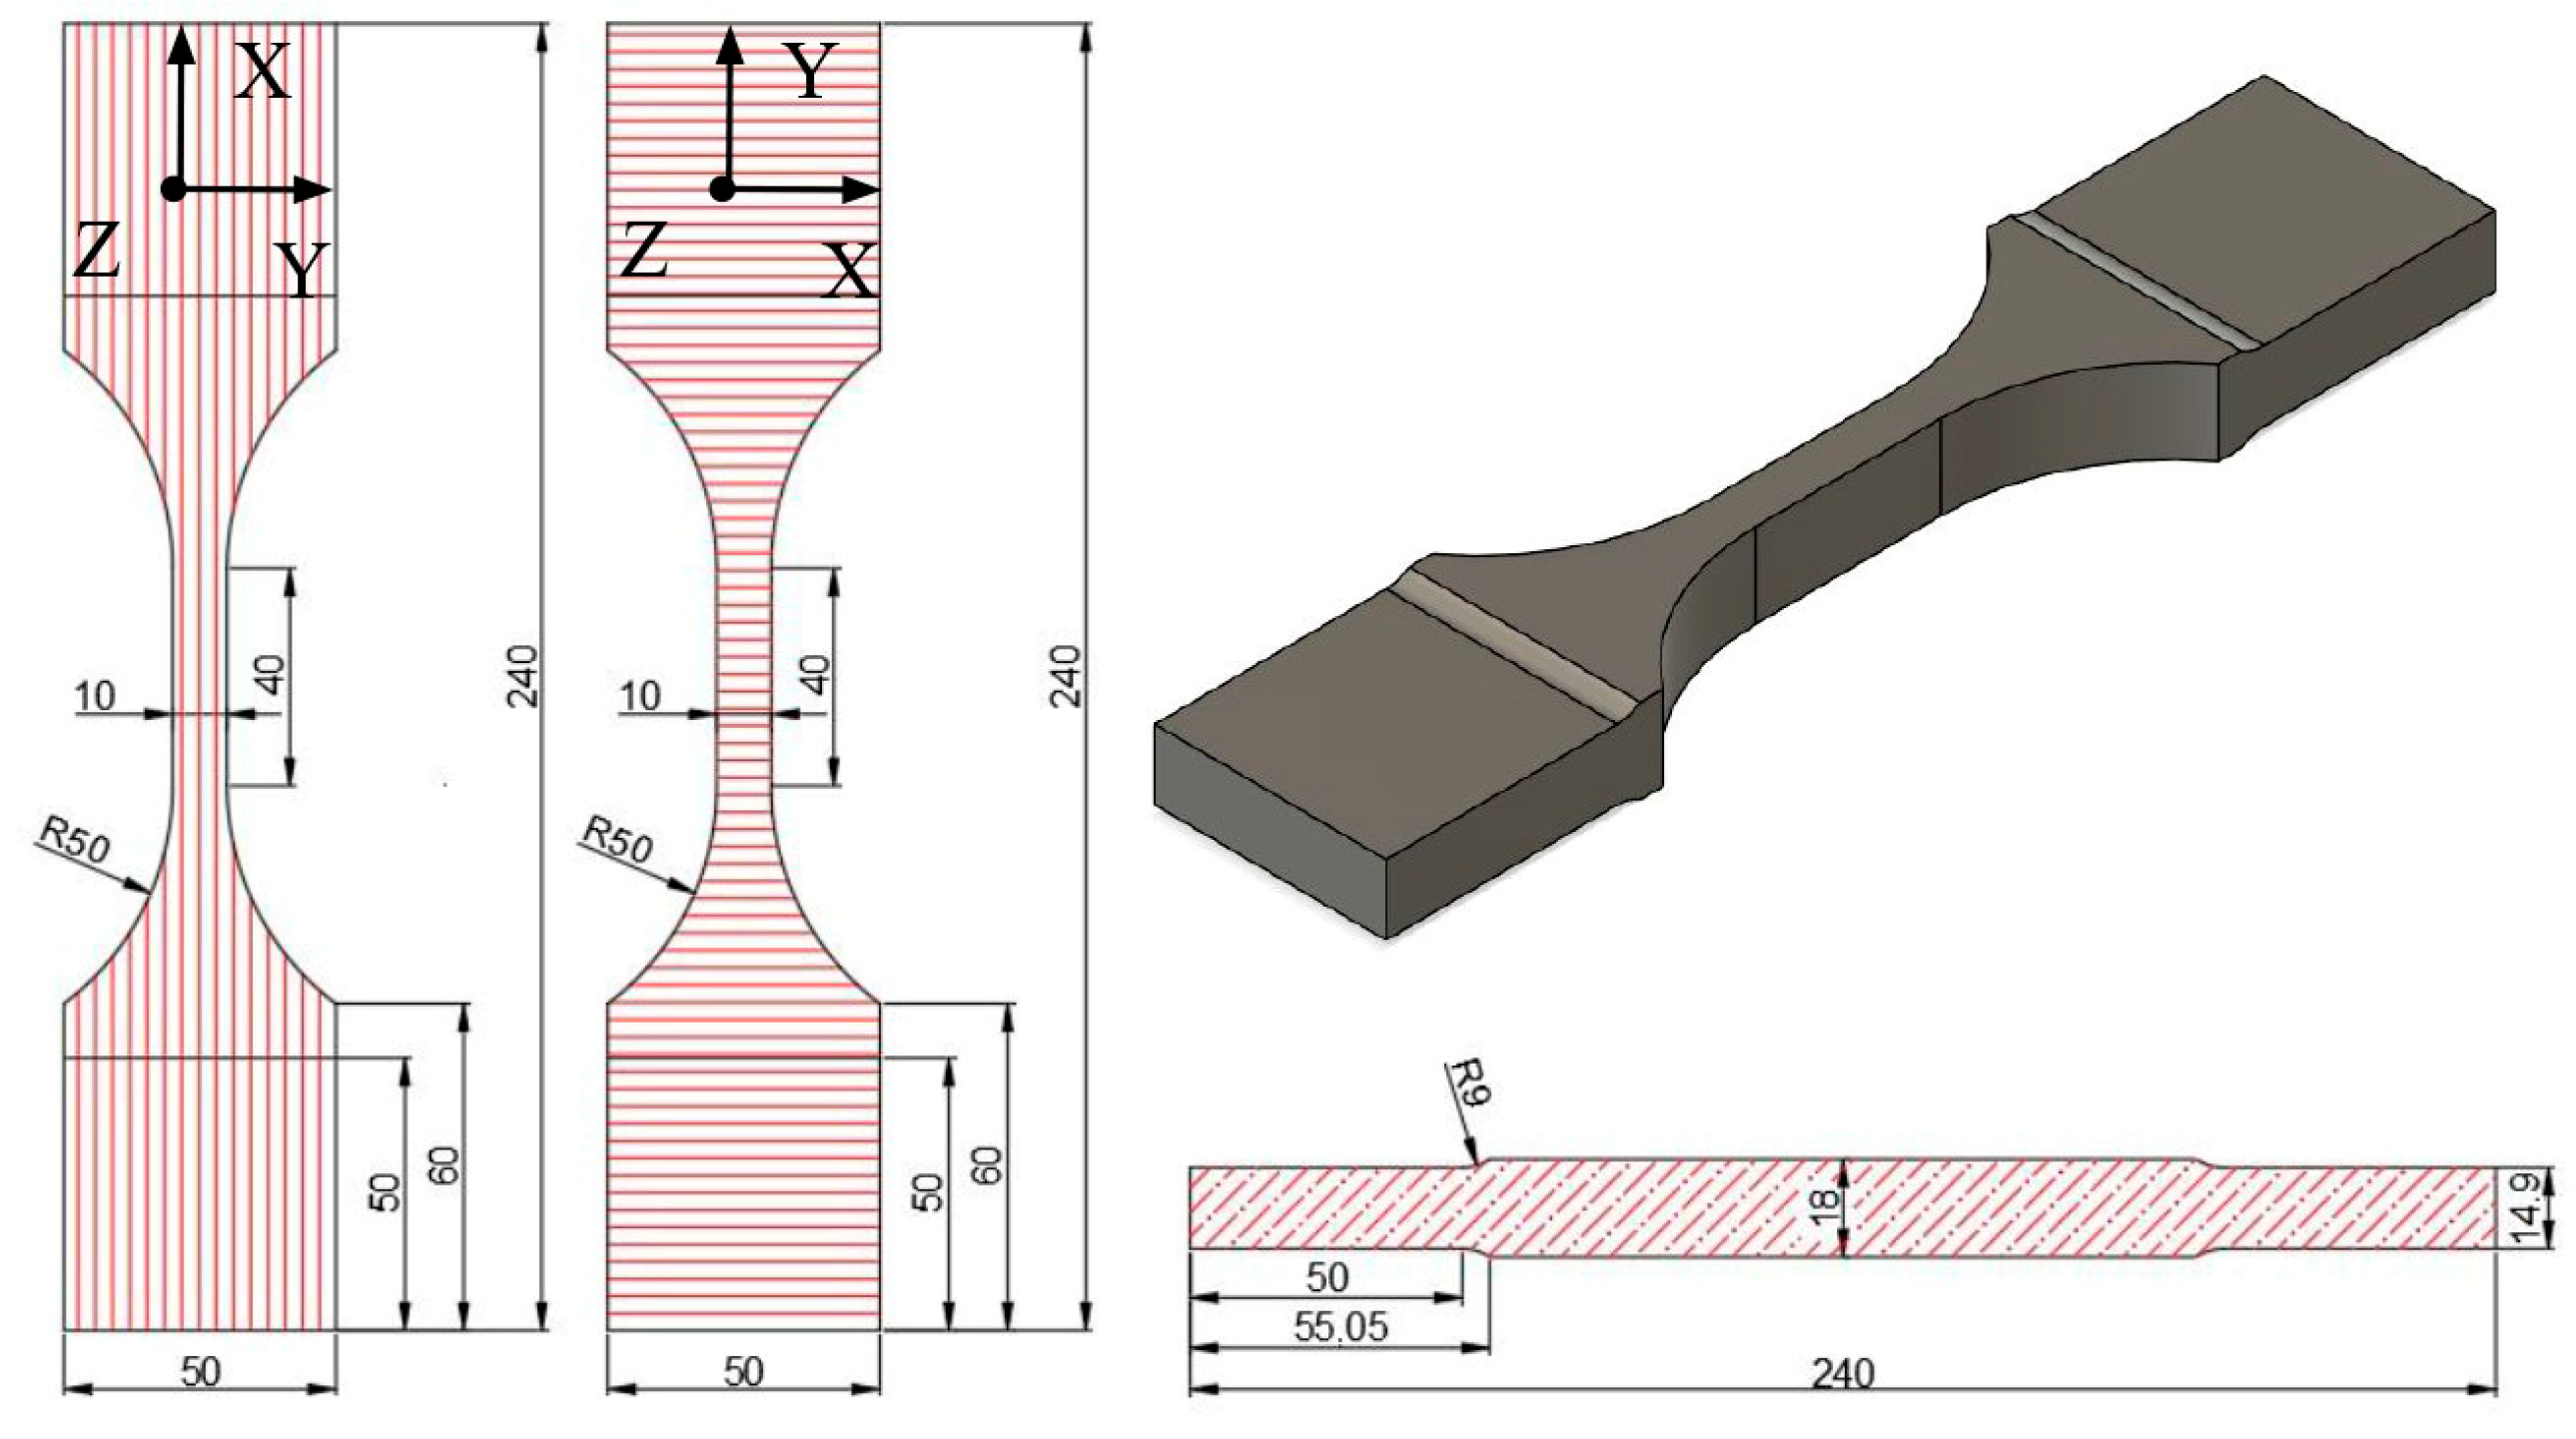
The development of miniature mechanical test specimens began with the generation of 2D and 3D models. Figure 4 shows the final geometry of tensile specimens for parallel-to-grain (Tx) and perpendicular-to-grain (Ty) testing. The total length was 240 mm with a width of 50 mm for all specimens. In the gripping regions, a thickness reduction of 1.55 mm was applied on both faces to comply with the clamping range of the testing machine and to facilitate installation. Stress-relief fillets with a 9 mm radius were incorporated at thickness transitions to prevent premature failure. The central test area measured 10 mm in width and 40 mm in length, with a cross-section of 10 mm × 18 mm.
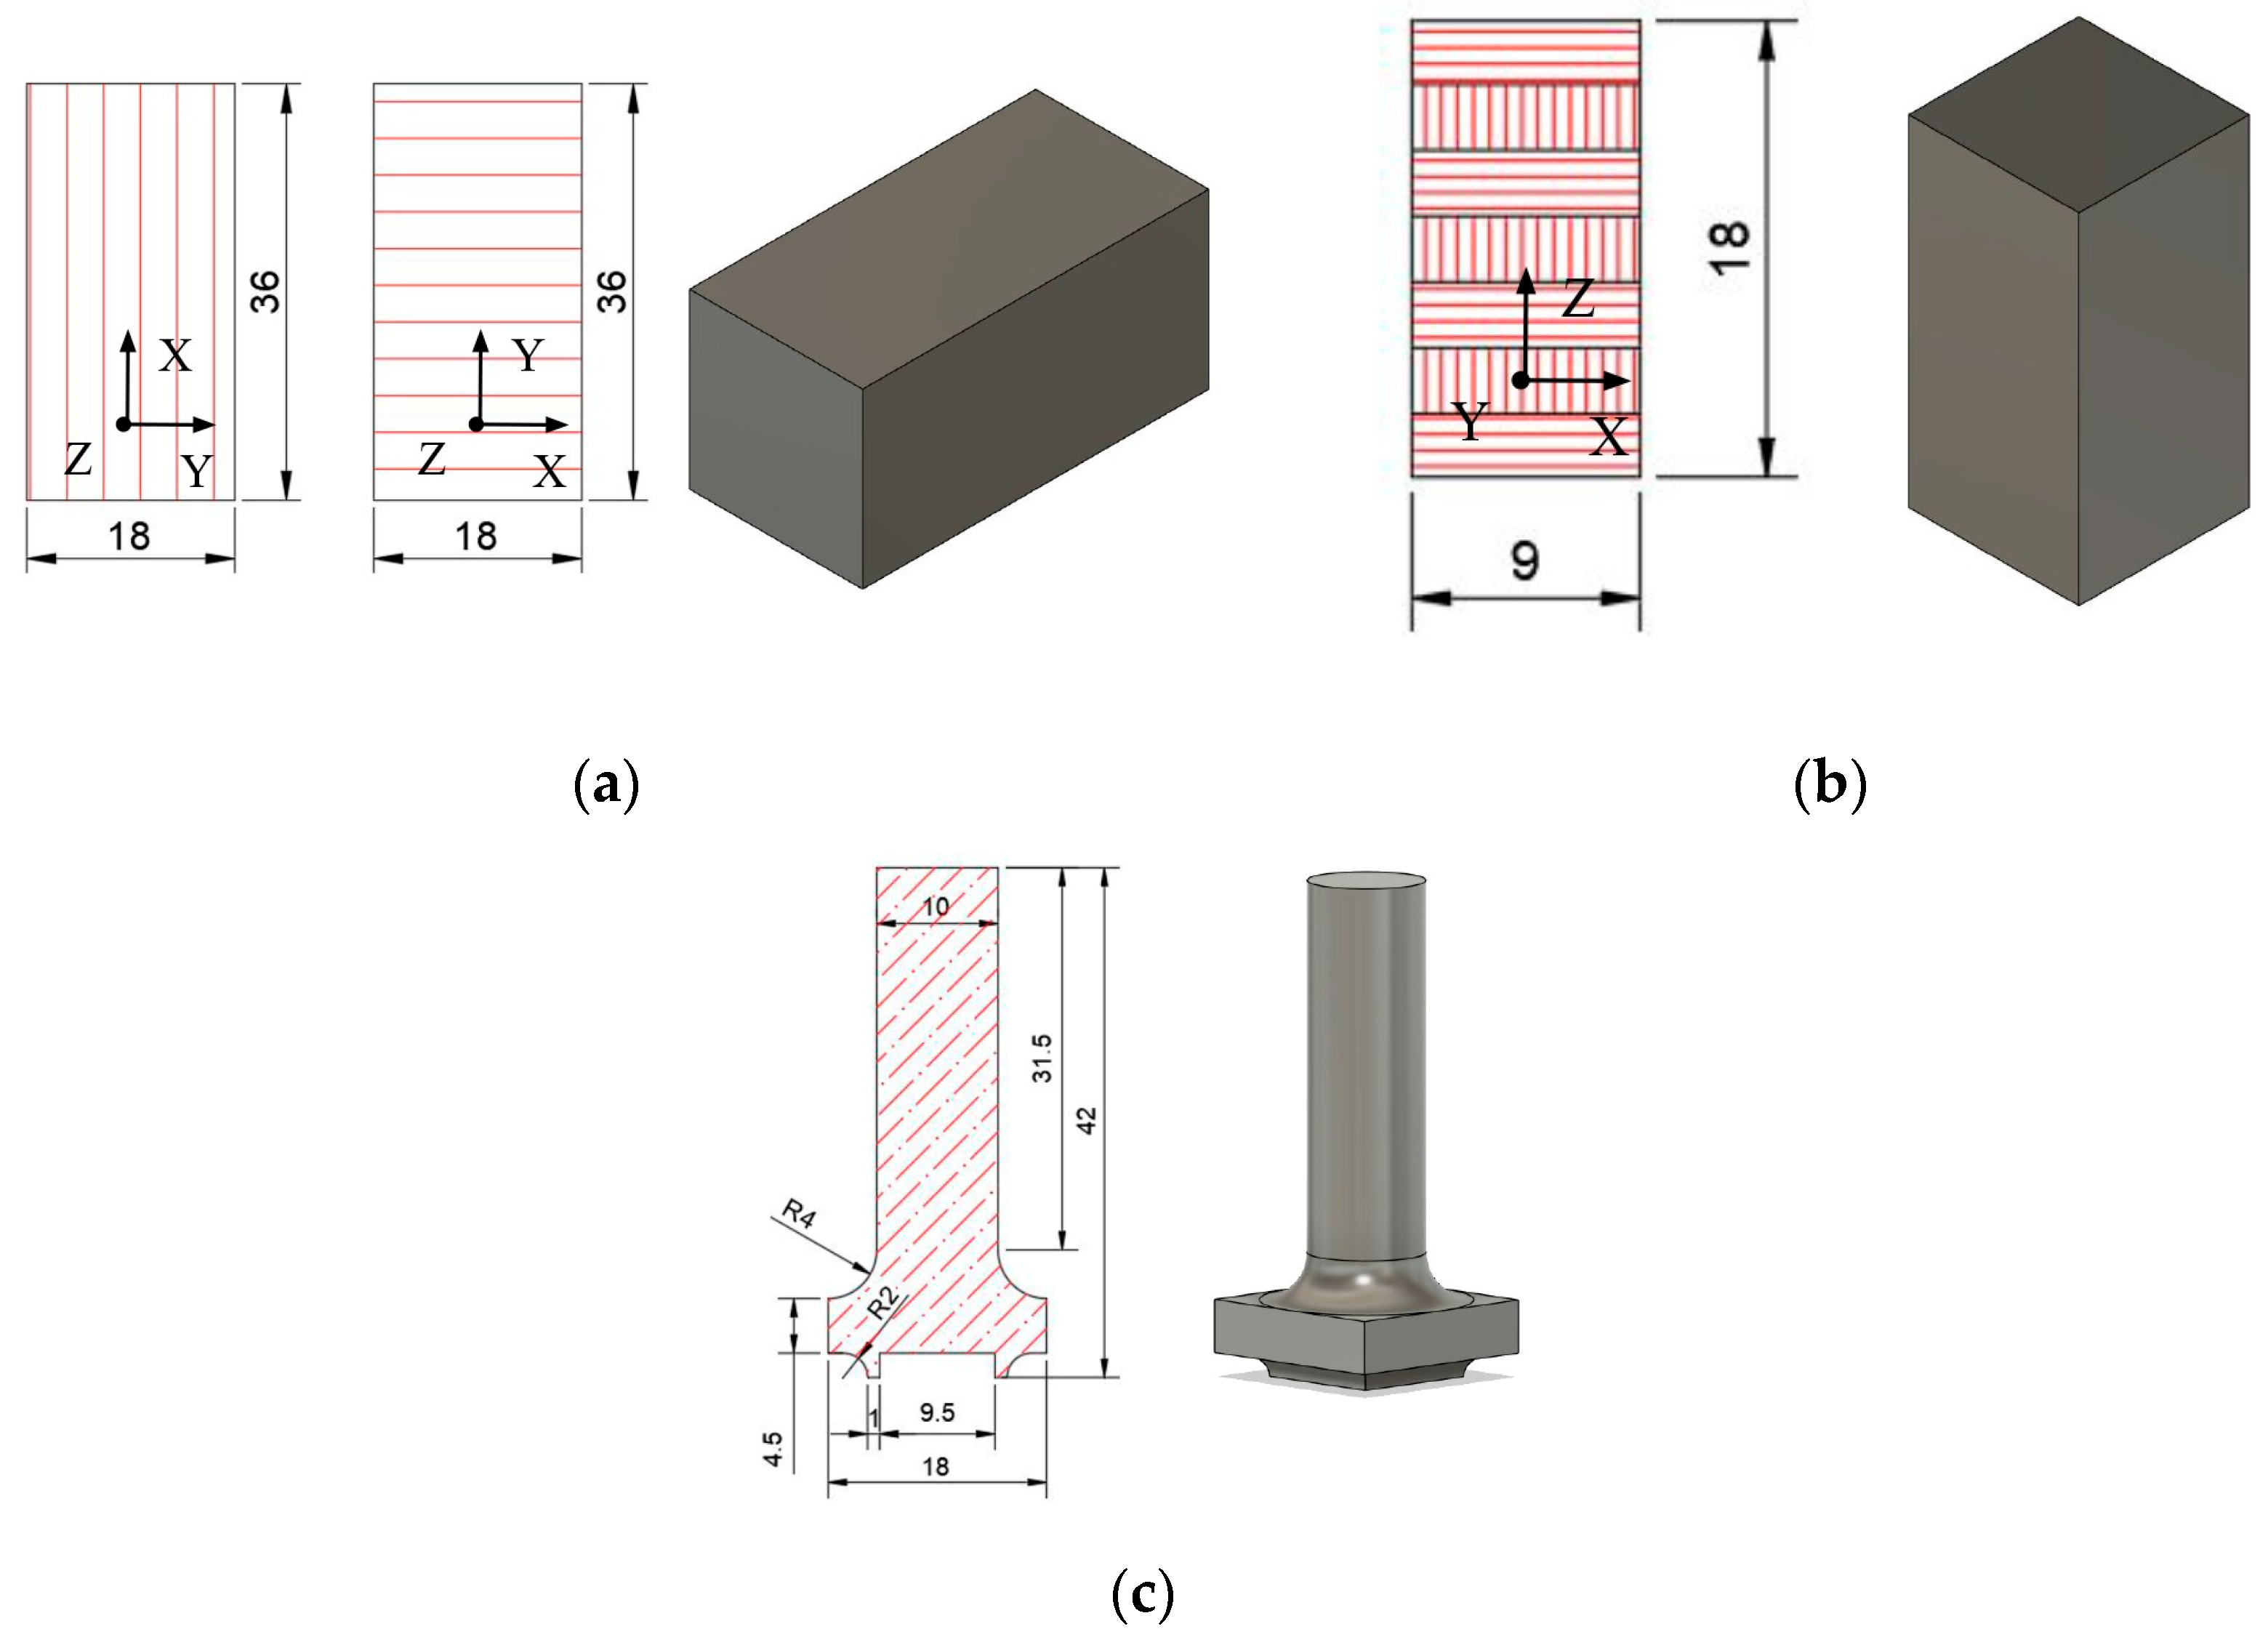
Compression specimens for Cx and Cy tests (Figure 5a) had a prismatic geometry with a height of 36 mm and a cross-section of 18 mm × 18 mm. For Cz compression and Tz tensile tests, prismatic specimens with a height of 18 mm and a 9 mm × 9 mm cross-section were used (Figure 5b). In Tz tensile tests, a PLA additively manufactured accessory (Figure 5c) was employed to connect specimens to the grips.
The potential compliance of the PLA grips was evaluated through accessory-only calibration tests and subtracted from Tz displacements, while plate-on-plate calibration was used for compression and shear following Tuninetti et al. [20,71] displacement-correction methodology, ensuring that the reported responses reflect the specimen behavior exclusively.
Single-shear specimens designed to evaluate the in-plane shear stress components (τxy and τyx) were tested using a configuration developed by Tuninetti et al. [20], which is based on the Miyauchi design principle, as illustrated in Figure 6. The geometry measured 133 mm × 70 mm, with a double shear test zone of 18 mm × 18 mm. Cross-sectional reinforcements were incorporated in all three pillars to prevent combined stresses.
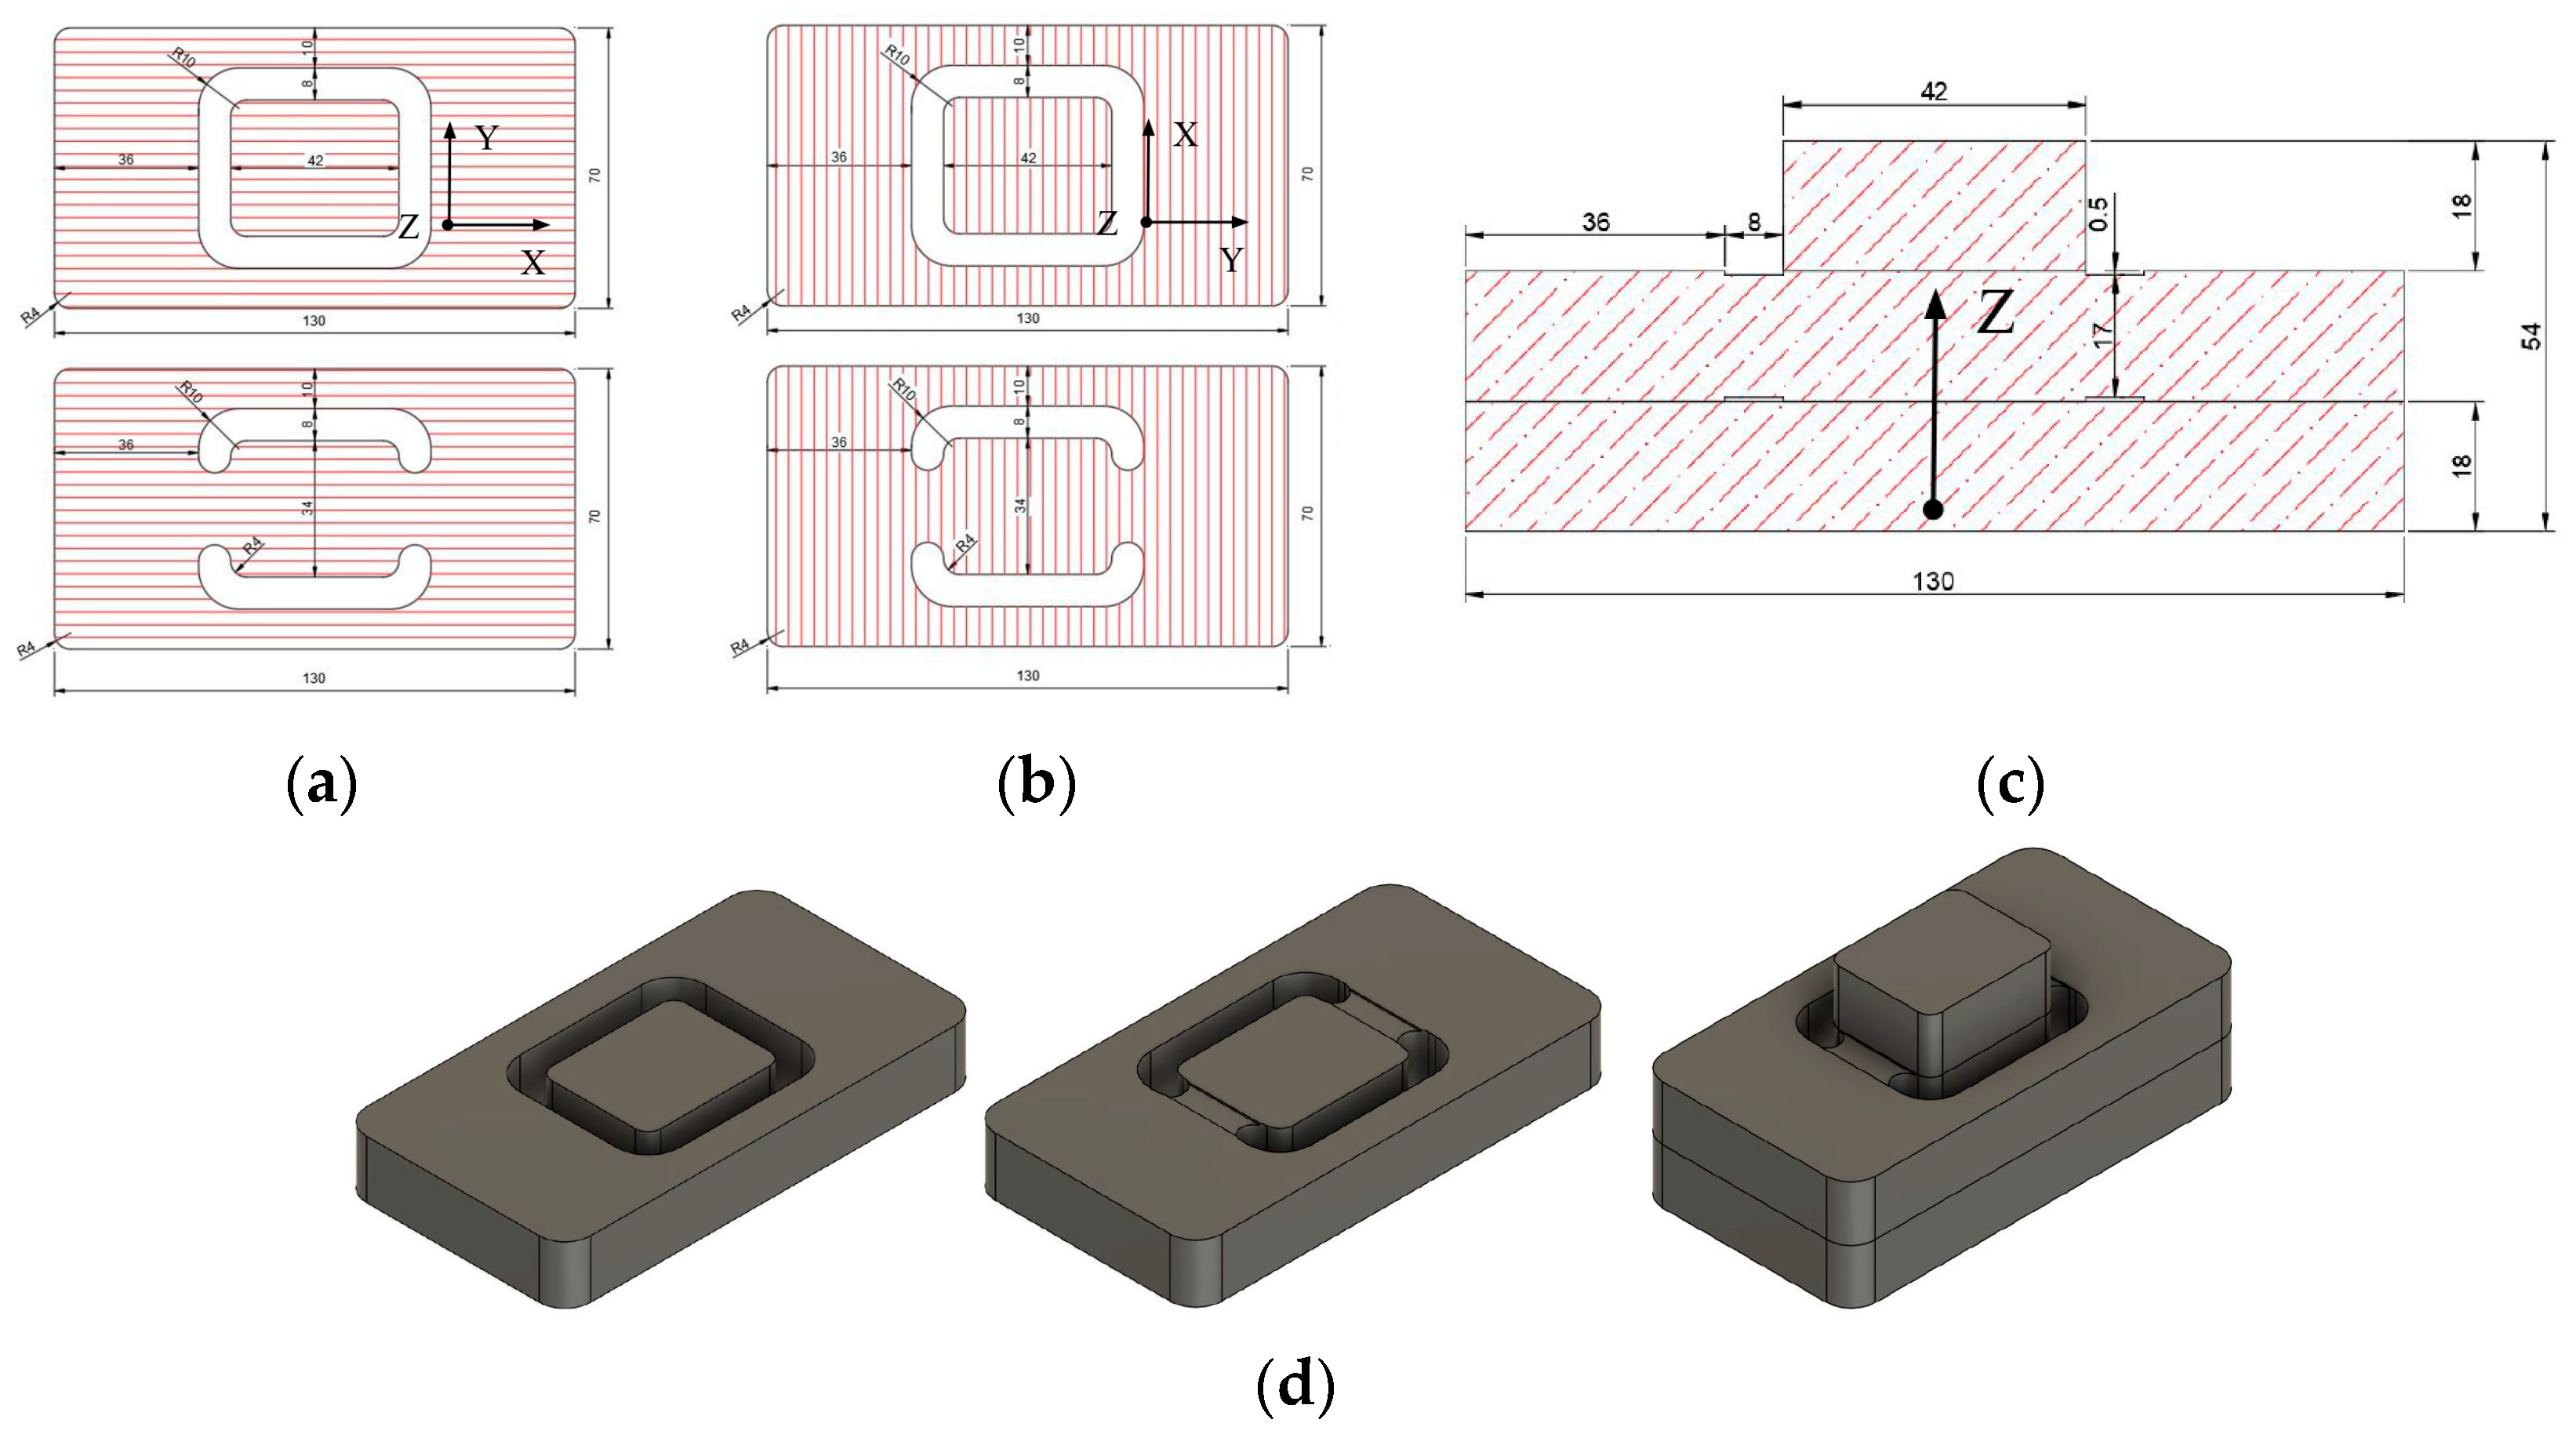
Specimens for τxz and τyz shear tests developed by Tuninetti et al. [20] consisted of three bonded components (Figure 7). The bonding was achieved using Grip Bond 1 wood adhesive to avoid slippage during testing. The shear zone included a uniform groove of 8 mm width and 0.5 mm depth to promote failure in the intended region. The loading surface measured 42 mm × 34 mm.
Once the geometries were defined, CNC router toolpaths were generated. Figure 8 illustrates the top and bottom cutting trajectories for Tx and Ty tensile specimens. Figure 9a shows the combined toolpath for manufacturing Tz tensile, Cx, Cy, Cz compression, and τxyτyx shear specimens. Figure 9b presents the toolpath for in-plane compression and shear specimens. Figure 9c,d display the toolpaths for τxzτyz specimens, with (c) for top and bottom parts, and (d) for the intermediate shear-loaded element.
The toolpath for additive manufacturing of the Tz tensile test accessory is presented in Figure 10, showing (a) the top view with infill pattern and fiber orientation, and (b) the isometric view highlighting support structures designed to minimize deformation during printing.

2.3. Mechanical Testing Procedures and Data Reduction

2.3.1. Test Speed

All mechanical characterization tests were conducted under quasi-static conditions, ensuring a sufficiently low strain rate to maintain mechanical equilibrium throughout loading [71]. The strain rate ε ˙ was computed as:
ε ˙ = u l · t
where ∆u is the displacement increment (mm), l is the initial gauge length (mm), and ∆t is the elapsed time (s). For all tests, ε ˙ ≤ 0.01 s−1.
The deformation contributions from the grips and testing frame were quantified through separate calibration tests (plate-on-plate and accessory-only runs). The measured machine compliance was subtracted from the total displacement to avoid systematic errors in stiffness estimation [20,71]. The experimental results presented herein represent the static elastic and strength behavior of plywood, while dynamic or cyclic effects remain beyond the scope of this study.

2.3.2. Tensile Tests

Parallel-to-grain (Tx) and perpendicular-to-grain (Ty) tensile tests were performed using an INSTRON 8801 universal testing machine (100 kN) equipped with a contact extensometer. The tensile modulus ETx,Ty was determined as
E T x , T y = σ T x , T y ε T x , T y = σ 40 % F m a x σ 10 % F m a x ( ε 40 % F m a x ε 10 % F m a x )
σ T x , T y is the increment of stress between 10% and 40% of the maximum stress σFmax (MPa) and, ε T x , T y is the corresponding increment of axial strain between 10% and 40% of σFmax. The axial stress (σ) was computed from the applied force divided by cross-sectional area while strain was computed as ε = d/l (with d the axial displacement and l the initial gauge length).
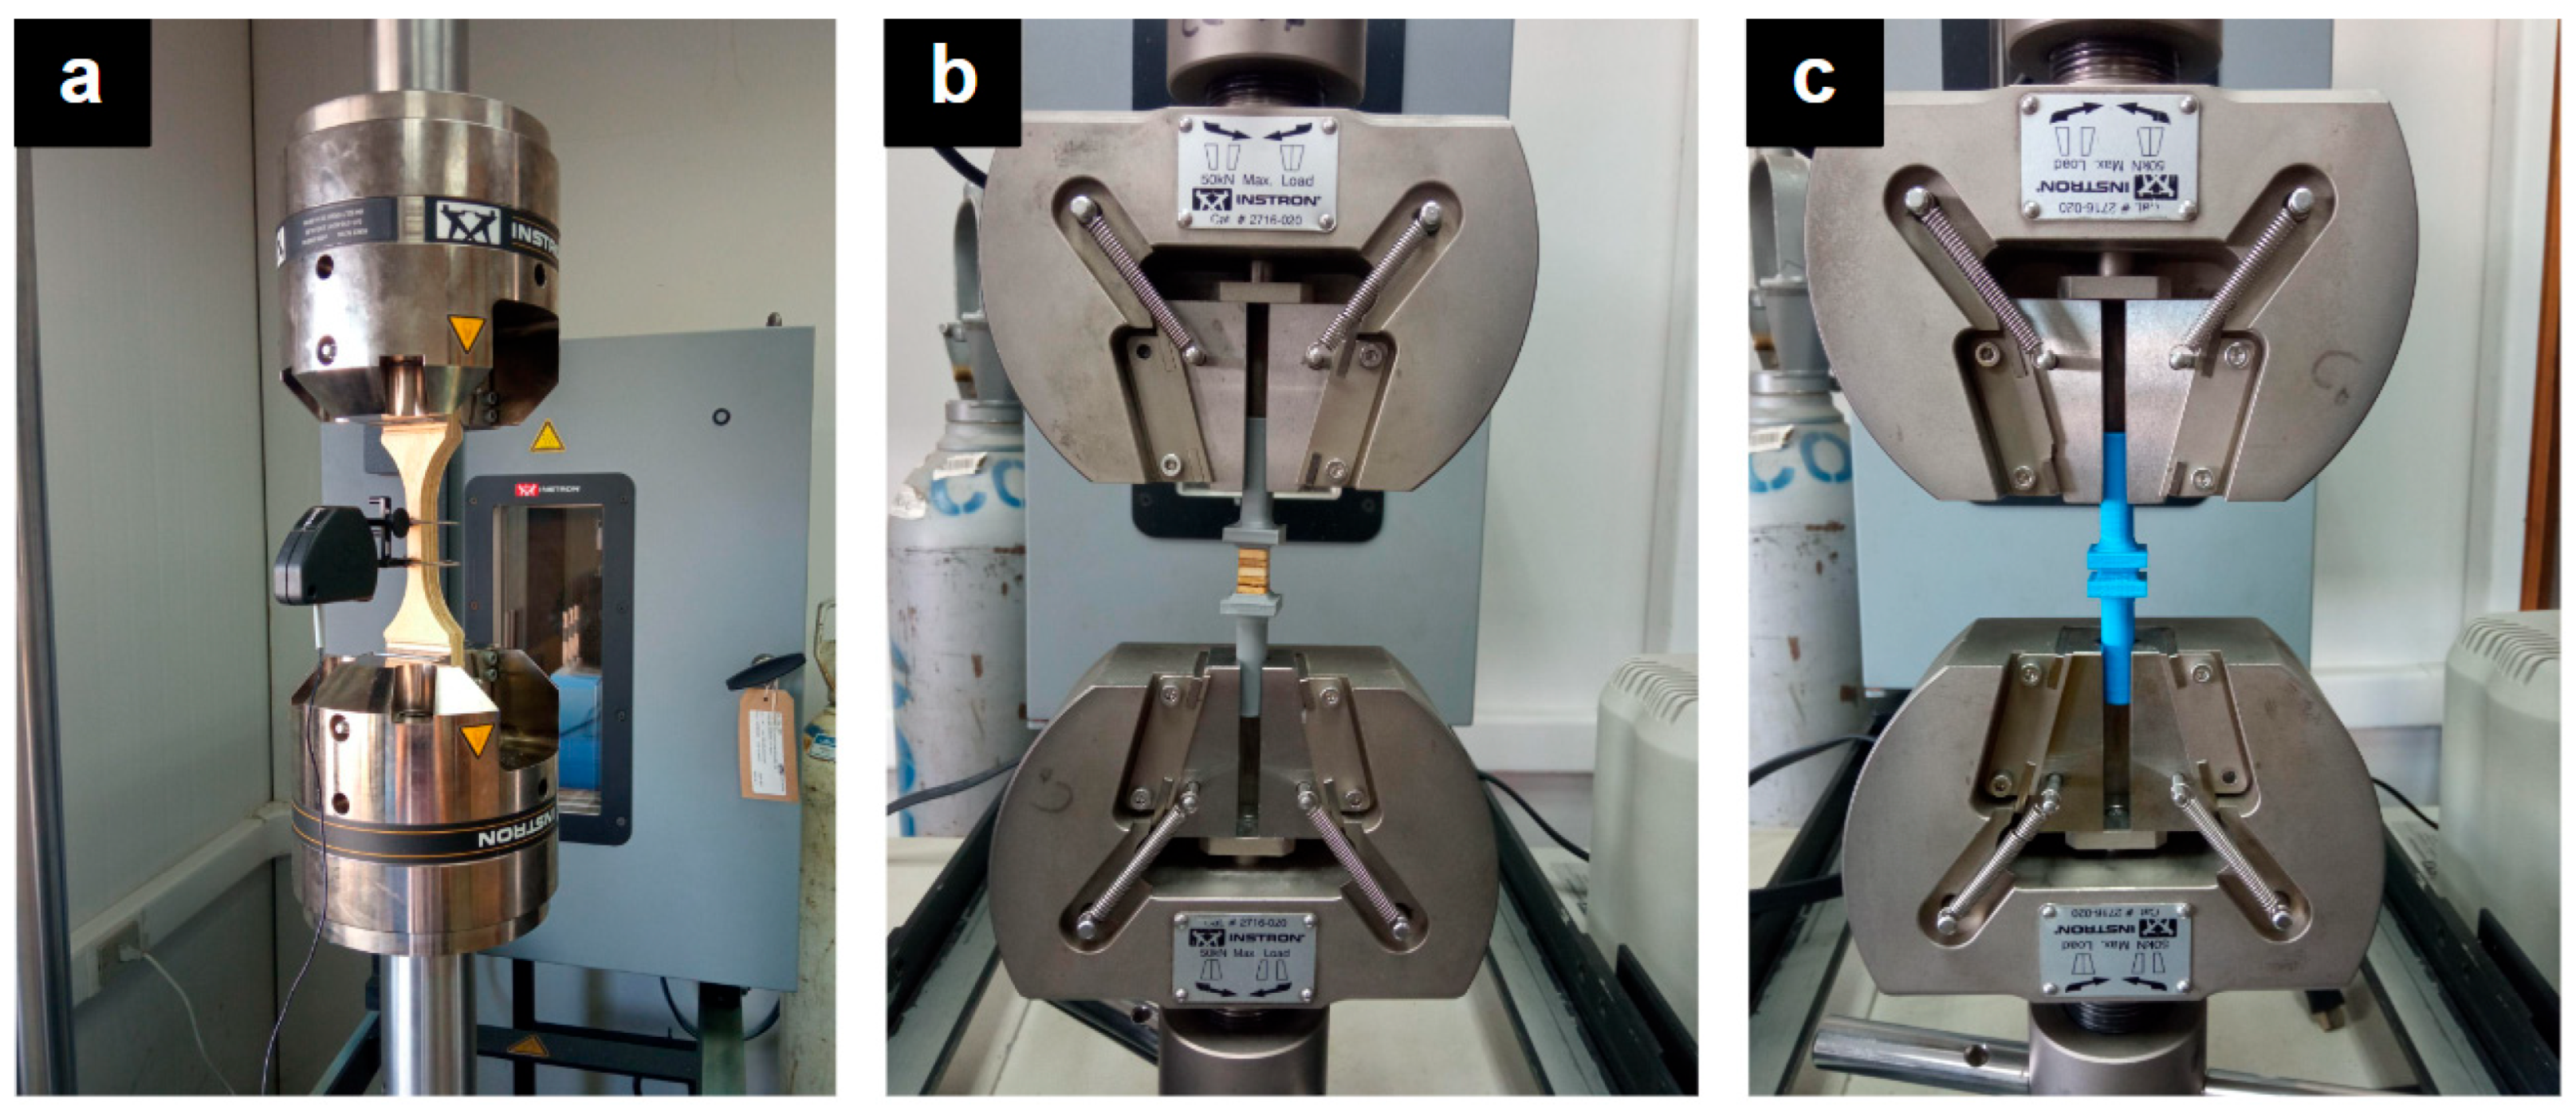
For out-of-plane tension (Tz), tests were performed on an INSTRON 3369 (50 kN) without an extensometer, using the ratio between machine-measured displacement and specimen height. PLA fixture compliance was measured through separate calibration tests and subtracted from the displacement data. The modulus ETz was then estimated using Equation (2). PLA accessories for Tz specimens were manufactured using the parameters in Table 1, with bonding achieved using LOCTITE 495 cyanoacrylate adhesive.
Figure 11a presents Tx and Ty specimens clamped in an INSTRON 8801 (100 kN) equipped with a contact extensometer to record in-plane strain. Figure 11b illustrates the setup for out-of-plane tension (Tz), conducted on an INSTRON 3369 (50 kN) without extensometer, where displacement was obtained from the actuator and corrected for system compliance. Figure 11c shows the accessory-only configuration used to determine fixture compliance for Tz tests. This calibration allowed subtraction of the measured accessory displacement from the specimen response, ensuring accurate stress–strain evaluation of the miniaturized samples.

2.3.3. Compression Tests

Figure 12 shows the compression test configurations used for orthotropic characterization (Cx, Cy, Cz). All tests were conducted on the INSTRON 3369 (50 kN) under displacement control. Due to the geometry and the limited clearance between loading plates, contact extensometers could not be employed. Consequently, strain measurements were obtained from the actuator displacement, corrected for machine and fixture compliance determined through plate-on-plate calibration. Figure 12a–c illustrate the specimen orientations corresponding to the X, Y, and Z axes of the plywood, respectively. For Cx and Cy, the modulus was calculated as:
E C x , y = σ C x , C y ε C x , C y = σ 40 % F m a x σ 10 % F m a x ( ε 40 % F m a x ε 10 % F m a x )
Compressive stress was determined as σ = F/A, where F is the applied compressive force and A is the original load-bearing area of the specimen. With strain computed from displacement and specimen height as ε = d/l, where d is the axial displacement and l is the specimen height.
For Cz, the 0.2% offset method (ASTM A370) was used to determine the yield limit σ L e , applying linear regression to the elastic region (R2 ≥ 0.95). The modulus E C z was computed between 10% and 40% of σ L e as:
E C z = σ 40 % L e σ 10 % L e ( ε 40 % L e ε 10 % L e )

2.3.4. Shear Tests

Shear stress components (τxy, τyx, τxz, τyz) were determined using Tuninetti et al. specimens [20], a novel specimen design for shear testing using compressive load and short height samples adapted from the Miyauchi design principle. The shear modulus G was calculated as:
G = τ 40 % F m a x τ 10 % F m a x ( γ 40 % F m a x γ 10 % F m a x )
Shear stress is computed from the applied load in the shear direction divided by the effective shear area. For in-plane shear tests (τxy and τyx), the shear area was calculated as the product of the panel thickness (18 mm) and the height of the sheared zone (18 mm), resulting in a double-shear configuration. For out-of-plane shear tests (τxz and τyz), the sheared area corresponded to the bonded interface between assembled components, defined by the panel thickness (18 mm) and the vertical bonded height (70 mm). This geometric definition ensures accurate representation of the load-transfer surface under shear loading. The shear strain was obtained as γ = d/l (with d the relative shear displacement and l the shear gauge length).
Figure 13 shows the experimental setups for the four principal shear configurations. Figure 13a,b correspond to in-plane directions (τxy and τyx), while Figure 13c,d to out-of-plane directions (τxz and τyz). All tests were performed in an INSTRON 3369 universal testing machine (50 kN) under displacement control. The in-plane configurations employed the Miyauchi-type geometry, where a compressive load on a short-height specimen produces a nearly pure shear field between central ligaments. The out-of-plane configurations followed the Tuninetti et al. design, which uses bonded laminar assemblies to generate controlled shear deformation along the transverse planes. Due to the compact geometry, contact extensometers could not be used; displacements were instead measured from actuator motion and corrected for system compliance through plate-on-plate calibration following Tuninetti et al. data [20,71]. The coordinate axes in each image define the orthotropic material directions of the plywood, ensuring consistent specimen orientation. The resulting stress–strain data provided the moduli Gxy, Gyx, Gxz, and Gyz and corresponding shear strengths.

3. Results: Orthotropic Properties Characterization in Plywood Panels

3.1. Tensile Test Results

Figure 14 and Figure 15 present the failure modes and stress–strain curves obtained from tensile tests in the three orthotropic orientations for both manufacturers. Figure 14 illustrates typical failure modes in five representative specimens for Tx (a and d), Ty (b and e), and Tz (c and f). In all cases, the fracture occurred within the gauge section, confirming that the specimen geometry was appropriate for tensile testing. Red lines have been superimposed to highlight the fracture location and path. For Tz specimens, failure consistently initiated near the adhesive interfaces between veneers, forming zigzag patterns due to partial fiber pull-out perpendicular to the applied load. Side views (Figure 14d) show that these fractures maintain a straight projection, consistent with longitudinal splitting along the wood fibers.
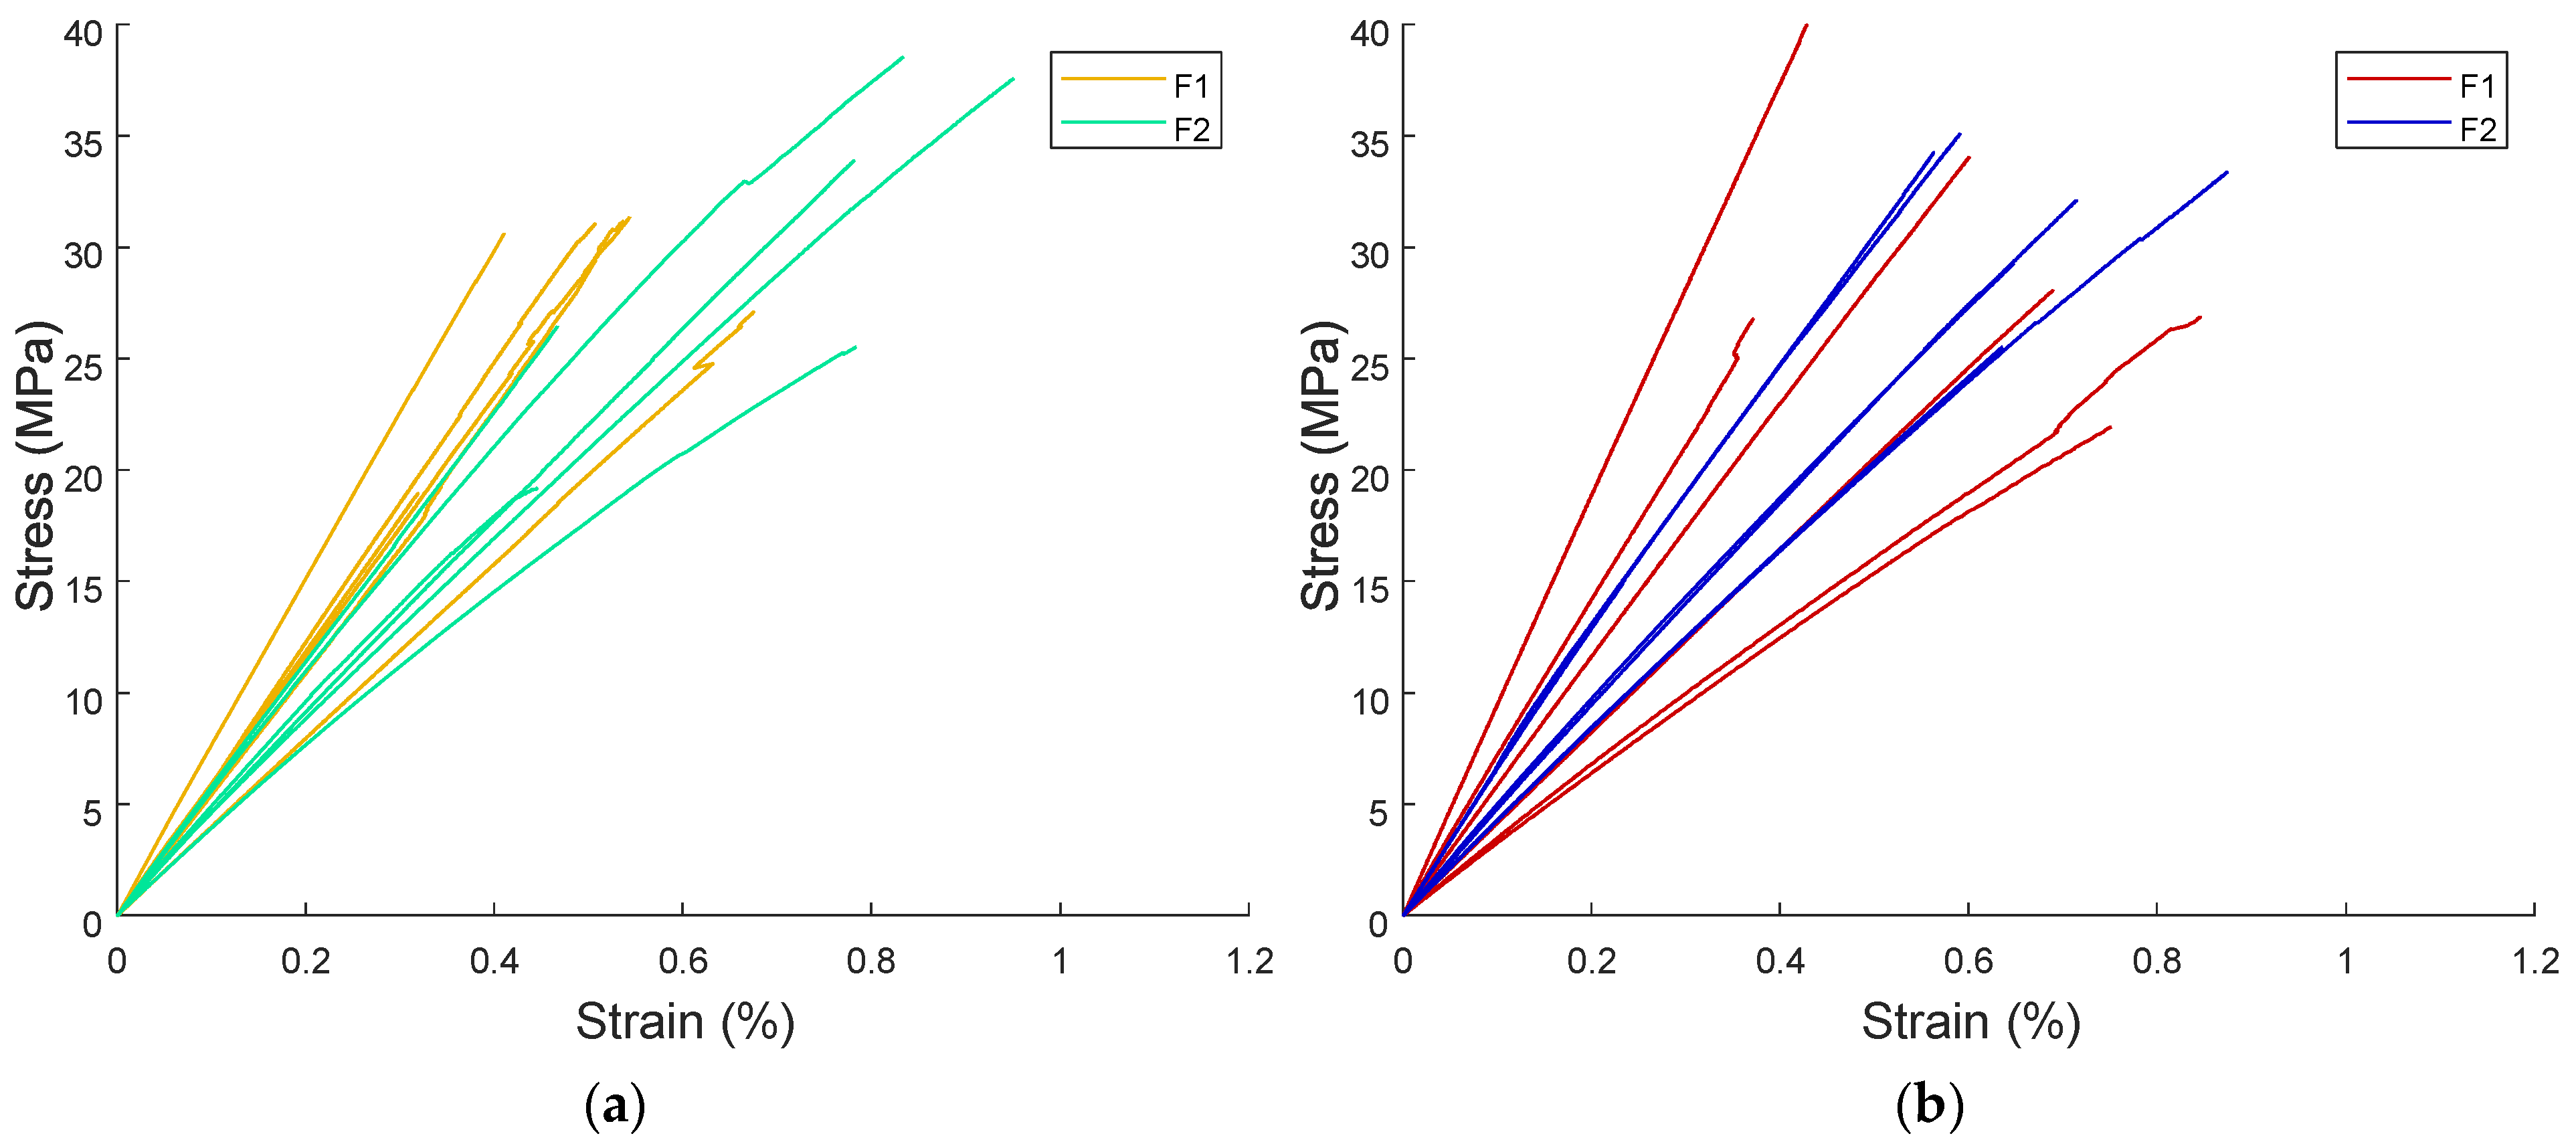
The corresponding stress–strain curves are shown in Figure 15. In Tx (Figure 15a), maximum stresses were reached at low strains, below 1%, with mean ultimate strains of approximately 0.5% for F1 and 0.7% for F2. Both manufacturers displayed similar scatter; however, five out of six F2 curves fell within the lower stiffness range of F1. This agrees with the lower mean elastic modulus for F2 4.680 GPa compared to F1 5.834 GPa, despite F2 achieving a higher mean maximum tensile strength 38.57 MPa (Table 2). The greater scatter in F1 results is attributed to veneer thickness variability in the sanded outer layers, where two of the four veneers aligned with the load direction are intentionally reduced in thickness during manufacturing.
In Ty (Figure 15b), F1 exhibited greater dispersion in the elastic slopes, while F2 curves were highly clustered, with three overlapping pairs among the six specimens. This reflects greater homogeneity in F2, likely due to the uniformity of the three interior veneers, which remain unmodified in thickness and are adhesive-bonded on both faces. Both manufacturers reached similar mean strengths (29.66 MPa for F1 and 31.63 MPa for F2) and moduli near 5 GPa, suggesting that the intended design objective of in-plane isotropy was largely achieved. Previous studies on plywood mechanical characterization [72] have reported comparable behavior between parallel and perpendicular fiber directions under in-plane tension. In Tz (Figure 15c), the stress–strain response was markedly non-linear, with substantially lower stiffness than in-plane orientations. To focus on the elastic regime, Figure 15d shows the curves truncated at the estimated yield limit. F1 exhibited more concentrated scatter, with most elastic slopes above those of F2, consistent with its higher mean modulus (0.665 GPa versus 0.289 GPa, Table 2), despite similar mean yield strengths (1.191 MPa for F1 and 1.292 MPa for F2). The observed differences highlight the combined influence of veneer configuration, adhesive interfaces, and manufacturing processes on out-of-plane tensile behavior.

3.2. Compression Test Results

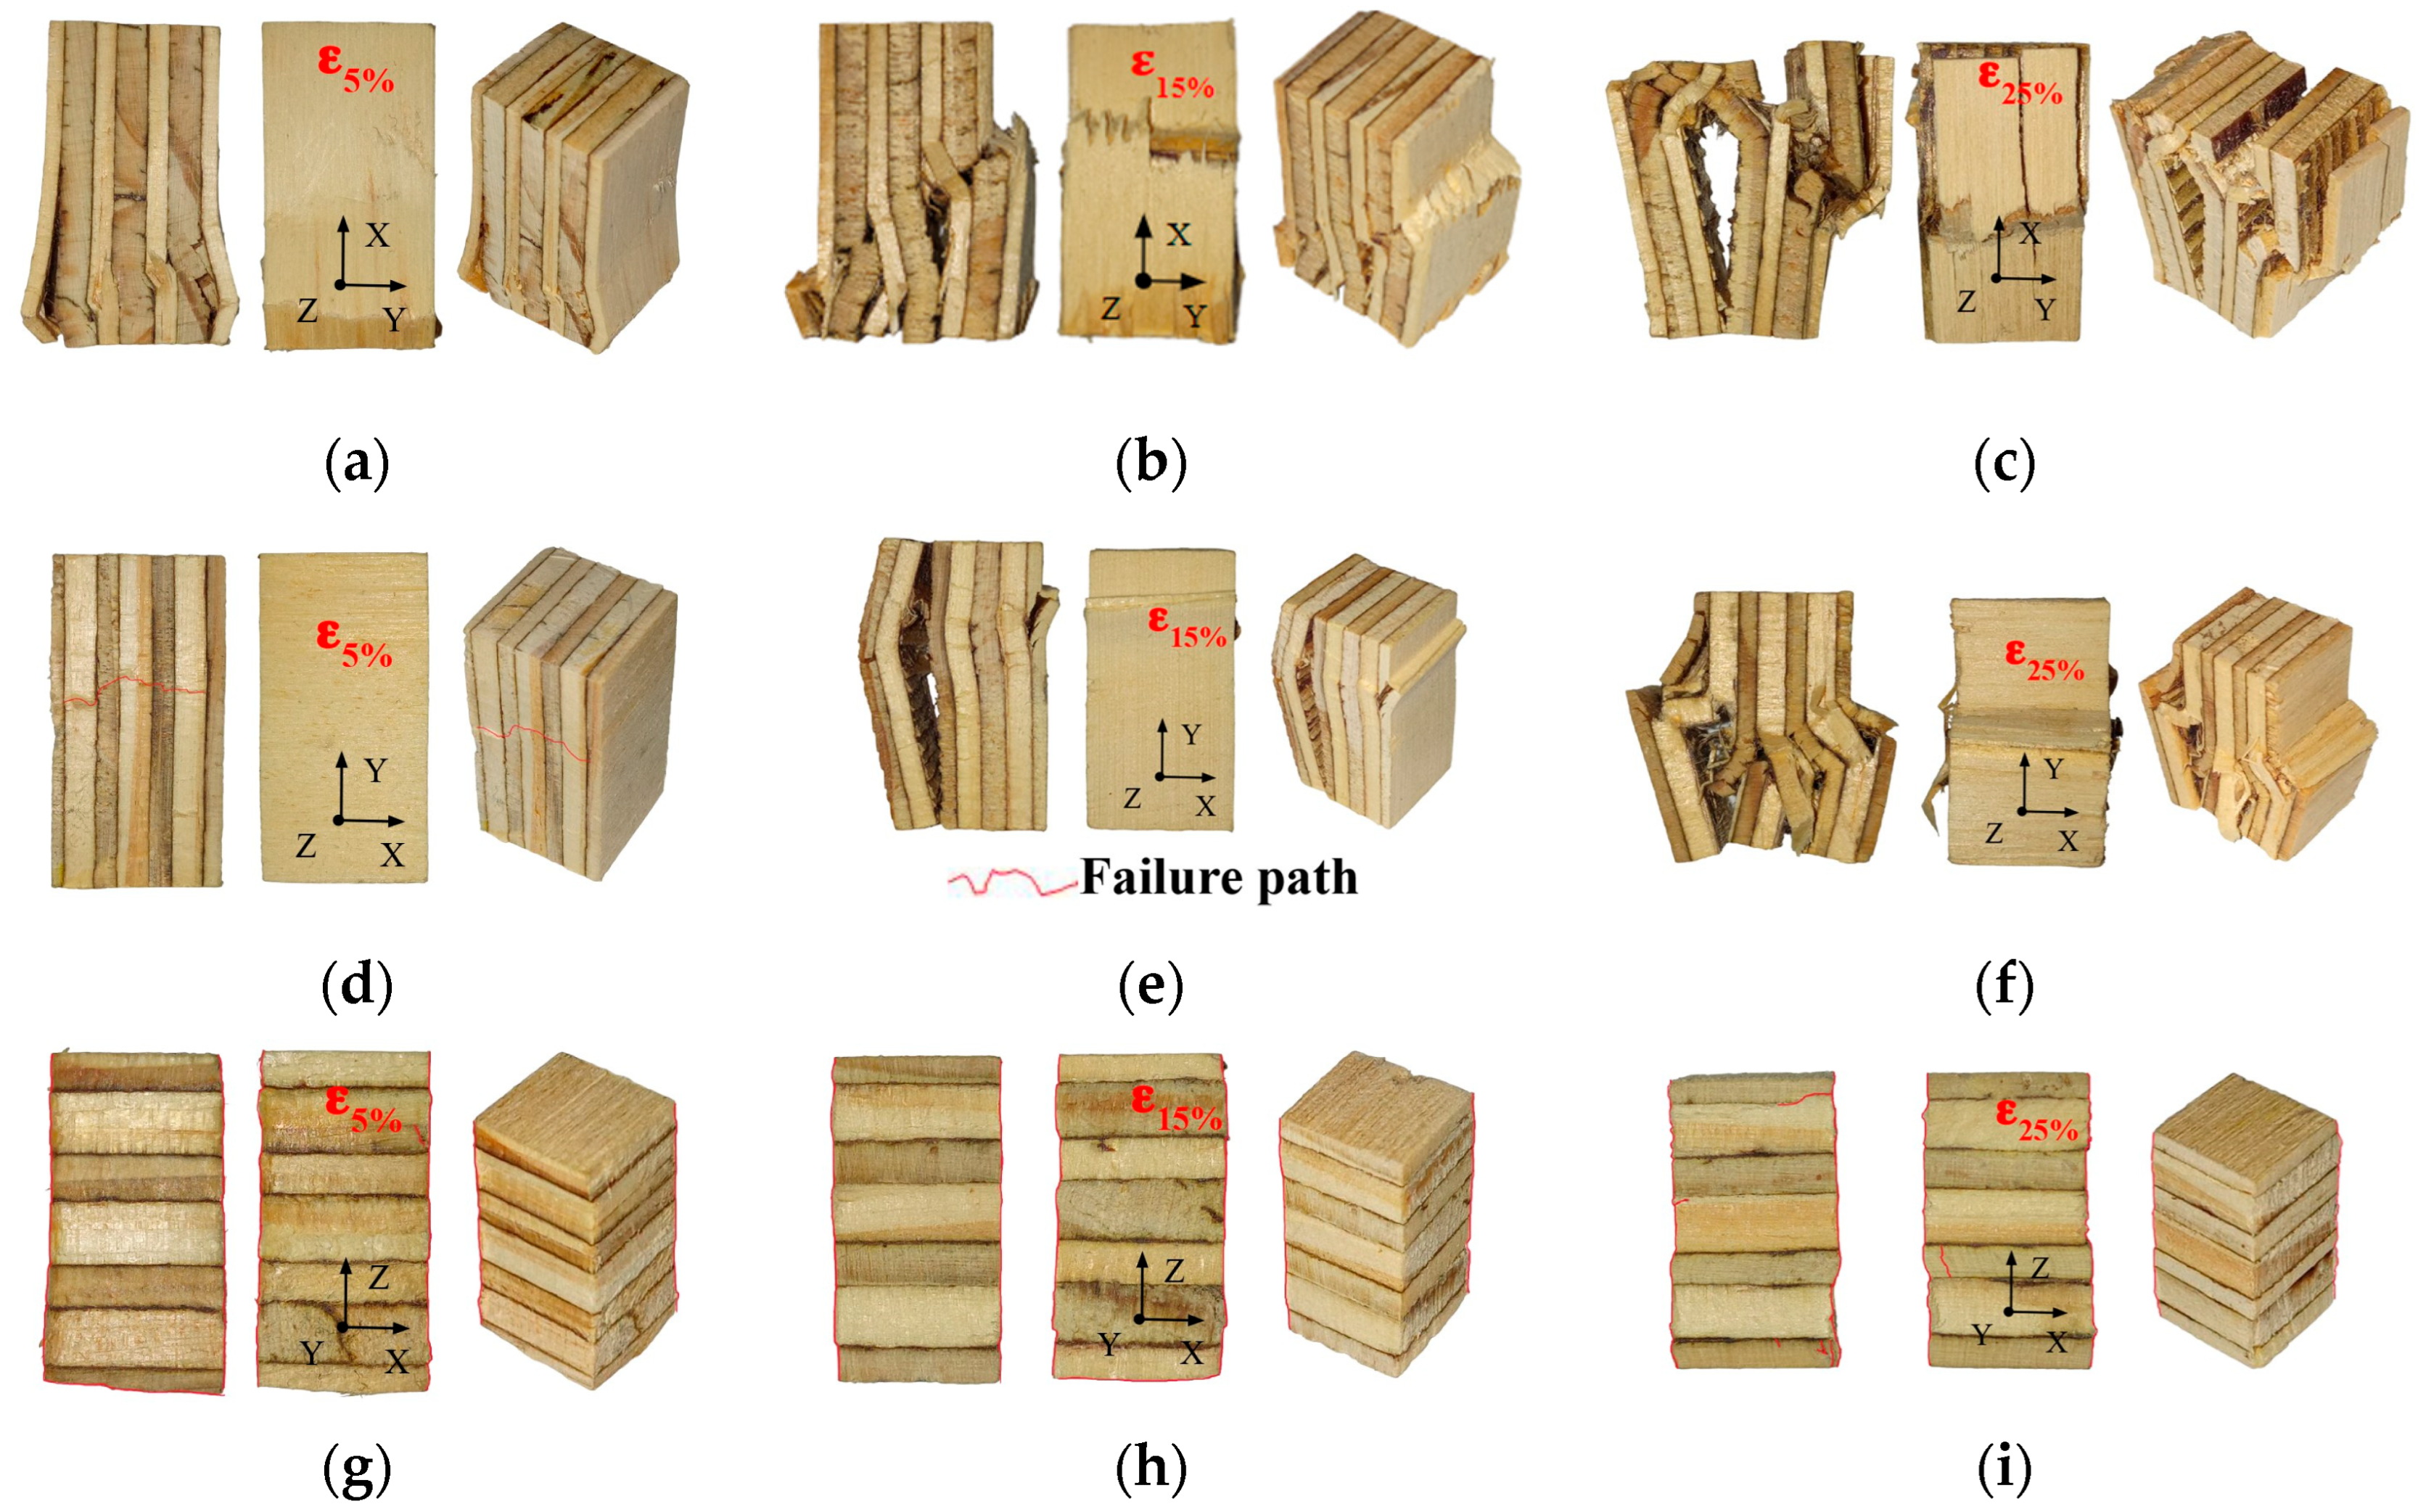
Figure 16 shows the typical failure modes observed in specimens subjected to compressive loading, documented at 5%, 15%, and 25% deformation. Red lines are superimposed on selected images to highlight fracture paths in specimens where damage patterns were less evident.
In the Cx direction (Figure 16a–c), specimens at 5% deformation (Figure 16a) exhibited fracture in the four load-bearing veneers, along with fiber reorientation in the perpendicular interior veneers. Crushing was visible at the bottom, with delamination along adhesive interfaces. At 15% deformation (Figure 16b), cracks extended across all seven veneers, and the outer veneers showed severe fiber tearing. By 25% deformation (Figure 16c), full fracture of all veneers occurred, with zigzag splitting in the center and longitudinal rupture in the outer veneers. In the Cy direction (Figure 16d–f), early deformation at 5% strain (Figure 16d) involved localized veneer shear and horizontal splitting. At 15% (Figure 16e), shear failure progressed diagonally, forming stepped cracks through the laminate. At 25% (Figure 16f), specimens displayed extensive buckling and full delamination across multiple layers. In the Cz direction (Figure 16g–i), failure was governed by through-thickness crushing and densification of transverse veneers. Despite increasing strain, specimens maintained structural cohesion with limited cracking or fiber rupture, indicating a weak but ductile response along the panel thickness with minimal cracking or fiber rupture, reflecting the behavior of a weak but ductile axis.
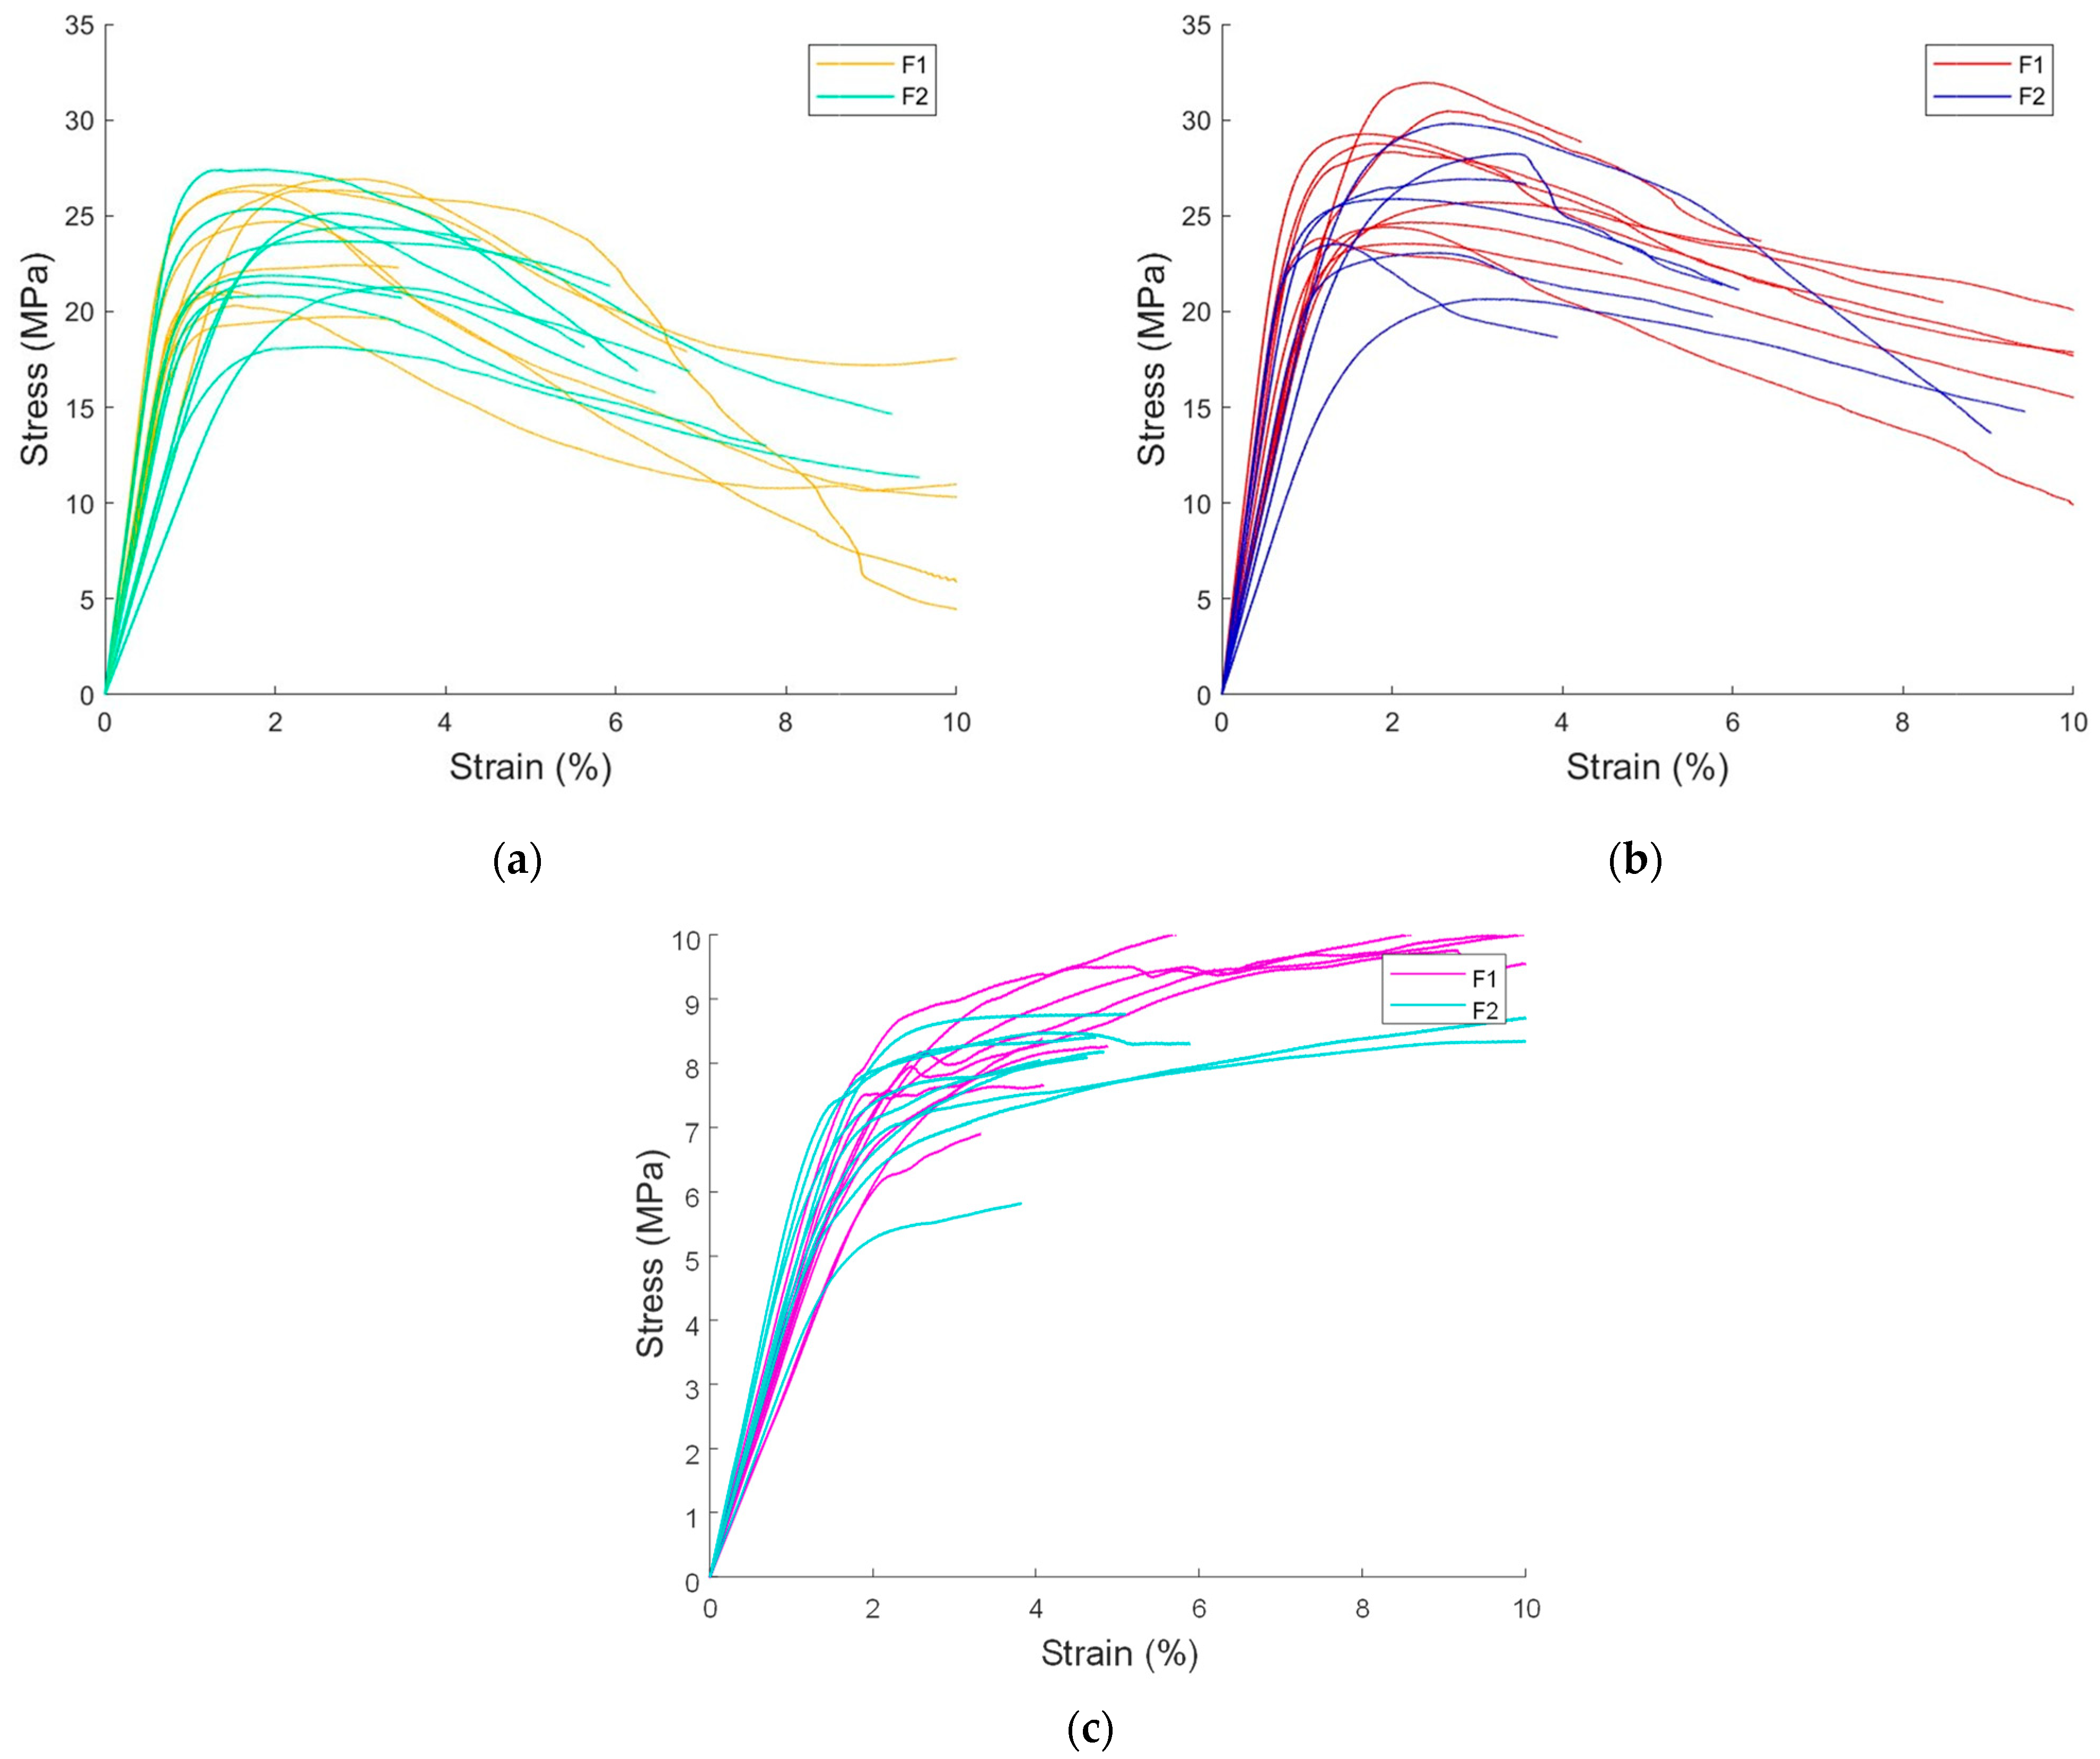
Figure 17 presents the stress–strain curves for Cx compression tests up to 15% deformation for both manufacturers. The curves indicate similar overall behavior, with high initial stiffness followed by peak stresses typically reached at around 2% strain. Table 3 summarizes the results for Cx, Cy, and Cz, including maximum stress, strains at 10%, 40%, and reference level, and elastic modulus values (for Cx and Cy the reference is Fmax; for Cz it is the elastic limit σ L e ).
For Cx, the mean maximum compressive strengths were comparable 23.55 MPa for F1 and 22.97 MPa for F2—representing a difference of only 1.8% between the highest values.
F2, however, exhibited a wider strength range, from 18.17 MPa to 27.43 MPa, compared to F1’s narrower distribution. Despite the similarity in mean strength, F2 curves displayed greater dispersion in the elastic slopes, reflected in its lower mean modulus of elasticity (2.196 GPa) compared to F1 (2.667 GPa). This variability suggests a higher sensitivity of F2’s stiffness to local heterogeneities and veneer bonding conditions.
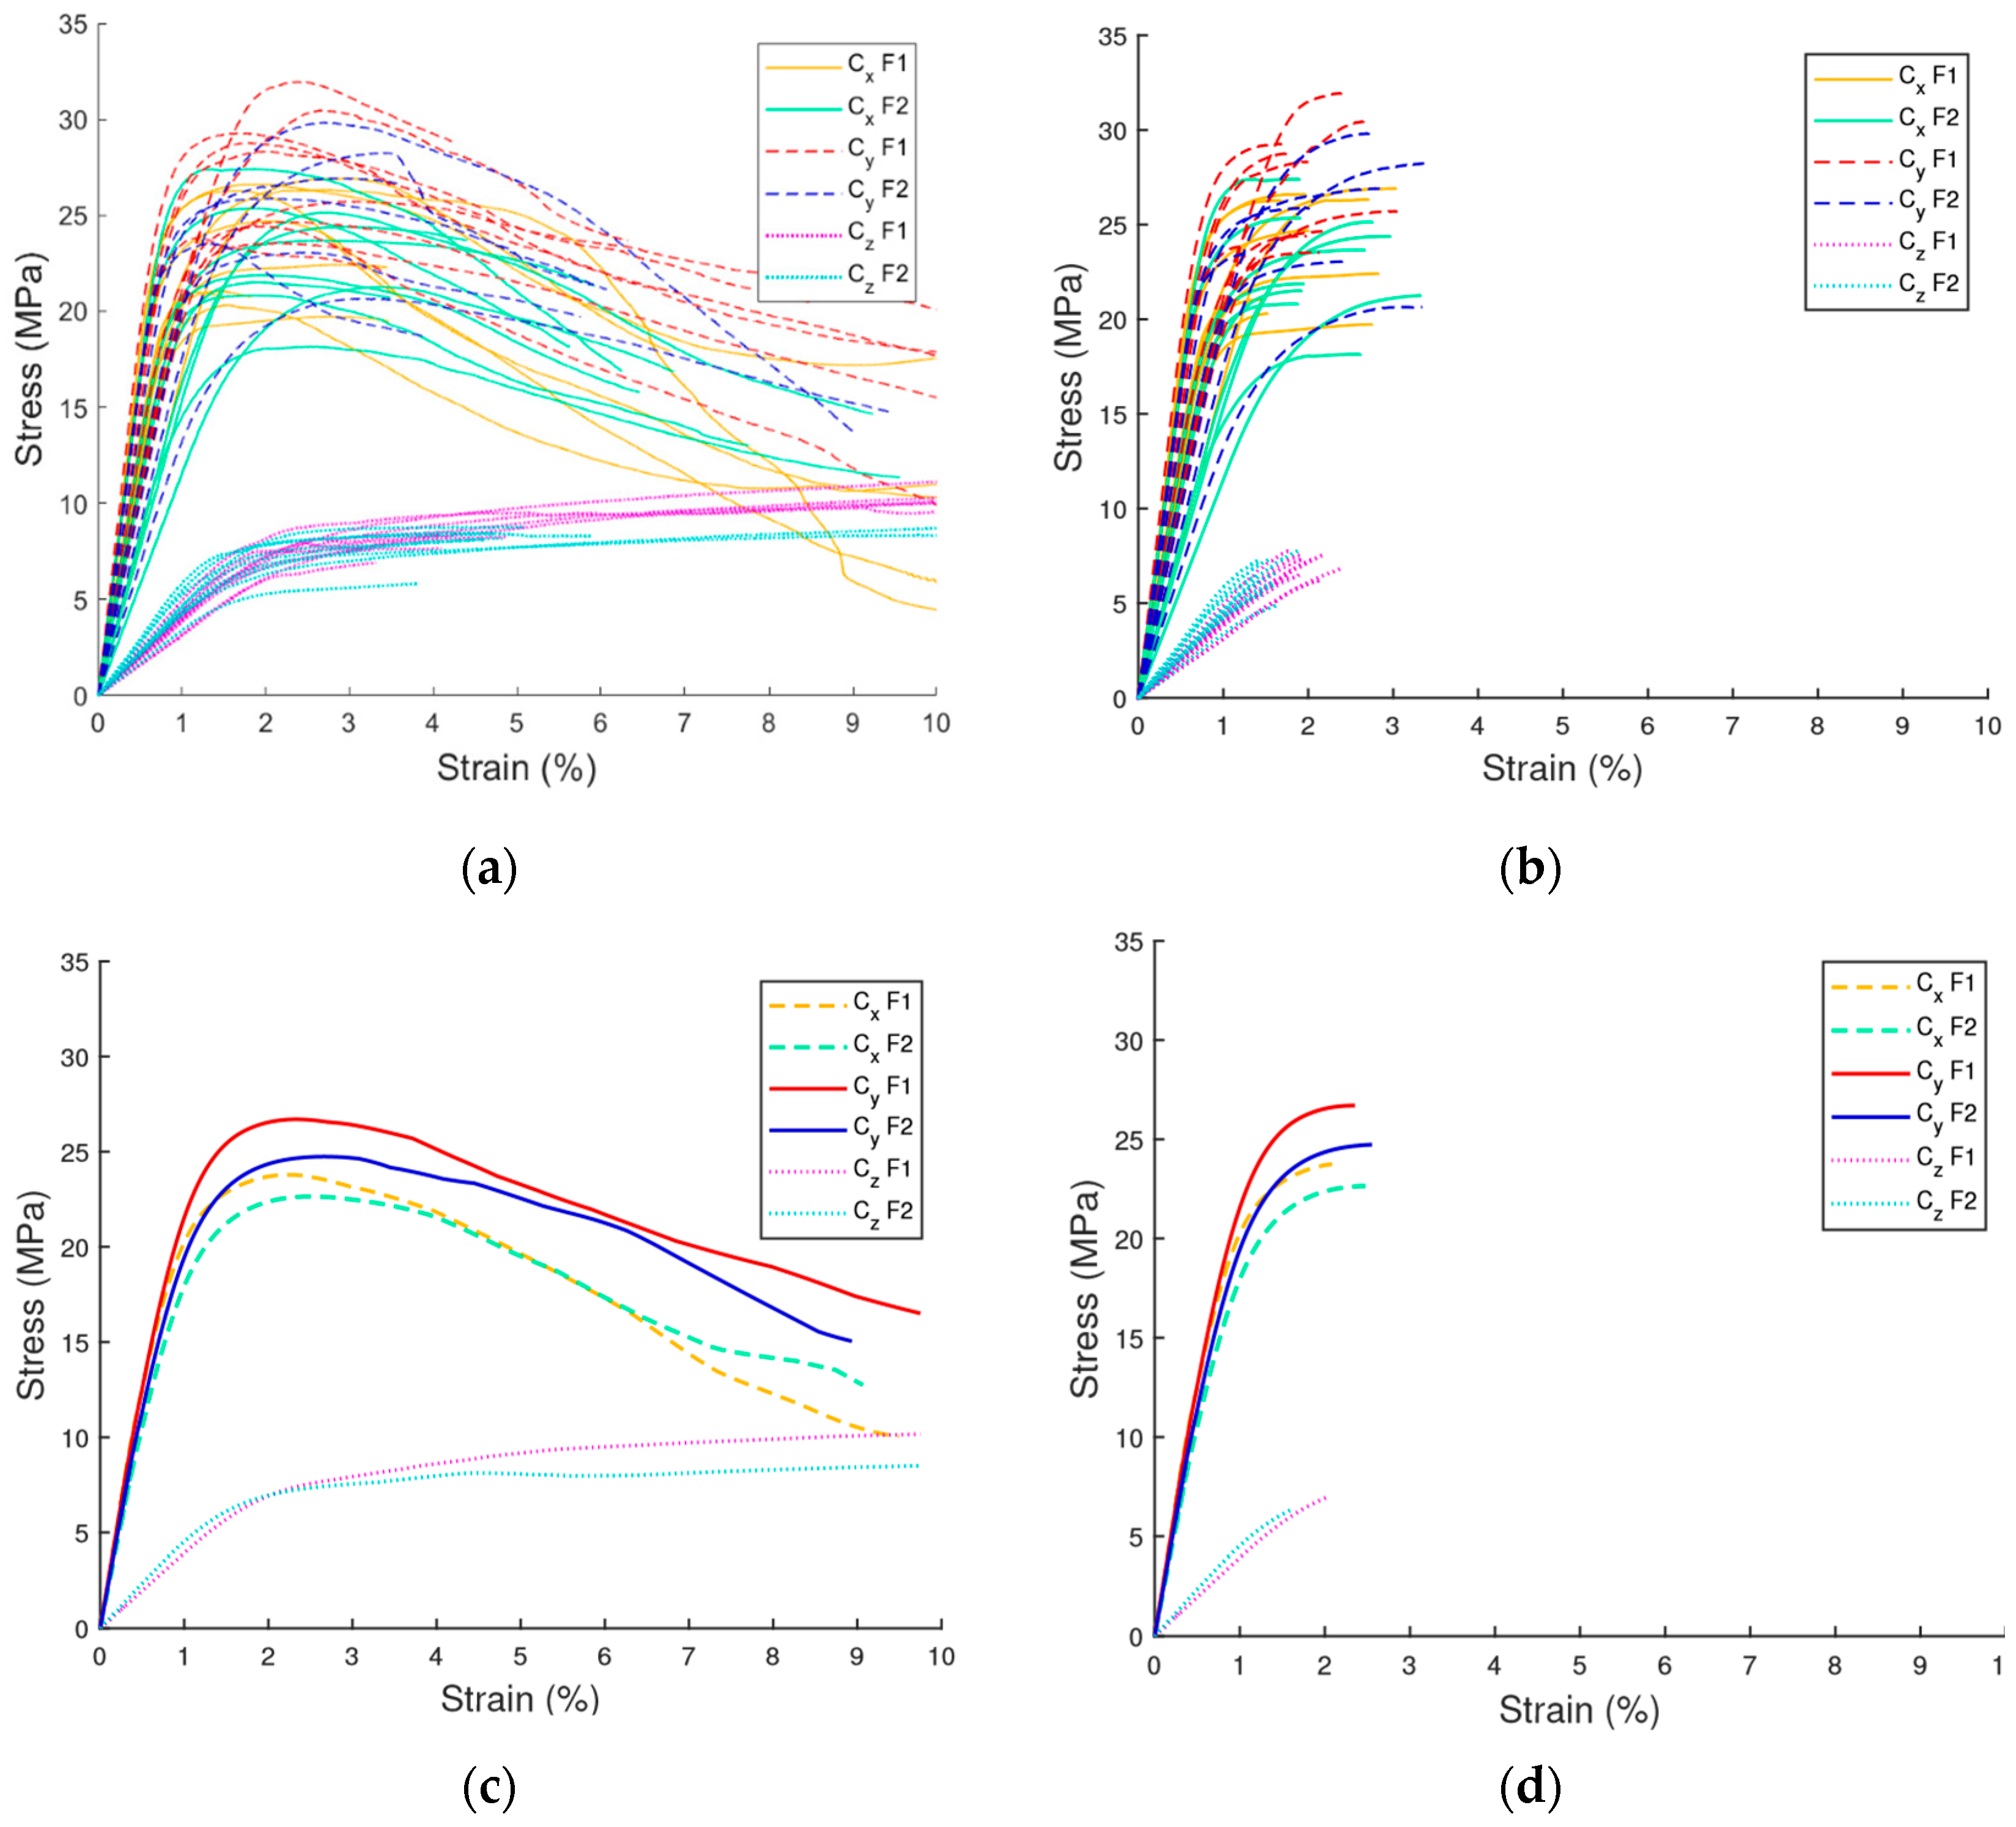
Figure 18 compiles the compressive stress–strain responses to provide a broader context for the mechanical behavior in Cx, Cy, and Cz orientations. In Figure 18a, all recorded curves are plotted for each orientation, revealing substantial overlap between manufacturers within each test direction. This indicates that, overall, both plywood types perform similarly under compression. Figure 18b isolates the responses up to maximum stress for Cx and Cy, and up to the elastic limit for Cz, confirming that Cx and Cy exhibit nearly identical performance, whereas Cz reaches only about one-quarter of the maximum strength of the other two orientations.
Representative curves for each manufacturer, separated by test orientation, are shown in Figure 18c. These clearly illustrate that, while Cx and Cy behave similarly, Cy consistently achieves slightly higher strength, with F1 tending to perform better overall. Figure 18d further compares representative curves up to maximum stress (Cx, Cy) or elastic limit (Cz), highlighting that both Cx and Cy reach maximum stress at approximately 2% strain, whereas Cz reaches its elastic limit at similar strain levels. For Cx and Cy, F1 exhibits lower and more uniform maximum strain values (2.12% and 2.11%, respectively) compared to F2 (2.40% in Cx and 2.60% in Cy). It should be noted that the Cy dataset for F2 comprises only seven specimens due to data loss caused by an electrical failure during testing, which may explain the slightly higher average strain (2.59%) in this orientation.
For Cz, the representative curve for F1 shows a gentler slope and higher average strain, indicating lower stiffness. Table 3 summarizes the Cz results using the elastic limit as reference: F1 attained a higher mean elastic limit stress (7.069 MPa) compared to F2 (6.462 MPa), while the average strain at the elastic limit was 2.0% for F1 and 1.6% for F2.
When considered alongside the panel composition analysis (Figure 13 and Table 3), these results suggest that F2’s greater stiffness in Cz is attributable to its thicker perpendicular veneer layers.

3.3. Shear Test Results

Figure 19 illustrates the deformation progression of shear specimens at 30%, 40%, and 50% strain, showing typical failure modes for the orthogonal shear planes τxy and τyx. At 30% deformation, external veneer layers display limited surface cracking, while internal damage is minimal. By 40% strain, perpendicular veneers exhibit significant shear-induced fiber separation, defining the local shear strain γ and the effective shear modulus. Veneers with fibers aligned with the applied load develop distinct fiber-splitting fractures visible on the specimen’s top surface. At 50% strain, failure becomes extensive across multiple veneer layers, with a combination of fiber pull-out and adhesive line separation, indicating the progression from localized cracking to complete shear rupture in both τxy and τyx configurations.
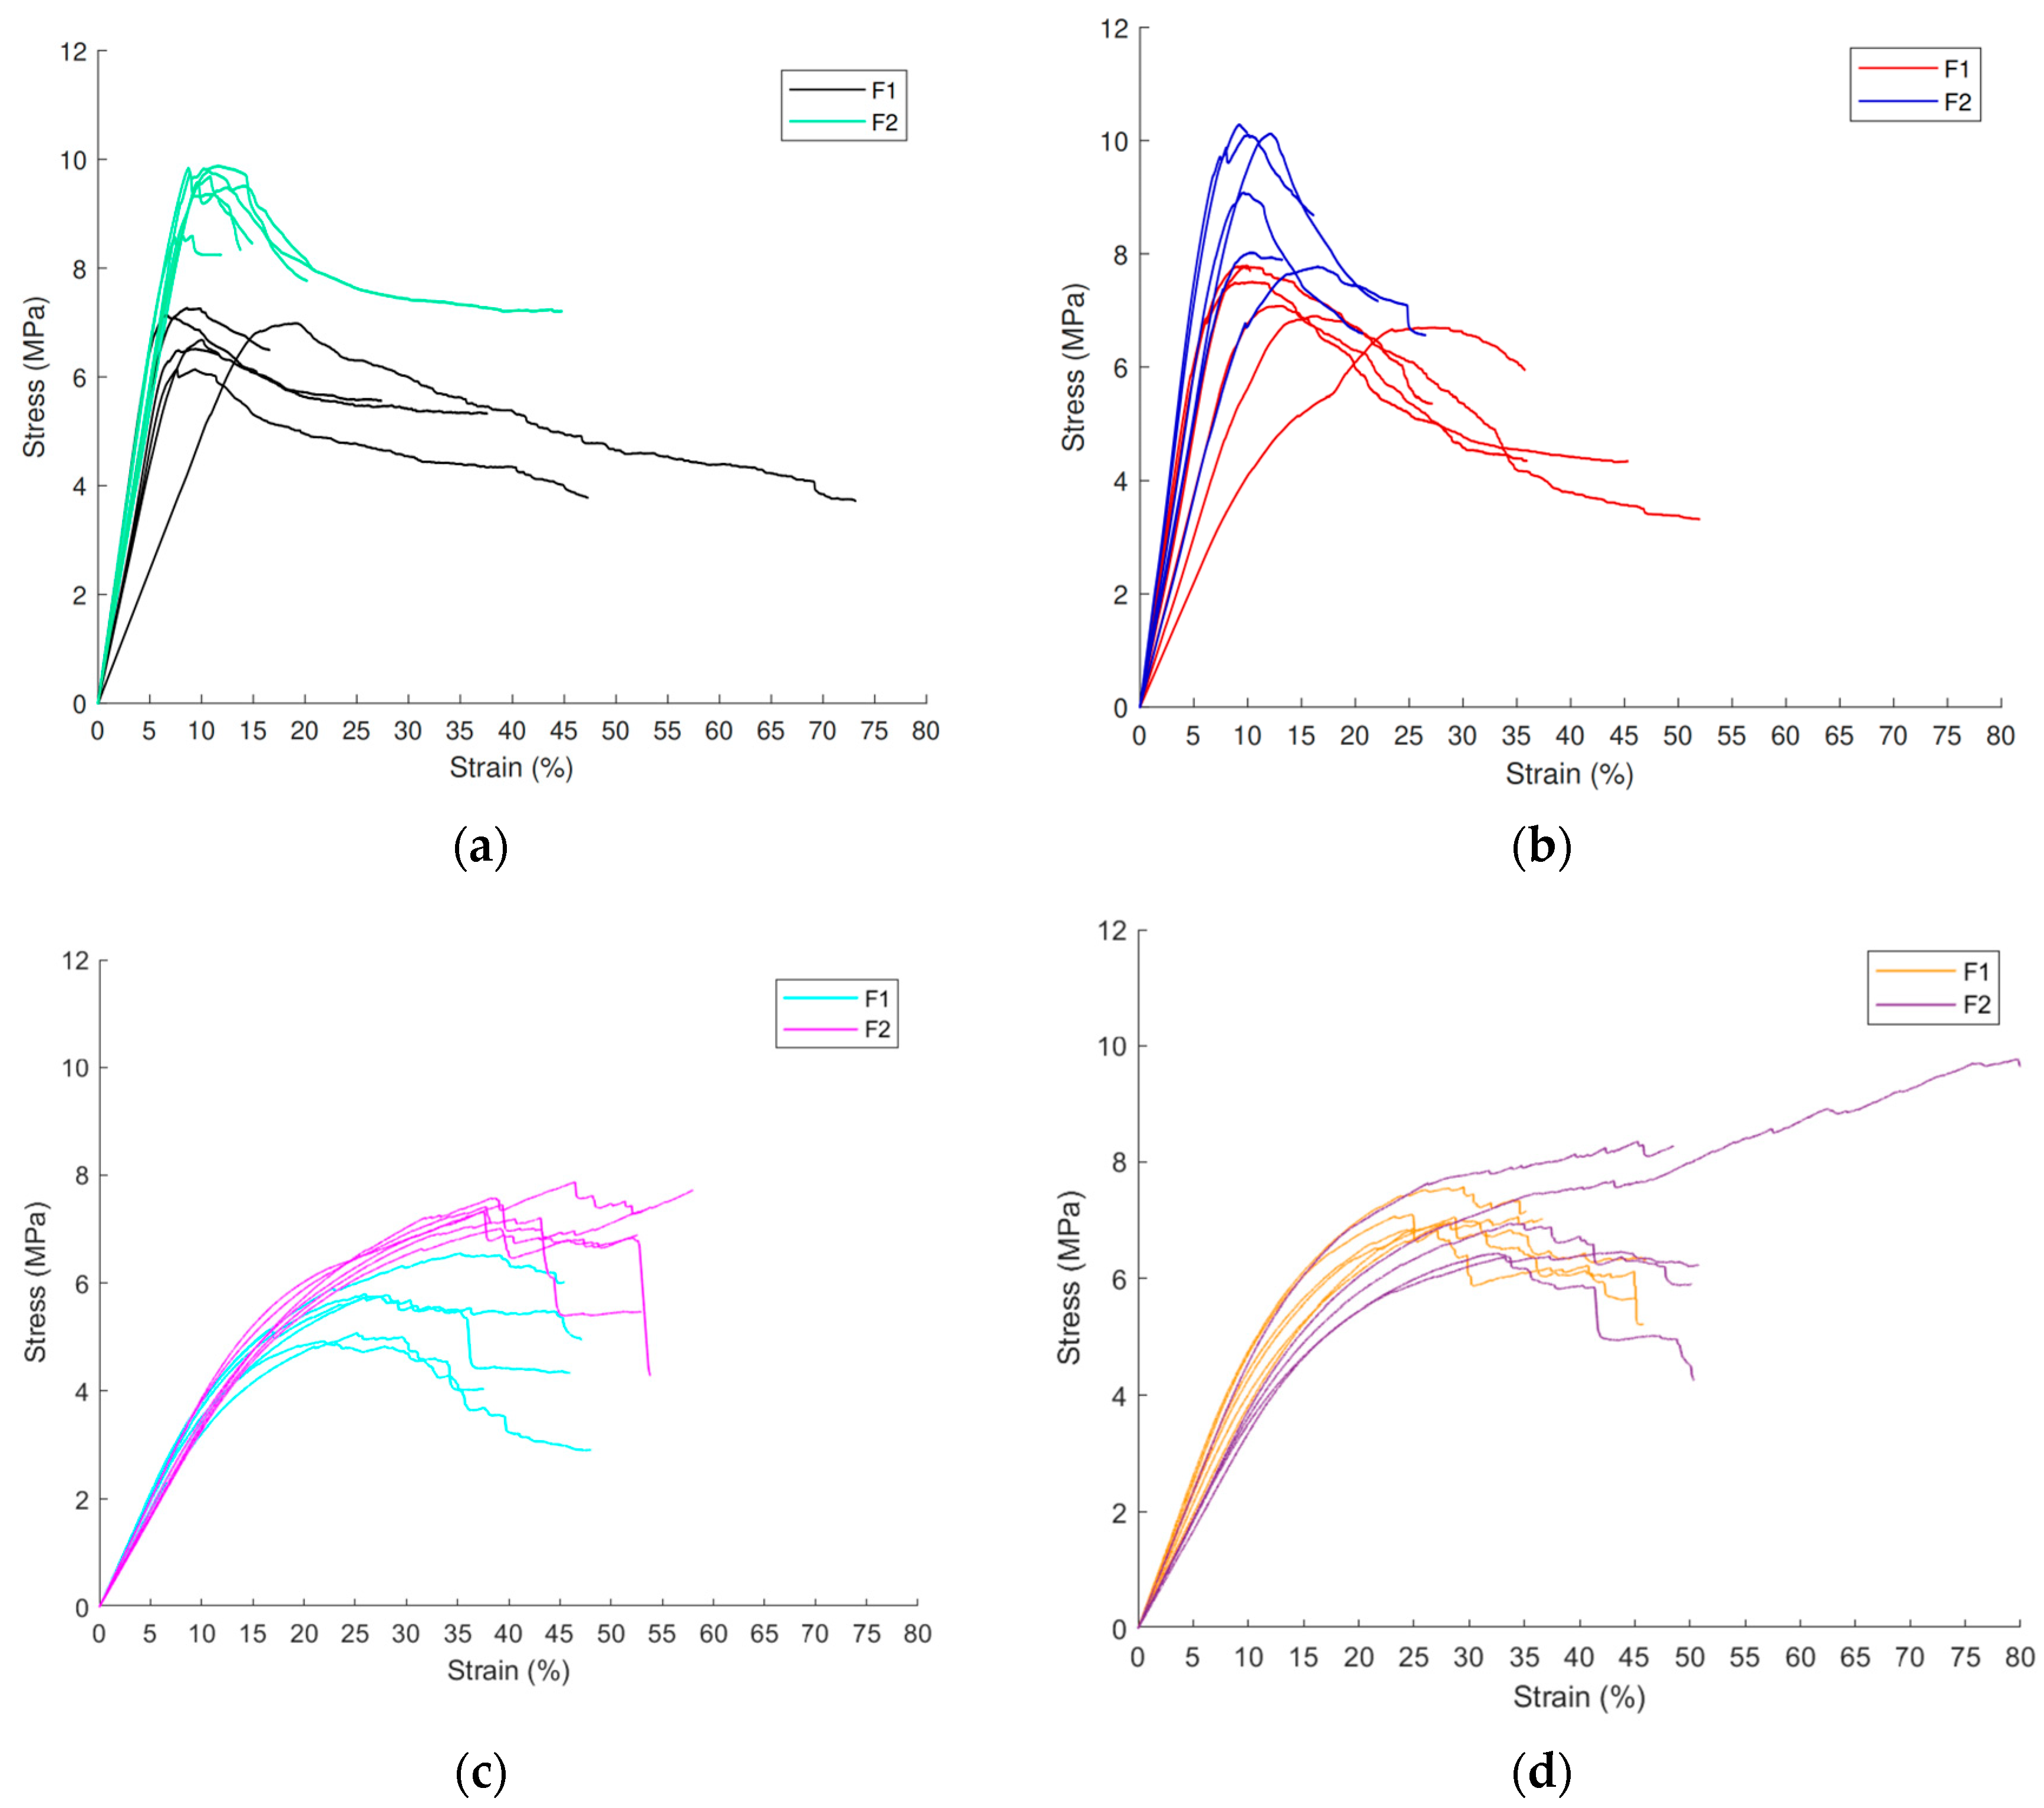
Figure 20 presents the shear stress–strain curves for all test configurations. In τxy (Figure 20a), both manufacturers show well-defined and homogeneous peak shear strengths, with F2 achieving higher maximum values. F1 exhibits greater variability in the elastic region, including one specimen with a markedly lower slope, corresponding to a shear modulus of 0.049 GPa compared to the next lowest value of 0.087 GPa. After peak stress, specimens display a sharp load drop, followed by stabilization at 20–25% below the maximum, indicating a transition to residual shear capacity.
In τyx (Figure 20b), the response is broadly comparable to τxy under ideal shear conditions. However, post-failure crack growth often occurred outside the calibrated shear section, suggesting that part of the observed fracture was not directly related to pure shear damage. F2 specimens showed higher maximum shear strengths but with greater scatter in the elastic modulus, ranging from 0.060 to 0.099 GPa, compared to 0.044 to 0.073 GPa for F1. In the non-linear phase, both groups exhibited a pronounced shear stress drop without the plateau observed in τxy, reflecting differences in crack propagation patterns and veneer grain orientations.
For τxz (Figure 20c), elastic stress–strain behavior was relatively uniform between specimens. Nevertheless, the development of strength to the peak value was more variable in F1, with lower mean strength compared to F2. Non-linear deformation initiated early, reducing slope prior to peak stress, consistent with veneer layup characteristics where only four of the seven plies contribute effectively to shear resistance in this orientation.
For τyz (Figure 20d), both manufacturers demonstrated similar linear responses and comparable maximum shear strengths. This similarity is associated with a veneer configuration in which the three core layers are perpendicular to the shear plane, providing consistent structural resistance. Despite this, early-stage failures were observed in the four veneers parallel to the shear plane, with the remaining three showing visible damage only at higher deformation levels.
Figure 21 complements the previous shear analysis by presenting a comparative overview of all test orientations.
In Figure 21a, the complete shear stress–strain curves for τxy, τyx, τxz, and τyz are displayed. To reduce interference from overlapping non-linear regions after peak stress, Figure 21b shows the same curves truncated at their respective maximum stresses. Representative curves for each orientation are presented in Figure 21c. For τxy and τyx specimens, the peak stress typically occurs at strains close to 10%, with F1 exhibiting lower strength than F2.
The performance variability summarized in Table 4 can be grouped into two behavioral categories. The first category, τxy and τyx, develops peak shear stress predominantly within the elastic range, reflecting high stiffness. The second category, τxz and τyz, shows a lower rate of stress increase with strain, achieving peak stress under highly non-linear conditions.
Figure 21d extends the representative curves to the maximum stress for each orientation, highlighting differences in strain at peak load both by orientation and manufacturer.
For τxy, mean peak strains were 10.1% for F1 and 10.5% for F2. In τyx, these values increased to 11.4% and 14.5, respectively. For τxz, peak strains rose substantially to 27.0% for F1 and 46.3% for F2, indicating marked differences in material response. A similar trend was observed in τyz, with mean peak strains of 28.8% for F1 and 47.1% for F2, though F2 exhibited greater variability in this orientation. In all cases, F1 specimens reached peak strength at lower strains than F2.

4. Discussion

The observed directional response is consistent with theoretical treatments of orthotropic behavior in layered wood composites, where veneer orientation and interfacial shear transfer govern elastic properties and strength [40]. While the full application of these data for numerical modeling, such as orthotropic constitutive calibration in finite-element or multiscale frameworks [73], is reserved for future work, the directional response trends identified herein establish a robust foundation for advanced material representation. Complementary experimental advances using digital image correlation have clarified local strain fields in wood and plywood, reinforcing the mechanistic link between veneer architecture and macroscopic response specimens [43]. These trends are also in line with the known limitations of prevailing standards that emphasize planar characterization and do not capture full anisotropic shear behavior, motivating dedicated specimen designs for all principal directions [49,50,51,52,53,54]. Prior studies on plywood tensile behavior have shown that strength along 0° and 90° grain directions can be considered quasi-isotropic, whereas loading at 45° exhibits markedly reduced strength due to shear-dominated failure within alternating veneers [72].
Variations in stiffness and strength observed across configurations are therefore associated with the load-transfer efficiency between veneers. Studies by Bekhta et al. and Olenska & Beer [23,24] similarly demonstrated that changes in veneer thickness alter shear transfer through the adhesive layers, influencing both orthotropic stiffness and failure behavior.
In the earlier work [20], ultimate shear strength was taken as the stress level immediately prior to visible crack initiation. In contrast, in the present manuscript, ultimate strength is defined as the maximum stress attained during the test, even if cracking has already initiated. This refined criterion captures the full load-bearing capacity beyond first cracking and explains the higher mean values reported here (e.g., τxy and τyx) relative to previous reported work. This distinction is deliberate and enhances the completeness of the orthotropic shear characterization, providing datasets suitable for constitutive model calibration and structural design.
The results reveal a clear link between veneer configuration and orthotropic mechanical response:
  • F1 consistently shows higher stiffness in both tension and compression, notably in Tx, Cy, and Cz, attributable to thicker perpendicular veneers and higher elastic moduli.
  • F2 reaches superior maximum strengths in Tx, τxy, and τyx, benefitting from a more uniform veneer structure that reduces localized weaknesses.
  • Out-of-plane orientations (Tz and Cz) display the lowest stiffness and strength, consistent with reduced load-bearing capacity perpendicular to grain and greater susceptibility to interlaminar shear failure.
Minimal differences between Tx and Ty validate the intended in-plane isotropy of the panel design. In contrast, comparing tension and compression in the same direction (e.g., Tx vs. Cx) reveals tensile moduli more than double their compressive counterparts, reflecting the differing microstructural deformation mechanisms under opposing load states.
Shear performance is strongly orientation-dependent: τxy and τyx behave as high-stiffness, low-ductility modes, whereas τxz and τyz exhibit lower stiffness but significantly higher ductility before peak load.
In practical application, results from miniature specimens primarily inform the constitutive calibration of orthotropic elastic behavior in numerical and analytical models. However, strength parameters should be regarded as upper-bound values, since the probability of encountering large defects or adhesive discontinuities increases with scale. To extend these results to panel-level design or simulation, statistical scaling frameworks such as those proposed by Weibull [74] and Bažant [75] may be applied to adjust the strength values, while maintaining the elastic constants obtained experimentally. Furthermore, the weakest-link interpretation for timber discussed by Walley (2022) [66] provides guidance for incorporating heterogeneity and defect probability into model calibration. This approach ensures that the present miniature-scale data remain applicable for the numerical modeling and performance prediction of industrial plywood panels used in modular timber construction.
Potential limitations should also be recognized when extrapolating miniature-specimen data to full-scale plywood panels. The reduced specimen size decreases the likelihood of including natural defects such as knots, voids, or glue-line irregularities, which can lead to slightly higher measured strengths compared to industrial products. Differences in moisture distribution, veneer thickness variation, and pressing uniformity may further influence scale transfer. In addition, global structural effects such as combined bending-shear or delamination may not be fully reproduced at the miniature scale. Consequently, the present results should be viewed as material-level properties suitable for constitutive modeling and comparative analysis, while design-level performance assessments require scale-adjusted or statistically corrected parameters following established size-effect models [66,74,75].

5. Conclusions

The orthotropic mechanical behavior of the examined plywood configurations reflects the combined influence of veneer architecture, interfacial bonding, and anisotropic load transfer across layers. Configuration F1 exhibited greater stiffness in both tension and compression, particularly in the transverse directions, due to its thicker perpendicular veneers, which provide enhanced bending restraint and improved shear coupling between adjacent layers. In contrast, configuration F2 achieved higher ultimate shear strength because its more uniform veneer structure facilitated more balanced stress distribution and reduced interlaminar mismatch, leading to a more stable shear response.
Differences in elastic modulus between the two configurations arise from the degree of shear–tension coupling and the local strain concentration at adhesive interfaces. The thicker cross plies in F1 increase in-plane constraint and stiffness but also intensify shear strain localization, whereas the thinner transverse veneers in F2 permit more compliant deformation, yielding slightly lower stiffness but greater ductility and delayed shear failure. The observed asymmetry between tension and compression is attributed to microstructural deformation mechanisms: tension primarily mobilizes the aligned wood fibers, while compression induces cell-wall buckling and local kinking, resulting in earlier stiffness degradation. These trends are consistent with micromechanical models describing anisotropic deformation and failure in layered wood composites.
The miniature-specimen data obtained in this study provide reliable input for constitutive calibration of orthotropic elastic behavior. However, when extrapolated to full-scale applications, probabilistic size-effect frameworks should be applied to account for defect-induced strength reduction. Overall, the mechanical contrasts between F1 and F2 can be directly attributed to their veneer-thickness distributions and associated efficiency of shear transfer, establishing a clear link between microstructural design and macroscopic mechanical performance. These insights support the optimization of plywood architecture for modular, lightweight, and carbon-efficient timber construction.

Author Contributions

Conceptualization, V.T., J.P.C.-R. and M.S.; methodology, M.S. and V.T.; formal analysis, M.S., V.T., A.O., P.S.-Z. and J.P.C.-R.; investigation, M.S. and V.T.; resources, M.A., V.T. and R.C.; data curation, M.S., P.S.-Z. and M.A.; writing—original draft preparation, M.S. and M.J.; writing—review and editing, M.J., M.S., A.O., M.A., J.P.C.-R., E.I.S.F. and V.T.; visualization, M.S., M.A., P.S.-Z. and V.T.; validation, M.J., E.I.S.F., R.C. and V.T.; supervision, V.T.; project administration, J.P.C.-R., R.C. and V.T.; funding acquisition, J.P.C.-R., M.S. and V.T. All authors have read and agreed to the published version of the manuscript.

Funding

This research was funded by the projects “Development of Modular Social Housing through Industrialized Construction to Address the Housing Deficit in Chile” (CORFO—23CVI-245620), “Sustainable Tourism: Design and Prototyping of High-Energy Efficiency Infrastructure in the La Araucanía Region through a Digital Fabrication Construction System” (Universidad Autónoma de Chile), and project “Coating nano estructurado con capacidad de captar y/o transformar gases de efecto invernadero (GEI) por acción de radiación UV/visible, para aplicación en tableros contrachapados” CORFO EAGON 23IAT-246193. Masoud Javadi and Erick I. Saavedra Flores gratefully acknowledge the financial support provided by the Chilean National Agency for Research and Development (ANID) through the Fondecyt Regular Project No. 1251279 and the Anillo de Tecnología Project ACT240015.

Data Availability Statement

The original contributions presented in the study are included in the article, further inquiries can be directed to the corresponding author.

Acknowledgments

The authors gratefully acknowledge the use of equipment provided by Fondequip EQM180111, the Laboratorio de Manufactura Inteligente, and the Laboratorio de Materiales Compuestos in the Mechanical Engineering Department at Universidad de La Frontera, as well as the Centro de Transferencia Tecnológica de la Construcción (CTTC) and Material Design Laboratory (MADlab) at Universidad Autónoma de Chile.

Conflicts of Interest

M. Sandoval and R. Cancino were employed by the R&D Innovation Department at Eagon Lautaro S.A. The remaining authors declare that the research was conducted in the absence of any commercial or financial relationships that could be construed as a potential conflict of interest.

References

  1. Valenzuela, M.; Ciudad, G.; Cárdenas, J.P.; Medina, C.; Salas, A.; Oñate, A.; Pincheira, G.; Attia, S.; Tuninetti, V. Towards the Development of Performance-Efficient Compressed Earth Blocks from Industrial and Agro-Industrial by-Products. Renew. Sustain. Energy Rev. 2024, 194, 114323. [Google Scholar] [CrossRef]
  2. Miranda, A.; Muñoz, R.; Aedo, C.; Bustos, F.; Tuninetti, V.; Valenzuela, M.; Medina, C.; Oñate, A. High-Performance Concrete from Rubber and Shell Waste Materials: Experimental and Computational Analysis. Materials 2024, 17, 5516. [Google Scholar] [CrossRef]
  3. Kamali, M.; Hewage, K.; Sadiq, R. Conventional Versus Modular Construction Methods: A Comparative Cradle-to-Gate LCA for Residential Buildings. Energy Build. 2019, 204, 109479. [Google Scholar] [CrossRef]
  4. Pillai, R.G.; Gettu, R.; Santhanam, M.; Rengaraju, S.; Dhandapani, Y.; Rathnarajan, S.; Basavaraj, A.S. Service Life and Life Cycle Assessment of Reinforced Concrete Systems with Limestone Calcined Clay Cement (LC3). Cem. Concr. Res. 2019, 118, 111–119. [Google Scholar] [CrossRef]
  5. Cadavid-Giraldo, N.; Velez-Gallego, M.C.; Restrepo-Boland, A. Carbon Emissions Reduction and Financial Effects of a Cap and Tax System on an Operating Supply Chain in the Cement Sector. J. Clean. Prod. 2020, 275, 122583. [Google Scholar] [CrossRef]
  6. Chinzorigt, G.; Lim, M.K.; Yu, M.; Lee, H.; Enkbold, O.; Choi, D. Strength, Shrinkage and Creep and Durability Aspects of Concrete Including CO2 Treated Recycled Fine Aggregate. Cem. Concr. Res. 2020, 136, 106062. [Google Scholar] [CrossRef]
  7. Cuellar, S.; Grisales, S.; Castaneda, D.I. Constructing Tomorrow: A Multifaceted Exploration of Industry 4.0 Scientific, Patents, and Market Trend. Autom. Constr. 2023, 156, 105113. [Google Scholar] [CrossRef]
  8. Olawumi, T.O.; Chan, D.W.M.; Ojo, S.; Yam, M.C.H. Automating the Modular Construction Process: A Review of Digital Technologies and Future Directions with Blockchain Technology. J. Build. Eng. 2022, 46, 103720. [Google Scholar] [CrossRef]
  9. Lacey, A.W.; Chen, W.; Hao, H.; Bi, K. Structural Response of Modular Buildings–an Overview. J. Build. Eng. 2018, 16, 45–56. [Google Scholar] [CrossRef]
  10. Rasmussen, F.N.; Andersen, C.E.; Wittchen, A.; Hansen, R.N.; Birgisdóttir, H. Environmental Product Declarations of Structural Wood: A Review of Impacts and Potential Pitfalls for Practice. Buildings 2021, 11, 362. [Google Scholar] [CrossRef]
  11. Díaz, A.R.; Saavedra Flores, E.I.; Yanez, S.J.; Vasco, D.A.; Pina, J.C.; Guzmán, C.F. Multiscale Modeling of the Thermal Conductivity of Wood and Its Application to Cross-Laminated Timber. Int. J. Therm. Sci. 2019, 144, 79–92. [Google Scholar] [CrossRef]
  12. Thinley, J.; Hengrasmee, S. Innovating Bhutan’s Residential Construction with Mass Timber for Economic and Environmental Sustainability. J. Build. Eng. 2023, 78, 107763. [Google Scholar] [CrossRef]
  13. De Araujo, V.; Aguiar, F.; Jardim, P.; Mascarenhas, F.; Marini, L.; Aquino, V.; Santos, H.; Panzera, T.; Lahr, F.; Christoforo, A. Is Cross-Laminated Timber (CLT) a Wood Panel, a Building, or a Construction System? A Systematic Review on Its Functions, Characteristics, Performances, and Applications. Forests 2023, 14, 264. [Google Scholar] [CrossRef]
  14. Karacabeyli, E.; Douglas, B. CLT Handbook: Cross-Laminated Timber (U.S. Edition); FPInnovations and Binational Softwood Lumber Council: Pointe-Claire, QC, Canada, 2013; ISBN 978-0-86488-554-8. [Google Scholar]
  15. Nakano, K.; Karube, M.; Hattori, N. Environmental Impacts of Building Construction Using Cross-Laminated Timber Panel Construction Method: A Case of the Research Building in Kyushu, Japan. Sustainability 2020, 12, 2220. [Google Scholar] [CrossRef]
  16. Pina, J.C.; Saavedra Flores, E.I.; Saavedra, K. Numerical Study on the Elastic Buckling of Cross-Laminated Timber Walls Subject to Compression. Constr. Build. Mater. 2019, 199, 82–91. [Google Scholar] [CrossRef]
  17. Saavedra Flores, E.I.; Ajaj, R.M.; Dayyani, I.; Chandra, Y.; Das, R. Multi-Scale Model Updating for the Mechanical Properties of Cross-Laminated Timber. Comput. Struct. 2016, 177, 83–90. [Google Scholar] [CrossRef]
  18. Flores, E.I.S.; Dayyani, I.; Ajaj, R.M.; Castro-Triguero, R.; DiazDelaO, F.A.; Das, R.; Soto, P.G. Analysis of Cross-Laminated Timber by Computational Homogenisation and Experimental Validation. Compos. Struct. 2015, 121, 386–394. [Google Scholar] [CrossRef]
  19. Wang, T.; Wang, Y.; Crocetti, R.; Wålinder, M. In-Plane Mechanical Properties of Birch Plywood. Constr. Build. Mater. 2022, 340, 127852. [Google Scholar] [CrossRef]
  20. Tuninetti, V.; Sandoval, M.; Cárdenas-Ramírez, J.P.; Oñate, A.; Miranda, A.; Soto-Zúñiga, P.; Arnett, M.; Leiva, J.; Cancino, R. Miniaturized Shear Testing: In-Plane and Through-Thickness Characterization of Plywood. Materials 2024, 17, 5621. [Google Scholar] [CrossRef] [PubMed]
  21. Bekhta, P.; Pizzi, A.; Kusniak, I.; Bekhta, N.; Chernetskyi, O.; Nuryawan, A. A Comparative Study of Several Properties of Plywood Bonded with Virgin and Recycled LDPE Films. Materials 2022, 15, 4942. [Google Scholar] [CrossRef]
  22. Bekhta, P.; Chernetskyi, O.; Kusniak, I.; Bekhta, N.; Bryn, O. Selected Properties of Plywood Bonded with Low-Density Polyethylene Film from Different Wood Species. Polymers 2021, 14, 51. [Google Scholar] [CrossRef]
  23. Bekhta, P.; Pipíška, T.; Gryc, V.; Sedliačik, J.; Král, P.; Ráheľ, J.; Vaněrek, J. Properties of Plywood Panels Composed of Thermally Densified and Non-Densified Alder and Birch Veneers. Forests 2023, 14, 96. [Google Scholar] [CrossRef]
  24. Olenska, S.; Beer, P. Quality Evaluation of New Types of Core Layers Based on Different Thicknesses of Veneers for Flooring Materials. Materials 2024, 17, 5881. [Google Scholar] [CrossRef]
  25. Tuninetti, V.; Alzugaray, R.; González, J.; Valenzuela, M.; Jaramillo, A.; Diez, E. Root Cause and Vibration Analysis to Increase Veneer Manufacturing Process Efficiency: A Case Study on an Industrial Peeling Lathe. Eur. J. Wood Wood Prod. 2021, 79, 951–966. [Google Scholar] [CrossRef]
  26. Galdino, D.S.; Silva, M.F.F.; Arroyo, F.N.; Rangel, E.C.; Caraschi, J.C.; dos Santos, H.F.; de Freitas, L.; Christoforo, A.L.; de Campos, C.I. Properties of Plywood Made of Thermally Treated Veneers Bonded with Castor Oil-Based Polyurethane Adhesive. Forests 2023, 14, 1635. [Google Scholar] [CrossRef]
  27. Xiao, G.; Liang, J.; Li, D.; Tu, Y.; Zhang, B.; Gong, F.; Gu, W.; Tang, M.; Ding, X.; Wu, Z.; et al. Fully Bio-Based Adhesive from Tannin and Sucrose for Plywood Manufacturing with High Performances. Materials 2022, 15, 8725. [Google Scholar] [CrossRef] [PubMed]
  28. Birinci, E.; Kaymakci, A. Effect of Freeze–Thaw Cycling on the Screw Direct Withdrawal Resistance of Beech, Ozigo, and Okoume Plywoods. Forests 2023, 14, 1243. [Google Scholar] [CrossRef]
  29. Barboutis, I.; Kamperidou, V. Properties of Two Different Thicknesses 3-Ply Plywood of Tree-of-Heaven Veneers. In Proceedings of the 22nd International Scientific Conference, Zagreb, Croatia, 21 October 2011; Volume 2011, pp. 9–16. [Google Scholar]
  30. Koynov, D.; Antov, P.; Valyova, M.; Savov, V.; Dochev, I.; Lee, S.H. Properties of Hybrid Plywood Produced by Utilisation of Peeler Cores. Forests 2024, 15, 582. [Google Scholar] [CrossRef]
  31. Núñez-Decap, M.; Sandoval-Valderrama, B.; Opazo-Carlsson, C.; Moya-Rojas, B.; Vidal-Vega, M.; Opazo-Vega, A. Use of Carbon and Basalt Fibers with Adhesives to Improve Physical and Mechanical Properties of Laminated Veneer Lumber. Appl. Sci. 2023, 13, 10032. [Google Scholar] [CrossRef]
  32. Núñez-Decap, M.; Friz-Sánchez, C.; Opazo-Carlsson, C.; Moya-Rojas, B.; Vidal-Vega, M. A Potential Replacement to Phenol–Formaldehyde-Based Adhesives: A Study of Plywood Panels Manufactured with Bio-Based Wood Protein and Nanolignin Adhesives. Forests 2024, 15, 1345. [Google Scholar] [CrossRef]
  33. Papadopoulou, E.; Moutousidis, D.; Kountouras, S.; Argyropoulou, A.; Stathopoulos, P.; Skaltsounis, A.L.; Ioannidis, R.O.; Xanthopoulou, E.; Malletzidou, L.; Chrissafis, K. New Bio-Based Binding Systems for Plywood Panels. Appl. Sci. 2024, 14, 5862. [Google Scholar] [CrossRef]
  34. Zhang, W.; Liu, C.; Du, Z.; Wang, H.; Du, G.; Essawy, H.; Lei, H.; Xi, X.; Zhou, X.; Cao, M. Soybean Meal–Oxidized Lignin as Bio-Hybridized Wood Panel Adhesives with Increased Water Resistance. Forests 2024, 15, 1036. [Google Scholar] [CrossRef]
  35. Jorda, J.; Cesprini, E.; Barbu, M.-C.; Tondi, G.; Zanetti, M.; Král, P. Quebracho Tannin Bio-Based Adhesives for Plywood. Polymers 2022, 14, 2257. [Google Scholar] [CrossRef] [PubMed]
  36. Sutiawan, J.; Syahfitri, A.; Purnomo, D.; Sudarmanto; Narto; Akbar, F.; Triwibowo, D.; Ismadi; Amanda, P.; Kusumah, S.S.; et al. Characterization and Application of Non-Formaldehyde Binder Based Citric Acid, Maleic Acid, and Molasses Adhesive for Plywood Composite. Polymers 2023, 15, 3897. [Google Scholar] [CrossRef]
  37. Shalbafan, A.; Thoemen, H. Development of Mineral-Bonded Plywood with Magnesium Oxychloride as a Binder Using the Hot-Pressing Process. Polymers 2023, 15, 805. [Google Scholar]
  38. Gonçalves, S.; Paiva, N.T.; Martins, J.; Magalhães, F.D.; Carvalho, L.H. Effect of Lignosulphonates on the Moisture Resistance of Phenol–Formaldehyde Resins for Exterior Plywood. Materials 2024, 17, 3715. [Google Scholar] [CrossRef]
  39. Chang, L.; Wang, Y.; Chen, X.; Ren, Y.; Luo, X. Effect of Grafting Conditions on the Interfacial Properties of Silane Modified Wood Veneer/PE Film Plywood. Polymers 2023, 15, 2957. [Google Scholar] [CrossRef] [PubMed]
  40. Gerrand, C. The Equivalent Orthotropic Elastic Properties of Plywood. Wood Sci. Technol. 1987, 21, 335–348. [Google Scholar] [CrossRef]
  41. Sudo, R.; Aoki, K.; Inayama, M. Investigation of Mechanical Properties and Elucidation of Factors Affecting Wood-Based Structural Panels under Embedment Stress with a Circular Dowel i: Analysis of the Influence of Various Conditions on the Embedment Properties. J. Wood Sci. 2023, 69, 18. [Google Scholar] [CrossRef]
  42. Krüger, R.; Buchelt, B.; Wagenführ, A. New Method for Determination of Shear Properties of Wood. Wood Sci. Technol. 2018, 52, 1555–1568. [Google Scholar] [CrossRef]
  43. Brabec, M.; Laga\v{n}a, R.; Milch, J.; Tippner, J.; Sebera, V. Utilization of Digital Image Correlation in Determining of Both Longitudinal Shear Moduli of Wood at Single Torsion Test. Wood Sci. Technol. 2017, 51, 29–45. [Google Scholar] [CrossRef]
  44. Guan, C.; Zhang, H.; Wang, X.; Miao, H.; Zhou, L.; Liu, F. Experimental and Theoretical Modal Analysis of Full-Sized Wood Composite Panels Supported on Four Nodes. Materials 2017, 10, 683. [Google Scholar] [CrossRef]
  45. Bachtiar, E.V.; Rüggeberg, M.; Hering, S.; Kaliske, M.; Niemz, P. Estimating Shear Properties of Walnut Wood: A Combined Experimental and Theoretical Approach. Mater. Struct. 2017, 50, 248. [Google Scholar] [CrossRef]
  46. Zhang, L.; Yang, N. Evaluation of a Modified Iosipescu Shear Test Method for Determining the Shear Properties of Clear Wood. Wood Sci. Technol. 2017, 51, 323–343. [Google Scholar] [CrossRef]
  47. Krüger, R.; Wagenführ, A. Comparison of Methods for Determining Shear Modulus of Wood. Eur. J. Wood Wood Prod. 2020, 78, 1087–1094. [Google Scholar] [CrossRef]
  48. PS01-19; Structural Plywood. National Institute of Standards and Technology (NIST): Gaithersburg, MD, USA, 2019.
  49. EN 789:2004; Timber Structures-Test Methods-Determination of Mechanical Properties of Wood-Based Panels. European Committee for Standardization (CEN): Brussels, Belgium, 2004.
  50. EN 310:1993; Wood-Based Panels-Determination of Modulus of Elasticity in Bending and of Bending Strength. European Committee for Standardization (CEN): Brussels, Belgium, 1993.
  51. ASTM D1037-99; Standard Test Methods for Evaluating Properties of Wood-Base Fiber and Particle Panel Materials. ASTM International: West Conshohocken, PA, USA, 1999.
  52. ASTM D5456-03; Standard Specification for Evaluation of Structural Composite Lumber Products. ASTM International: West Conshohocken, PA, USA, 2003.
  53. ISO 12465:2007; Plywood–Specifications. International Organization for Standardization (ISO): Geneva, Switzerland, 2007.
  54. Dahl, K.B.; Malo, K.A. Nonlinear Shear Properties of Spruce Softwood: Experimental Results. Wood Sci. Technol. 2009, 43, 539–558. [Google Scholar] [CrossRef]
  55. Ostapska, K.; Malo, K.A. New Approach to Testing Shear in Wood on Structural Scale. Int. J. Solids Struct. 2021, 212, 46–60. [Google Scholar] [CrossRef]
  56. EN 314:1993; Plywood–Bonding Quality-Test Methods. European Committee for Standardization (CEN): Brussels, Belgium, 1993.
  57. Breyer, R.; Cannon, M.; Jennings, J.; Ashley, S. The Value of Transitioning from the Lap Shear to an Internal Bond for Testing Plywood. For. Prod. J. 2022, 72, 29–34. [Google Scholar] [CrossRef]
  58. Arriaga-Martitegui, F.; Peraza-Sánchez, F.; García-Esteban, L. Characteristic Values of the Mechanical Properties of Radiata Pine Plywood and the Derivation of Basic Values of the Layers for a Calculation Method. Biosyst. Eng. 2008, 99, 256–266. [Google Scholar] [CrossRef]
  59. Sugahara, E.; Casagrande, B.; Arroyo, F.; De Araujo, V.; Santos, H.; Faustino, E.; Christoforo, A.; Campos, C. Comparative Study of Plywood Boards Produced with Castor Oil-Based Polyurethane and Phenol-Formaldehyde Using Pinus taeda L. Veneers Treated with Chromated Copper Arsenate. Forests 2022, 13, 1144. [Google Scholar] [CrossRef]
  60. Wang, Y.; Wang, T.; Crocetti, R.; Wålinder, M. Experimental Investigation on Mechanical Properties of Acetylated Birch Plywood and Its Angle-Dependence. Constr. Build. Mater. 2022, 344, 128277. [Google Scholar] [CrossRef]
  61. Valdivia, I.; Canales, C.; Tuninetti, V.; Flores, P.; Medina, C. Numerical Prediction of Failure in Unidirectional Fiber Reinforced Composite. Int. J. Appl. Mech. 2021, 13, 2150073. [Google Scholar] [CrossRef]
  62. Rojas-Ulloa, C.; Tuninetti, V.; Sepúlveda, H.; Betaieb, E.; Pincheira, G.; Gilles, G.; Duchêne, L.; Habraken, A.M. Accurate Numerical Prediction of Ductile Fracture and Micromechanical Damage Evolution for Ti6Al4V Alloy. Comput. Mech. 2024, 73, 177–198. [Google Scholar] [CrossRef]
  63. Romero, F.; Méndez, F.; González, J.; Tuninetti, V.; Medina, C.; Valin, M.; Valin, J.; Salas, A.; Vicuña, C. Acoustic Emission-Based Method for IFSS Characterization in Single-Fiber Fragmentation Tests. Appl. Sci. 2025, 15, 4517. [Google Scholar] [CrossRef]
  64. Wang, T.; Wang, Y.; Crocetti, R.; Wålinder, M. Influence of Face Grain Angle, Size, and Moisture Content on the Edgewise Bending Strength and Stiffness of Birch Plywood. Mater. Des. 2022, 223, 111227. [Google Scholar] [CrossRef]
  65. Zhao, C.; Liu, D.; Zhang, C.; Li, Y.; Wang, Y. Influence of Specimen Size on the Compressive Strength of Wood. Buildings 2024, 14, 1156. [Google Scholar] [CrossRef]
  66. Walley, S.M.; Rogers, S.J. Is Wood a Material? Taking the Size Effect Seriously. Materials 2022, 15, 5403. [Google Scholar] [CrossRef]
  67. NCh3617:2022; Madera Contrachapada Estructural-Requisitos y Ensayos. INN: Osaka, Japan, 2022.
  68. ASTM B831-98; Standard Test Method for Shear Testing of Thin Aluminum Alloy Products. ASTM International: West Conshohocken, PA, USA, 1998.
  69. Panchal, M.; Kaushik, L.; Khatirkar, R.; Choi, S.-H.; Singh, J. Recent Advances in the In-Plane Shear Testing of Mg Alloy Sheets. J. Magnes. Alloy. 2023, 11, 405–424. [Google Scholar] [CrossRef]
  70. Bitar, I.S.; Aboulkhair, N.T.; Leach, R. The Application of Composite Through-Thickness Assessment to Additively Manufactured Structures. In Proceedings of the 28th Annual International Solid Freeform Fabrication Symposium, Austin, TX, USA, 7–9 August 2017. [Google Scholar]
  71. Tuninetti, V.; Flores, P.; Valenzuela, M.; Pincheira, G.; Medina, C.; Duchêne, L.; Habraken, A.M. Experimental Characterization of the Compressive Mechanical Behaviour of Ti6Al4V Alloy at Constant Strain Rates over the Full Elastoplastic Range. Int. J. Mater. Form. 2020, 13, 709–724. [Google Scholar] [CrossRef]
  72. Jakimovska Popovska, V.; Iliev, B.; Zlateski, G. Impact of Veneer Layouts on Plywood Tensile Strength. Drv. Ind. 2017, 68, 153–161. [Google Scholar] [CrossRef]
  73. Saavedra Flores, E.I.; DiazDelaO, F.A.; Friswell, M.I.; Sienz, J. A Computational Multi-Scale Approach for the Stochastic Mechanical Response of Foam-Filled Honeycomb Cores. Compos. Struct. 2012, 94, 1861–1870. [Google Scholar] [CrossRef]
  74. Weibull, W. A Statistical Distribution Function of Wide Applicability. J. Appl. Mech. 1951, 18, 293–297. [Google Scholar] [CrossRef]
  75. Bažant, Z.P. Scaling of Quasibrittle Fracture: Asymptotic Analysis. Int. J. Fract. 1997, 83, 19–40. [Google Scholar] [CrossRef]
Figure 1. Cross-section and composition of the selected plywood panels: (a) F1, and (b) F2.
Forests 16 01676 g001
Figure 2. CNC router equipment used for specimen manufacturing: (a) TRAK DPM RX2 CNC router at CTTC UA, (b) generic CNC router with automatic tool changer at UA.
Forests 16 01676 g002
Figure 3. Scaled Miyauchi shear specimen geometry used in this study.
Forests 16 01676 g003
Figure 4. Proposed geometry of Tx and Ty tensile specimens with contact extensometer gauge section.
Forests 16 01676 g004
Figure 5. Proposed geometries: (a) compression specimens Cx, Cy; (b) compression Cz and tension Tz specimens; (c) PLA grip accessory for Tz testing.
Forests 16 01676 g005
Figure 6. Proposed geometries for planar shear specimens: (a) τxy front view, (b) τyx front view, (c) top view, (d) isometric view.
Forests 16 01676 g006
Figure 7. Proposed geometries for out-of-plane shear specimens: (a) τxz top view, (b) τyz top view, (c) front view, and (d) isometric views of assembled and individual components.
Forests 16 01676 g007
Figure 8. CNC manufacturing toolpaths for Tx and Ty tensile specimens: (a) top view, (b) bottom view.
Forests 16 01676 g008
Figure 9. CNC manufacturing toolpaths: (a) Tz tensile, Cx, Cy, Cz compression, and τxyτyx shear specimens; (b) in-plane compression and shear specimens; (c) top and bottom parts of τxzτyz specimens; (d) intermediate shear element.
Forests 16 01676 g009
Figure 10. Additive manufacturing toolpath for Tz tensile accessory: (a) top view showing infill and fiber orientation; (b) isometric view with support configuration. Colors represent toolpath functions in UltiMaker Cura. Orange/red: perimeters (outer and inner walls); yellow: support structures; cyan: build plate adhesion brim surrounding the printed part.
Forests 16 01676 g010
Figure 11. Tensile test setup for miniature plywood specimens: (a) Tx and Ty specimens mounted in the INSTRON 8801 universal testing machine with contact extensometer, (b) Tz specimen mounted in the INSTRON 3369 machine, and (c) accessory-to-accessory configuration for Tz compliance calibration.
Forests 16 01676 g011
Figure 12. Compression test setups for miniature plywood specimens: (a) Cx, (b) Cy, and (c) Cz orientations. All compression tests were performed in an INSTRON 3369 universal testing machine.
Forests 16 01676 g012
Figure 13. Shear test setups for miniature plywood specimens: (a) τxy, (b) τyx, (c) τxz, and (d) τyz configurations. All shear tests were conducted using the INSTRON 3369 universal testing machine under displacement control.
Forests 16 01676 g013
Figure 14. Typical failure modes in tensile specimens: (a) Tx, (b) Ty, (c) Tz, (d) side view Tx, (e) side view Ty, (f) side view Tz.
Forests 16 01676 g014
Figure 15. Stress–strain curves in tension: (a) Tx, (b) Ty, (c) Tz, (d) Tz up to the yield limit.
Forests 16 01676 g015aForests 16 01676 g015b
Figure 16. Deformation progression and typical failure modes in compression for Cx, Cy and Cz orientations at 5%, 15%, and 25% strain. Red lines highlight fracture paths where damage patterns were less evident. (a) Cx—5%: initial crushing and local veneer fracture. (b) Cx—15%: crack growth and fiber tearing. (c) Cx—25%: full fracture with delamination and splitting. (d) Cy—5%: early horizontal shear and splitting. (e) Cy—15%: diagonal shear and stepped cracks. (f) Cy—25%: severe buckling and delamination. (g) Cz—5%: surface crushing with minor cracking. (h) Cz—15%: densification of transverse veneers. (i) Cz—25%: through-thickness crushing with limited fracture.
Forests 16 01676 g016
Figure 17. Stress–strain curves in compression: (a) Cx, (b) Cy, (c) Cz.
Forests 16 01676 g017
Figure 18. Stress–strain curves from uniaxial compression tests for Manufacturers 1 and 2: (a) Cx, Cy, and Cz up to 10% strain; (b) Cx and Cy up to peak stress, and Cz up to the elastic limit; (c) representative curves for Cx, Cy, and Cz up to 10% strain; (d) representative curves for Cx and Cy up to peak stress, and Cz up to the elastic limit.
Forests 16 01676 g018
Figure 19. Deformation progression and typical failure modes in shear for τxy and τyx orientations at 30%, 40%, and 50% strain. Red lines indicate fracture paths. (a) τxy—30%: limited surface cracking in outer veneers. (b) τxy—40%: shear-induced fiber separation and diagonal cracking. (c) τxy—50%: extensive fiber pull-out and adhesive failure. (d) τyx—30%: minor shear cracks along veneer interfaces. (e) τyx—40%: progressive shear separation across layers. (f) τyx—50%: complete shear rupture through multiple veneers.
Forests 16 01676 g019
Figure 20. Shear stress–strain curves: (a) τxy, (b) τyx, (c) τxz, (d) τyz.
Forests 16 01676 g020
Figure 21. Comparative shear stress–strain curves: (a) all shear tests up to 80% strain, (b) up to maximum stress, (c) representative curves by orientation, (d) representative curves up to maximum stress.
Forests 16 01676 g021
Table 1. Three-dimensional printing parameters for PLA accessories used in Tz specimens.
PropertyDetailUnit
PrinterEnder 3 V3 KE
MaterialPLA
Layer height0.2mm
Wall width0.4mm
Number of walls3
Top layers2
Bottom layers2
Infill typeLines
Infill density100%
Print temperature205°C
Bed temperature60°C
Print speed200mm/s
Table 2. Results of tensile tests for the selected plywood panels (Tx, Ty, and Tz) showing mean value and standard deviation (±).
OrientationManufacturerNumber of Specimens.ε10%Fmax (%)ε40Fmax (%)εFmax (%)σFmax (MPa) E T (GPa)
Tx160.051 ± 0.0140.201 ± 0.0510.498 ± 0.12228.40 ± 4.895.83 ± 1.17
260.061 ± 0.0160.259 ± 0.0730.710 ± 0.20630.22 ± 7.684.68 ± 0.73
Ty160.058 ± 0.0160.238 ± 0.0680.614 ± 0.18529.66 ± 6.415.46 ± 2.49
260.061 ± 0.0100.252 ± 0.0410.641 ± 0.16031.63 ± 3.605.08 ± 1.06
Tz150.015 ± 0.0040.078 ± 0.0250.417 ± 0.0771.12 ± 0.260.59 ± 0.23
250.031 ± 0.0190.194 ± 0.1060.671 ± 0.2951.30 ± 0.460.29 ± 0.16
Table 3. Results of compression tests for the selected plywood panels (Cx, Cy, and Cz) showing mean value and standard deviation (±). For Cx and Cy, the reference level is Fmax; for Cz, the reference is the elastic limit σ L e .
OrientationManufacturerNumber of Samplesε10%ref (%)ε40ref (%)εref (%)σref (MPa) E C (GPa)
Cx1100.092 ± 0.0260.369 ± 0.104 2.120 ± 0.665 23.55 ± 2.92 2.67 ± 0.57
2100.114 ± 0.038 0.457 ± 0.150 2.394 ± 0.540 22.97 ± 2.72 2.20 ± 0.73
Cy1100.108 ± 0.028 0.433 ± 0.112 2.113 ± 0.517 27.11 ± 3.03 2.63 ± 0.64
270.116 ± 0.036 0.464 ± 0.146 2.593 ± 0.746 25.46 ± 3.21 2.37 ± 0.72
Cz190.181 ± 0.019 0.730 ± 0.079 2.028 ± 0.205 7.07 ± 0.57 0.39 ± 0.06
290.139 ± 0.0150.558 ± 0.0631.590 ± 0.1476.46 ± 0.910.47 ± 0.08
Table 4. Results of shear tests in different shear stress orientations for the selected plywood panels showing mean value and standard deviation (±).
OrientationManufacturerSpecimen No.ε10%τFmax (%)ε40 τFmax (%)ε τFmax (%)τFmax (MPa) G S (GPa)
τxy160.784 ± 0.3243.145 ± 1.28910.488 ± 4.3486.79 ± 0.420.10 ± 0.03
260.803 ± 0.0933.214 ± 0.37410.105 ± 1.1089.56 ± 0.490.12 ± 0.01
τyx160.949 ± 0.3483.797 ± 1.39314.495 ± 6.8297.29 ± 0.460.09 ± 0.03
260.846 ± 0.1483.384 ± 0.59511.353 ± 2.7159.23 ± 1.120.11 ± 0.03
τxz161.452 ± 0.1165.809 ± 0.46426.980 ± 4.4815.64 ± 0.590.04 ± 0.00
262.073 ± 0.1808.291 ± 0.71842.260 ± 6.2337.39 ± 0.280.04 ± 0.003
τyz161.541 ± 0.1366.166 ± 0.54528.147 ± 3.7437.07 ± 0.260.05 ± 0.00
251.987 ± 0.3667.950 ± 1.46447.06 ± 19.1117.59 ± 1.450.04 ± 0.00
Disclaimer/Publisher’s Note: The statements, opinions and data contained in all publications are solely those of the individual author(s) and contributor(s) and not of MDPI and/or the editor(s). MDPI and/or the editor(s) disclaim responsibility for any injury to people or property resulting from any ideas, methods, instructions or products referred to in the content.