Abstract
Understanding the mechanisms that assemble diverse forest communities is a central goal in ecology. Phylogenetic analyses based on DNA barcodes have advanced this field, but their use of sequences evolving at constant rates may not capture adaptations to specific environmental drivers. Light is a critical factor shaping forest structure, particularly in the vertical dimension. This study introduces a novel phylogenetic approach using the blue-light receptor gene, cryptochrome (Cry), which is directly involved in plant light perception and adaptation. We reconstructed a Cry-based phylogeny for 96 tree species in a 20 ha subtropical forest dynamics plot and analyzed community structure using the net relatedness index (NRI) and nearest taxon index (NTI) across horizontal habitats, successional stages, and vertical canopy layers. Compared to traditional DNA barcoding, the Cry phylogeny revealed distinct patterns, showing consistent phylogenetic structure across different habitats—a finding indicative of convergent evolution in light-sensing systems. Furthermore, the Cry-based analysis demonstrated a stronger and more consistent signal in the forest’s vertical structure, with significant phylogenetic clustering in upper canopy layers, directly linking light adaptation to community stratification. Over time, both NRI and NTI values increased, suggesting succession leads to greater phylogenetic overdispersion and highlighting an increased role for environmental filtering among closely related taxa. Our results validate Cry as a powerful functional gene marker for phylogenetics, providing unique insights into how light environment filters species and shapes the vertical assembly of forest communities.
1. Introduction
Forests are among the most biodiverse terrestrial ecosystems on the planet, harboring a vast majority of the world’s terrestrial species. How are biological communities structured? This involves understanding the patterns of species identity, abundance, and distribution. Community assembly is one of the main topics of community ecology studies. Understanding the mechanism underlying forest community assembly is fundamental to maintaining ecosystem resilience. Species diversity and community assembly are considered to be determined by the following two main mechanisms: (1) niche-based processes associated with competitive exclusion and environmental filtering [1] and (2) neutral processes influenced by random demographic dynamics [2]. The integrating of evolutionary history of species into community ecology helped revolve the questions of community assembly and diversity [3,4].
An analysis of phylogenetic structure is vital for studying community assembly and monitoring biodiversity. Kress et al. [5] originally advanced a DNA barcoding technique for building detailed community phylogenies. Subsequently, this method has been extensively applied in forest research. It is recognized as a quick and dependable tool that enhances assessment accuracy through fully resolved phylogenies [6]. In the last decade, numerous researchers used the DNA barcoding method in monitoring the biodiversity of forest communities [5,6,7,8,9]. However, community phylogenetic analyses using DNA barcode sequences have their limitations. These DNA sequences (i.e., rbcL, matK, and trnH-psbA) evolved under a constant rate, and thus do not correspond to environmental changes. In this study, we develop a method of analyzing community phylogenetic structure by the blue-light receptor gene cryptochrome (Cry).
The assembly and structure of forest communities are shaped by a complex interplay of biotic and abiotic factors. Light-regime variability is one of the most important environmental factors which shapes a forest community [10,11,12]. Light is not only the energy resource of green plants, but also an important environmental signal, which regulates the growth of plants [13]. The light-sensing of plants is conducted by light-receptor proteins including CRY [14,15]. Cryptochrome performs essential physiological functions of plants, such as photomorphogenesis, circadian rhythm, and the phototropism of plants [16].
Light-spectrum various in forest especially for blue light (390–500 nm); blue light is filtered by canopies and topographical variations thus blue-light-sensing for shaded trees is a great challenge [17]. CRY plays an important role in the shade avoidance syndrome (SAS) of forest plants under low blue light [18]. Therefore, we hypothesize the evolution of cryptochrome may influence the habitat selection and local adaptation of plant species in the forest community.
In this study, we implemented this approach in the 20 ha Dinghushan Forest Dynamics Plot (DHS FDP). We used sequences of the plant blue-light receptor Cry to reconstruct the phylogeny. We then analyzed phylogenetic structures across multiple dimensions: habitat types, spatial scales, time, succession stages, and vertical structure. The vertical structure of the forest is primarily influenced by the light; in contrast, horizontal community assembly is shaped by multiple biotic and abiotic factors [11]. Thus, we hypothesize that Cry-based phylogeny is more strongly linked to vertical structure than to horizontal assembly. A prior study using DNA barcodes has already elucidated the horizontal community assembly in Dinghushan forest [7]. Here, we compare our Cry-derived results with these earlier DNA barcode findings. This allows us to evaluate the feasibility of the Cry method. By exploring the community assembly mechanisms in a south subtropical evergreen broadleaf forest, this work offers insights for in situ biodiversity conservation. It may also provide a new perspective for future studies on community assembly.
2. Materials and Methods
2.1. Study Site and Sample Collection
The study site is the 20 ha Dinghushan subtropical forest dynamics plot (DHS FDP) located in Dinghushan National Nature Reserve (23°09′21″–23°11′30″ N, 112°30′30″–112°33′41″ E), Zhaoqing city, Guangdong Province, China. The DHS FDP is a member of Chinese Forest Biodiversity Monitoring Network (CForBio) and the Center for Tropical Forest Science (CTFS) global network of forest dynamics plots. In the plot, all trees with a diameter at breast height ≥ 1 cm (DBH) were measured, mapped, and tagged every 5 years since 2005. Fresh leaves of each species were collected from 2 tagged individuals located within the plot during 2015 census. Leaf tissue was dried immediately in silica gel and stored in −20 °C freezer.
2.2. Sampling
Fresh leaves of each species were collected from 2 tagged individuals located within the plot during 2015 census. Leaf tissue was dried immediately in silica gel and stored in −20 °C freezer.
2.3. DNA Extraction and Sequencing
Genomic DNA sequences were extracted from freeze-dried leaf samples using a DNA extraction Kit (TransGen Biotech, Beijing, China). Then, a pair of degenerate primers (5′-TCWCCDCTTCTNCCICCTAA-3′ and 5′-TGTRTCCCARAARTACTTCA-3′) were utilized to amplify the Cry sequences by PCR. The obtained fragments covered the most conserved region of the FAD-binding domain of cryptochrome. The PCR cycling was started at 95 °C for 10 min, followed by 40 cycles of 95 °C, 54 °C and 72 °C for 1 min, and then extension at 72 °C for 10 min. Then, DNA sequences of cryptochrome were translated into protein. The amino acid dataset was aligned using MUSCLE v. 3.8.31 [19]. Also, all Cry sequences used in this study were submitted to GenBank (https://www.ncbi.nlm.nih.gov/, accessed on 5 May 2019) and the accession numbers were listed in Table S1.
2.4. Phylogenetic Reconstruction
The phylogenetic reconstruction was performed using the Cry and DNA barcode sequences. The most appropriate model of amino acid substitutions for our dataset was determined according to the Akaike information criterion (AIC) and using ProtTest v.3.0 [20,21]. Based on the test, the most appropriate substitution model for Cry sequences is GTR with gamma distribution and proportion of invariable sites (GTR + G + I, α = 0.86, p-inv = 0.20). Then, we used the Bayesian method as implemented in BEAST v.2.4.3 [22] to reconstruct the phylogeny of plant Cry. The length of the Markov Chain Monte Carlo (MCMC) chain was set for 10 million, with trees sampled every 1000 steps. The maximum clade credibility tree was determined from the generated 10,000 trees (burnin = 10%) using TreeAnnotator v.2.1.2 from the BEAST software package. Also, the phylogenetic tree was calibrated according to molecular time estimates (Table 1) [23,24].

Table 1.
Calibration points used in molecular phylogenetic tree.
2.5. Community Structure Analyses
In this study, the 20 ha plot was divided into five hundred 20 m × 20 m and twenty 100 m × 100 m quadrats. These quadrats are adjacent and non-overlapping. The analyses were conducted by two different spatial scales. The classification of habitat types and spatial scales followed the methods of a previous study [7]. Five types of habitats in the DHS FDP were classified, including high-gully (HG), high-slope (HS), low-slope (LS), ridge-top (RT) and valley (V) (Figure 1a and Table 2). In addition, the plot consisted of two types of forests including early-successional (ES, ~60 years) and late-successional (LS, ~400 years) stands, in accordance with those used in (Figure 1b) [25,26]. Also, we analyzed the patterns in community assemblies of forest vertical structures, including shrub (sh, 1.4–5 m of tree height), understory (un, 5.1–10 m), canopy (ca, 10.1–15 m) and emergent (em, >15 m) layers. The net relatedness index (NRI) and nearest taxon index (NTI) were utilized to estimate the patterns of community assembly [27].
NRI = −1 × (MPD − rndMPD)/sdrndMPD
NTI = −1 × (MNTD − rndMNTD)/sdrndMNTD
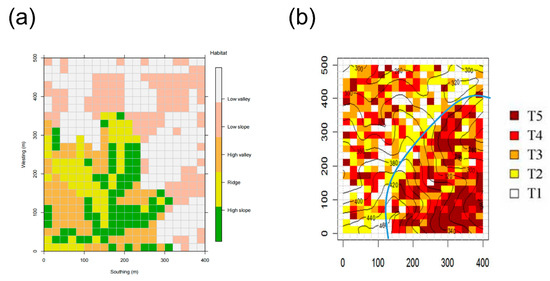
Figure 1.
The spatial distribution of habitats and successional stages in the 20 ha DHS FDP. (a) The five habitat types [7]; (b) early-successional (left of blue line) and late-successional (right of blue line) stands—quadrats from youngest to oldest: T1–T5 [25,26].
Table 2.
Habitats of DHS FDP.
Where MPD is mean phylogenetic distance, MNTD is mean nearest phylogenetic taxon distance. The rndMPD and rndMMPD are the mean MPD and mean MMPD generated by null model, and sd is standard deviation. Mean pairwise distances are weighted by species abundance. The null models were obtained by shuffling the species names across the tips of the phylogeny with 999 random assemblages. We compared the observed values of MPDs and MNTDs to the null distributions. The analyses conducted using the Picante package as implement in R v.3.3.1 [28]. Finally, two-tailed tests were run for the statistical significance of NRI/NTI results (significance threshold was set at 0.05).
In this study, NRI and NTI indices generated by DNA barcodes and CRY were compared. This integrated approach enables a nuanced examination of how both deep and recent evolutionary adaptations in light perception shape forest communities.
3. Results
3.1. Phylogenetic Analyses
The phylogeny of DHS FDP was constructed by Bayesian method using CRY sequences with posterior possibility (Figure 2). This study included 96 species, corresponding to 94.73% of total orders, 82.61% of families, 57.14% of species, and 92.67% of existing angiosperm tree individuals in DHS FDP according to 2015 census data. Generally, we found the statistic support for major nodes is quite strong (most posterior possibility >0.9, Figure 2). Also, we compared the CRY tree and the DNA barcoding tree (species tree). The CRY and species phylogenetic trees demonstrated distinct topology (Figure 2).
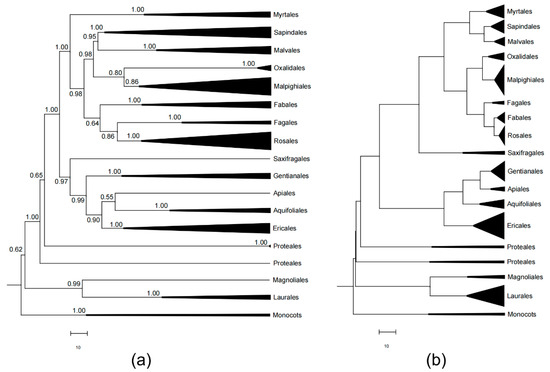
Figure 2.
A comparison of the Bayesian phylogenetic trees of DHS FDP. The gene tree (a) is inferred by Cry (node support below 0.5 are not shown) and the species tree (b) is reconstructed by DNA barcode sequences.
3.2. Community Phylogenetic Structure Analyses
Analysis of the phylogenetic structure across habitats and time revealed a consistent and contrasting pattern between the two indices. At the 20 m × 20 m scale, NRI values were predominantly negative, indicating phylogenetic overdispersion across the entire tree. Conversely, NTI values were generally positive, suggesting clustering of closely related species (Figure 3). This pattern, which was consistent across all five habitat types, implies that while distantly related taxa tend to co-occur at a broad phylogenetic scale, recent lineages are more likely to coexist in local assemblages.
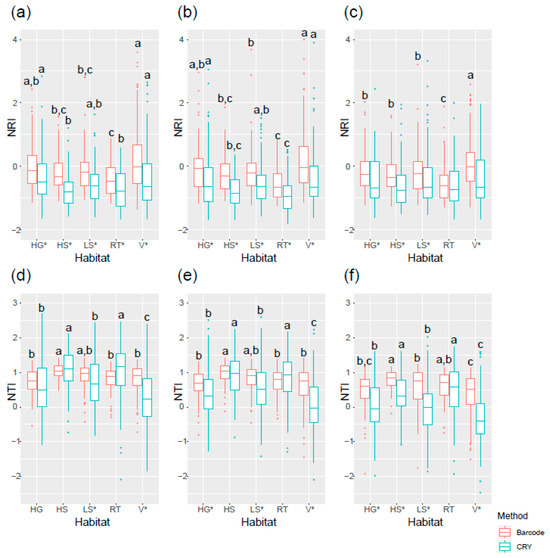
Figure 3.
The net relatedness index (NRI) and nearest taxon index (NTI) varied by time and habitat types in 20 m × 20 m quadrats. (a) 2005 NRI, (b) 2010 NRI, (c) 2015 NRI, (d) 2005 NTI, (e) 2010 NTI, and (f) 2015 NTI. Five types of habitats in the DHS FDP including high-gully (HG), high-slope (HS), low-slope (LS), ridge-top (RT), and valley (V) were classified by Pei et al. [7]. Lowercase letters indicate significant differences among the habitat types, and * symbols indicate significant differences between two methods (p < 0.05). The box plots show the median (center line) and the 25th and 75th percentiles (box boundaries), and the whiskers extend to 1.5 times the interquartile range from the box. Data points beyond the whiskers are considered outliers and are plotted individually.
The phylogenetic structure of the community was not static. At the larger 100 m × 100 m scale, a clear temporal trend emerged from 2005 to 2015. NRI values derived from the CRY phylogeny increased significantly over time (Figure 4). This shift indicates that the community assembly became progressively more phylogenetically clustered, a pattern that contrasted with the increasing overdispersion observed in the DNA barcode data.
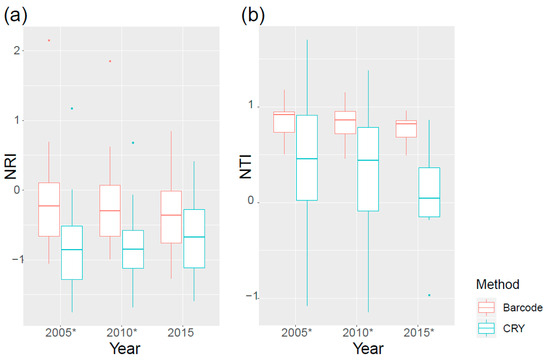
Figure 4.
The NRI (a) and NTI (b) of a larger spatial scale (100 m × 100 m). * symbols indicate significant differences between two methods (p < 0.05). Data points beyond the whiskers are considered outliers and are plotted individually.
This trend was mirrored in the successional stages. Late-successional forests exhibited greater phylogenetic overdispersion in NRI but stronger clustering in NTI compared to early-successional stands (Figure 5). This reinforces that the scale of phylogenetic analysis critically shapes our interpretation, with deep evolutionary history (NRI) and recent diversification (NTI) telling different stories about the assembly process.
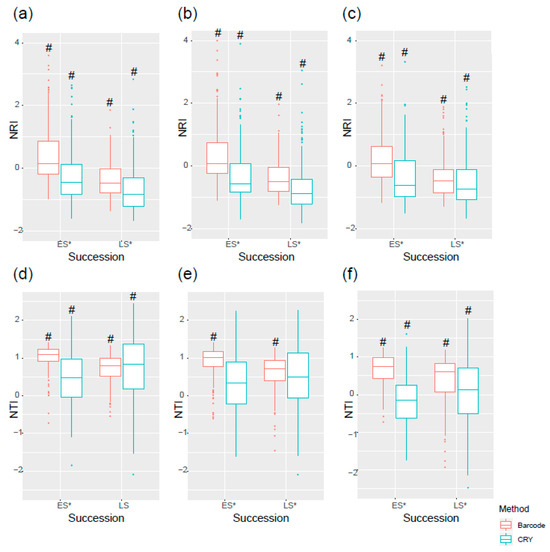
Figure 5.
The NRI and NTI varied by successional stages of forest. (a) 2005 NRI, (b) 2010 NRI, (c) 2015 NRI, (d) 2005 NTI, (e) 2010 NTI, and (f) 2015 NTI. # symbols indicate significant differences between successional stages and * symbols indicate significant differences between two methods (p < 0.05). Data points beyond the whiskers are considered outliers and are plotted individually.
The influence of light on community assembly was most apparent in the vertical structure of the forest. CRY-based NRI values showed significantly greater phylogenetic clustering in the upper canopy and emergent layers compared to the understory, a pattern consistent in both the 2010 and 2015 censuses (Figure 6a,b). This suggests that adaptation to high-light conditions in the canopy is conserved among closely related species. The NTI results further supported this, showing clustering in the understory and canopy layers in 2010 (Figure 6c). The persistence of this vertical signal in the CRY data, even when it was absent in the DNA barcode results by 2015, underscores the specific utility of the CRY gene for interrogating light-mediated community assembly.
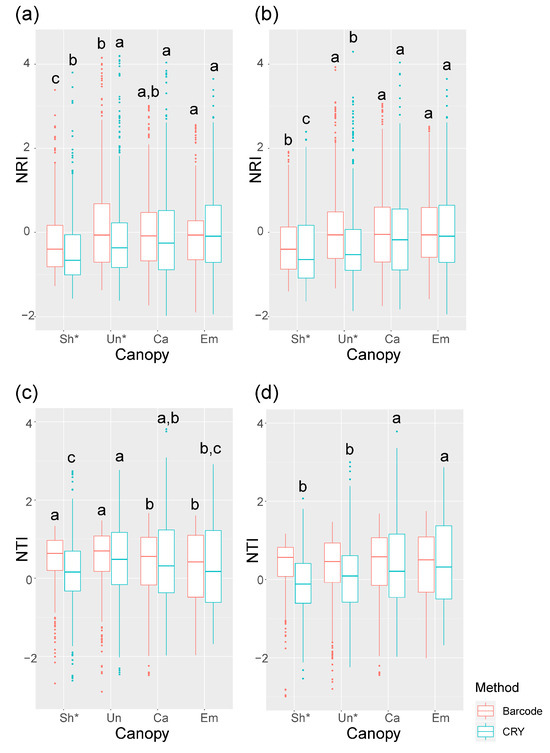
Figure 6.
The NRI and NTI varied by canopy layers. (a) 2010 NRI, (b) 2015 NRI, (c) 2010 NTI, and (d) 2015 NTI. The results of 2005 census cannot be calculated because lack of height data. Different lowercase letters above columns indicate statistical differences (p < 0.05). * symbols indicate significant differences between two methods (p < 0.05).
4. Discussion
4.1. Validity of CRY-Based Phylogeny vs. DNA Barcoding
In relation to our first aim, the phylogenetic tree of CRY is compared to the species tree generated by DNA barcodes. The CRY tree demonstrates consistent topology as compared to the species tree with strong node statistic support, suggesting that the phylogeny is reliable for further study. Plants are surrounded by an altering light environment in which light intensity, spectrum, and day length are changing frequently [29]. In their long evolutionary history, plants evolved a set of light receptors to sense signals and then adjust their physiology, regulating gene expression to match ambient conditions [30]. This means that plant light receptors are very sensitive to environmental changes [31]. Therefore, analyzing the phylogenetic structure of a community utilizing information generating from photoreceptor gene sequences is an effective way to study the relationship between community assembly and heterogeneity of light environment.
In this study, NRI and NTI are utilized to estimate the phylogenetic patterns of a subtropical tree community. Generally, NRI reflects broader, tree-wide phylogenetic patterns, indicating whether entire communities are composed of distantly or closely related species; in contrast, NTI is more sensitive to recent evolutionary relationships at the tips of the phylogeny, revealing clustering or overdispersion among the most closely related species [32,33]. Consequently, the two indices often show opposing trends in this forest, with NRI suggesting phylogenetic overdispersion while NTI indicated clustering of recent lineages [32,33]. Firstly, NRI and NTI values of CRY are compared to results generated by DNA barcodes. The overdispersal results of CRY NRI specify the convergent evolution of light-sensing system of plant in local adaptation [34]. On the contrary, all NTI results manifest a clustering distribution of phylogenetic closely related taxa [35]. Closely related species (e.g., Ficus and Ilex species) may settle under similar circumstances, which can be determined by filtering the environmental conditions such as the amount of light, water, and nutrients [36]. Several previous works indicate that NRI is more effective in detecting nonrandom patterns of community phylogenetic structure compared to NTI [37,38,39]. However, in our study, NTI values manifest more clustering results than NRI in all analyses. Previous works report that NTI showing a higher level of clustering than NRI indicates recent diversifications within the region [40,41]. However, this is contrary to Pei’s work, in which the authors study the same forest dynamics plot using DNA barcodes [7], suggesting that the phylogenetic structures of gene and species levels are quite different.
4.2. Patterns of Community Assembly Across Space and Time
In addition, the CRY NRI and NTI results are not significantly different among habitats, suggesting that the habitats may not have a significant effect on changes in the light environment, thus influencing plant light-sensing systems. Also, the NRI and NTI values in 2015 exhibit broader ranges compared to the results in 2005 and 2010. This may be a consequence of tree recruitment after disturbance. The forest has rarely suffered from anthropogenic disturbance since the establishment of Dinghushan Nature Reserve in 1956 [42]. On the other hand, community assembly is impacted by natural disturbances such as typhoons [43]. The forest gap generated by typhoon disturbance is one of the main factors that drives the recruitment of a forest community that created high-light conditions [9,44]. Also, understory phylogenetic structure is determined by overstory species identity rather than species richness [45]. In the DHS FDP, one of the dominant tree species Schima superba decreased 69.31% during 2010–2015, while the abundance of light-demanding species such as Aidia canthioides and Ormosia glaberrima increased dramatically.
There are many reported works about the phylogenetic pattern of temperate, subtropical, and tropical forests during succession, generating inconsistent conclusions that phylogenetic patterns are tend to be clustering [37,46,47] or overdispersed [36,48,49,50] as succession proceeds. In this study, both NRI and NTI values increase over time, suggesting that the phylogenetic structure of a tree community becomes more overdispersed as succession proceeds. These results are in agreement with the NTI results of different successional stages; the phylogenetic structure of late-successional (LS) forests features more clustering as compared to early-successional (ES) forests. It indicates that the community is instead composed of distantly related species that partition resources in different ways. Distantly related species are more likely to have different functional traits (e.g., different light demands). This promotes a more complete and efficient use of resources, potentially increasing productivity and stability. But for NRI results, the older forests are more phylogenetically overdispersed. Previous studies suggest that the overdispersion is caused by disturbance and forest gaps [51,52]; gaps generate a microenvironment similar to the primary stage of forest succession and the forest understory is not subjected to limitations in light resources. Also, forest gaps are more likely to harbor phylogenetically distantly related species rather than enclosed forests [52].
4.3. Patterns of Community Assembly in Vertical Forest Structure
The heterogeneity of light environments along forest vertical structures influences the phylogenetic pattern [46]. Overstory and understory species are more specialized to high- and low-light availability gradients, respectively [53]. With canopy closure, understory seedlings of light-demanding speciesare gradually replaced by shade-tolerant species [54]. In this study, we found that the NRI tend to cluster more in upper-canopy layers, which is consistent with a previous study on subtropical forests [52]. On the other hand, the prevalent positive NTI values of canopy layers suggest that phylogenetically related species tend to coexist and adapt to similar light conditions.
Generally, our NRI and NTI results are quite near the average values of East Asia summarized by Feng et al. [55]; the community assembly of south subtropical forest communities is mainly driven by stochastic processes.
4.4. Implications and Limitations
The study demonstrates that light heterogeneity is a key driver shaping the vertical structure of forests. It provides a scientific basis for managing forests by mimicking natural light conditions to maintain biodiversity and support regeneration. Also, the findings highlight the potential of using functional genes for monitoring forest health and building resilience to environmental change.
However, this study has some limitations. Firstly, all NRI and NTI results generated in this study are not significantly different as compared to the null model, suggesting a randomness of phylogenetical structure. This study was conducted on a narrow geographical range and involved only limited number of species. Also, although there are multiple instances of CRY occurring in plants [56], only one CRY1 homolog of each species was used in the analyses to simplify the phylogeny. Furthermore, light is not the only essential environmental factor shaping the community, as community assembly is the consequence of complicated abiotic and biotic processes [57,58]. The influence of other environmental factors (functional diversity of other genes) has yet to be well studied.
5. Conclusions
This study demonstrates that cryptochrome (CRY) gene sequences can be effectively used to infer phylogenetic structure in a subtropical forest community. Compared to conventional DNA barcoding, CRY-based phylogenies reveal distinct and consistent patterns across habitats—suggesting convergent evolution in the plant light-sensing system during local adaptation. Our results also highlight that CRY-based phylogeny is more closely associated with vertical forest structure than horizontal patterns, supporting the role of light as a key driver of community stratification.
Supplementary Materials
The following supporting information can be downloaded at: https://www.mdpi.com/article/10.3390/f16111673/s1, Table S1: List of the CRY and DNA barcode sequences used in the study.
Author Contributions
Q.M. designed methodology, finished the field survey and lab work, performed data analysis and wrote the manuscript. Z.C. performed data analysis and wrote the manuscript. Y.T., S.L. and Z.Z. assisted field survey and lab work. Z.W. performed data analysis and reviewed the paper. H.C. assist the field survey. J.L. conceived the ideas and reviewed the manuscript. All authors have read and agreed to the published version of the manuscript.
Funding
The completion of this work was supported by Collaborative Innovation Center for Natural Resources Planning and Marine Technology of Guangzhou (No. 2023B04J0301, No. 2023B04J0326), Guangzhou Urban Planning & Design Survey Research Institute Co., Ltd., Research Project (2023 Research (Institute) 94) and National Natural Science Foundation of China (Grant No. 31600341). Thanks for the support of Academic Specialty Group for Urban Sensing in Chinese Society of Urban Planning.
Data Availability Statement
CRY and DNA barcode sequences used in this paper were deposited at Genbank (available at https://www.ncbi.nlm.nih.gov/nucleotide/, accessed on 5 May 2019). Accession numbers were listed in Supplementary Table S1.
Acknowledgments
We would like to thank Jie Yang (XTBG, CAS) for her help with data analysis, and graduate students of SCBG, CAS for their help with sample collection.
Conflicts of Interest
Authors Qiming Mei, Zhibin Chen, Yanshan Tan, Shuxiong Lai and Zefang Zhang were employed by the company Guangzhou Urban Planning & Design Survey Research Institute Co., Ltd. The remaining authors declare that the research was conducted in the absence of any commercial or financial relationships that could be construed as a potential conflict of interest.
References
- Chase, J.M.; Leibold, M.A. Ecological Niches: Linking Classical and Contemporary Approaches; University of Chicago Press: Chicago, IL, USA, 2003. [Google Scholar]
- Hubbell, S.P. The Unified Neutral Theory of Biodiversity and Biogeography; Princeton University Press: Princeton, NJ, USA, 2001. [Google Scholar]
- Webb, C.O.; Losos, J.B.; Agrawal, A.A. Integrating phylogenies into community ecology. Ecology 2006, 87, S1–S2. [Google Scholar] [CrossRef]
- Cavender-Bares, J.; Ackerly, D.D.; Baum, D.A.; Bazzaz, F.A. Phylogenetic overdispersion in Floridian oak communities. Am. Nat. 2004, 163, 823–843. [Google Scholar] [CrossRef]
- Kress, W.J.; Erickson, D.L.; Jones, F.A.; Swenson, N.G.; Perez, R.; Sanjur, O.; Bermingham, E. Plant DNA barcodes and a community phylogeny of a tropical forest dynamics plot in Panama. Proc. Natl. Acad. Sci. USA 2009, 106, 18621–18626. [Google Scholar] [CrossRef]
- Heckenhauer, J.; Abu Salim, K.; Chase, M.W.; Dexter, K.G.; Pennington, R.T.; Tan, S.; Kaye, M.E.; Samuel, R. Plant DNA barcodes and assessment of phylogenetic community structure of a tropical mixed dipterocarp forest in Brunei Darussalam (Borneo). PLoS ONE 2017, 12, e0185861. [Google Scholar] [CrossRef]
- Pei, N.C.; Lian, J.Y.; Erickson, D.L.; Swenson, N.G.; Kress, W.J.; Ye, W.H.; Ge, X.J. Exploring tree-habitat associations in a Chinese subtropical forest plot using a molecular phylogeny generated from DNA barcode loci. PLoS ONE 2011, 6, e21273. [Google Scholar] [CrossRef] [PubMed]
- Shapcott, A.; Forster, P.I.; Guymer, G.P.; McDonald, W.J.F.; Faith, D.P.; Erickson, D.; Kress, W.J. Mapping biodiversity and setting conservation priorities for SE Queensland’s rainforests using DNA barcoding. PLoS ONE 2015, 10, e0122164. [Google Scholar] [CrossRef]
- Comita, L.S.; Uriarte, M.; Forero-Montana, J.; Kress, W.J.; Swenson, N.G.; Thompson, J.; Umaña, M.N.; Zimmerman, J.K. Changes in phylogenetic community structure of the seedling layer following hurricane disturbance in a human-impacted tropical forest. Forests 2018, 9, 556. [Google Scholar] [CrossRef]
- Sercu, B.K.; Baeten, L.; van Coillie, F.; Martel, A.; Lens, L.; Verheyen, K.; Bonte, D. How tree species identity and diversity affect light transmittance to the understory in mature temperate forests. Ecol. Evol. 2017, 7, 10861–10870. [Google Scholar] [CrossRef]
- Tang, H.; Dubayah, R. Light-driven growth in Amazon evergreen forests explained by seasonal variations of vertical canopy structure. Proc. Natl. Acad. Sci. USA 2017, 114, 2640–2644. [Google Scholar] [CrossRef]
- Mei, Q.; Zheng, Y.; Feng, J.; Wang, Z.; Cao, H.; Lian, J. Transcriptome profiling revealed light-mediated gene expression patterns of plants in forest vertical structures. Biology 2025, 14, 434. [Google Scholar] [CrossRef]
- Ruban, A.V. Plants in light. Commun. Integr. Biol. 2009, 2, 50–55. [Google Scholar] [CrossRef] [PubMed]
- McClung, C.R. Plant circadian rhythms. Plant Cell 2006, 18, 792–803. [Google Scholar] [CrossRef] [PubMed]
- Fortunato, A.E.; Annunziata, R.; Jaubert, M.; Bouly, J.P.; Falciatore, A. Dealing with light: The widespread and multitasking cryptochrome/photolyase family in photosynthetic organisms. J. Plant Physiol. 2015, 172, 42–54. [Google Scholar] [CrossRef] [PubMed]
- Somers, D.E.; Devlin, P.F.; Kay, S.A. Phytochromes and cryptochromes in the entrainment of the Arabidopsis circadian clock. Science 1998, 282, 1488–1490. [Google Scholar] [CrossRef]
- Thery, M. Forest light and its influence on habitat selection. Plant Ecol. 2001, 153, 251–261. [Google Scholar] [CrossRef]
- Fankhauser, C.; Batschauer, A. Shadow on the Plant: A Strategy to Exit. Cell 2016, 164, 15–17. [Google Scholar] [CrossRef]
- Edgar, R.C. MUSCLE: Multiple sequence alignment with high accuracy and high throughput. Nucleic Acids Res. 2004, 32, 1792–1797. [Google Scholar] [CrossRef]
- Akaike, H. A new look at the statistical-model identification. IEEE Trans. Autom. Control 1981, 19, 716–723. [Google Scholar] [CrossRef]
- Darriba, D.; Taboada, G.L.; Doallo, R.; Posada, D. ProtTest 3: Fast selection of best-fit models of protein evolution. Bioinformatics 2011, 27, 1164–1165. [Google Scholar] [CrossRef]
- Drummond, A.J.; Rambaut, A. BEAST: Bayesian evolutionary analysis by sampling trees. BMC Evol. Biol. 2007, 7, 214. [Google Scholar] [CrossRef]
- Wikstrom, N.; Savolainen, V.; Chase, M.W. Evolution of the angiosperms: Calibrating the family tree. Proc. Biol. Sci. 2001, 268, 2211–2220. [Google Scholar] [CrossRef] [PubMed]
- Muellner-Riehl, A.N.; Weeks, A.; Clayton, J.W.; Buerki, S.; Nauheimer, L.; Chiang, Y.C.; Cody, S.; Pell, S.K. Molecular phylogenetics and molecular clock dating of Sapindales based on plastid rbcL, atpB and trnL-trnF DNA sequences. Taxon 2016, 65, 1019–1036. [Google Scholar] [CrossRef]
- Chen, J.; Zhang, H.; Liu, W.; Lian, J.Y.; Ye, W.H.; Shen, W.J. Spatial distribution patterns of ammonia-oxidizing archaea abundance in subtropical forests at early and late successional stages. Sci. Rep. 2015, 5, 16587. [Google Scholar] [CrossRef]
- Lian, J.Y.; Chen, C.; Huang, Z.L.; Cao, H.L.; Ye, W.H. Community composition and stand age in a subtropical forest, Southern China. Biodivers. Sci. 2015, 23, 174–182. [Google Scholar] [CrossRef]
- Webb, C.O.; Ackerly, D.D.; Kembel, S.W. Phylocom: Software for the analysis of phylogenetic community structure and trait evolution. Bioinformatics 2008, 24, 2098–2100. [Google Scholar] [CrossRef]
- Kembel, S.W.; Cowan, P.D.; Helmus, M.R.; Cornwell, W.K.; Morlon, H.; Ackerly, D.D.; Blomberg, S.P.; Webb, C.O. Picante: R tools for integrating phylogenies and ecology. Bioinformatics 2010, 26, 1463–1464. [Google Scholar] [CrossRef]
- Trewavas, A. The foundations of plant intelligence. Interface Focus. 2017, 7, 20160098. [Google Scholar] [CrossRef]
- Zhang, T.; Folta, K.M. Green light signaling and adaptive response. Plant Signal. Behav. 2012, 7, 75–78. [Google Scholar] [CrossRef]
- Galvao, V.C.; Fankhauser, C. Sensing the light environment in plants: Photoreceptors and early signaling steps. Curr. Opin. Neurobiol. 2015, 34, 46–53. [Google Scholar] [CrossRef] [PubMed]
- Webb, C.O.; Ackerly, D.D.; McPeek, M.A.; Donoghue, M.J. Phylogenies and community ecology. Annu. Rev. Ecol. Evol. S 2002, 33, 475–505. [Google Scholar] [CrossRef]
- Kraft, N.J.; Cornwell, W.K.; Webb, C.O.; Ackerly, D.D. Trait evolution, community assembly, and the phylogenetic structure of ecological communities. Am. Nat. 2007, 170, 271–283. [Google Scholar] [CrossRef]
- Cavender-Bares, J.; Kozak, K.H.; Fine, P.V.A.; Kembel, S.W. The merging of community ecology and phylogenetic biology. Ecol. Lett. 2009, 12, 693–715. [Google Scholar] [CrossRef]
- Singer, D.A.; Kosakyan, A.; Seppey, C.V.W.; Pillonel, A.; Fernández, L.D.; Fontaneto, D.; Mitchell, E.A.D.; Lara, E. Environmental filtering and phylogenetic clustering correlate with the distribution patterns of cryptic protist species. Ecology 2018, 99, 904–914. [Google Scholar] [CrossRef]
- Liu, B.; Chen, H.Y.H.; Yang, J. Understory community assembly following wildfire in Boreal forests: Shift from stochasticity to competitive exclusion and environmental filtering. Front. Plant Sci. 2018, 9, 1854. [Google Scholar] [CrossRef]
- Letcher, S.G. Phylogenetic structure of angiosperm communities during tropical forest succession. Proc. Biol. Sci. 2010, 277, 97–104. [Google Scholar] [CrossRef] [PubMed]
- Letcher, S.G.; Chazdon, R.L.; Andrade, A.C.S.; Bongers, F.; van Breugel, M.; Finegan, B.; Laurance, S.G.; Mesquita, R.C.G.; Martínez-Ramos, M.; Williamson, B. Phylogenetic community structure during succession: Evidence from three neotropical forest sites. Perspect. Plant Ecol. 2012, 14, 79–87. [Google Scholar] [CrossRef]
- Muscarella, R.; Uriarte, M.; Erickson, D.L.; Swenson, N.G.; Zimmerman, J.K.; Kress, W.J. A well-resolved phylogeny of the trees of Puerto Rico based on DNA barcode sequence data. PLoS ONE 2014, 9, e112843. [Google Scholar] [CrossRef] [PubMed]
- Brunbjerg, A.K.; Cavender-Bares, J.; Eiserhardt, W.L. Multi-scale phylogenetic structure in coastal dune plant communities across the globe. J. Plant Ecol. 2014, 7, 101–114. [Google Scholar] [CrossRef]
- Qian, H.; Jiang, L. Phylogenetic community ecology: Integrating community ecology and evolutionary biology. J. Plant Ecol. 2014, 7, 97–100. [Google Scholar] [CrossRef]
- Ouyang, X.J.; Ye, W.H.; Hockings, M.; Luk, C.L.; Huang, Z.L. Developing phase of China’s system of nature reserves in perspective. For. Sci. Pract. 2013, 15, 340–348. [Google Scholar] [CrossRef]
- Sui, D.D.; Wang, Y.; Lian, J.Y.; Zhang, J. Gap distribution patterns in the south subtropical evergreen broad-leaved forest of Dinghushan. Biodivers. Sci. 2017, 25, 382–392. [Google Scholar] [CrossRef]
- Saito, S. Effects of a severe typhoon on forest dynamics in a warm-temperate evergreen broad-leaved forest in Southwestern Japan. J. For. Res.-JPN 2002, 7, 137–143. [Google Scholar] [CrossRef]
- Coppi, A.; Lazzaro, L.; Ampoorter, E.; Baeten, L.; Verheyen, K.; Selvi, F. Understorey phylogenetic diversity in thermophilous deciduous forests: Overstorey species identity can matter more than species richness. For. Ecosyst. 2019, 6, 37. [Google Scholar] [CrossRef]
- Whitfeld, T.J.S.; Kress, W.J.; Erickson, D.L.; Weiblen, G.D. Change in community phylogenetic structure during tropical forest succession: Evidence from New Guinea. Ecography 2012, 35, 821–830. [Google Scholar] [CrossRef]
- Chai, Y.; Yue, M.; Liu, X.; Guo, Y.; Wang, M.; Xu, J.; Zhang, C.; Chen, Y.; Zhang, L.; Zhang, R. Patterns of taxonomic, phylogenetic diversity during a long-term succession of forest on the Loess Plateau, China: Insights into assembly process. Sci. Rep. 2016, 6, 27087. [Google Scholar] [CrossRef]
- Ding, Y.; Zang, R.G.; Letcher, S.G.; Liu, S.R.; He, F.L. Disturbance regime changes the trait distribution, phylogenetic structure and community assembly of tropical rain forests. Oikos 2012, 121, 1263–1270. [Google Scholar] [CrossRef]
- Mo, X.X.; Shi, L.L.; Zhang, Y.J.; Zhu, H.; Slik, J.W.F. Change in phylogenetic community structure during succession of traditionally managed tropical rainforest in southwest China. PLoS ONE 2013, 8, e71464. [Google Scholar] [CrossRef] [PubMed]
- Purschke, O.; Schmid, B.C.; Sykes, M.T.; Poschlod, P.; Michalski, S.G.; Durka, W.; Kühn, I.; Winter, M.; Prentice, H.C. Contrasting changes in taxonomic, phylogenetic and functional diversity during a long-term succession: Insights into assembly processes. J. Ecol. 2013, 101, 857–866. [Google Scholar] [CrossRef]
- Prescott, C.E. The influence of the forest canopy on nutrient cycling. Tree Physiol. 2002, 22, 1193–1200. [Google Scholar] [CrossRef]
- Jin, Y.; Qian, H.; Yu, M. Phylogenetic structure of tree species across different life stages from seedlings to canopy trees in a subtropical evergreen broad-leaved forest. PLoS ONE 2015, 10, e0131162. [Google Scholar] [CrossRef]
- Dupuy, J.M.; Chazdon, R.L. Effects of vegetation cover on seedling and sapling dynamics in secondary tropical wet forests in Costa Rica. J. Trop. Ecol. 2006, 22, 65–76. [Google Scholar] [CrossRef]
- Wagner, S.; Fischer, H.; Huth, F. Canopy effects on vegetation caused by harvesting and regeneration treatments. Eur. J. For. Res. 2011, 130, 17–40. [Google Scholar] [CrossRef]
- Feng, G.; Mi, X.; Eiserhardt, W.L.G.; Jin, G.; Sang, W.; Lu, Z.; Wang, X.; Li, X.; Li, B.; Sun, I. Assembly of forest communities across East Asia--insights from phylogenetic community structure and species pool scaling. Sci. Rep. 2015, 5, 9337. [Google Scholar] [CrossRef] [PubMed]
- Mei, Q.; Dvornyk, V. Evolutionary history of the photolyase/cryptochrome superfamily in eukaryotes. PLoS ONE 2015, 10, e0135940. [Google Scholar] [CrossRef]
- Kraft, N.J.B.; Adler, P.B.; Godoy, O. Community assembly, coexistence and the environmental filtering metaphor. Funct. Ecol. 2015, 29, 592–599. [Google Scholar] [CrossRef]
- Meng, W.; Zhang, H.; Sun, L.; Xu, J.; Qiao, Y.; Li, H. Phylogenetic structure shifts across life-history stages in response to microtopography and competition in subtropical forests. Plants 2025, 14, 2098. [Google Scholar] [CrossRef]
Disclaimer/Publisher’s Note: The statements, opinions and data contained in all publications are solely those of the individual author(s) and contributor(s) and not of MDPI and/or the editor(s). MDPI and/or the editor(s) disclaim responsibility for any injury to people or property resulting from any ideas, methods, instructions or products referred to in the content. |
© 2025 by the authors. Licensee MDPI, Basel, Switzerland. This article is an open access article distributed under the terms and conditions of the Creative Commons Attribution (CC BY) license (https://creativecommons.org/licenses/by/4.0/).