Article

Canopy-Wind-Induced Pressure Fluctuations Drive Soil CO2 Transport in Forest Ecosystems

1
College of Mathematics and Computer Science, Zhejiang A&F University, Hangzhou 311300, China
2
Zhejiang Provincial Key Laboratory of Forestry Intelligent Monitoring and Information Technology Research, Zhejiang A&F University, Hangzhou 311300, China
3
State Forestry Administration Key Laboratory of Forestry Sensing Technology and Intelligent Equipment, Zhejiang A&F University, Hangzhou 311300, China
4
College of Chemistry and Materials Engineering, Zhejiang A&F University, Hangzhou 311300, China
5
College of Forestry and Biotechnology, Zhejiang A&F University, Hangzhou 311300, China
6
School of Art and Design, Zhejiang Tongji Vocational College of Science and Technology, Hangzhou 311231, China
*
Authors to whom correspondence should be addressed.
Forests 2025, 16(11), 1637; https://doi.org/10.3390/f16111637 (registering DOI)
Submission received: 1 October 2025 / Revised: 21 October 2025 / Accepted: 25 October 2025 / Published: 26 October 2025
(This article belongs to the Section Forest Meteorology and Climate Change)

Abstract

Although accurate quantification of forest soil CO2 emissions is critical for improving global carbon cycle models, traditional chamber and gradient methods often underestimate fluxes under windy conditions. Based on long-term field observations in a subtropical maple forest, we quantified the interaction between canopy-level winds and soil pore air pressure fluctuations in regulating vertical CO2 profiles. The results demonstrate that canopy winds, rather than subcanopy airflow, dominate deep soil CO2 dynamics, with stronger explanatory power for concentration variability. The observed “wind-pumping effect” operates through soil pressure fluctuations rather than direct wind speed, thereby enhancing advective CO2 transport. Soil pore air pressure accounted for 33%–48% of CO2 variation, far exceeding the influence of near-surface winds. These findings highlight that, even in dense forests with negligible understory airflow, canopy turbulence significantly alters soil–atmosphere carbon exchange. We conclude that integrating soil pore air pressure into flux calculation models is essential for reducing underestimation bias and improving the accuracy of forest carbon cycle assessments.

1. Introduction

In the context of global climate warming, accurate measurement of forest carbon flux is crucial for formulating effective climate change response policies. Among these, soil CO2 emissions of 101 Pg C per year (101 Pg Cyr−1) [1,2] are the second-largest carbon flux in global terrestrial ecosystems. According to research statistics, forest soils release 40%–60% of the global soil CO2 emissions annually (approximately 40–60 Pg C yr−1), which is 4–6 times the amount of CO2 released from global fossil fuel combustion [3,4]. Therefore, accurately calculating the CO2 emissions from forest soils is a key focus of current research. However, due to the unpredictable nature of field measurement environments, precise measurement remains a significant challenge.
Currently, the measurement of CO2 emissions from forest soils is typically carried out using the chamber or gradient methods. The chamber method is characterized by the use of a closed chamber placed over the soil during the measurement process, and CO2 emissions are calculated based on changes in the CO2 concentration within the chamber. In contrast, the gradient method involves installing measurement sensors at different depths along the vertical profile of the soil, using the molecular diffusion principle of CO2 concentration to calculate emissions. However, studies have shown that both the chamber and gradient methods have measurement biases in wind turbulence environments, with most cases underestimating CO2 emissions. This is because wind turbulence affects the transport of soil gases [5,6,7,8], leading to an increase in emissions by 30%–60%. The enhancement of gas emissions due to wind turbulence is caused by the interaction between ground wind in the boundary layer and surface vegetation or topography, which generates wind-induced effects that facilitate the exchange of soil gases and the atmosphere [6,7,9,10,11]. Maier et al. [12] quantified the influence of environmental drivers (precipitation, soil moisture, soil temperature, and wind) on soil CO2 flux using a generalized linear model (GLM), finding a negative correlation between the measurements and wind speed. Some researchers have extended the deployment time of closed chambers and found that wind turbulence causes an underestimation of soil CO2 efflux in northern coniferous forests by 14% [13]. Jiang et al. [14] also found a close relationship between closed-chamber measurements and wind turbulence through field monitoring of soil pore air pressure and, in laboratory experiments using a self-developed chamber calibration device, they observed underestimation in closed-chamber measurements. Despite these related studies, the process and specific reasons for measurement biases caused by wind turbulence during field monitoring remain poorly understood. In field measurements of soil respiration, wind turbulence is present most of the time, and its disturbance is unavoidable [15,16,17]. Therefore, investigating the mechanism by which wind turbulence affects CO2 variation within the soil profile is an urgent scientific issue. To more accurately measure CO2 emissions, it is essential to conduct in-depth research into how wind turbulence alters the driving mechanisms of soil gas transport.
In summary, we conducted long-term monitoring and observation at a forest site to investigate how wind above the canopy affects the CO2 gas variation in the vertical soil profile below the canopy in a windy environment. This is expected to help in clarifying the response mechanism of soil CO2 to near-surface wind. Additionally, based on Darcy’s law—which relates the gas flow rate to the pressure gradient (v∝∂P/∂x)—we explore the relationships between near-surface wind, soil surface air pressure, soil pore air pressure, and soil CO2 concentration to further elucidate how near-surface wind turbulence influences the gas distribution in the soil vertical profile.

2. Materials and Methods

2.1. Study Site

The study was conducted at Zhejiang A&F University, located in Lin’an District, Hangzhou, Zhejiang Province (30°15′ N–30°16′ N latitude, 119°43′E–119°44′E longitude), from December 2023 to March 2025. This region exhibits a typical subtropical monsoon climate, characterized by distinct seasons, abundant heat, and plentiful rainfall. According to long-term observational data from the Hangzhou Meteorological Station (1991–2020), the region’s annual average temperature is 17.5 °C. The coldest month (January) has an average temperature of 4.5 °C, while the hottest month (July) averages 29.1 °C. Annual average precipitation is approximately 1500 mm, though the distribution is unevenly seasonal, concentrated primarily during the rainy season from May to August (the plum rain and typhoon seasons). Precipitation during this period accounts for over 50% of the annual total. Furthermore, wind conditions in the region are influenced by monsoon circulation, with prevailing wind directions shifting seasonally. Spring and summer exhibit relatively higher wind speeds, providing favorable conditions for studying canopy–atmosphere interactions. Field data collection and related experiments were conducted in a 22,000 m2 maple garden at an altitude of 60–70 m. The canopy density of the forest stands at 0.6–0.7. The garden mainly features trees such as Acer cinnamomifolium Hayata, Acer yangjuechi Fang and Chiu, and Acer palmatum Thunb, along with scattered individuals of Acer buergerianum Miq and Koelreuteria paniculata Laxm. The average tree height is 8 m, and the ground cover is primarily dominated by Festuca ovina Linn. The soil is a clayey loam, with the upper 0–8 cm consisting of a humus layer and the 10–30 cm layer being a sedimentary layer.

2.2. Experimental Setup

For this study, a 15-m-tall meteorological data monitoring tower was installed at the center of the forest in December 2023. The tower is equipped with an ultrasonic three-dimensional anemometer (FC-307, Beijing Feichao Anemometer Co., Beijing, China, accuracy of ±0.1 m/s), which continuously monitors wind speeds above the forest canopy in real-time (as shown in Figure 1) with a sampling frequency of 1 Hz. Simultaneously, we installed an identical ultrasonic three-dimensional anemometer beneath the canopy at a height of 1 m above ground level, approximately 8 m from the monitoring tower. This unit operates at a sampling frequency of 1 Hz to monitor wind speeds beneath the canopy (i.e., 1 m above the soil surface). Three CO2 concentration sensors (Vaisala Carbocap CO2 Probe GMP 343, Vaisala, Inc., Helsinki, Finland) were installed in the soil layer directly beneath the three-dimensional anemometer at a height of 1 m. These sensors were positioned along the same vertical profile at depths of 0 cm, 10 cm, and 20 cm for the purpose of long-term real-time monitoring of CO2 concentration variations within the soil profile. Sampling occurred at a frequency of 1 Hz. It should be specifically noted that data collection commenced two months after the CO2 concentration sensors were buried in the soil in order to prevent experimental results from being compromised by soil disturbance during installation. At the same time, three differential pressure sensors (C268, Setra Systems, Inc., Massachusetts, USA, accuracy of ±0.25%) were installed 10 cm horizontally from the CO2 sensors (on the side near the monitoring tower). The low-pressure port (L) of the differential pressure sensors was connected to the pressure calibration system. This pressure calibration system was designed by Mohr et al. [18] to prevent wind turbulence disturbances from affecting the pressure difference measurements, ensuring accurate and stable monitoring of air pressure fluctuations. The high-pressure terminals (H) of the three differential pressure sensors are each connected to a hollow steel tube measuring 6 mm in diameter and 50 mm in length. The opposite end of each tube is welded to a hollow spherical body (radius, 0.5 cm) featuring multiple small holes (1 mm diameter), designed to prevent soil from clogging the tubes. Spherical joints were positioned at soil depths of 0 cm, 5 cm, and 15 cm to monitor variations in soil surface and soil pore gas pressure, with a sampling frequency of 1 Hz. All data-logging sensors were uniformly powered and connected to the data logger (CR1000X, Campbell Scientific, Inc., Utah, USA). Data collection commenced in February 2024 and concluded in February 2025, with sensor data extracted from the logger monthly.

2.3. Data Analysis

In this study, data analysis was conducted using R software (R Core Team, 2021), while all plotting was performed using Origin (Pro) (Version 2024b). An ANOVA was performed to compare the wind speed data at 1 m and 15 m. We employed linear regression to examine the relationship between Y and a set of predictors. Parameters were estimated using Ordinary Least Squares (OLS) via the appropriate package. Model fit was assessed with the adjusted R2, and overall significance was evaluated using the F-test. The significance of the predictors was determined via t-tests, with a threshold of p < 0.05. Residual diagnostics, including normality tested using the Shapiro–Wilk test and homoscedasticity assessed using the Breusch–Pagan test, confirmed the validity of model assumptions.

3. Results

3.1. Changes in Wind Speed, Air Pressure, and Soil CO2 Concentration

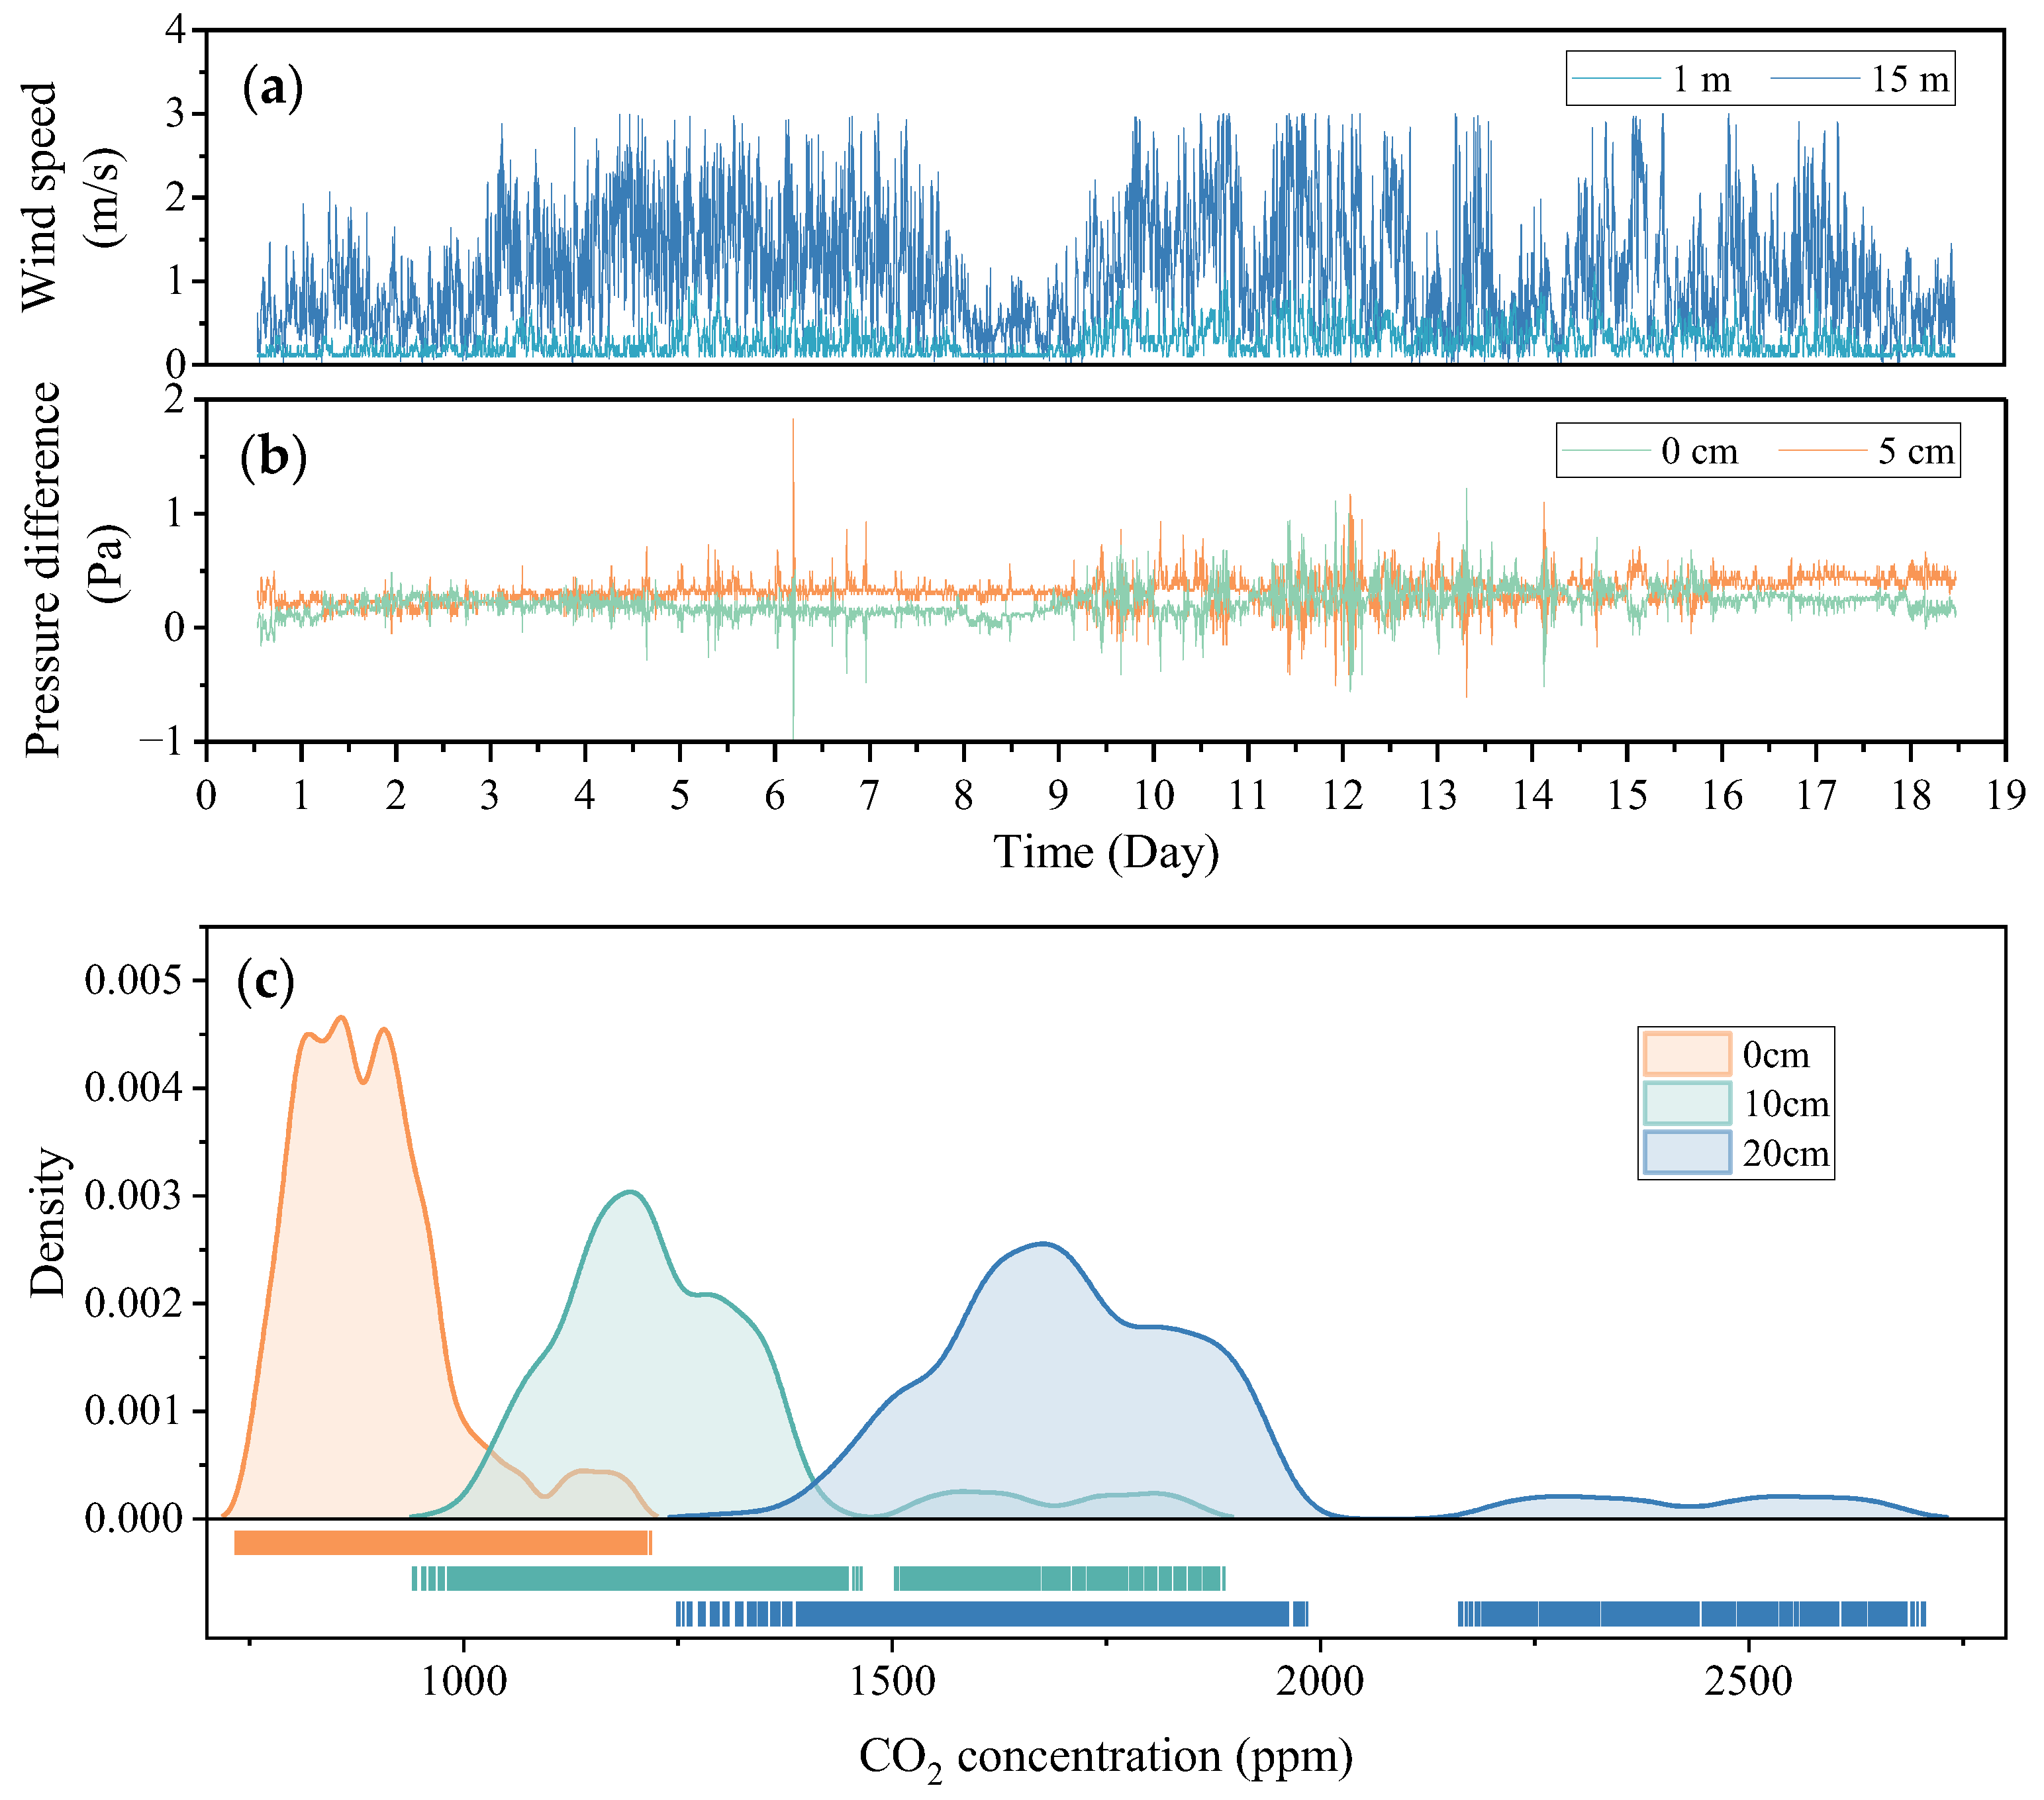
To better and more clearly explore the experimental results, a period of time in which the wind speed at 15 m was consistently greater than 1 m/s for more than 7 days without precipitation was selected. The data from 18 days are shown in Figure 2. In Figure 2a, it can be observed that the wind speed above the canopy is higher than that below the canopy, with both following similar trends. The specific details are analyzed in Section 3.2. Additionally, when wind speeds are higher, air pressure fluctuations are more pronounced compared to when the wind speed is lower (Figure 2). It is worth noting that, due to the differential pressure ports being buried in the field soil for an extended period, there were data anomalies in the soil pore pressure differential at 15 cm. Therefore, only the differential pressure data at 0 cm and 5 cm were used in the analysis.
In Figure 2b, we can see that the differential pressure at 5 cm is generally greater than at 0 cm, and most of the pressure differences are positive, indicating that the pressure at the soil surface is greater than the soil pore pressure. In Figure 2c, we can clearly observe the CO2 concentration gradient in the vertical soil profile at the soil surface. The average CO2 concentrations at the three soil layers were 891 ppm at 0 cm, 1255 ppm at 10 cm, and 1763 ppm at 20 cm.

3.2. Response Relationship Between Wind Speeds Above and Below the Canopy

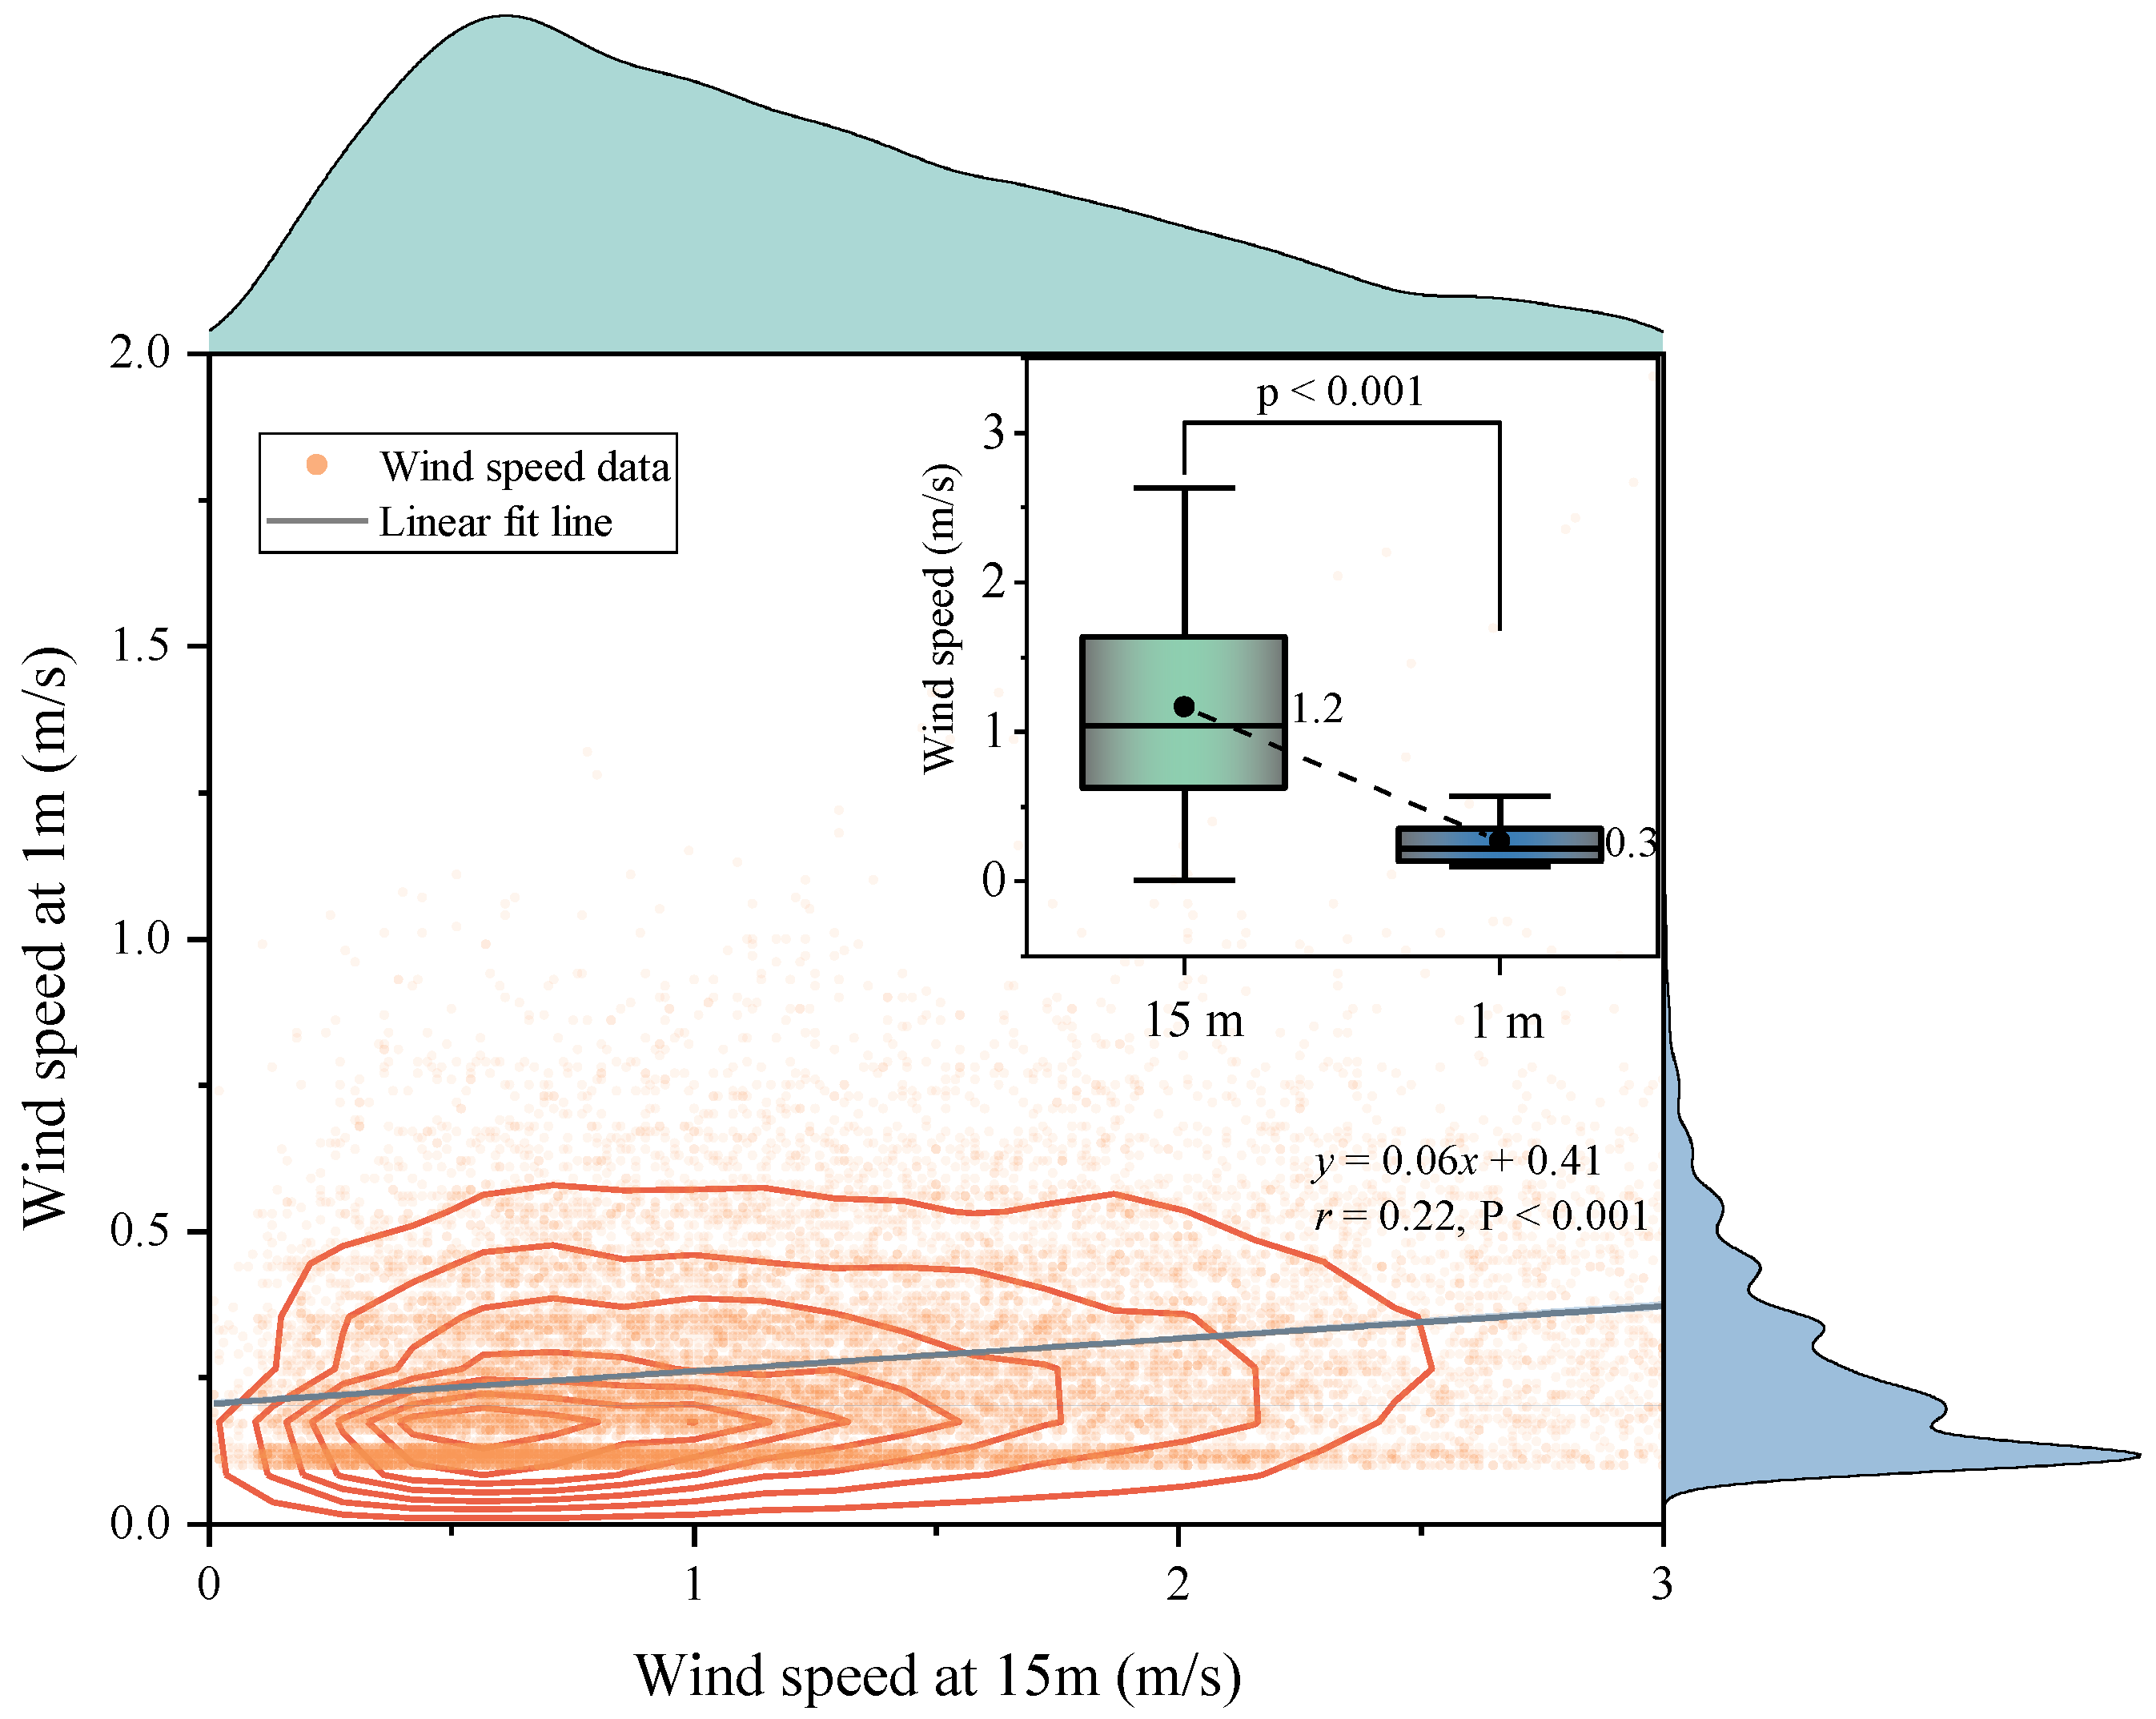
In this study, we observed a significant difference in wind speed between above the canopy (15 m) and below the canopy (1 m) (p < 0.001) in Figure 3. The average wind speed above the canopy was 1.2 m/s, while the average wind speed below the canopy was 0.3 m/s. Using the wind profile formula, and considering that the wind shear index of the forest is related to tree height and tree density, which typically falls in the range of 0.25–0.4, we calculated the wind speed at 1 m based on the wind speed at 15 m (1.2 m/s) to be between 0.42 and 0.61 m/s. The observed value was slightly lower than the theoretical estimate. Additionally, we performed a correlation analysis between the wind speeds at 1 m and 15 m, and found that the wind speed at 1 m explained only 5% of the variation in wind speed at 15 m (R2 = 0.05, p < 0.001).

3.3. Response of Soil CO2 Concentration in the Vertical Soil Profile to Wind Speed

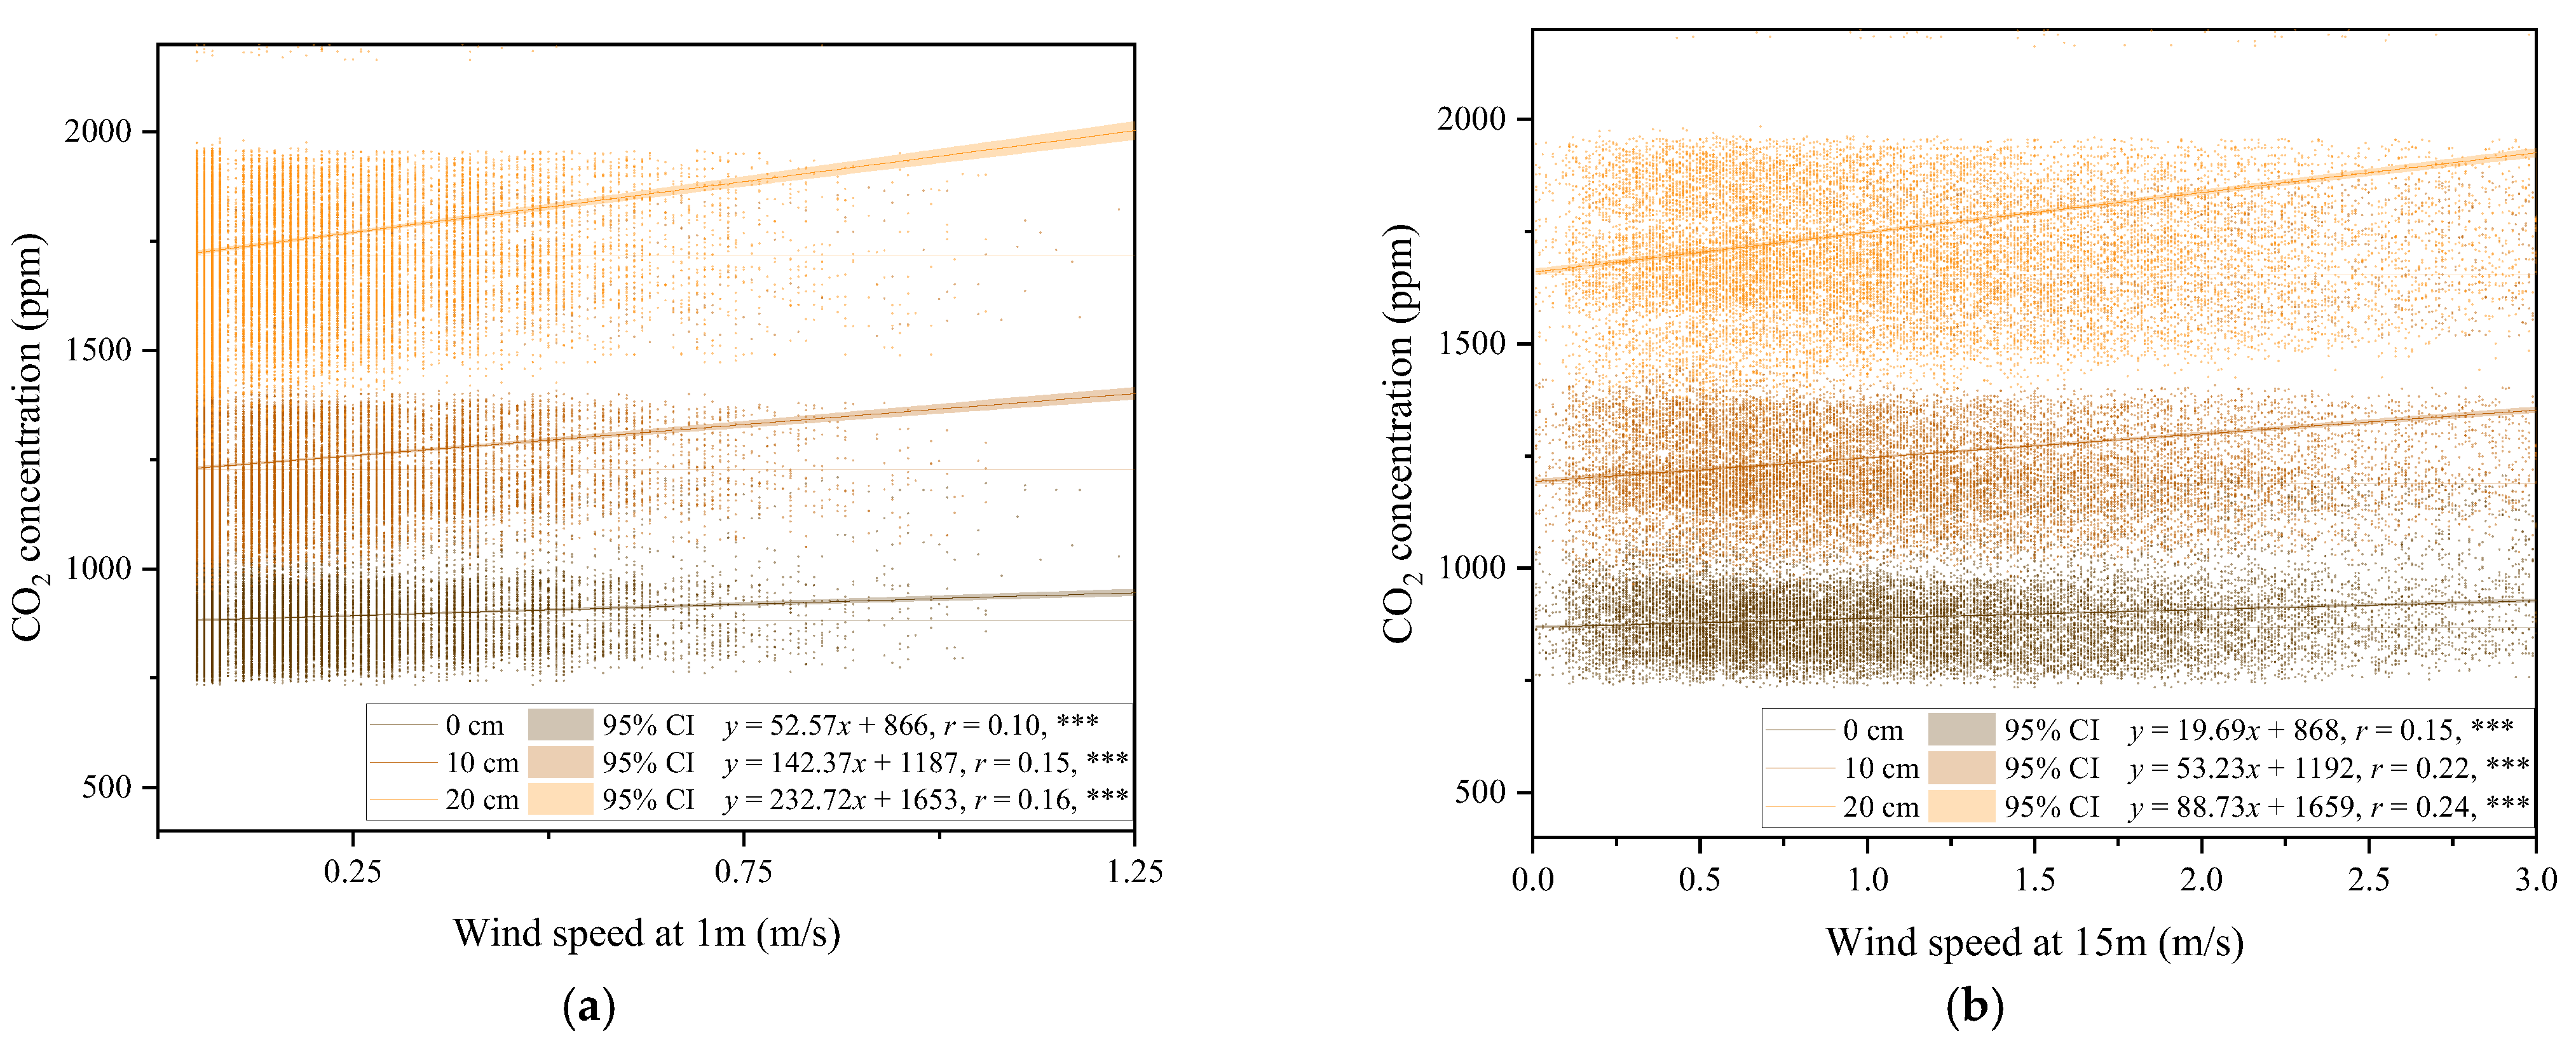
In Figure 4, we can observe that as the near-surface wind speed increases, the CO2 concentration in the vertical soil profile rises, showing a significant positive correlation (with p-values less than 0.001). It is noteworthy that the wind speed above the canopy (15 m) has a smaller effect on soil CO2 concentration changes compared to the wind speed below the canopy (1 m), as the fitted slope for wind speed at 15 m is lower than that at 1 m. However, the response of soil CO2 concentration to the wind speed at 15 m is more explanatory (the explanation for wind speed at 15 m ranges from 2.3% to 5.8%, while at 1 m, it ranges from 1% to 2.6%). Additionally, whether above or below the canopy, we observe that as soil depth increases, the fitted slope between wind speed and CO2 concentration becomes steeper, and the explanatory power of wind speed on CO2 concentration change also increases.

3.4. Relationship Between Wind Speed and Pressure Fluctuations

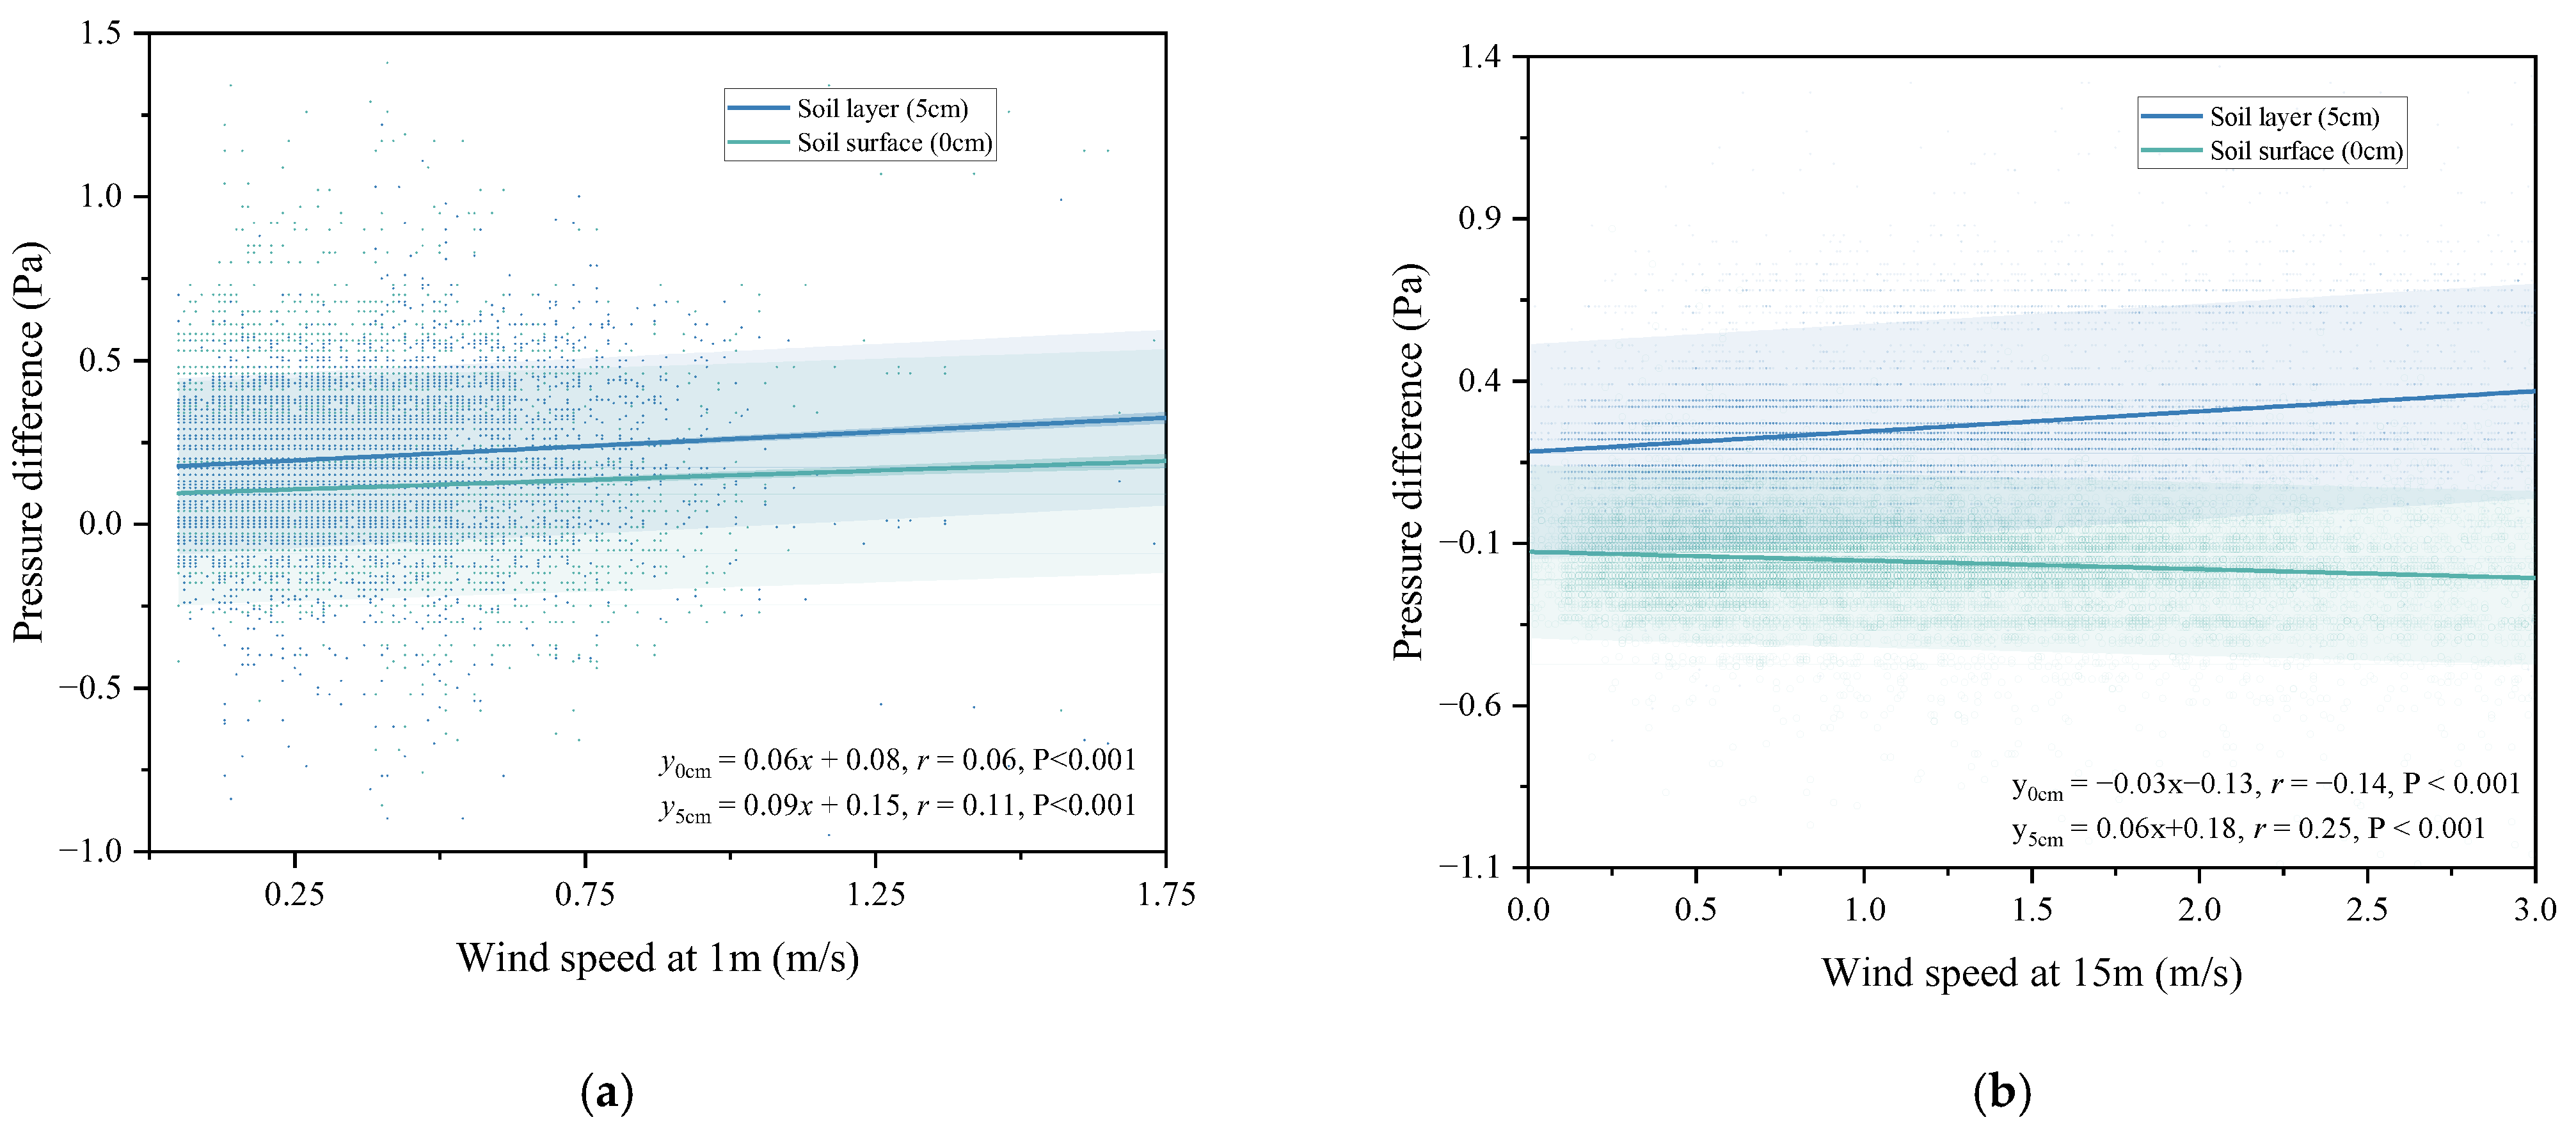
According to Darcy’s law, gas flow is related to pressure, indicating that there exists a functional relationship between near-surface wind speed and pressure fluctuations in this study, as shown in Figure 5. Interestingly, we found a response relationship between near-surface wind speed and both soil surface and pore air pressure, but the relationship differs significantly above and below the canopy. Below the canopy (at 1 m), wind speed shows a positive correlation with both soil surface and pore air pressure. Specifically, the response of soil pore air pressure at 5 cm depth (slope = 0.09 Pa·s m−1) is greater than that of soil surface air pressure (slope = 0.06 Pa·s m−1), with p-values all less than 0.001. This result indicates upward gas transport within the soil profile. However, the relationship above the canopy (at 15 m) shows the opposite trend. Wind speed at 15 m is negatively correlated with soil surface air pressure and positively correlated with soil pore air pressure at the surface layer. The explanatory power of wind speed at 15 m for both soil surface and pore air pressure is greater than at 1 m. Nevertheless, the response relationship between soil surface, pore air pressure, and wind speed above the canopy still suggests that CO2 gas in the vertical soil profile is being transported upwards and released into the atmosphere. These results imply that near-surface wind speed enhances the release of soil gases.

3.5. Response of Soil CO2 Concentration in the Vertical Soil Profile to Soil Pore Air Pressure

Based on the relationship between wind speed and soil pore air pressure, we further explored the response of soil CO2 concentration in the vertical soil profile to soil pore air pressure, as shown in Figure 6. We found that fluctuations in soil pore air pressure significantly affected the CO2 concentration in the vertical profile, with the explanatory power for CO2 concentration changes ranging from 33.6% to 47.6%, and p-values all being less than 0.001. This explanatory power was much higher than that of near-surface wind speed (Figure 4). Similarly, in the response relationship between soil CO2 concentration and soil pore air pressure, we observed that as soil depth increased, the influence of pore air pressure on CO2 concentration also increased, with the explanatory power rising from 33.6% at 0 cm to 44.9% at 10 cm and 47.6% at 20 cm. These findings suggest that soil pore air pressure can be an important variable in modeling the changes in or transport of soil CO2 concentration.

4. Discussion

4.1. Relationship Between Near-Surface Wind Speed and Air Pressure

Our results show that the mean wind speed above the canopy (15 m) was 1.2 m s−1, whereas the mean wind speed below the canopy (1 m) was only 0.3 m s−1—substantially lower than the theoretical value (0.42–0.61 m s−1) estimated using the wind profile equation. This discrepancy is consistent with the findings of Mohr et al. [18] and highlights that field measurements of wind speed are strongly influenced by terrain heterogeneity, stand density, and vegetation structure, often deviating from theoretical predictions [19]. Such variation underscores the importance of carefully selecting measurement heights in field studies, as wind speed measured below the canopy may not accurately reflect the true patterns of gas movement in the near-surface environment. Our experimental data further indicate that both soil surface and subsurface air pressures, as well as vertical soil CO2 concentrations, exhibited only weak correlations with wind speed at 1 m. This observation contrasts with studies such as those by Hung et al. [20] and Ortega et al. [21], who collected wind speed data below the canopy or approximately 2 m above the soil surface and considered it representative of near-surface air movement. The findings of this study emphasize that caution is needed when extrapolating wind speed measurements between canopy levels. Notably, we observed that wind speed above the canopy was significantly negatively correlated with air pressure at the soil surface (0 cm), whereas wind speed below the canopy was positively correlated with pressure. Treating these relationships interchangeably without accounting for canopy height effects could result in misinterpretation or erroneous conclusions. This phenomenon can be explained by fluid dynamics principles. According to Bernoulli’s principle, regions of high flow velocity are associated with reduced pressure. The canopy acts as a barrier, restricting airflow beneath it and creating a pressure gradient where the air pressure above the canopy is lower than that below, thereby driving upward airflow and forming a “wind-pumping effect” [6,7,10,11,22]. At the same time, the soil introduces a buffering and time-lag effect on pressure variations, causing subsurface pore air pressure to respond more slowly to atmospheric changes compared to surface air layers [16,23]. This lag results in a positive pressure gradient between soil pore air and the atmosphere, enhancing upward soil gas transport. Such a mechanism explains the differing impacts of above-canopy wind speed on soil surface and subsurface pore air pressures observed in Figure 5. In densely forested areas, this “wind-pumping effect” is expected to be even more pronounced due to increased vegetation complexity and airflow obstruction [24].

4.2. Response of Vertical Soil CO2 Profiles to Near-Surface Wind and Soil Pore Air Pressure

This study demonstrates that CO2 concentrations within the vertical soil profile exhibit a consistent upward trend in response to near-surface wind, showing significant positive correlations with both wind speed (Figure 4) and soil pore air pressure (Figure 6). Interestingly, this finding contrasts with several previous studies. For instance, Jiang et al. [16], Feng et al. [25], and Laemmel et al. [9] reported a decline in CO2 concentrations near the soil surface under elevated wind speeds, while Bowling and colleagues observed a similar trend in snowpack environments [26,27]. These earlier studies attributed the decline in CO2 concentrations to storage flux dynamics and quantitatively described the “wind-pumping effect.” We propose that the divergence between our findings and those of earlier studies can be largely attributed to differences in environmental context. While most previous work was conducted in open terrain or snow-covered landscapes with minimal surface obstruction, this study was carried out in a dense forest canopy. Forest vegetation profoundly alters wind flow patterns, reducing wind penetration and leading to a markedly different relationship between wind speed and soil gas exchange compared to bare or sparsely vegetated surfaces. This interpretation is supported by wind shear coefficients, which vary substantially across environments with different vegetation structures [19]. Moreover, we observed that CO2 concentration responses became more pronounced with increasing soil depth. This is consistent with the well-documented capacity of wind-induced pressure fluctuations to penetrate deeply into the soil, with evidence showing effects at depths exceeding 1 m [18,22,28]. Because our measurements focused on the top 20 cm of soil, the observed “wind-pumping effect” is sufficient to enhance vertical gas transport from deeper layers, where CO2 concentrations are typically higher. Consequently, CO2 concentrations at a depth of 20 cm showed greater variability than those at 10 cm and 0 cm, reflecting upward diffusion and advection processes enhanced by wind-induced pressure gradients. When comparing the explanatory power of near-surface wind speed and soil pore air pressure in predicting CO2 concentration variability, we found that pore air pressure accounted for a much larger proportion of the variation (Figure 4 and Figure 6). This stronger relationship likely stems from the fact that pore air pressure directly reflects gas dynamics within the soil matrix and is less susceptible to external disturbances. By contrast, wind measurements, especially in forested environments, are highly sensitive to microtopography, canopy structure, and surface vegetation. Tree trunks, branches, and understory vegetation disrupt airflow, attenuating wind speed and altering its directional patterns, thereby weakening its correlation with soil CO2 dynamics (Figure 4). Furthermore, canopy structure profoundly influences the wind pumping effect by mediating the interaction between wind and the forest [29,30]. Specifically, canopy density acts as a pivotal regulator—the effect is maximized at moderate densities, as it is insufficient with sparse canopies due to a lack of turbulence, and weakened with dense canopies that impede airflow penetration [9]. Canopy height determines the scale of energy involved; taller canopies capture more wind energy, generating a stronger pumping action [23]. Species composition, which dictates structural complexity, is central to the efficiency of this process. Complex and diverse canopies generate multi-scale turbulence, significantly enhancing pumping efficiency [12]. The magnitude of this influence varies considerably across forest types: structurally complex tropical rainforests and temperate deciduous forests (particularly during the leafless period) exhibit high potential, whereas structurally simple boreal coniferous forests and plantations demonstrate a weaker effect [31]. Consequently, alterations in canopy structure can directly modify the rate of soil carbon release, thereby representing a critical and non-negligible component in the accurate assessment of the forest carbon cycle.
Overall, our results highlight that soil pore air pressure is a more reliable and sensitive indicator of CO2 concentration variability within the soil profile than near-surface wind speed. This underscores the importance of incorporating soil pore pressure as a key variable in modeling wind-driven gas transport processes in forest ecosystems.

4.3. Implications of Near-Surface Wind Effects on Forest Soil CO2 Flux Measurements

Our findings demonstrate that near-surface wind significantly influences CO2 concentrations within the forest soil profile by creating a positive pressure gradient—where soil pore pressure exceeds surface atmospheric pressure—resulting in a “wind-pumping effect.” This effect enhances upward gas transport and promotes soil CO2 efflux, aligning with conclusions from previous studies [32,33,34,35]. However, these results raise important questions about the accuracy of commonly used soil carbon flux measurement techniques, particularly in forested environments. Most soil respiration studies rely on static or dynamic closed-chamber methods, which inherently isolate the chamber headspace from atmospheric pressure fluctuations. This isolation likely suppresses advective transport processes and can lead to systematic underestimation of CO2 fluxes [25,36]. Similarly, methods that calculate fluxes based on vertical CO2 concentration gradients may be compromised by wind-induced changes in soil gas profiles, which disrupt the assumed steady-state concentration gradients. Importantly, wind-driven gas transport often occurs via bulk or advective flow [7,37,38], which differs fundamentally from diffusion-driven transport. Since bulk flow can exceed molecular diffusion by orders of magnitude, models assuming purely diffusive transport may fail to represent actual gas exchange dynamics. Our group has already provided experimental evidence supporting this conclusion in laboratory studies, which have been completed and are ready for submission. These findings suggest that incorporating pore air pressure gradients into flux calculation models could significantly improve their accuracy and realism. In natural environment observations, soil CO2 release induced by the wind pump effect is a common phenomenon. Therefore, accurately quantifying this effect is crucial for assessing soil carbon fluxes. However, directly analyzing this process based on wind speed presents certain challenges [14,16,23]. Another key implication is that the absence of measurable wind beneath the canopy does not necessarily indicate stable conditions for flux measurements. Even in dense forests where near-surface winds are negligible, canopy-level turbulence can induce atmospheric pressure fluctuations that propagate into the soil, altering gas transport and flux dynamics. This insight challenges the assumption that calm understory conditions equate to representative flux measurements. Approaching the matter from the perspective of soil pore gas pressure fluctuations induced by the wind pump effect provides a viable pathway for quantifying its impact on CO2 release. Two primary modeling approaches currently exist: firstly, establishing the relationship between gas flow velocity and pore pressure differential within the soil medium based on Darcy’s law, subsequently coupling this to soil CO2 release models [6]; secondly, introducing a pressure pump coefficient (characterizing the intensity of wind-induced pressure fluctuations) and integrating it with relaxation–anisotropy covariance theory to construct soil carbon flux models [24]. It is noteworthy that applicability under varying environmental conditions must be considered in practical applications. Particularly in bare ground or sparse stands with high porosity, near-surface turbulence may induce an ‘erosion effect’ on soil CO2, leading to model inaccuracies when relying solely on pore pressure. However, within the medium-density forest stands examined in this study, near-surface wind speeds were extremely low (Figure 2), making direct wind-induced soil gas scouring unlikely. Consequently, incorporating pore pressure as a key variable within the flux calculation model is justified.

4.4. Limitations of the Research

Owing to the complexities inherent in field-based experimental settings, this study did not quantify the influence or magnitude of the effect of near-surface wind on soil CO2 flux measurements. Additionally, while the research delineates the influence of near-surface wind on the vertical profile of CO2 concentration in forest soils, it does not encompass investigations into grasslands, croplands, or the interplay of varying soil moisture and temperature conditions.
Soil moisture and temperature function as two critical environmental regulators governing the extent of pressure-induced CO2 transport [39]. Soil moisture operates primarily as a physical “valve” by modulating the connectivity of soil pore spaces. At intermediate moisture levels, soils simultaneously sustain elevated microbial activity for ample CO2 production and maintain adequate gas permeability, thereby enabling efficient gas pumping by external pressure fluctuations. In contrast, excessively dry conditions lead to a depletion of CO2 sources, while water-saturated conditions impede pressure transmission through pore water blockage, both of which substantially suppress this effect [39,40]. Concurrently, soil temperature acts as a biological “engine,” where an increase exponentially accelerates microbial respiration rates [39,41,42], thereby augmenting the CO2 source strength available for the wind pump. Consequently, the intensity of the wind pumping effect is determined by a dynamic equilibrium between the “transport conditions” governed by soil moisture and the “source strength” driven by soil temperature. This physico-biological coupling process is maximized only when both factors reside within their respective optimal ranges.
Future research should focus on elucidating the influence of near-surface winds on the dynamics and transport mechanisms of soil CO2 across diverse ecosystems. Furthermore, the findings of this study underscore the imperative to integrate abiotic physical drivers into the analysis of soil–plant–atmosphere carbon fluxes [43]. The wind pump effect establishes a direct linkage between soil respiration and canopy photosynthesis—two processes traditionally considered in relative isolation [44,45]. The consequent dynamism in CO2 concentrations within the canopy zone presents a potential window of enhanced photosynthetic opportunity for plants and signifies a more efficient internal carbon cycling pathway at the ecosystem level [46,47]. Overlooking this advective transport mechanism, driven by atmospheric pressure fluctuations, may not only result in inaccurate flux measurements but could also lead to a fundamental underestimation of the true carbon sequestration potential of forests and their internal carbon cycling efficiency, particularly under dynamic wind regimes.

5. Conclusions

This study provides an in-depth analysis of how near-surface wind influences CO2 concentrations within the vertical soil profile of forest ecosystems. Our findings reveal that wind speed above the forest canopy has a stronger explanatory power for variations in CO2 concentrations than wind speed at the forest floor. Additionally, we observed that wind speed above the canopy also explains fluctuations in soil pore air pressure, with a significant correlation between the two variables. Further analysis shows that soil pore air pressure fluctuations, induced by the “wind-pumping effect” caused by canopy-level wind, are an effective predictor of CO2 concentration changes in the vertical soil profile. Notably, soil pore air pressure is positively correlated with CO2 concentrations. This phenomenon suggests that the “wind-pumping effect” enhances soil CO2 efflux, which could potentially influence field-based soil CO2 flux measurements. Overall, the results of this study shed light on the mechanisms by which near-surface wind affects CO2 concentrations and transport processes within forest soils. These insights are valuable for the accurate construction of global carbon cycle models.

Author Contributions

Conceptualization, T.C. and J.J.; methodology, T.C.; software, T.C. and J.J.; validation, L.F., J.J. and T.C.; formal analysis, T.C.; investigation, T.C.; resources, T.C. and J.J.; data curation, T.C.; writing—original draft preparation, T.C.; writing—review and editing, J.J., J.H. and Y.L.; visualization, T.C. and J.J.; supervision, J.H. and Y.L.; project administration, J.H. and Y.L.; funding acquisition, J.H. All authors have read and agreed to the published version of the manuscript.

Funding

This study was supported by the National Natural Science Foundation of China (Grant Numbers 32371668 and 31971493).

Data Availability Statement

The data presented in this study are available on request from the corresponding authors.

Acknowledgments

We thank the editor and reviewers for their comprehensive and detailed comments and suggestions on this manuscript.

Conflicts of Interest

The authors declare no conflicts of interest.

References

  1. Bond-Lamberty, B.; Ballantyne, A.; Berryman, E.; Fluet-Chouinard, E.; Jian, J.; Morris, K.A.; Rey, A.; Vargas, R. Twenty Years of Progress, Challenges, and Opportunities in Measuring and Understanding Soil Respiration. J. Geophys. Res. Biogeosci. 2024, 129, e2023JG007637. [Google Scholar] [CrossRef]
  2. Hashimoto, S.; Ito, A.; Nishina, K. Divergent data-driven estimates of global soil respiration. Commun. Earth Environ. 2023, 4, 460. [Google Scholar] [CrossRef]
  3. Feng, L.; Jiang, J.; Hu, J.; Zhu, C.; Wu, Z.; Li, G.; Chen, T. Global Spatial Projections of Forest Soil Respiration and Associated Uncertainties. Forests 2024, 15, 1982. [Google Scholar] [CrossRef]
  4. Janssens, I.A.; Kowalski, A.S.; Ceulemans, R. Forest floor CO2 fluxes estimated by eddy covariance and chamber-based model. Agric. For. Meteorol. 2001, 106, 61–69. [Google Scholar] [CrossRef]
  5. Lewicki, J.L.; Hilley, G.E.; Tosha, T.; Aoyagi, R.; Yamamoto, K.; Benson, S.M. Dynamic coupling of volcanic CO2 flow and wind at the Horseshoe Lake tree kill, Mammoth Mountain, California. Geophys. Res. Lett. 2007, 34, L03401. [Google Scholar] [CrossRef]
  6. Poulsen, T.G.; Furman, A.; Liberzon, D. Effect of near-surface wind speed and gustiness on horizontal and vertical porous medium gas transport and gas exchange with the atmosphere. Eur. J. Soil Sci. 2018, 69, 279–289. [Google Scholar] [CrossRef]
  7. Pourbakhtiar, A.; Poulsen, T.G.; Wilkinson, S.; Bridge, J.W. Effect of wind turbulence on gas transport in porous media: Experimental method and preliminary results. Eur. J. Soil Sci. 2017, 68, 48–56. [Google Scholar] [CrossRef]
  8. You, K.; Zhan, H. Comparisons of diffusive and advective fluxes of gas phase volatile organic compounds (VOCs) in unsaturated zones under natural conditions. Adv. Water Resour. 2013, 52, 221–231. [Google Scholar] [CrossRef]
  9. Laemmel, T.; Mohr, M.; Longdoz, B.; Schack-Kirchner, H.; Lang, F.; Schindler, D.; Maier, M. From above the forest into the soil-How wind affects soil gas transport through air pressure fluctuations. Agric. For. Meteorol. 2019, 265, 424–434. [Google Scholar] [CrossRef]
  10. Nachshon, U.; Dragila, M.; Weisbrod, N. From atmospheric winds to fracture ventilation: Cause and effect. J. Geophys. Res. Atmos. 2012, 117. [Google Scholar] [CrossRef]
  11. Sánchez-Cañete, E.; Oyonarte, C.; Serrano-Ortiz, P.; Curiel Yuste, J.; Pérez-Priego, O.; Domingo, F.; Kowalski, A. Winds induce CO2 exchange with the atmosphere and vadose zone transport in a karstic ecosystem: Dynamics of CO2 within the vadose zone. J. Geophys. Res. Biogeosci. 2016, 121, 2049–2063. [Google Scholar] [CrossRef]
  12. Maier, M.; Mayer, S.; Laemmel, T. Rain and wind affect chamber measurements. Agric. For. Meteorol. 2019, 279, 107754. [Google Scholar] [CrossRef]
  13. Lai, D.Y.F.; Roulet, N.; Humphreys, E.; Moore, T.; Dalva, M. The effect of atmospheric turbulence and chamber deployment period on autochamber CO2 and CH4 flux measurements in an ombrotrophic peatland. Biogeosciences 2012, 9, 3305–3322. [Google Scholar] [CrossRef]
  14. Jiang, J.; Yin, W.; Hu, J.; Hu, Y. Study of a calibration system for soil respiration measurement chambers. Environ. Res. Commun. 2022, 4, 095006. [Google Scholar] [CrossRef]
  15. Fleming, N.; Morais, T.; Mayer, K.; Ryan, M. Spatiotemporal variability of fugitive gas migration emissions around a petroleum well. Atmos. Pollut. Res. 2021, 12, 101094. [Google Scholar] [CrossRef]
  16. Jiang, J.; Hu, J.; Xu, X.; Li, Y.; Sheng, J. Effect of near-surface winds on the measurement of forest soil CO2 fluxes using closed air chambers. Front. Ecol. Evol. 2023, 11, 1163704. [Google Scholar] [CrossRef]
  17. Lebel, E.; Lu, H.; Vielstädte, L.; Kang, M.; Banner, P.; Fischer, M.; Jackson, R. Methane Emissions from Abandoned Oil and Gas Wells in California. Environ. Sci. Technol. 2020, 54, 14617–14626. [Google Scholar] [CrossRef]
  18. Mohr, M.; Laemmel, T.; Maier, M.; Schindler, D. Analysis of Air Pressure Fluctuations and Topsoil Gas Concentrations within a Scots Pine Forest. Atmosphere 2016, 7, 125. [Google Scholar] [CrossRef]
  19. Novak, M.D.; Chen, W.; Orchansky, A.L.; Ketler, R. Turbulent exchange processes within and above a straw mulch.: Part II: Thermal and moisture regimes. Agric. For. Meteorol. 2000, 102, 155–171. [Google Scholar] [CrossRef]
  20. Hung, W.-T.; Campbell, P.C.; Moon, Z.; Saylor, R.; Kochendorfer, J.; Lee, T.R.; Massman, W. Evaluation of an In-Canopy Wind and Wind Adjustment Factor Model for Wildfire Spread Applications Across Scales. J. Adv. Model. Earth Syst. 2024, 16, e2024MS004300. [Google Scholar] [CrossRef]
  21. Ortega, M.; Navarro, J.A.; Molina, J.R. Modeling Wind Adjustment Factor for a prescribed burn plan. An application to Mediterranean stands in Southern Europe. Agric. For. Meteorol. 2023, 342, 109748. [Google Scholar] [CrossRef]
  22. Takle, E.; Massman, W.; Brandle, J.; Schmidt, R.A.; Zhou, X.; Litvina, I.; García, R.; Doyle, G.; Rice, C. Influence of high-frequency ambient pressure pumping on carbon dioxide efflux from soil. Agric. For. Meteorol. 2004, 124, 193–206. [Google Scholar] [CrossRef]
  23. Kolbe, S.; Mohr, M.; Maier, M.; Osterholt, L.; Gardiner, B.; Schindler, D. On the Potential of Using Air Pressure Fluctuations to Estimate Wind-Induced Tree Motion in a Planted Scots Pine Forest. Forests 2022, 13, 225. [Google Scholar] [CrossRef]
  24. Laemmel, T. 1D Air Pressure Fluctuations Cannot Fully Explain the Natural Pressure-Pumping Effect on Soil Gas Transport. Soil Sci. Soc. Am. J. 2019, 83, 1044–1053. [Google Scholar] [CrossRef]
  25. Feng, L.; Jiang, J.; Hu, J. Underestimation of global soil CO2 flux measurements caused by near-surface winds. Front. For. Glob. Chang. 2024, 7, 1459948. [Google Scholar] [CrossRef]
  26. Bowling, D.R.; Massman, W.J. Persistent wind-induced enhancement of diffusive CO2 transport in a mountain forest snowpack. J. Geophys. Res. Biogeosci. 2011, 116. [Google Scholar] [CrossRef]
  27. Bowling, D.R.; Massman, W.J.; Schaeffer, S.M.; Burns, S.P.; Monson, R.K.; Williams, M.W. Biological and physical influences on the carbon isotope content of CO2 in a subalpine forest snowpack, Niwot Ridge, Colorado. Biogeochemistry 2009, 95, 37–59. [Google Scholar] [CrossRef]
  28. Laemmel, T.; Mohr, M.; Schack-Kirchner, H.; Schindler, D.; Maier, M. Direct Observation of Wind-Induced Pressure-Pumping on Gas Transport in Soil. Soil Sci. Soc. Am. J. 2017, 81, 770–774. [Google Scholar] [CrossRef]
  29. Fellini, S.; Marro, M.; Del Ponte, A.V.; Barulli, M.; Soulhac, L.; Ridolfi, L.; Salizzoni, P. High resolution wind-tunnel investigation about the effect of street trees on pollutant concentration and street canyon ventilation. Build. Environ. 2022, 226, 109763. [Google Scholar] [CrossRef]
  30. Tolladay, J.; Chemel, C. Numerical Modelling of Neutral Boundary-layer Flow Across a Forested Ridge. Bound. Layer Meteorol. 2021, 180, 457–476. [Google Scholar] [CrossRef]
  31. Ammatelli, J.H.; Gutmann, E.D.; Bush, S.A.; Barnard, H.R.; Ciruzzi, D.M.; Loheide, S.P.; Raleigh, M.S.; Lundquist, J.D. Measuring tree sway frequency with videos for ecohydrologic applications: Assessing the efficacy of Eulerian processing algorithms. Agric. For. Meteorol. 2025, 373, 110751. [Google Scholar] [CrossRef]
  32. Bain, W.; Hutyra, L.; Patterson, D.; Bright, A.; Daube, B.; Munger, J.; Wofsy, S. Wind-induced error in the measurement of soil respiration using closed dynamic chambers. Agric. For. Meteorol. 2005, 131, 225–232. [Google Scholar] [CrossRef]
  33. Conen, F.; Smith, K. A re-examination of closed flux chamber methods for the measurement of trace gas emissions from soils to the atmosphere. Eur. J. Soil Sci. 2003, 49, 701–707. [Google Scholar] [CrossRef]
  34. Suleau, M.; Debacq, A.; Dehaes, V.; Aubinet, M. Wind velocity perturbation of soil respiration measurements using closed dynamic chambers. Eur. J. Soil Sci. 2009, 60, 515–524. [Google Scholar] [CrossRef]
  35. Xu, L.; Furtaw, M.D.; Madsen, R.A.; Garcia, R.L.; Anderson, D.J.; McDermitt, D.K. On maintaining pressure equilibrium between a soil CO2 flux chamber and the ambient air. J. Geophys. Res. Atmos. 2006, 111, D08S10. [Google Scholar] [CrossRef]
  36. Wu, Z.; Hu, J.; Feng, L.; Jiang, J.; Li, G. Quantifying the Effects of Wind Turbulence on CO2 Flux Measurement in a Closed Chamber. Sustainability 2024, 16, 10501. [Google Scholar] [CrossRef]
  37. Levintal, E.; Dragila, M.I.; Weisbrod, N. Impact of wind speed and soil permeability on aeration time in the upper vadose zone. Agric. For. Meteorol. 2019, 269–270, 294–304. [Google Scholar] [CrossRef]
  38. Maier, M.; Schack-Kirchner, H.; Aubinet, M.; Goffin, S.; Longdoz, B.; Parent, F. Turbulence Effect on Gas Transport in Three Contrasting Forest Soils. Soil Sci. Soc. Am. J. 2012, 76, 1518–1528. [Google Scholar] [CrossRef]
  39. Stanek, L.; Neruda, J.; Ulrich, R. Changes in the concentration of CO2 in forest soils resulting from the traffic of logging machines. J. For. Sci. 2025, 71, 250–267. [Google Scholar] [CrossRef]
  40. Huang, X.; Horn, R.; Ren, T. Deformation and pore water pressure change during static and cyclic loading with subsequent shearing on soils with different textures and matric potentials. Soil Tillage Res. 2021, 209, 104909. [Google Scholar] [CrossRef]
  41. Jiang, J.; Feng, L.; Hu, J.; Zhu, C. Interpretable machine learning unveils threshold responses and spatial patterns of global soil respiration. Ecol. Indic. 2025, 177, 113750. [Google Scholar] [CrossRef]
  42. Bai, Y.; Peng, Y.; Zhang, D.; Yang, G.; Chen, L.; Kang, L.; Zhou, W.; Wei, B.; Xie, Y.; Yang, Y. Heating up the roof of the world: Tracing the impacts of in-situ warming on carbon cycle in alpine grasslands on the Tibetan Plateau. Natl. Sci. Rev. 2025, 12, nwae371. [Google Scholar] [CrossRef]
  43. Moya, M.R.; López-Ballesteros, A.; Sánchez-Cañete, E.P.; Serrano-Ortiz, P.; Oyonarte, C.; Domingo, F.; Kowalski, A.S. Ecosystem CO2 release driven by wind occurs in drylands at global scale. Glob. Chang. Biol. 2022, 28, 5320–5333. [Google Scholar] [CrossRef]
  44. Şevik, H.; Cetin, M.; Belkayalı, N. Effects of Forests on Amounts of CO2: Case Study of Kastamonu and Ilgaz Mountain National Parks. Pol. J. Environ. Stud. 2015, 24, 253–256. [Google Scholar] [CrossRef]
  45. Han, Y.; Wang, G.; Xiang, D.; Zhou, S.; Xiong, L. Biophysical control of daytime and nighttime soil respiration during growing and non-growing seasons in a temperate deciduous forest. Agric. For. Meteorol. 2024, 350, 109998. [Google Scholar] [CrossRef]
  46. Wolf, S.; Paul-Limoges, E.; Sayler, D.; Kirchner, J.W. Dynamics of evapotranspiration from concurrent above- and below-canopy flux measurements in a montane Sierra Nevada forest. Agric. For. Meteorol. 2024, 346, 109864. [Google Scholar] [CrossRef]
  47. Chi, J.; Zhao, P.; Klosterhalfen, A.; Jocher, G.; Kljun, N.; Nilsson, M.B.; Peichl, M. Forest floor fluxes drive differences in the carbon balance of contrasting boreal forest stands. Agric. For. Meteorol. 2021, 306, 108454. [Google Scholar] [CrossRef]
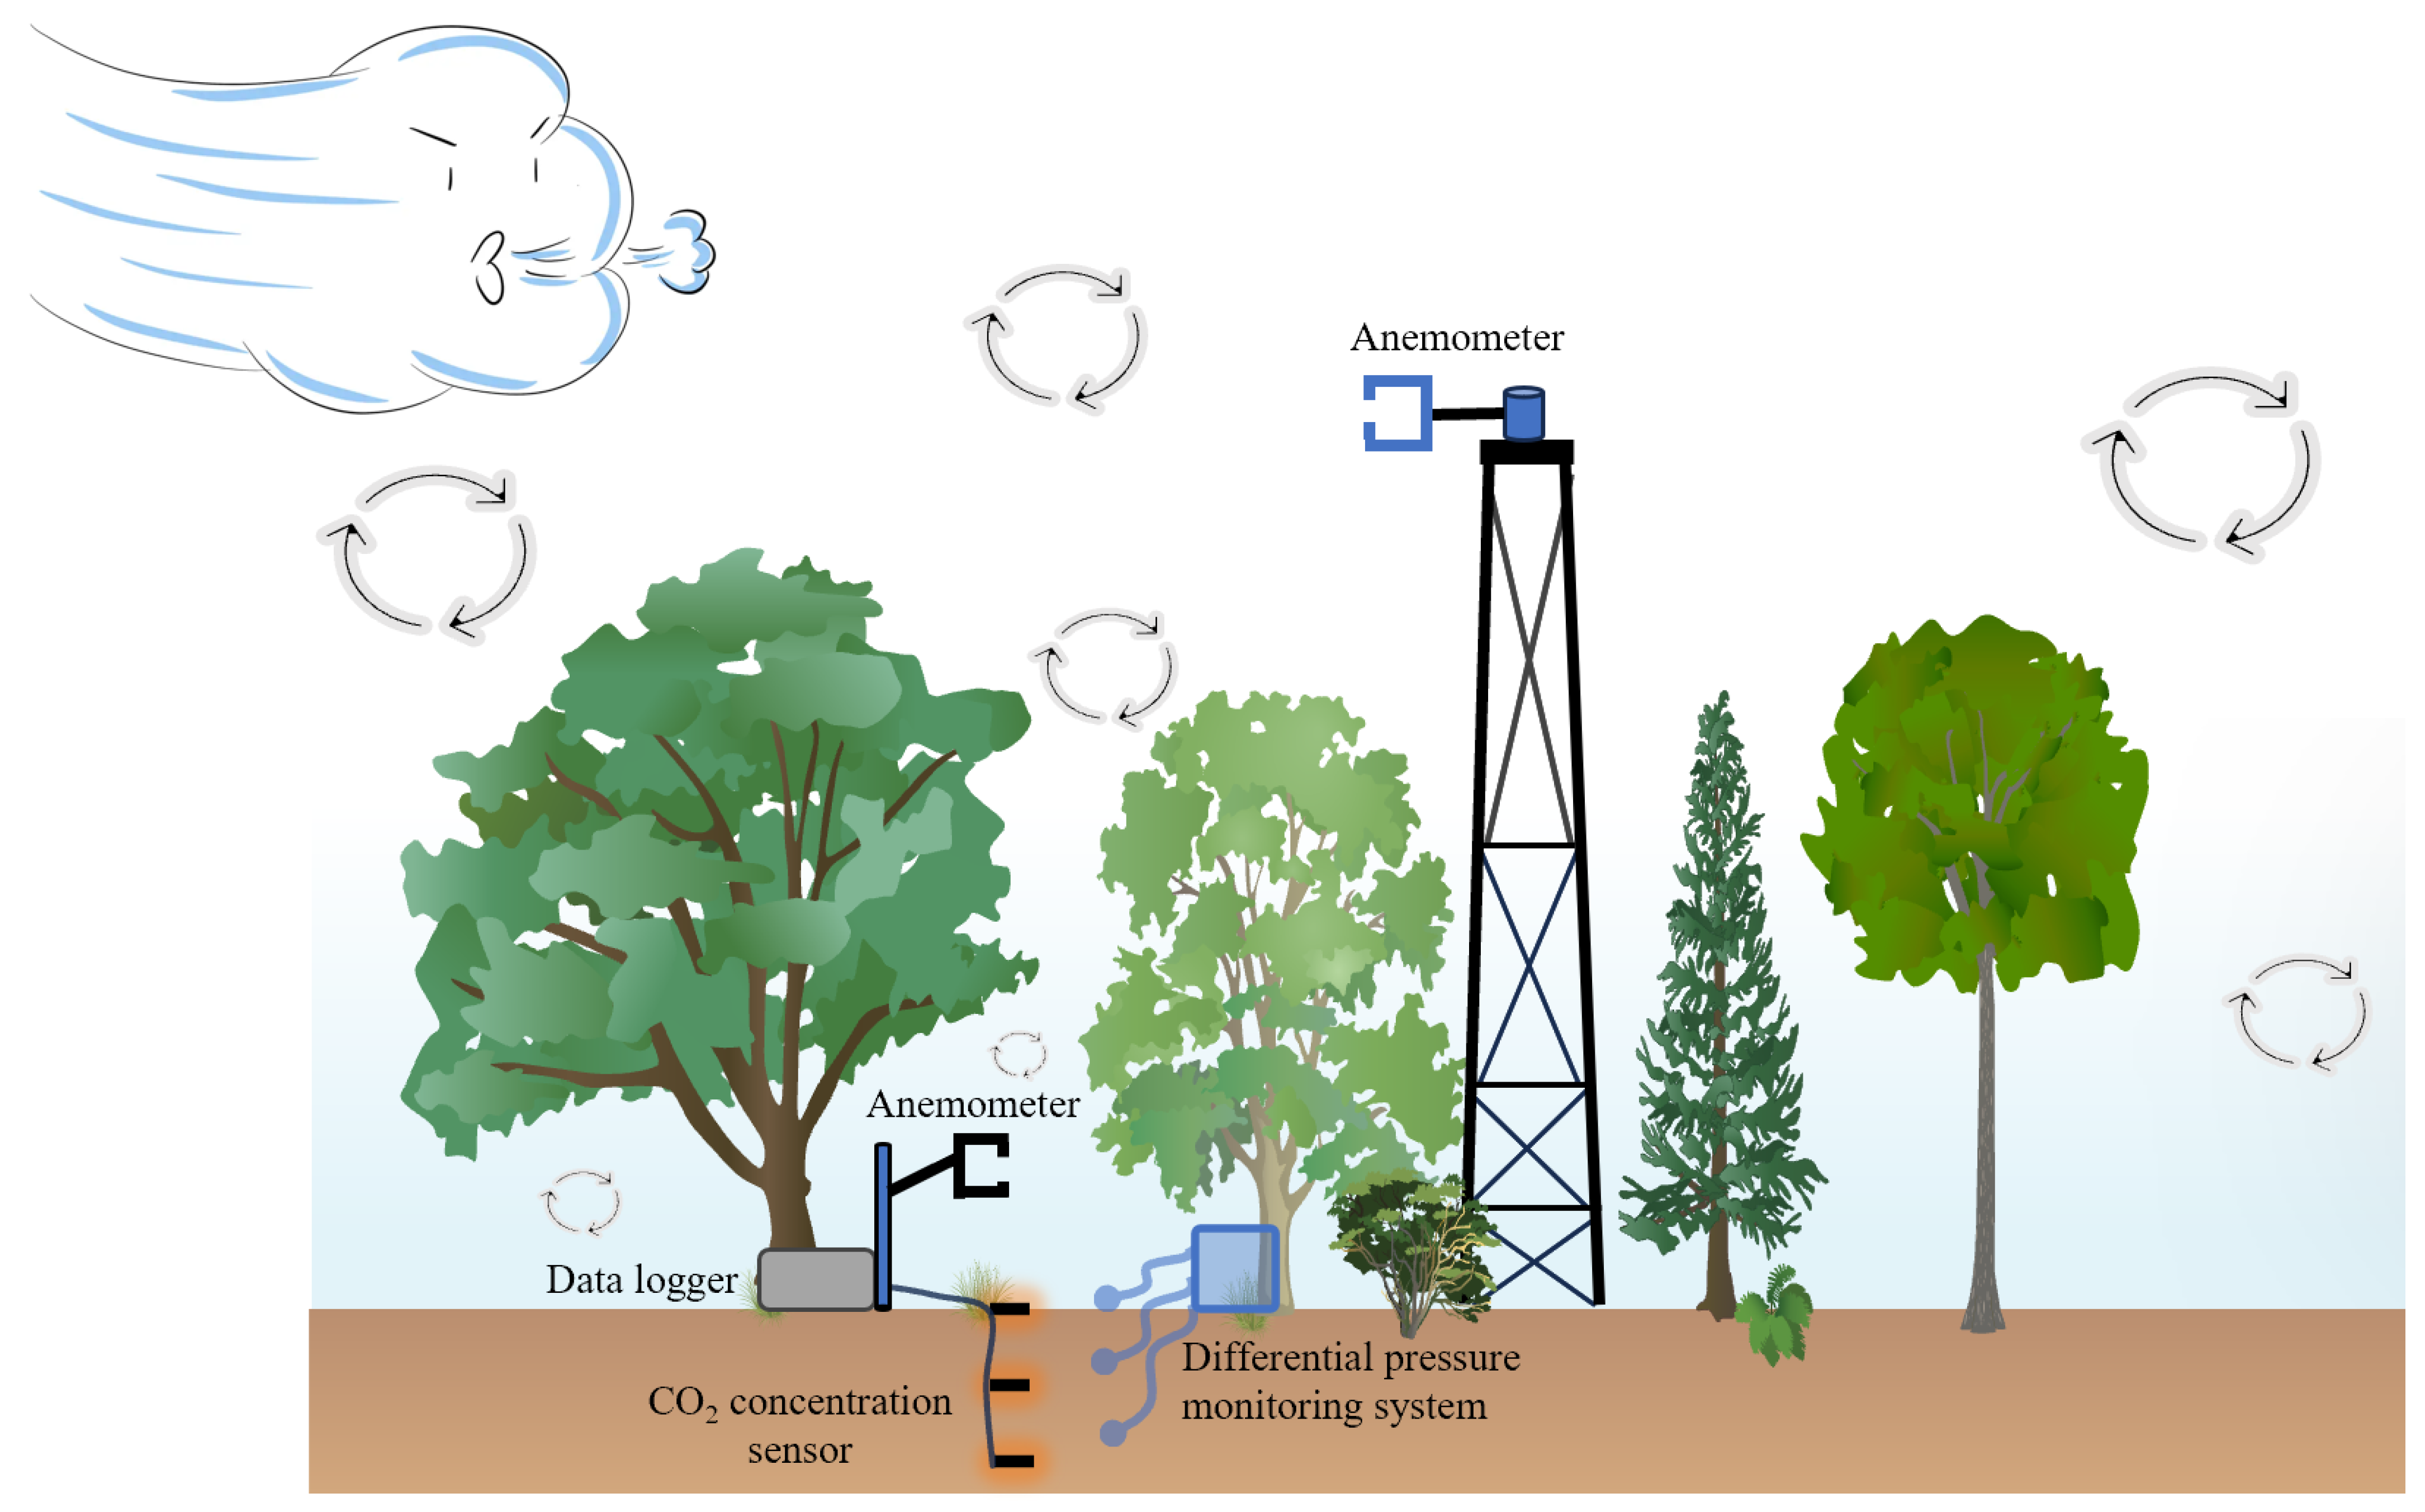
Figure 1. Experimental layout.
Forests 16 01637 g001
Figure 2. Experimental data distribution. (a) Wind speed at the canopy level (15 m) and near the forest floor (1 m). (b) Pressure difference at the soil surface (0 cm) and soil layer (5 cm). (c) CO2 concentration distribution in the vertical soil profile (0 cm, 10 cm, 20 cm).
Forests 16 01637 g002
Figure 3. Wind speed distribution at heights of 15 m and 1 m above the ground. The top axis shows the wind speed distribution at 15 m, while the right axis shows the wind speed distribution at 1 m. The whisker length of the boxplot represents 1.5 times the interquartile range. r represents the Pearson correlation coefficient. Red contour lines represent the density of data points, with the highest point indicating the densest data.
Forests 16 01637 g003
Figure 4. Relationship between wind speed and soil CO2 concentration. (a,b) show the functional relationships between wind speed and CO2 concentration in the vertical soil profile at 1 m (a) and 15 m (b), respectively. r represents the Pearson correlation coefficient, and “***” indicates a p-value less than 0.001.
Forests 16 01637 g004
Figure 5. Functional relationship between wind speed and soil pore air pressure. (a,b) show the functional relationships between wind speed and soil pore air pressure at 1 m (a) and 15 m (b), respectively. r represents the Pearson correlation coefficient. Blue dots represent data from the 5cm soil layer, while green dots represent data from the 0cm soil surface.
Forests 16 01637 g005
Figure 6. Functional relationship between soil pore air pressure and soil CO2 concentration. “r” represents the Pearson correlation coefficient, and “***” indicates a p-value less than 0.001.
Forests 16 01637 g006
Disclaimer/Publisher’s Note: The statements, opinions and data contained in all publications are solely those of the individual author(s) and contributor(s) and not of MDPI and/or the editor(s). MDPI and/or the editor(s) disclaim responsibility for any injury to people or property resulting from any ideas, methods, instructions or products referred to in the content.