Abstract
Mite assemblages are integral components of forest ecosystems, yet their seasonal dynamics in moss microhabitats remain poorly understood. We investigated moss-dwelling mites in a peri-urban Mediterranean forest in Greece across three sampling periods (March, May, July 2020), analyzing 150 random samples. Diversity was assessed using Hill numbers, rarefaction, and β-diversity partitioning, while Indicator Species Analysis identified taxa linked to specific months. Functional structure was further examined through trophic guilds. Results revealed strong temporal shifts: richness peaked in March, whereas May and July harbored distinct assemblages with unique indicator taxa. Functional analyses indicated seasonal changes in trophic guild representation, reflecting resource-driven dynamics. These findings highlight the importance of moss microhabitats as reservoirs of mite diversity and underscore the need for temporal perspectives in Mediterranean forest biodiversity research.
1. Introduction
Bryophytes are non-vascular plants lacking true roots; instead, they develop rhizoids and remain in close contact with their substrate. Nutrients and water are obtained primarily from precipitation and dry deposition [1,2]. They constitute an essential component of forest ecosystems, creating microhabitats that sustain diverse assemblages of invertebrates, particularly mites, by providing moisture, shelter, protection from UV radiation, and temperature buffering, while also serving as a potential food source [3,4].
Moss-dwelling mites contribute to decomposition processes, nutrient cycling, and the regulation of microbial and fungal communities, thereby linking aboveground and belowground ecological processes [5,6]. Previous studies have demonstrated that soil and moss-associated mites can serve as sensitive bioindicators of microhabitat quality and environmental change due to their specialized feeding habits and limited dispersal capacity [7,8,9,10].
Despite extensive work on mite diversity and functional ecology in temperate and boreal forests [11,12,13,14,15], data from Mediterranean ecosystems remain scarce. In the typical Mediterranean zone, forests are composed of broadleaves, particularly oaks (Quercus spp., Fagaceae), both evergreen and deciduous, as well as conifers such as Pinus halepensis Mill., P. brutia Ten., P. pinea L., P. pinaster Aiton (Pinaceae), and Juniperus spp. (Cupressaceae). Their degradation has often led to the development of low-density woody vegetation, including Olea europaea L. ssp. sylvestris (Miller) (Oleaceae) and Pistacia lentiscus L. (Anacardiaceae), characteristic of “macchia” and “garrigue” shrublands. Many areas also bear the legacy of long-term human intervention, having been reforested with species such as P. pinea, Cupressus sempervirens L. (Cupressaceae), and Castanea sativa Mill., (Fagaceae) which have gradually become characteristic elements of the landscape [16].
Mediterranean forests are characterized by strong seasonality, with mild, wet winters and hot, dry summers, which impose pronounced constraints on the survival and activity of soil microarthropods [16,17]. The seasonal availability of moisture and organic substrates can strongly influence both the taxonomic and functional composition of moss-dwelling mite communities [18].
In Greece, research on the acarofauna of bryophytes remains very limited, being restricted mostly to scattered taxonomic records rather than comprehensive ecological investigations [19,20,21,22,23,24,25,26]. Consequently, large parts of the country remain virtually unexplored with respect to these communities. The Kaisariani Aesthetic Forest, a peri-urban forest located on the outskirts of Athens and included in the Natura 2000 network, provides an excellent opportunity to address this gap. Its unique position at the interface between a major metropolitan area and natural habitats enhances its ecological and conservation value. Combining natural evergreen shrublands and reforested Aleppo pine (P. halepensis) stands [27], it represents a highly diverse and ecologically significant setting for the study of moss-dwelling mites.
The aims of this study were therefore to (i) assess the taxonomic composition and diversity of moss-dwelling mite communities, (ii) analyze their seasonal variation in abundance and species richness across spring to summer, and (iii) evaluate changes in the functional composition of the assemblages, with a focus on trophic guild structure.
Based on the pronounced climatic seasonality of Mediterranean forests, we formulated the following testable hypotheses: (1) Mite abundance and species richness will progressively decrease from spring to summer due to increasing temperature and reduced precipitation. (2) Seasonal shifts in community composition will be mainly driven by species turnover rather than nestedness. (3) The relative contribution of trophic guilds will change across months.
2. Materials and Methods
2.1. Study Area and Sampling
The study was conducted in the Kaisariani Aesthetic Forest, located on the northern foothills of Mount Hymettus (Attica region, Greece) (Figure 1). The site belongs to the Natura 2000 network under the designation “Hymettus Mountain—Kaisariani Aesthetic Forest” (GR3000006) [28]. It was declared an Aesthetic Forest in 1974 (Official Gazette 248/Δ/1974) to safeguard its landscape, biodiversity, and cultural monuments.
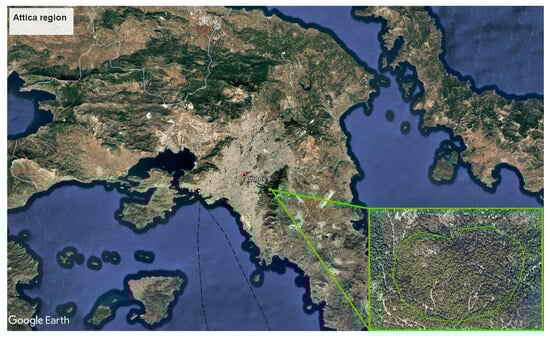
Figure 1.
Location of the study area.
Vegetation is dominated by reforested stands of Aleppo pine, established during the 20th century on degraded land, with scattered P. brutia and C. sempervirens. According to the Habitats Directive (92/43/EEC), the main habitat type is “Mediterranean pine forests with endemic Mesogean pines (code: 9540)”. Despite these reforestations, remnants of evergreen sclerophyllous shrublands consisted of Quercus coccifera L., Arbutus unedo L. (Ericaceae), Phillyrea latifolia L. (Oleaceae), P. lentiscus, and Myrtus communis L. (Myrtaceae) persist, representing the natural vegetation of the area. In lower altitudes, O. europaea and Ceratonia siliqua L. (Fabaceae) are locally present, while riparian zones host Platanus orientalis L. (Platanaceae) and Nerium oleander L. (Apocynaceae) [27].
The samplings took place in a particular area of the pine forest, over 70 years old (37°57′27.67″ N 23°47′48.24″ E, 460 m), covering approximately 0.2 Km2. The area is dominated by the common moss species Hypnum cupressiforme Hedw. (Hypnaceae) while other species such as Homalothecium sericeum W.P.Schimper (Brachytheciaceae), Grimmia pulvinata (Hedw.) Sm. (Grimmiaceae) and Tortula muralis Hedw. (Pottiaceae) are also abundant (Figure 2).
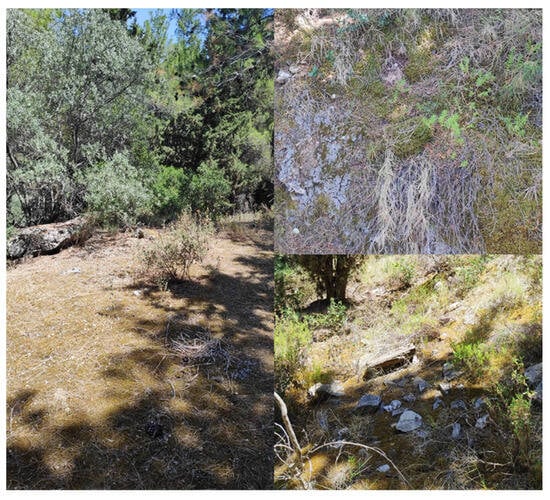
Figure 2.
Moss habitats of the study area.
Bryophyte sampling was conducted during three field campaigns on 6 March, 7 May, and 15 July 2020. In each campaign, 50 samples were randomly collected from distinct moss patches on the forest floor, each separated by at least 15 m to minimize spatial autocorrelation. All samples were taken from the soil substrate, primarily around the bases of trees, where bryophyte colonies were more developed and abundant. Each sample represented a 10 × 10 cm area with a thickness of 3–5 cm and was carefully detached and placed in an individual plastic bag. Samples were then transferred to the Laboratory of Agricultural Zoology and Entomology, Agricultural University of Athens for further examination.
Meteorological data were obtained from the nearest weather station of the National Observatory of Athens, Imittos-Dafni (code: LG0G) (Supplementary Figure S1 and Supplementary Tables S1 and S2). The mean monthly temperature was 13.6 °C (min 6.5, max 23.7) in March, 21.5 °C (min 12.7, max 36.1) in May, and 28.9 °C (min 21.9, max 38.1) in July, while monthly precipitation was 61.6 mm, 28.6 mm, and 1.4 mm, respectively. These climatic conditions provided contrasting environmental settings across the three sampling dates, reflecting the seasonal progression from early spring to mid-summer in a Mediterranean climate.
2.2. Mite Collection and Identification
Mites were extracted from moss samples using modified Tullgren funnels for 10 days into 70% ethanol and sorted out from the samples under stereomicroscope (Zeiss Stemi DV4, Carl Zeiss MicroImaging GmbH, Göttingen, Germany). Mesostigmata, Trombidiformes and Endeostigmata were mounted on permanent slides with Hoyer’s medium while Oribatida were mounted on temporary slides with cavity in lactic acid. Mite specimens were examined under microscope (Zeiss Axioskop 2 plus, Carl Zeiss Light Microscopy GmbH, Göttingen, Germany) and further determined to species/morphospecies level based on literature [21,25,26,29,30,31,32,33,34,35,36,37,38,39,40,41,42,43,44,45,46,47,48,49,50,51,52,53,54,55,56,57,58,59,60,61,62,63,64,65]. Juvenile specimens were assigned to species only when morphologically and spatially associated with corresponding adults; otherwise, they were pooled at the morphospecies level. All specimens are deposited in LAZAU (The Acari collection of Laboratory of Agricultural Zoology and Entomology, Agricultural University of Athens, Greece).
For the analysis of the functional composition of the communities, mite species were classified into four broadened trophic categories, namely predators, omnivores, herbivores/algivores, and fungivores/microbivores, based on available literature, either at the species level or, when specific information was lacking, at higher taxonomic levels (genus or family) (Supplementary Table S2). Predators include species that feed primarily on other invertebrates (mites, nematodes, springtails, etc.). Omnivores exploit a mixed diet, consuming both invertebrates and plant or fungal material. Herbivores/algivores feed on plant tissues or algae; this group also includes endophagous oribatids. Fungivores/microbivores feed mainly on mycorrhizal and lichen-associated fungi, as well as other microorganisms [44,66,67,68,69].
2.3. Data Analysis
The Kruskal–Wallis nonparametric analysis of variance was used to assess differences in abundance of moss-dwelling mites among sampling months. Dunn’s post hoc test with Bonferroni correction was applied to identify pairwise differences using the “FSA” package [70].
To visualize the associations between mite families and the sampling months, we constructed a chord diagram using the package “circlize” [71]. For each family, we calculated the total abundance of individuals per month and displayed their distribution as links between families and sampling periods. The width of each link is proportional to the number of individuals, while months and families are arranged around the circle for clarity.
The dominance (D) of each species was expressed as the percentage of individuals of this species in the total number of individuals of all recorded species. Based on the calculated dominance values, species were categorized as follows: eudominant (>10%), dominant (5–10%), subdominant (1.00–4.99%), recedent (0.5–0.99%), subrecedent (0.01–0.49%). Species frequency (C) was expressed as the percentage of the samples where the species was present. The species were classified by frequency into the following categories: euconstant (75–100%), constant (50–75%), accessory (25–50%), accidental (0.1–25%) [72].
We assessed α-diversity patterns of moss-dwelling mites using Hill numbers of order q = 0, 1, and 2, which correspond to species richness, the exponential of Shannon entropy, and the inverse of Simpson’s index, respectively [73]. Both sample-based estimates and pooled data per month were calculated to compare diversity across sampling periods. Rarefaction and extrapolation curves, along with sample coverage estimates, were obtained using the package “iNEXT” [74]. To evaluate the uncertainty of diversity estimates, 95% confidence intervals were generated using bootstrap resampling (999 iterations).
We calculated β-diversity to assess differences in mite community composition among the three sampling months. Abundance data were arranged in a site-by-taxon matrix, with each row representing a sample and each column representing a taxon. The Bray–Curtis dissimilarity index was computed using the vegdist function in the “vegan” package [75]. To statistically test differences in community composition, we used permutational multivariate analysis of variance (PERMANOVA) [76] with 999 permutations, as implemented in the adonis function (“vegan” package). To partition beta diversity into turnover and nestedness components, presence–absence data were analyzed with the “betapart” package using the Jaccard dissimilarity index [77]. Ordination of community dissimilarities was visualized through Principal Coordinates Analysis (PCoA) based on Bray–Curtis distances in the plots generated via “ggplot2” package [78].
To explore shared and unique species across months, we used Venn diagrams and UpSet plots [79] implemented in the UpSetR package [80]. These visualizations highlight both simple and complex intersections of species sets across the three sampling periods.
We conducted an Indicator Value (IndVal) analysis [81] using the R package “indicspecies” to identify species significantly associated with specific months. Statistical significance was assessed using 999 permutations. Only species with p < 0.05 were considered indicators, and those with IndVal > 0.7 were interpreted as strong indicators [82,83].
To assess the functional composition of moss-dwelling mite communities, abundance data of four trophic groups (predators, omnivores, herbivores/algivores, fungivores/microbivores) were pooled at the sample level to construct a trophic group × sample matrix. A non-metric multidimensional scaling (NMDS) ordination was performed using Bray–Curtis dissimilarities (metaMDS function, “vegan” package), with two dimensions (k = 2) and 100 random starts to ensure convergence. The ordination was visualized with convex ellipses to illustrate the dispersion of communities by month. To test for differences in functional composition among months, a permutational multivariate analysis of variance (PERMANOVA; adonis2 function, 999 permutations) was applied to the Bray–Curtis distance matrix with Month as a fixed factor.
All the analyses were performed using R version 4.4.1 (R Foundation for Statistical Computing, Vienna, Austria).
3. Results
3.1. Taxonomic Composition and Abundance of Moss-Dwelling Mite Communities
A total of 14,279 mite individuals were collected during the study, belonging to 3 orders, 66 families and 134 species (Table A1). From those, 57 species are new records for Greek fauna, i.e., Order Mesostigmata: Arctoseius minutus (Halbert, 1915) (Ascidae), Epicrius fungulatus Athias-Henriot, 1961 (Epicriidae), Dendroseius reticulatus (Sheals, 1965), Rodacarellus francescae Athias-Henriot, 1961 and Rodacarus reconditus Athias-Henriot, 1961 (Rhodacaridae), Veigaia exigua (Berlese, 1916) (Veigaiidae), Zercon salebrosus Blaszak, 1979 (Zerconidae); Order Trombidiformes: Sphaerolichus barbarus Grandjean, 1939 (Sphaerolichidae), Adamystis fonsi Coineau, 1974 (Adamystidae), Erythracarus pyrrholeucus (Hermann, 1804) (Anystidae), Bdella muscorum Ewing, 1909, Cyta coerulipes (Dugès, 1834), Hexabdella unusoculata Van der Schyff, Theron & Ueckermann, 2004, Odontoscirus communis (Atyeo, 1960), and Spinibdella cronini (Baker & Balock, 1944) (Bdellidae), Caligonella humilis (Koch, 1838), and Neognathus terrestris (Summers & Schlinger, 1955) (Caligonellidae), Cocceupodes mollicellus (Koch, 1838), Filieupodes filiformis Jesionowska, 2010, F. filistellatus Jesionowska, 2010, F. strandtmanni (Abou-Awad & El-Bagoury, 1984), and Linopodes motatorius (Linnaeus, 1758) (Cocceupodidae), Cunaxa polita Kazmierski & Ripka, 2015, and Puleus semistriatus Sergeyenko, 2011 (Cunaxidae), Balaustium akramii Noei, 2017 (Erythraeidae), Eupodes voxencollinus Thor, 1934, Pseudoeupodes porosus Khaustov, 2014, and Xerophiles ereynetoidalis Jesionowska, 2003 (Eupodidae), Microtydeus beltrani Baker, 1944, and Paratydaeolus loadmani (Wood, 1965) (Iolinidae), Tanytydeus aegyptiacus (Soliman, 1974) (Paratydeidae), Raphignathus ensipilosus Smith-Meyer & Ueckermann, 1989, and R. hecmatanaensis Khanjani & Ueckermann, 2003 (Raphignathidae), Coccorhagidia clavifrons (Canestrini, 1886), Parallelorhagidia evansi (Strandtmann & Prasse, 1977), Poecilophysis pratensis (Koch, 1835), P. pseudoreflexa Zacharda, 1980, Rhagidia gigas (Canestrini, 1886), and Sigthoria brevisensilla (Zacharda, 1980) (Rhagidiidae), Scutacarus laetificus Rack, 1966 (Scutacaridae), Brachytydeus volgini (Kuznetzov, 1973) (Tydeidae); Order Sarcoptiformes: Alicorhagia usitata Théron, Meyer & Ryke, 1970 (Alicorhagiidae), Amphialycus oblongus (Halbert, 1920), Bimichaelia sarekensis Tragardh, 1910, Laminamichaelia arbusculosa (Grandjean, 1942), and Pachygnathus villosus Dugês, 1836 (Alycidae), Nanorchestes arboriger (Berlese, 1904) (Nanorchestidae), Sellnickochthonius aokii (Chinone, 1974), and S. meridionalis (Bernini, 1973) (Brachychthoniidae), Chamobates voigtsi (Oudemans, 1902) (Chamobatidae), Belba dubinini Bulanova-Zachvatkina, 1962 (Damaeidae), Acrogalumna longipluma (Berlese, 1904), and Galumna tarsipennata Oudemans, 1914 (Galumnidae), Adrodamaeus femoratus (Koch, 1839) (Gymnodamaeidae), Peloptulus gibbus Mihelčič, 1857 (Phenopelopidae), Punctoribates mundus Shaldybina, 1973 (Punctoribatidae), and Scutovertex sculptus Michael, 1879 (Scutoverticidae).
Sarcoptiformes were the most abundant group of all samplings followed by Trombidiformes, while Mesostigmata were completely absent in July. In contrast, Trombidiformes had the highest species richness throughout the study (Figure 3). A significant reduction of mite individuals per sample was observed progressively from early spring to mid-summer (March 179.30 ± 14.52 a, May 92.16 ± 11.99 b, July 14.12 ± 1.74 c, χ2 = 102.69, df = 2, p < 0.001).
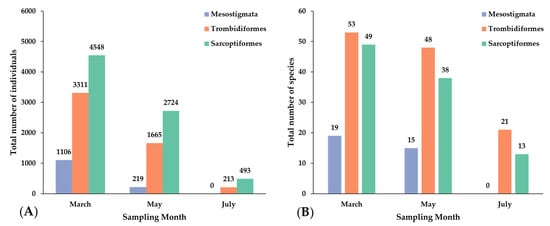
Figure 3.
(A) Total abundance and (B) species richness of moss-dwelling mites per order and sampling month.
The chord diagram (Figure A1) revealed distinct associations between mite families and sampling months. Several families were predominantly associated with a single month, while others were more evenly distributed across multiple months. In March, families such as Tydeidae, Eupodidae, Tectocepheidae, Brachychthoniidae, Oppiidae and Zeconidae were dominant, whereas May was characterized by higher abundances of Oribatulidae and Tydeidae. July showed contributions from fewer families, but with strong representation of Nanorchestidae and Oribatulidae. Overall, the visualization highlights temporal shifts in the composition of mite families across the sampling period.
At species level, B. volgini was the eudominant species in March and May, Oribatula tibialis (Nicolet, 1855) (Oribatulidae) in May and July, and Caenonychus sp. (Nanorchestidae) in July. Regarding frequency, several species were euconstant in March, Paragamasus sp. (Parasitidae), E. voxencollinus and X. ereynetoidalis, B. volgini, N. arboriger, C. voigtsi, Rhinoppia obsoleta (Paoli, 1908) (Oppiidae), O. tibialis, and Suctobelbella subtrigona (Oudemans, 1916) (Suctobelbidae). O. tibialis and Caenonychus sp. were euconstant in May and July, respectively (Table 1).

Table 1.
Moss-dwelling species with the highest dominance (D ≥ 5%) and frequency (C ≥ 50%) in each sampling month.
3.2. α-Diversity, Rarefaction and Sample Coverage
Sample-based estimates of diversity revealed significant (non-overlapping 95% CI) temporal variation. Species richness (q = 0) per sample was highest in March (28.88, 95% CI: 26.52–31.27), intermediate in May (16.84, 95% CI: 14.88–18.80), and lowest in July (4.28, 95% CI: 3.44–5.18). Shannon and Simpson diversity followed similar trends. Shannon (q = 1) estimates: March 15.14, 95% CI: 13.87–16.45; May 8.80, 95% CI: 7.90–9.80; July 3.10, 95% CI: 2.49–9.78. Simpson (q = 2) estimates: March 10.08, 95% CI: 9.07–11.12; May 5.85, 95% CI: 5.25–6.50; July 2.56, 95% CI: 2.06–3.13 (Figure 4).
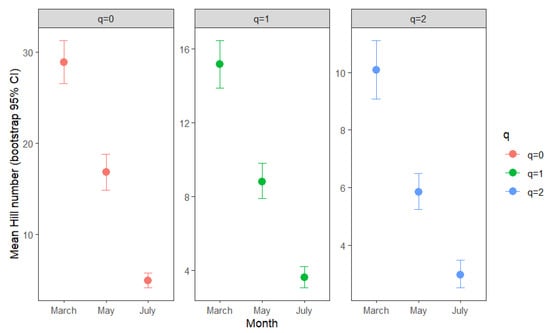
Figure 4.
Sample-based estimates of Hill numbers (q = 0, species richness; q = 1, Shannon diversity; q = 2, Simpson diversity) for mite assemblages in moss samples collected in March, May, and July. Points represent mean values per month, and error bars indicate 95% bootstrap confidence intervals. Each panel corresponds to a different diversity order.
Sample-size-based rarefaction and extrapolation curves (Figure 5) confirmed these patterns. Sampling coverage (Figure 6) was high across all months (March 99.8%, May 99.8%, July 98.9%), indicating that the observed patterns reflect true ecological differences rather than undersampling. Asymptotic estimates of Hill numbers (Table 2) further supported the conclusion that community diversity declined from spring to summer.
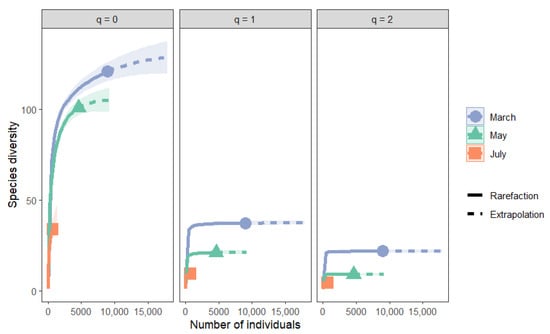
Figure 5.
Sample-size-based rarefaction and extrapolation curves for Hill numbers (q = 0, species richness; q = 1, Shannon diversity; q = 2, Simpson diversity) in moss-dwelling mite assemblages collected in March, May, and July. Solid lines represent rarefaction curves, dashed lines indicate extrapolation, and shaded ribbons denote 95% confidence intervals.
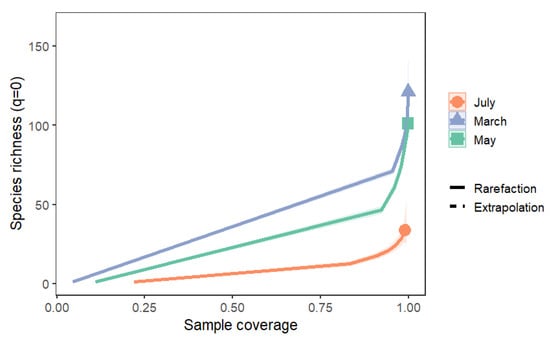
Figure 6.
Coverage-based rarefaction and extrapolation curves (q = 0, species richness) for mite assemblages in March, May, and July. Solid lines represent rarefaction curves, dashed lines represent extrapolation, and shaded areas denote 95% confidence intervals.
Table 2.
Observed and asymptotic diversity estimates (q = 0, 1, 2) with standard errors (s.e.) and 95% confidence intervals for mite assemblages collected in March, May, and July. Values are based on pooled data per month.
3.3. β-Diversity, Shared and Unique Species
PCoA ordination showed a clear separation of mite assemblages among months (Figure 7). Partitioning of β-diversity revealed that turnover accounted for the majority of community differences (82.1%), while nestedness contributed less (17.9%). The PERMANOVA test confirmed significant differences in community composition among months (F = 31.251, R2 = 0.31, p = 0.001), indicating that sampling month explained approximately 31% of the variation in assemblage structure. The remaining unexplained variation (69%) likely reflects within-month heterogeneity among moss microhabitats and stochastic processes such as small-scale environmental fluctuations and dispersal dynamics.
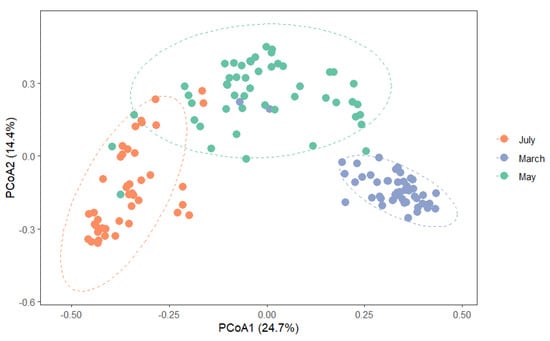
Figure 7.
Principal Coordinates Analysis (PCoA) ordination based on Bray–Curtis dissimilarities of mite assemblages. Points represent samples, and ellipses denote 95% confidence regions around group centroids for each month.
UpSet and Venn diagrams indicated that 30 species were shared across all three months, whereas 30 (March), 9 (May), and 3 (July) species were unique to individual sampling month (Figure 8). The UpSet visualization further highlighted the largest overlaps between March and May.
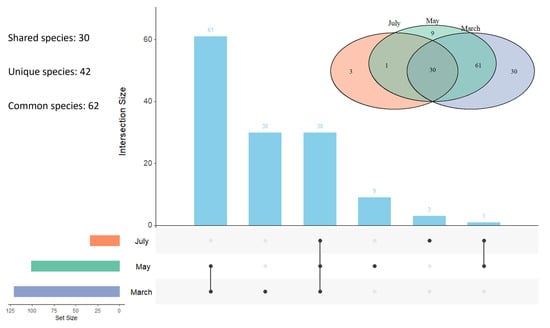
Figure 8.
Shared, unique and common species of moss-dwelling mites among sampling months. Venn diagram (above) and UpSet plot (below) illustrate species shared across and unique to March, May, and July. Vertical bars represent the number of species in each intersection, while horizontal bars indicate the total number of species per month.
3.4. Indicator Species Analysis
The IndVal analysis identified 83 species as significant indicators (p < 0.05) (Supplementary Table S3). Among them, 12 were strong indicators (IndVal > 0.7) for March, one for May, 4 for March–May and one for May–July (Table 3). These species can be considered characteristic of specific seasonal conditions in the forest moss microhabitats.
Table 3.
Indicator Species Analysis (IndVal) results for moss-dwelling mite assemblages across sampling months. Only strong indicator species are shown, with their specificity (A), fidelity (B), overall IndVal, and p-values.
3.5. Functional Composition of Moss-Dwelling Mite Assemblages
The two-dimensional NMDS ordination provided a good representation of the functional composition of mite assemblages (stress = 0.121). Samples clustered according to sampling month, with partial overlap among groups (Figure 9). PERMANOVA indicated a significant effect of sampling month on mite community composition (F = 49.042, R2 = 0.41, p = 0.001). The envfit analysis revealed significant associations between community functional structure and trophic group abundances. Predators (R2 = 0.16, p = 0.001), omnivores (R2 = 0.30, p = 0.001) and fungivores/microbivores (R2 = 0.23, p = 0.001) were positively correlated with axis 2. Herbivores/algivores showed a weaker but significant contribution (R2 = 0.06, p = 0.012). These results indicate that differences in the relative importance of trophic guilds underline temporal changes in functional community composition.
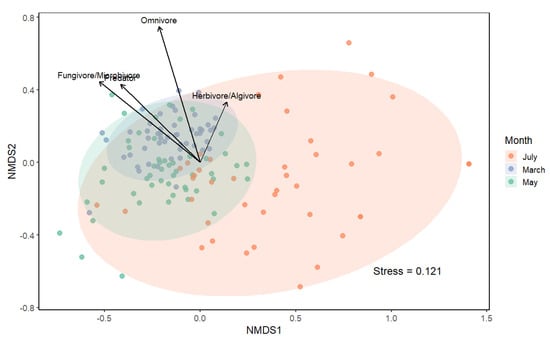
Figure 9.
Non-metric multidimensional scaling (NMDS) ordination of moss-dwelling mite communities based on trophic guild abundances (Bray–Curtis distance). Points represent individual samples, ellipses denote 95% confidence intervals for each month, and vectors show trophic groups fitted by envfit.
In March, mite communities were dominated by omnivores (42.82%), followed by fungivores/microbivores (29.50%) and predators (18.59%). In May, this pattern was reversed, with fungivores/microbivores prevailing (47.70%), omnivores ranking second (27.37%), and predators further decreasing (13.95%). Herbivores/algivores exhibited similar proportions in both months (9.08% and 10.98%, respectively). In July, however, herbivorous/algivorous mites accounted for the largest share of the community (43.06%), followed by fungivores/microbivores (30.88%), predators (16.43%), and omnivores (9.63%) (Figure 10).
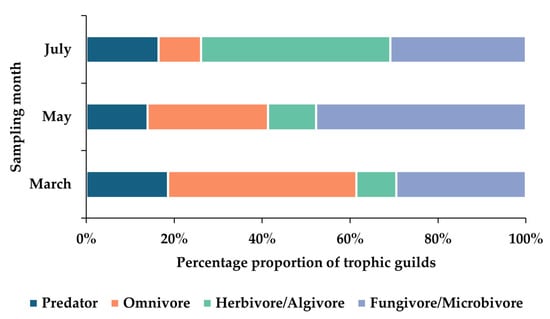
Figure 10.
Relative abundance of trophic guilds of moss-dwelling mites across sampling months (March, May, July). Bars represent the proportional contribution of each trophic group (Predator, Omnivore, Herbivore/Algivore, Fungivore/Microbivore) to the total community in each month.
4. Discussion
This study revealed a remarkably high diversity of moss-dwelling mites in the Kaisariani Aesthetic Forest, with 134 species recorded, 57 of which represent new records for the Greek fauna. Such findings highlight the importance of bryophytes as reservoirs of cryptic biodiversity, even within peri-urban Mediterranean forests. The high number of new records underscores the insufficient sampling effort historically devoted to bryophyte-associated microarthropods in Greece.
The majority of species recorded with highest dominance and frequency in the present study are widely distributed taxa, reflecting the generalist nature of moss-dwelling mite communities in Mediterranean forests. The Holarctic species L. brevis, O. tibialis, and S. subtrigona, together with the Palaearctic C. voigtsi, R. obsoleta, and T. alatus, are euryoecious, primarily silvicolous oribatid mites commonly associated with soil, mosses, and leaf litter [84,85,86]. Their presence suggests that the Kaisariani Aesthetic Forest provides suitable microhabitats that can sustain a diverse set of forest-associated taxa despite its peri-urban context.
The Palaearctic xerothermophilic J. frondeus and the cosmopolitan T. velatus, both frequently recorded in forested as well as urban and disturbed environments [84,85,86,87], were among the most abundant species, further supporting the idea that eurytopic taxa are particularly successful under the mosaic conditions of peri-urban landscapes.
Similarly, the Palaearctic B. sarekensis, typically inhabiting soil and litter in coniferous forests, and the cosmopolitan N. arboriger, a habitat generalist occurring from sandy dunes to forest floors [88], reflect the broad ecological tolerance characterizing much of the assemblage. The Holarctic E. voxencollinus and the Palaearctic L. motatorius, both common species preferring mosses and lichens [89,90], underline the importance of bryophytes as key microhabitats for mite diversity in Mediterranean forests. The cosmopolitan predator S. cronini, found on plants and within the soil–litter layer [55], also highlights the structural connectivity between vegetation strata.
By contrast, a few species exhibited a more restricted biogeographic range. The moss-inhabiting B. volgini, F. filiformis, and X. ereynetoidalis are known only from Central European countries [57,89], whereas P. bulbiferus and Z. salebrosus have been reported exclusively from the Mediterranean region [48,56]. Their presence in the study area may indicate either local refugial populations or the existence of suitable microclimatic niches within the forest, emphasizing the biogeographic uniqueness of Mediterranean bryophyte assemblages.
Seasonal trends were pronounced, with both abundance and diversity declining sharply from early spring to midsummer, reflecting the progressive aridification typical of Mediterranean climates. Similar seasonal patterns have been observed in temperate and boreal systems, but the decline in summer was more drastic here, consistent with the stronger climatic constraints typical of Mediterranean environments. High diversity of Oribatida and Mesostigmata has been reported from moss/litter habitats in humid areas with temperature around 15 °C [14,15,18,91,92,93]. In German forests, Wenher et al. [18] observed pronounced seasonal changes in the abundance, species richness, and diversity of oribatid mites, which were more evident in moss than in dead wood or litter, whereas Gergócs et al. [92] found temperature-driven changes mainly in moss rather than litter communities. Experimental manipulations further demonstrate that warming reduces Prostigmata abundance, whereas increased precipitation favors overall mite abundance in the soil–litter layer [94].
In Mediterranean systems, amplified drought in French forests led to a reduction in soil oribatid mite abundance across all forest types (Quercus pubescens Willd., Q. ilex L. or P. halepensis), whereas a marked decline in predatory mites was recorded in Q. ilex forest [95]. In the present study, the Mesostigmata were the group most affected by summer aridity, disappearing completely from July samples, a pattern also observed in areas reforested with conifers and in natural shrublands in Spain [96]. Likewise, seasonal fluctuations in mesofaunal communities have been attributed to spring increases in mesostigmatic and other predatory arthropods, whereas experimental drought led to a marked decrease in their abundance in a Mediterranean forest of the Iberian Peninsula [97].
The ordination and β-diversity analyses confirmed substantial community turnover, indicating that seasonal shifts are driven more by species replacement than by nestedness effects. The nematophagous zerconids and Paragamasus sp. [98,99], which were abundant and served as strong indicator taxa in March, showed a gradual decline over the following months. This trend is most likely associated with a reduction in the availability of their prey, eventually leading either to their disappearance from the samples or to a downward migration into deeper soil layers during the hot and dry summer period [96]. Their decline was accompanied by the emergence of other generalist predatory groups, including Adamystidae, Anystidae, Caligonellidae and Raphignathidae, which appear to be better adapted to hot and dry conditions [44].
The Rhagidiidae provide another striking example: although represented by six species in March, they almost entirely disappeared from subsequent samples. These mites, which feed mainly on collembolans, are considered psychrophilic and adapted to arctic environments, suggesting that conditions in March were already close to the lower limit of their developmental tolerance [100].
Species turnover was also evident within the same family. For instance, the tydeid B. volgini accounted for 12.3% of the total mite individuals in March and 13.35% in May, but only a single specimen was collected in July. In contrast, B. oleae (Panou & Emmanouel, 1996) was absent in March and occurred only in the May and July samples.
The family Nanorchestidae is of particular interest, represented in the samples by two species: N. arboriger and Caenonychus (=Speleorchestes) sp. The former was dominant and a strong indicator in March, declined to subdominant in May, and was absent in July. In contrast, the latter followed the opposite trend, occurring as recedent in March, dominant in May, and superdominant (42.78%) in July, serving as a strong indicator for the May–July period. This turnover likely reflects differences in thermal tolerance and ecological specialization between the two taxa, with N. arboriger favored under the cooler spring conditions, as members of this genus are typically adapted to cold and even polar environments, whereas Caenonychus sp. appears better adapted to the hotter and drier summer conditions, being frequently reported as abundant in arid desert habitats [101,102,103].
At the functional level, mite assemblages exhibited clear temporal restructuring. Omnivorous taxa of the superfamilies Eupodoidea (Eupodidae, Cocceupodidae), Tydeoidea (Tydeidae, Triophtydeidae, Iolinidae), and Oppioidea (Oppiidae, Suctobelbidae, Quadroppiidae) dominated in early spring, likely benefiting from high resource availability. Eupodoids are highly flexible feeders, consuming mosses, fungi, nematodes, and springtails [44,104,105]. Tydeoids exploit similarly broad resource base, feeding on fungi, pollen, plant tissue, arthropod eggs, and other mites and nematodes [44]. Oppioids are primarily fungivorous but can also prey on nematodes [44,67].
Fungivorous/microbivorous mites represented a larger proportion of assemblages in May, mainly due to the increased abundance of several oribatid species, including O. tibialis, C. voigtsi, C. lanatus, and J. frondeus. These species are considered secondary consumers, feeding mainly on fungi, and are typically associated with dry habitats [44,69,106,107]. By July, herbivores/algivores prevailed, particularly the algivorous Caenonychus sp., possibly exploiting biological soil crusts—complex assemblages of bacteria, cyanobacteria, algae, fungi, lichens, and mosses formed under arid and semiarid conditions [108,109]. This trophic succession suggests that resource availability and microclimatic conditions are key determinants of functional composition.
From a conservation perspective, the detection of numerous new species records emphasizes the need to protect bryophyte-rich habitats within Mediterranean forests, especially under ongoing urbanization and climate change [17]. Bryophytes provide microclimatic buffering and refugia for sensitive invertebrate taxa, and maintaining their integrity is critical for sustaining soil microarthropod diversity [4].
Nevertheless, some limitations should be acknowledged. The study spanned a single year with only three sampling events, leaving interannual variability unexplored. Future research should incorporate multi-year sampling and fine-scale measurements of microclimatic conditions within moss patches. Stable isotope approaches (15N/14N, 13C/12C) could also enhance functional classifications, particularly for poorly known oribatid taxa [106,107].
5. Conclusions
In conclusion, the present study demonstrates that mite assemblages in Mediterranean forest mosses exhibit clear temporal patterns in diversity, community composition, and functional structure. Our findings partly supported the proposed hypotheses. Mite abundance and species richness were highest in early spring and declined toward summer, consistent with the expected effects of increasing aridity in Mediterranean habitats. Community composition changed significantly across months, and β-diversity partitioning confirmed that temporal differences were mainly driven by species turnover rather than nestedness, suggesting species replacement rather than simple loss. Moreover, the relative contribution of trophic guilds shifted seasonally, reflecting functional responses to changing environmental conditions and resource availability. Overall, our findings emphasize that mosses act as important microhabitats sustaining diverse mite assemblages and that temporal sampling is crucial for capturing their ecological dynamics and functional variability of these microarthropod communities in Mediterranean ecosystems.
Supplementary Materials
The following supporting information can be downloaded at: https://www.mdpi.com/article/10.3390/f16111636/s1, Figure S1: Daily temperature (°C) and daily precipitation (mm) of the study area during February–July 2020. Meteorological data were obtained from the nearest weather station (Imittos-Dafni, code: LG0G, 37°56′50″ N 23°44′53″ E, 125 m); Table S1. Monthly temperature (°C) and precipitation (mm) of the study area during 2016–2025. Meteorological data were obtained from the nearest weather station (Imittos-Dafni, code: LG0G, 37°56′50″ N 23°44′53″ E, 125 m); Table S2. Classification of moss-dwelling mite species found during study into trophic guilds; Table S3: Results of the Indicator Species Analysis (IndVal) for moss-dwelling mite assemblages across sampling months. For each species, the IndVal statistic is decomposed into its A component (specificity: probability that the surveyed site belongs to the target month given the species is present) and B component (fidelity: probability of finding the species in sites of the target month). The overall IndVal value and permutation-based significance level (p-value) are also provided. Only species with significant (p < 0.05) associations are presented.
Author Contributions
Conceptualization, T.S.; methodology, T.S. and E.P.; formal analysis, T.S.; investigation, T.S., X.K. and N.K.; resources, T.S. and E.P.; data curation, T.S.; writing—original draft preparation, T.S.; writing—review and editing, T.S., X.K., N.K. and E.P.; visualization, T.S.; supervision, T.S. and E.P. All authors have read and agreed to the published version of the manuscript.
Funding
This research received no external funding.
Data Availability Statement
The datasets used and analyzed during the current study are available from the corresponding author upon reasonable request.
Conflicts of Interest
The authors declare no conflicts of interest.
Appendix A
Table A1.
Moss-dwelling mite species found during study. n: total number of individuals collected per treatment. Dominance (D) categories: eudominant (>10%); dominant (5–10%); subdominant (1.00–4.99%); recedent (0.5–0.99%); subrecedent (0.01–0.49%). Frequency (C) categories: euconstant (75–100%); constant (50–75%); accessory (25–50%); accidental (0.1–25%).
| March | May | July | ||||||||
|---|---|---|---|---|---|---|---|---|---|---|
| Family | Species | n | D | C | n | D | C | n | D | C |
| Order Mesostigmata | ||||||||||
| Ascidae | Arctoseius minutus (Halbert, 1915) | 18 | 0.20 | 10 | - | - | - | - | - | - |
| Epicriidae | Epicrius fungulatus Athias-Henriot, 1961 | 19 | 0.21 | 24 | 2 | 0.04 | 2 | - | - | - |
| Laelapidae | Androlaelaps shealsi Costa, 1968 | 11 | 0.12 | 12 | 14 | 0.30 | 24 | - | - | - |
| Geolaelaps aculeifer (Canestrini, 1884) | 8 | 0.09 | 10 | 9 | 0.20 | 4 | - | - | - | |
| Geolaelaps sp. | 9 | 0.10 | 12 | 22 | 0.48 | 4 | - | - | - | |
| Parasitidae | Holoparasitus kerkirensis Witalinski & Skorupski, 2002 | 31 | 0.35 | 42 | 28 | 0.61 | 20 | - | - | - |
| Paragamasus sp. | 236 | 2.63 | 84 | 26 | 0.56 | 18 | - | - | - | |
| Phytoseiidae | Amblyseius nemorivagus Athias-Henriot, 1961 | 1 | 0.01 | 2 | 46 | 1.00 | 28 | - | - | - |
| Graminaseius sp. | - | - | - | 3 | 0.07 | 4 | - | - | - | |
| Neoseiulus barkeri (Hughes, 1948) | 1 | 0.01 | 2 | - | - | - | - | - | - | |
| Neoseiulus neomarginatus Stathakis, Kapaxidi & Papadoulis, 2013 | 4 | 0.04 | 8 | 7 | 0.15 | 8 | - | - | - | |
| Proprioseiopsis messor (Wainstein, 1960) | 1 | 0.01 | 2 | - | - | - | - | - | - | |
| Rhodacaridae | Dendroseius reticulatus (Sheals, 1956) | 30 | 0.33 | 14 | - | - | - | - | - | - |
| Rodacarellus francescae Athias-Henriot, 1961 | 2 | 0.02 | 2 | 6 | 0.13 | 8 | - | - | - | |
| Rodacarus reconditus Athias-Henriot, 1961 | 2 | 0.02 | 4 | - | - | - | - | - | - | |
| Veigaiidae | Veigaia nemorensis (Koch, 1839) | 64 | 0.71 | 40 | 22 | 0.48 | 10 | - | - | - |
| Veigaia exigua (Berlese, 1916) | 102 | 1.14 | 40 | 23 | 0.50 | 10 | - | - | - | |
| Zerconidae | Prozercon bulbiferus Ujvari, 2011 | 416 | 4.64 | 70 | 1 | 0.02 | 2 | - | - | - |
| Zercon cretensis Ujvari, 2008 | 52 | 0.58 | 46 | 7 | 0.15 | 12 | - | - | - | |
| Zercon salebrosus Blaszak, 1979 | 99 | 1.10 | 64 | 3 | 0.07 | 6 | - | - | - | |
| Order Trombidiformes, Suborder Sphaerolichida | ||||||||||
| Sphaerolichidae | Sphaerolichus barbarus Grandjean, 1939 | - | - | - | 2 | 0.04 | 4 | - | - | - |
| Order Trombidiformes, Suborder Prostigmata | ||||||||||
| Adamystidae | Adamystis fonsi Coineau, 1974 | - | - | - | - | - | - | 5 | 0.71 | 6 |
| Anystidae | Anystis baccarum (Linnaeus, 1758) | 3 | 0.03 | 6 | 3 | 0.07 | 6 | - | - | - |
| Erythracarus pyrrholeucus (Hermann, 1804) | 2 | 0.02 | 4 | 9 | 0.20 | 14 | 12 | 1.70 | 16 | |
| Bdellidae | Bdella muscorum Ewing, 1909 | 10 | 0.11 | 18 | - | - | - | - | - | - |
| Cyta coerulipes (Dugès, 1834) | 16 | 0.18 | 16 | 32 | 0.69 | 34 | 7 | 0.99 | 14 | |
| Hexabdella unusoculata Van der Schyff, Theron & Ueckermann, 2004 | 18 | 0.20 | 10 | 14 | 0.30 | 12 | 1 | 0.14 | 2 | |
| Odontoscirus communis (Atyeo, 1960) | 15 | 0.17 | 26 | 54 | 1.17 | 46 | 3 | 0.42 | 2 | |
| Spinibdella cronini (Baker & Balock, 1944) | 227 | 2.53 | 64 | 117 | 2.54 | 74 | 24 | 3.40 | 14 | |
| Caeculidae | Caeculidae sp. | 2 | 0.02 | 2 | 2 | 0.04 | 4 | - | - | - |
| Caligonellidae | Caligonella humilis (Koch, 1838) | 2 | 0.02 | 4 | 3 | 0.07 | 6 | 4 | 0.57 | 6 |
| Neognathus terrestris (Summers & Schlinger, 1955) | 1 | 0.01 | 2 | 16 | 0.35 | 18 | 7 | 0.99 | 10 | |
| Cocceupodidae | Cocceupodes mollicellus (Koch, 1838) | 4 | 0.04 | 6 | 3 | 0.07 | 4 | - | - | - |
| Filieupodes filiformis Jesionowska, 2010 | 143 | 1.60 | 62 | 17 | 0.37 | 8 | - | - | - | |
| Filieupodes filistellatus Jesionowska, 2010 | 29 | 0.32 | 26 | 2 | 0.04 | 2 | - | - | - | |
| Filieupodes strandtmanni (Abou-Awad & El-Bagoury, 1984) | 15 | 0.17 | 20 | 5 | 0.11 | 4 | - | - | - | |
| Linopodes motatorius (Linnaeus, 1758) | 68 | 0.76 | 50 | 10 | 0.22 | 10 | - | - | - | |
| Cryptognathidae | Favognathus sp. | 1 | 0.01 | 2 | - | - | - | - | - | - |
| Cunaxidae | Cunaxa capreolus (Berlese, 1890) | 1 | 0.01 | 2 | 3 | 0.07 | 6 | 10 | 1.42 | 10 |
| Cunaxa polita Kazmierski & Ripka, 2015 | 37 | 0.41 | 26 | 33 | 0.72 | 30 | 22 | 3.12 | 30 | |
| Cunaxoides desertus Kuznetzov & Livshitz, 1979 | - | - | - | 2 | 0.04 | 2 | - | - | - | |
| Cunaxoides paracroceus Sionti & Papadoulis, 2003 | 6 | 0.07 | 8 | 6 | 0.13 | 8 | - | - | - | |
| Puleus semistriatus Sergeyenko, 2011 | - | - | - | 1 | 0.02 | 2 | - | - | - | |
| Ereynetidae | Ereynetes sp. | 21 | 0.23 | 22 | - | - | - | - | - | - |
| Erythraeidae | Curteria sp. | 1 | 0.01 | 2 | - | - | - | - | - | - |
| Balaustium akramii Noei, 2017 | 5 | 0.06 | 10 | 8 | 0.17 | 14 | - | - | - | |
| Erythraeus budapestensis Fain & Ripka, 1998 | 54 | 0.60 | 14 | 7 | 0.15 | 12 | 1 | 0.14 | 2 | |
| Hauptmannia sp. | 1 | 0.01 | 2 | - | - | - | - | - | - | |
| Leptus sp. | - | - | - | - | - | - | 3 | 0.42 | 6 | |
| Eupodidae | Eupodes voxencollinus Thor, 1934 | 285 | 3.18 | 90 | 199 | 4.32 | 66 | - | - | - |
| Pseudoeupodes porosus Khaustov, 2014 | 82 | 0.91 | 44 | - | - | - | - | - | - | |
| Xerophiles ereynetoidalis Jesionowska, 2003 | 269 | 3.00 | 80 | 51 | 1.11 | 26 | - | - | - | |
| Iolinidae | Microtydeus beltrani Baker, 1944 | 358 | 3.99 | 42 | 64 | 1.39 | 28 | - | - | - |
| Paratydaeolus loadmani (Wood, 1965) | 21 | 0.23 | 12 | 5 | 0.11 | 8 | - | - | - | |
| Tydaeolus tenuiclaviger (Thor, 1931) | 1 | 0.01 | 2 | 16 | 0.35 | 14 | - | - | - | |
| Microspididae | Microdispus obovatus (Paoli, 1911) | 118 | 1.32 | 24 | - | - | - | - | - | - |
| Neopygmephoridae | Bakerdania sp. | 40 | 0.45 | 8 | - | - | - | - | - | - |
| Paratydeidae | Tanytydeus aegyptiacus (Soliman, 1974) | - | - | - | - | - | - | 1 | 0.14 | 2 |
| Penthaleidae | Penthaleus major (Dugès, 1834) | 13 | 0.15 | 14 | - | - | - | - | - | - |
| Pyemotidae | Pyemotes sp. | 1 | 0.01 | 2 | 1 | 0.02 | 2 | - | - | - |
| Raphignathidae | Raphignathus ensipilosus Smith-Meyer & Ueckermann, 1989 | - | - | - | 5 | 0.11 | 6 | - | - | - |
| Raphignathus hecmatanaensis Khanjani & Ueckermann, 2003 | 2 | 0.02 | 4 | 16 | 0.35 | 22 | 16 | 2.27 | 18 | |
| Rhagidiidae | Coccorhagidia clavifrons (Canestrini, 1886) | 19 | 0.21 | 20 | 1 | 0.02 | 2 | - | - | - |
| Parallelorhagidia evansi (Strandtmann & Prasse, 1977) | 2 | 0.02 | 4 | - | - | - | - | - | - | |
| Poecilophysis pratensis (Koch, 1835) | 19 | 0.21 | 28 | 1 | 0.02 | 2 | - | - | - | |
| Poecilophysis pseudoreflexa Zacharda, 1980 | 8 | 0.09 | 14 | 1 | 0.02 | 2 | - | - | - | |
| Rhagidia gigas (Canestrini, 1886) | 9 | 0.10 | 14 | - | - | - | - | - | - | |
| Sigthoria brevisensilla (Zacharda, 1980) | 1 | 0.01 | 2 | - | - | - | - | - | - | |
| Scutacaridae | Scutacarus laetificus Rack, 1966 | 42 | 0.47 | 20 | - | - | - | - | - | - |
| Siteroptidae | Neositeroptes sp. | 5 | 0.06 | 10 | 3 | 0.07 | 6 | 29 | 4.11 | 4 |
| Stigmaeidae | Eustigmaeus plumifer (Halbert, 1923) | 24 | 0.27 | 8 | 2 | 0.04 | 2 | - | - | - |
| Ledermuelleriopsis sp. | 26 | 0.29 | 30 | 55 | 1.19 | 36 | 2 | 0.28 | 2 | |
| Stigmaeus kochi Stathakis, Kapaxidi & Papadoulis, 2019 | 2 | 0.02 | 4 | 3 | 0.07 | 4 | - | - | - | |
| Storchia robusta (Berlese, 1885) | - | - | - | 3 | 0.07 | 6 | - | - | - | |
| Tarsonemidae | Tarsonemus sp. | 14 | 0.16 | 10 | 4 | 0.09 | 8 | - | - | - |
| Triophtydeidae | Pseudotriophtydeus vegei André, 1980 | 105 | 1.17 | 38 | 119 | 2.58 | 42 | 35 | 4.96 | 28 |
| Triophtydeus triophthalmus (Oudemans, 1929) | 4 | 0.04 | 6 | 20 | 0.43 | 12 | 4 | 0.57 | 6 | |
| Trombidiidae | Allothrobium fuliginosum (Hermann, 1804) | 33 | 0.37 | 42 | 32 | 0.69 | 34 | - | - | - |
| Tydeidae | Brachytydeus maga (Kuznetzov, 1973) | 5 | 0.06 | 10 | 42 | 0.91 | 34 | 19 | 2.69 | 18 |
| Brachytydeus oleae (Panou & Emmanouel, 1996) | - | - | - | 29 | 0.63 | 22 | 7 | 0.99 | 10 | |
| Brachytydeus sigthori (Baker, 1944) | 18 | 0.20 | 12 | 1 | 0.02 | 2 | - | - | - | |
| Brachytydeus volgini (Kuznetzov, 1973) | 1103 | 12.30 | 90 | 615 | 13.35 | 60 | 1 | 0.14 | 2 | |
| Brachytydeus woolleyi (Baker, 1968) | - | - | - | 4 | 0.09 | 6 | - | - | - | |
| Paralorryia sp. | - | - | - | 24 | 0.52 | 14 | - | - | - | |
| Order Sarcoptiformes, Suborder Endeostigmata | ||||||||||
| Alicorhagiidae | Alicorhagia usitata Théron, Meyer & Ryke, 1970 | 30 | 0.33 | 20 | - | - | - | - | - | - |
| Alycidae | Amphialycus oblongus (Halbert, 1920) | 11 | 0.12 | 14 | 41 | 0.89 | 32 | - | - | - |
| Laminamichaelia arbusculosa (Grandjean, 1942) | 17 | 0.19 | 12 | - | - | - | - | - | - | |
| Bimichaelia sarekensis Tragardh, 1910 | 118 | 1.32 | 52 | 4 | 0.09 | 6 | - | - | - | |
| Pachygnathus villosus Dugês, 1836 | 54 | 0.60 | 42 | 9 | 0.20 | 8 | - | - | - | |
| Nanorchestidae | Nanorchestes arboriger (Berlese, 1904) | 558 | 6.22 | 80 | 94 | 2.04 | 38 | - | - | - |
| Caenonychus sp. | 39 | 0.44 | 26 | 347 | 7.53 | 64 | 302 | 42.78 | 84 | |
| Order Sarcoptiformes, Suborder Oribatida | ||||||||||
| Acaridae | Acotyledon sp. | 37 | 0.41 | 26 | 4 | 0.09 | 8 | 1 | 0.14 | 2 |
| Adelphacaridae | Aphelacarus acarinus (Berlese, 1910) | 7 | 0.08 | 12 | 9 | 0.20 | 12 | 21 | 2.97 | 22 |
| Aleurodamaeidae | Aleurodamaeus setosus (Berlese, 1883) | 1 | 0.01 | 2 | - | - | - | - | - | - |
| Brachychthoniidae | Liochthonius brevis (Michael, 1888) | 487 | 5.43 | 70 | 6 | 0.13 | 6 | - | - | - |
| Liochthonius strenzkei Forsslund, 1963 | 83 | 0.93 | 32 | 5 | 0.11 | 8 | - | - | - | |
| Sellnickochthonius rostratus (Jacot, 1936) | 17 | 0.19 | 14 | - | - | - | - | - | - | |
| Sellnickochthonius meridionalis (Bernini, 1973) | 24 | 0.27 | 10 | - | - | - | - | - | - | |
| Sellnickochthonius aokii (Chinone, 1974) | 18 | 0.20 | 12 | - | - | - | - | - | - | |
| Ceratozetidae | Trichoribates sp. | 1 | 0.01 | 2 | 1 | 0.02 | 2 | - | - | - |
| Latilamellobates naltschicki Shaldybina, 1971 | 9 | 0.10 | 8 | 8 | 0.17 | 8 | - | - | - | |
| Chamobatidae | Chamobates voigtsi (Oudemans, 1902) | 248 | 2.77 | 82 | 214 | 4.64 | 74 | 2 | 0.28 | 4 |
| Cosmochthoniidae | Cosmochthonius lanatus (Michael, 1885) | 10 | 0.11 | 14 | 118 | 2.56 | 46 | 6 | 0.85 | 12 |
| Ctenacaridae | Ctenacarus araneola (Grandjean, 1932) | 2 | 0.02 | 2 | - | - | - | - | - | - |
| Damaeidae | Belba dubinini Bulanova-Zachvatkina, 1962 | 56 | 0.62 | 40 | 35 | 0.76 | 30 | 1 | 0.14 | 2 |
| Damaeolidae | Damaeolus ornatissimus Csiszár, 1962 | 18 | 0.20 | 4 | - | - | - | - | - | - |
| Damaeolus asperatus (Berlese, 1904) | 6 | 0.07 | 6 | - | - | - | - | - | - | |
| Galumnidae | Acrogalumna longipluma (Berlese, 1904) | 5 | 0.06 | 8 | - | - | - | - | - | - |
| Pergalumna nervosa (Berlese, 1914) | 12 | 0.13 | 14 | 4 | 0.09 | 4 | 1 | 0.14 | 2 | |
| Galumna tarsipennata Oudemans, 1914 | 15 | 0.17 | 16 | 5 | 0.11 | 6 | - | - | - | |
| Gymnodamaeidae | Adrodamaeus femoratus (Koch, 1839) | 69 | 0.77 | 28 | 10 | 0.22 | 14 | - | - | - |
| Jacotella frondeus (Kulijev, 1979) | 35 | 0.39 | 32 | 271 | 5.88 | 66 | 26 | 3.68 | 22 | |
| Haplochthoniidae | Haplochthonius simplex (Willmann, 1930) | 13 | 0.15 | 4 | 6 | 0.13 | 10 | 11 | 1.56 | 8 |
| Histiostomatidae | Histiostoma sp. | 13 | 0.15 | 18 | 1 | 0.02 | 2 | - | - | - |
| Liacaridae | Liacarus coracinus (Koch, 1841) | 4 | 0.04 | 8 | 2 | 0.04 | 4 | - | - | - |
| Licnodamaeidae | Licnodamaeus pulcherrimus (Paoli, 1908) | - | - | - | 75 | 1.63 | 20 | - | - | - |
| Neoliodidae | Neoliodes theleproctus (Hermann, 1804) | 19 | 0.21 | 18 | 10 | 0.22 | 18 | 3 | 0.42 | 6 |
| Oppiidae | Berniniella sp. | 35 | 0.39 | 18 | 2 | 0.04 | 2 | - | - | - |
| Dissorhina ornata (Oudemans, 1900) | 61 | 0.68 | 18 | 1 | 0.02 | 2 | - | - | - | |
| Oppiella nova (Oudemans, 1902) | 12 | 0.13 | 10 | - | - | - | - | - | - | |
| Rhinoppia obsoleta (Paoli, 1908) | 597 | 6.66 | 84 | 17 | 0.37 | 14 | - | - | - | |
| Oribatulidae | Oribatula tibialis (Nicolet, 1855) | 240 | 2.68 | 90 | 1250 | 27.13 | 100 | 116 | 16.43 | 50 |
| Zygoribatula glabra (Michael, 1890) | 34 | 0.38 | 24 | 7 | 0.15 | 10 | - | - | - | |
| Phenopelopidae | Eupelops acromios (Hermann, 1804) | 16 | 0.18 | 18 | 4 | 0.09 | 8 | - | - | - |
| Peloptulus gibbus Mihelčič, 1857 | 3 | 0.03 | 4 | 10 | 0.22 | 2 | - | - | - | |
| Phthiracaridae | Steganacarus lasithiensis Mahunka, 1979 | 9 | 0.10 | 14 | 2 | 0.04 | 4 | - | - | - |
| Punctoribatidae | Punctoribates mundus Shaldybina, 1973 | 111 | 1.24 | 12 | - | - | - | - | - | - |
| Quadroppiidae | Quadroppia monstruosa Hammer, 1961 | 88 | 0.98 | 38 | 2 | 0.04 | 4 | - | - | - |
| Scheloribatidae | Scheloribates pallidulus (Koch, 1841) | 30 | 0.33 | 28 | 26 | 0.56 | 22 | - | - | - |
| Scutoverticidae | Scutovertex sculptus Michael, 1879 | 20 | 0.22 | 10 | 7 | 0.15 | 8 | 2 | 0.28 | 4 |
| Sphaerochthoniidae | Sphaerochthonius splendidus (Berlese, 1904) | 1 | 0.01 | 2 | 78 | 1.69 | 44 | - | - | - |
| Suctobelbidae | Suctobelbella subtrigona (Oudemans, 1916) | 436 | 4.86 | 88 | 5 | 0.11 | 6 | - | - | - |
| Tectocepheidae | Tectocepheus velatus (Michael, 1880) | 699 | 7.80 | 74 | 30 | 0.65 | 20 | 1 | 0.14 | 2 |
| Tectocepheus alatus Berlese, 1913 | 120 | 1.34 | 52 | 4 | 0.09 | 6 | - | - | - | |

Figure A1.
Chord diagram illustrating the associations between mite families and sampling months (March, May, July). The width of the links is proportional to the total abundance of individuals per family in each month. Labels for months are highlighted in bold, while families are displayed around the circle.
References
- Schwartzenberg, K. Moss biology and phytohormones-cytokinins in Physcomitrella. Plant Biol. 2006, 8, 382–388. [Google Scholar] [CrossRef]
- Glime, J.M. Physiological Ecology. In Bryophyte Ecology; Michigan Technological University: Houghton, MI, USA, 2017; Volume 1. [Google Scholar]
- Gerson, U. Bryophytes and Invertebrates. In Bryophyte Ecology; Smith, A.J.E., Ed.; Springer: Dordrecht, The Netherlands, 1982; pp. 291–332. [Google Scholar]
- Glime, J.M. Arthropods: Habitat Relations. In Bryophyte Ecology; Glime, J.M., Ed.; Bryological Interaction; Michigan Technological University: Houghton, MI, USA, 2017; Chapter 7-1; Volume 2, pp. 1–20. [Google Scholar]
- Gerson, U. Moss-Arthropod Associations. Bryologist 1969, 72, 495–500. [Google Scholar] [CrossRef]
- Glime, J.M. Arthropods: Mite Habitats, Minor Arachnids, and Myriapods. In Bryophyte Ecology; Glime, J.M., Ed.; Bryological Interaction; Michigan Technological University: Houghton, MI, USA, 2017; Chapter 9-2; Volume 2, pp. 1–56. [Google Scholar]
- Gulvik, M.E. Mites (Acari) as indicators of soil biodiversity and land use monitoring: A review. Pol. J. Ecol. 2007, 55, 415–440. [Google Scholar]
- Gergócs, V.; Hufnagel, L. Application of oribatid mites as indicators. Appl. Ecol. Environ. Res. 2009, 7, 79–98. [Google Scholar] [CrossRef]
- Sabbatini Peverieri, G.; Romano, M.; Pennacchio, F.; Nannelli, R.; Roversi, P.F. Gamasid soil mites (Arachnida Acari) as indicators of the conservation status of forests. Redia 2011, 94, 53–58. [Google Scholar]
- Manu, M.; Băncilă, R.I.; Bîrsan, C.C.; Mountford, O.; Onete, M. Soil mite communities (Acari: Mesostigmata) as indicators of urban ecosystems in Bucharest, Romania. Sci. Rep. 2021, 11, 3794. [Google Scholar] [CrossRef] [PubMed]
- Salmane, I.; Brumelis, G. The importance of the moss layer in sustaining biological diversity of Gamasina mites in coniferous forest soil. Pedobiologia 2008, 52, 69–76. [Google Scholar] [CrossRef]
- Arroyo, J.; Kenny, J.; Bolger, T. Variation between mite communities in Irish forest types–importance of bark and moss cover in canopy. Pedobiologia 2013, 56, 241–250. [Google Scholar] [CrossRef]
- Bokhorst, S.; Wardle, D.A.; Nilsson, M.-C.; Gundale, M.J. Impact of understory mosses and dwarf shrubs on soil micro-arthropods in a boreal forest chronosequence. Plant Soil 2014, 379, 121–133. [Google Scholar] [CrossRef]
- Seniczak, A.; Seniczak, S.; Iturrondobeitia, J.C.; Solhøy, T.; Flatberg, K.I. Diverse Sphagnum mosses support rich moss mite communities (Acari, Oribatida) in Mires of Western Norway. Wetlands 2020, 40, 1339–1351. [Google Scholar] [CrossRef]
- Seniczak, A.; Seniczak, S.; Starý, J.; Kaczmarek, S.; Jordal, B.H.; Kowalski, J.; Roth, S.; Djursvoll, P.; Bolger, T. High Diversity of mites (Acari: Oribatida, Mesostigmata) supports the high conservation value of a broadleaf forest in Eastern Norway. Forests 2021, 12, 1098. [Google Scholar] [CrossRef]
- Scarascia-Mugnozza, G.; Oswald, H.; Piussi, P.; Radoglou, K. Forests of the Mediterranean region: Gaps in knowledge and research needs. For. Ecol. Manag. 2000, 132, 97–109. [Google Scholar] [CrossRef]
- Peñuelas, J.; Sardans, J.; Filella, I.; Estiarte, M.; Llusià, J.; Ogaya, R.; Carnicer, J.; Bartrons, M.; Rivas-Ubach, A.; Grau, O.; et al. Impacts of global change on Mediterranean forests and their services. Forests 2017, 8, 463. [Google Scholar] [CrossRef]
- Wehner, K.; Heethoff, M.; Brückner, A. Seasonal fluctuation of oribatid mite communities in forest microhabitats. PeerJ 2018, 6, e4863. [Google Scholar] [CrossRef]
- Panou, H.N.; Emmanouel, N.G. New records of tydeid mites from Greece with description of Lorryia mantiniensis sp. nov. (Acari: Tydeidae). Int. J. Acarol. 1995, 21, 17–21. [Google Scholar] [CrossRef]
- Panou, H.N.; Emmanouel, N.G. Lorryia arkadiensis, a new species of tydeid mite from Greece (Acari: Prostigmata). Int. J. Acarol. 1995, 21, 217–221. [Google Scholar] [CrossRef]
- Papadoulis, G.T.; Emmanouel, N.G.; Kapaxidi, E.V. Phytoseiidae of Greece and Cyprus (Acari: Mesostigmata); Indira Publishing House: West Bloomfield, MI, USA, 2009; pp. 1–200. [Google Scholar]
- Mahunka, S.; Horváth, E.; Kontschán, J. Oribatid mites of the Balkan Peninsula (Acari: Oribatida). Opusc. Zool. Budapest 2013, 44, 11–96. [Google Scholar]
- Kontschán, J. Uropodina mites of the Balkan Peninsula (Acari: Mesostigmata). Opusc. Zool. Budapest 2013, 44, 97–131. [Google Scholar]
- Stathakis, T.I.; Kapaxidi, E.V.; Papadoulis, G.T. Two new species of the genus Neoseiulus Hughes (Acari: Phytoseiidae) from Greece with re-description of Neoseiulus leucophaeus (Athias-Henriot). Zootaxa 2013, 3681, 563–572. [Google Scholar] [CrossRef]
- Stathakis, T.I.; Kapaxidi, E.V.; Papadoulis, G.T. The genus Eustigmaeus Berlese (Acari: Stigmaeidae) from Greece. Zootaxa 2016, 4191, 1–102. [Google Scholar] [CrossRef] [PubMed]
- Stathakis, T.I.; Kapaxidi, E.V.; Papadoulis, G.T. The genus Stigmaeus Koch (Acari: Stigmaeidae) from Greece. Syst. Appl. Acarol. 2019, 24, 2010–2093. [Google Scholar] [CrossRef]
- Kritikou, M.; Mazi, A.-M.; Dimaki, M. Evaluation and Assessment of Biodiversity in the Wider Area of Kaisariani Aesthetic Forest Within the Natura 2000 Sites GR3000006 (Hymettus–Kaisariani Aesthetic Forest–Vouliagmeni Lake) and GR3000015 (Mount Hymettus); Natural Environment & Climate Change Agency (NECCA)–Management Unit of Parnitha National Park, Schinias and Saronic Gulf Protected Areas: Athens, Greece, 2022. [Google Scholar]
- NATURA 2000 Viewer. Available online: https://natura2000.eea.europa.eu/ (accessed on 14 September 2025).
- Athias-Henriot, C. Mediterranean Edaphic Mesostigmata (Urop. Excl.) (Acaromorpha, Anactinotrichida) (Collect. Prof. H. Franz et C. Athias-Henriot) First Serie. Acarologia 1961, 3, 381–509. [Google Scholar]
- Strandtmann, R.W. The eupodoid mites of Alaska (Acarina: Prostigmata). Pac. Insects 1971, 13, 75–118. [Google Scholar]
- Mahunka, S. Neue und interessante Milben aus dem Genfer Museum VIII. Tarsonemina-Arten (Acari) aus Griechenland. Biol. Gallo-Hell. 1974, 5, 209–225. [Google Scholar]
- Ghiljarov, M.S.; Krivolutskij, D.A. Opredelitel Obitajuščich v Počve Kleščej. Sarcoptiformes; Nauka: Moscow, Russia, 1975; pp. 1–492. [Google Scholar]
- Zacharda, M. Soil mites of the family Rhagidiidae (Actinedida: Eupodoidea). Morphology, systematics, ecology. Acta Univ. Carol. Biol. 1980, 5-6, 489–785. [Google Scholar]
- Balogh, J.; Mahunka, S. The Soil Mites of the World. Vol. 1. Primitive Oribatids of the Palearctic Region; Akadémiai Kiadó: Budapest, Hungary, 1983; pp. 1–372. [Google Scholar]
- Seniczak, S.; Solhøy, T. The morphology of juvenile stages of moss mites of the family Chamobatide Thor (Acarida: Oribatida), I. Ann. Zool. 1988, 41, 491–502. [Google Scholar]
- Karg, W. Raubmilben: Acari (Acarina), Milben Parasitiformes (Allactinochaeta) Cohors Gamasina Leach; Gustav Fischer Verlag: Jena, Germany, 1993; pp. 1–523. [Google Scholar]
- Pérez-Íñigo, C. Acari: Oribatei, Poronota. In Fauna Ibérica; Ramos, M.A., Ed.; Museo Nacional de Ciencias Naturales CSIC: Madrid, Spain, 1993; Volume 3, pp. 1–320. [Google Scholar]
- Pérez-Íñigo, C. Acari: Oribatei, Gymnonota I. In Fauna Ibérica; Ramos, M.A., Ed.; Museo Nacional de Ciencias Naturales CSIC: Madrid, Spain, 1997; Volume 9, pp. 1–373. [Google Scholar]
- Panou, E. Contribution to the Taxonomy and Study of the Feeding Habits of Tydeidae (Acari: Prostigmata) of Greece. Ph.D. Thesis, Agricultural University of Athens, Athens, Greece, 1998. [Google Scholar]
- Subías, L.S.; Arillo, A. Acari, Oribatei, Gymnonota II. Oppioidea. In Fauna Iberica; Ramos, M.A., Ed.; Museo Nacional de Ciencias Naturales CSIC: Madrid, Spain, 2001; Volume 15, pp. 1–289. [Google Scholar]
- Weigmann, G. Hornmilben (Oribatida). Die Tierwelt Deutschlands; Goecke and Evers: Keltern, Germany, 2006; Volume 76, pp. 1–520. [Google Scholar]
- Khaustov, A.A. Mites of the Family Scutacaridae of Eastern Palaearctic; Akademperiodyka: Kiev, Ukraine, 2008; pp. 1–291. [Google Scholar]
- Mašán, P.; Fenďa, P.; Mihál, I. New Edaphic mites of the genus Veigaia from Slovakia and Bulgaria, with a key to the European species (Acari, Mesostigmata, Veigaiidae). Zootaxa 2008, 1897, 1–19. [Google Scholar] [CrossRef]
- Krantz, G.W.; Walter, D.E. A Manual of Acarology, 3rd ed.; Texas Tech University Press: Lubbock, TX, USA, 2009; pp. 1–807. [Google Scholar]
- Jesionowska, K. Cocceupodidae, a new family of eupodoid mites, with description of a new genus and two new species from Poland. Part I. (Acari: Prostigmata: Eupodoidea). Genus 2010, 21, 637–658. [Google Scholar]
- Uusitalo, M. Terrestrial species of the genus Nanorchestes (Endeostigmata: Nanorchestidae) in Europe. In Trends in Acarology; Sabelis, M.W., Bruin, J., Eds.; Springer: Dordrecht, The Netherlands, 2010; pp. 161–166. [Google Scholar]
- Uusitalo, M. Revision of the Family Alycidae (Acariformes, Acari), with Special Reference to European Species. Ph.D. Thesis, University of Helsinki, Helsinki, Finland, 2010. [Google Scholar]
- Ujvári, Z. Six new species of Prozercon Sellnick, 1943 (Acari, Mesostigmata, Zerconidae) from Greece, with remarks on the genus. Zootaxa 2011, 2785, 1–31. [Google Scholar] [CrossRef]
- Seniczak, S.; Seniczak, A. Differentiation of external morphology of Damaeidae (Acari: Oribatida) in light of the ontogeny of three species. Zootaxa 2011, 2775, 1–36. [Google Scholar] [CrossRef]
- Pfingstl, T.; Krisper, G. No difference in the juveniles of two Tectocepheus species (Acari: Oribatida, Tectocepheidae). Acarologia 2011, 51, 199–218. [Google Scholar] [CrossRef][Green Version]
- Seniczak, S.; Seniczak, A. Differentiation of external morphology of Oribatulidae (Acari: Oribatida) in light of the ontogeny of three species. Zootaxa 2012, 3184, 1–34. [Google Scholar] [CrossRef]
- Abo-Shnaf, R.I.A.; Castilho, R.C.; Moraes, G.J. de Two new species of Rhodacaridae (Acari: Mesostigmata) from Egypt and a key to the species of the family from the Mediterranean region. Zootaxa 2013, 3718, 28–38. [Google Scholar] [CrossRef]
- Khaustov, A. A New genus and species in the mite family Eupodidae (Acari, Eupodoidea) from Crimea. ZooKeys 2014, 422, 11–22. [Google Scholar] [CrossRef]
- Skvarla, M.J.; Fisher, J.R.; Dowling, A. A Review of Cunaxidae (Acariformes, Trombidiformes): Histories and diagnoses of subfamilies and genera, keys to world species, and some new locality records. ZooKeys 2014, 418, 1. [Google Scholar] [CrossRef]
- Hernandes, F.A.; Skvarla, M.J.; Fisher, J.R.; Dowling, A.P.G.; Ochoa, R.; Ueckermann, E.A.; Bauchan, G.R. Catalogue of snout mites (Acariformes: Bdellidae) of the world. Zootaxa 2016, 4152, 1–83. [Google Scholar] [CrossRef] [PubMed]
- Karaca, M.; Urhan, R. Five new species of Zercon C. L. Koch, 1836 (Acari: Zerconidae) from Northwestern Turkey. Zootaxa 2016, 4127, 31–59. [Google Scholar] [CrossRef]
- Silva, G.L.D.; Metzelthin, M.H.; Silva, O.S.D.; Ferla, N.J. Catalogue of the mite family Tydeidae (Acari: Prostigmata) with the world key to the species. Zootaxa 2016, 4135, 1–68. [Google Scholar] [CrossRef]
- Makarova, O.L.; Huhta, V. A new species of Arctoseius Thor, 1930 (Acari: Ascidae) from taiga regions of the Palaearctic, with a key to Arctoseius species of Fennoscandia, NW Europe. Zootaxa 2017, 4268, 554–562. [Google Scholar] [CrossRef]
- Witaliński, W. Key to the world species of Holoparasitus Oudemans, 1936 (Acari: Parasitiformes: Parasitidae). Zootaxa 2017, 4277, 301–351. [Google Scholar] [CrossRef]
- Xu, S.-Y.; Yi, T.-C.; Guo, J.-J.; Jin, D.-C. The genus Erythraeus (Acari: Erythraeidae) from China with descriptions of two new species and a key to larval species of the genus worldwide</Strong. Zootaxa 2019, 4647, 54–82. [Google Scholar] [CrossRef]
- Mašán, P. A New wood-inhabiting mite species of the genus Dendroseius Karg, 1965 (Acari, Mesostigmata, Rhodacaridae) from Central Europe (Slovakia). ZooKeys 2020, 984, 49–57. [Google Scholar] [CrossRef]
- Šundić, M.; Noei, J. Description of Balaustium ryszardi sp. n. (Prostigmata) from Greece with a key to the world larval species. Biologia 2021, 76, 2609–2617. [Google Scholar] [CrossRef]
- Bolton, S.J.; Bauchan, G.R. Caenonychus, a senior synonym of Speleorchestes (Acariformes: Nanorchestidae). Syst. Appl. Acarol. 2022, 26, 241–249. [Google Scholar] [CrossRef]
- Khan, E.M.; Kamran, M.; Mirza, J.H.; Alatawi, F.J. New subgenera and a new species of the genus Raphignathus Dugès (Prostigmata, Raphignathidae), with taxonomic notes on the genus Neoraphignathus Smiley & Moser. ZooKeys 2023, 1176, 165–180. [Google Scholar] [CrossRef]
- Mirza, J.H.; Kamran, M.; Alatawi, F.J. The family Caligonellidae Grandjean (Acari: Raphignathoidea): A new species and key to world species. Eur. Zool. J. 2025, 92, 1–16. [Google Scholar] [CrossRef]
- Walter, D.E.; Proctor, H.C. Mites in soil and litter systems. In Mites: Ecology, Evolution & Behaviour: Life at a Microscale; Walter, D.E., Proctor, H.C., Eds.; Springer: Dordrecht, The Netherlands, 2013; pp. 161–228. [Google Scholar]
- Magilton, M.; Maraun, M.; Emmerson, M.; Caruso, T. Oribatid mites reveal that competition for resources and trophic structure combine to regulate the assembly of diverse soil animal communities. Ecol. Evol. 2019, 9, 8320–8330. [Google Scholar] [CrossRef]
- Potapov, A.M.; Beaulieu, F.; Birkhofer, K.; Bluhm, S.L.; Degtyarev, M.I.; Devetter, M.; Goncharov, A.A.; Gongalsky, K.B.; Klarner, B.; Korobushkin, D.I.; et al. Feeding habits and multifunctional classification of soil-associated consumers from protists to vertebrates. Biol. Rev. 2022, 97, 1057–1117. [Google Scholar] [CrossRef]
- Lu, J.-Z.; Cordes, P.H.; Maraun, M.; Scheu, S. High consistency of trophic niches in generalist arthropod species (Oribatida, Acari) across soil depth and forest type. Ecol. Evol. 2022, 12, e9572. [Google Scholar] [CrossRef]
- Ogle, D.H.; Doll, J.C.; Wheeler, A.P. FSA: Simple Fisheries Stock Assessment Methods. R Package Version 0.10.0. 2025. Available online: https://CRAN.R-project.org/package=FSA (accessed on 10 August 2025).
- Gu, Z.; Gu, L.; Eils, R.; Schlesner, M.; Brors, B. Circlize implements and enhances circular visualization in R. Bioinformatics 2014, 30, 2811–2812. [Google Scholar] [CrossRef]
- Tischler, W. Grundzüge der Terrestrischen Tierökologie; Vieweg+Teubner Verlag: Wiesbaden, Germany, 1949; pp. 1–220. [Google Scholar]
- Chao, A.; Gotelli, N.J.; Hsieh, T.C.; Sander, E.L.; Ma, K.H.; Colwell, R.K.; Ellison, A.M. Rarefaction and extrapolation with Hill Numbers: A framework for sampling and estimation in species diversity studies. Ecol. Monogr. 2014, 84, 45–67. [Google Scholar] [CrossRef]
- Hsieh, T.; Ma, K.; Chao, A. iNEXT: Interpolation and Extrapolation for Species Diversity. R Package Version 3.0.2. 2025. Available online: https://CRAN.R-project.org/package=iNEXT (accessed on 10 August 2025).
- Oksanen, J.; Blanchet, F.G.; Kindt, R.; Legendre, P.; Minchin, P.R.; O’Hara, R.B.; Simpson, G.L.; Solymos, P.; Henry, M.; Stevens, H.; et al. Vegan: Community Ecology Package. R Package Version 2.7-1. 2025. Available online: http://CRAN.R-project.org/package=vegan (accessed on 10 August 2025).
- Anderson, M.J. A new method for non-parametric multivariate analysis of variance. Austral. Ecol. 2001, 26, 32–46. [Google Scholar] [CrossRef]
- Baselga, A.; Orme, D.; Villeger, S.; Bortoli, J.D.; Leprieur, F.; Logez, M.; Martinez-Santalla, S.; Martin-Devasa, R.; Gomez-Rodriguez, C.; Crujeiras, R.M.; et al. Betapart: Partitioning Beta Diversity into Turnover and Nestedness Components. R Package Version 1.6.1. 2025. Available online: https://CRAN.R-project.org/package=betapart (accessed on 10 August 2025).
- Wickham, H. Ggplot2: Elegant Graphics for Data Analysis; Springer: New York, NY, USA, 2016; pp. 1–260. [Google Scholar]
- Lex, A.; Gehlenborg, N.; Strobelt, H.; Vuillemot, R.; Pfister, H. UpSet: Visualization of intersecting sets. IEEE Trans. Vis. Comput. Graph. 2014, 20, 1983–1992. [Google Scholar] [CrossRef] [PubMed]
- Conway, J.R.; Lex, A.; Gehlenborg, N. UpSetR: An R package for the visualization of intersecting sets and their properties. Bioinformatics 2017, 33, 2938–2940. [Google Scholar] [CrossRef]
- Cáceres, M.D.; Legendre, P. Associations between species and groups of sites: Indices and statistical inference. Ecology 2009, 90, 3566–3574. [Google Scholar] [CrossRef]
- McGeoch, M.A.; Van Rensburg, B.J.; Botes, A. The verification and application of bioindicators: A case study of dung beetles in a savanna ecosystem. J. Appl. Ecol. 2002, 39, 661–672. [Google Scholar] [CrossRef]
- Legendre, P.; Legendre, L. Numerical Ecology, Developments in Environmental Modelling, 3rd ed.; Elsevier: Amsterdam, The Netherlands; pp. 1–419.
- Murvanidze, M.; Mumladze, L. Annotated checklist of Georgian Oribatid Mites. Zootaxa 2016, 4089, 1–81. [Google Scholar] [CrossRef]
- Schatz, H.; Fortini, L.; Fusco, T.; Casale, F.; Jacomini, C.; Giulio, A.D. Oribatid mites (Acari, Oribatida) from “Parco Naturale Delle Alpi Marittime” (Piedmont, Italy). Zootaxa 2021, 5082, 501–540. [Google Scholar] [CrossRef]
- Subías, L.S. Listado sistemático, sinonímico y biogeográfico de los Ácaros Oribátidos (Acariformes, Oribatida) del mundo (1758−2002). Graellsia 2004, 60, 3–305. [Google Scholar] [CrossRef]
- Migliorini, M. Oribatid mite (Arachnida: Oribatida) coenoses from SW Sardinia. Zootaxa 2009, 2318, 8–37. [Google Scholar] [CrossRef]
- Siepel, H. Checklist of the endeostigmatic mites of the Netherlands (Acari: Sarcoptiformes: Endeostigmata). Neth. Faun. Meded. 2022, 59, 57–64. [Google Scholar]
- Beron, P. ACARORUM CATALOGUS X. Trombidiformes, Prostigmata, Superfamilia Labidostommatoidea (Labidostommatidae), Superfamilia Eupodoidea, (Eupodidae, Dendrochaetidae, Rhagidiidae, Eriorhynchidae, Pentapalpidae, Penthalodidae, Penthaleidae, Proterorhagiidae, Strandtmanniidae), Superfamilia Tydeoidea, Ereynetidae, Superfamily Paratydeoidea, Paratydeidae, Superfamilia Anystoidea, (Anystidae, Erythracaridae, Teneriffiidae, Pseudocheylidae, Stigmocheylidae), Superfamilia Caeculoidea (Caeculidae), Superfamilia Adamystoidea (Adamystidae), Superfamilia Pomerantzioidea (Pomerantziidae); Pensoft & National Museum of Natural History: Sofia, Bulgaria, 2022. [Google Scholar] [CrossRef]
- Laska, A.; Puchalska, E.; Mikołajczyk, M.; Gwiazdowicz, D.J.; Kaźmierski, A.; Niedbała, W.; Błoszyk, J.; Olszanowski, Z.; Szymkowiak, J.; Hałas, N.; et al. Mites inhabiting nests of wood warbler, Phylloscopus sibilatrix (Aves: Passeriformes), in the Wielkopolska National Park in Western Poland. Exp. Appl. Acarol. 2023, 89, 393–416. [Google Scholar] [CrossRef]
- Manu, M.; Bancila, R.; Onete, M. Importance of moss habitats for mesostigmatid mites (Acari: Mesostigmata) in Romania. Turk. J. Zool. 2018, 42, 673–683. [Google Scholar] [CrossRef]
- Gergócs, V. SeasonaL change of oribatid mite communities (Acari, Oribatida) in three different types of microhabitats in an oak forest. Appl. Ecol. Env. Res. 2011, 9, 181–195. [Google Scholar] [CrossRef]
- Seniczak, A.; Iturrondobeitia, J.C.; Seniczak, S. Vertical distribution of mites (Acari) in a “Miniature Forest” of Sphagnum mosses in a forest bog in Western Norway. Forests 2024, 15, 957. [Google Scholar] [CrossRef]
- Wu, T.; Su, F.; Han, H.; Du, Y.; Yu, C.; Wan, S. Responses of soil microarthropods to warming and increased precipitation in a semiarid temperate steppe. Appl. Soil Ecol. 2014, 84, 200–207. [Google Scholar] [CrossRef]
- Aupic-Samain, A.; Santonja, M.; Chomel, M.; Pereira, S.; Quer, E.; Lecareux, C.; Limousin, J.-M.; Ourcival, J.-M.; Simioni, G.; Gauquelin, T.; et al. Soil biota response to experimental rainfall reduction depends on the dominant tree species in mature Northern Mediterranean forests. Soil Biol. Biochem. 2021, 154, 108122. [Google Scholar] [CrossRef]
- Moraza, M.L. Effects of reforestation with conifers on the communities of Mesostigmatic mites in Northern Spain (Acari: Mesostigmata). In Trends in Acarology, Proceedings of the 12th International Congress; Sabelis, M.W., Bruin, J., Eds.; Springer: Dordrecht, The Netherlands, 2010; pp. 129–133. [Google Scholar]
- Peguero, G.; Folch, E.; Liu, L.; Ogaya, R.; Peñuelas, J. Divergent effects of drought and nitrogen deposition on microbial and arthropod soil communities in a Mediterranean forest. Eur. J. Soil Biol. 2021, 103, 103275. [Google Scholar] [CrossRef]
- Walter, D.E.; Ikonen, E.K. Species, guilds, and functional groups: Taxonomy and behavior in nematophagous arthropods. J. Nematol. 1989, 21, 315–327. [Google Scholar]
- Martikainen, E.; Huhta, V. Interactions between nematodes and predatory mites in raw humus soil: A microcosm experiment. Rev. Ecol. Biol. Sol 1990, 27, 13–20. [Google Scholar]
- Zacharda, M.; Kučera, T. The Rhagidiidae (Acari: Prostigmata) in NW Lapland: Could their assemblages be climate warming monitors related to environmental and habitat patterns? Pedobiologia 2010, 54, 1–8. [Google Scholar] [CrossRef]
- Wallwork, J.A. Distribution patterns and population dynamics of the micro-arthropods of a desert soil in Southern California. J. Anim. Ecol. 1972, 41, 291–310. [Google Scholar] [CrossRef]
- Mackay, W.P.; Silva, S.; Whitford, W.G. Diurnal activity patterns and vertical migration in desert soil microarthropods. Pedobiologia 1987, 30, 65–72. [Google Scholar] [CrossRef]
- Rounsevell, D.E.; Greenslade, P. Cuticle structure and habitat in the Nanorchestidae (Acari: Prostigmata). Hydrobiologia 1988, 165, 209–212. [Google Scholar] [CrossRef]
- Walter, D.E. Trophic behavior of “mycophagous” microarthropods. Ecology 1987, 68, 226–229. [Google Scholar] [CrossRef]
- Vermaak, M.; Jensen, K.; Janion-Scheepers, C.; Terblanche, J.S. Assessing the potential for predator-prey interactions in mesofaunal arthropod communities through temperature dependence of locomotion. J. Therm. Biol. 2025, 128, 104084. [Google Scholar] [CrossRef]
- Schneider, K.; Migge, S.; Norton, R.A.; Scheu, S.; Langel, R.; Reineking, A.; Maraun, M. Trophic niche differentiation in soil microarthropods (Oribatida, Acari): Evidence from stable isotope ratios (15N/14N). Soil Biol. Biochem. 2004, 36, 1769–1774. [Google Scholar] [CrossRef]
- Maraun, M.; Erdmann, G.; Fischer, B.M.; Pollierer, M.M.; Norton, R.A.; Schneider, K.; Scheu, S. Stable isotopes revisited: Their use and limits for oribatid mite trophic ecology. Soil Biol. Biochem. 2011, 43, 877–882. [Google Scholar] [CrossRef]
- Belnap, J.; Lange, O.L. Biological Soil Crusts: Structure, Function, and Management; Springer: Berlin/Heidelberg, Germany, 2003; Volume 150, pp. 1–506. [Google Scholar]
- Neher, D.A.; Lewins, S.A.; Weicht, T.R.; Darby, B.J. Microarthropod communities associated with biological soil crusts in the Colorado Plateau and Chihuahuan Deserts. J. Arid Environ. 2009, 73, 672–677. [Google Scholar] [CrossRef]
Disclaimer/Publisher’s Note: The statements, opinions and data contained in all publications are solely those of the individual author(s) and contributor(s) and not of MDPI and/or the editor(s). MDPI and/or the editor(s) disclaim responsibility for any injury to people or property resulting from any ideas, methods, instructions or products referred to in the content. |
© 2025 by the authors. Licensee MDPI, Basel, Switzerland. This article is an open access article distributed under the terms and conditions of the Creative Commons Attribution (CC BY) license (https://creativecommons.org/licenses/by/4.0/).