Article

Effects of Cyclic Load Amplitude and Count on the Roughness and Friction Coefficient of the Round-End Wood Mortise–Tenon Joint

1
College of Architectural Engineering, Hunan Urban Professional College, Changsha 410137, China
2
Co-Innovation Center of Efficient Processing and Utilization of Forest Resources, Nanjing Forestry University, Nanjing 210037, China
3
School of Applied Technology and Design, Wuyi University, Jiangmen 529020, China
*
Authors to whom correspondence should be addressed.
Forests 2025, 16(11), 1635; https://doi.org/10.3390/f16111635
Submission received: 12 September 2025 / Revised: 20 October 2025 / Accepted: 24 October 2025 / Published: 26 October 2025

Abstract

The fatigue of wood mortise–tenon (M–T) joints commonly results from the looseness of the joints when subjected to long-term cyclic load. It is of critical importance to comprehensively understand the fatigue of M–T joints to know what occurs in M–T joints However, fatigue evolution progression (FEP) of M–T joints has been rarely studied. This study mainly aimed to investigate the FEP of the roughness of mortise (RM) and tenon (RT), and the friction coefficient of the non-glued round-end beech wood M–T joint when subjected to cyclic load to provide basic data for numerically modelling the FEP of the M–T joint. The effects of cyclic load amplitude (CLA) (150 N, 200 N, 250 N, and 300 N) and cyclic load count (CLC) (25%, 50%, 75%, and 100% fatigue life) on RM, RT, and the friction coefficient were investigated. The results demonstrate that the CLA and CLC have significant effects on RM, RT, and the friction coefficient of the M–T joint. The RM, RT, and friction coefficient of the M–T joint decrease non-linearly as the CLA and CLC increase, complying with the power law function. The RM, RT, and friction coefficient of M–T joints are reduced by a large margin within the CLC of the initial 25% fatigue life, and these reductions decelerate from a CLC of 75% to 100% for all CLAs. The relationships between the friction coefficient and RM and RT at each CLA can be well fitted by a quadratic model during FEP. This study provides a new insight to comprehensively understand the FEP of the round-end M–T joint and supplies basic data for numerically modelling the FEP of the M–T joint.

1. Introduction

Mortise–tenon (M–T) joints are widely used in solid wood frame furniture, contributing to their satisfactory strength and invisible appearance of joints [1,2]. The round-end M–T joint is the most commonly used joint as it is suitable for modern wood manufacturing machines [3,4,5]. It is known that the strengths of the round-end M–T joints mainly depend on the interference fit and frictional coefficient between mortise and tenon. The factors influencing the strength of the M–T joints have been widely investigated [6,7,8], such as the wood species, moisture content, tenon fit, and shape of the tenon. However, all these factors finally influence the interference fit, roughness, and frictional coefficient between mortise and tenon. In terms of the effect of fit on the strengths of M–T joints, an agreement was reached that the withdrawal and bending moment load resistances increased as the fit increased [9,10]. However, only limited studies have focused on roughness and the friction coefficient between mortise and tenon.
As is known, the friction coefficient between mortise and tenon depends on the surface roughness of the mortise and tenon. The roughness of the wood surface mainly depends on the manufacturing parameters of the wood machines, such as the feeding rate and cutting speed, the grit of the sandpaper, and the sanding process [11,12,13,14,15,16,17,18]. High feeding rate and cutting speed have negative effects on the roughness of the wood surfaces. Additionally, the factors of grain orientations, species, and moisture content also influenced the roughness of the wood [19,20,21,22,23]. Different coating and surface treatment methods can also affect the surface roughness of wood furniture, which finally impacts the aesthetic appearance and touch feeling [24,25,26,27,28,29,30,31,32]. To control the quality of wood furniture and improve the manufacturing steps, Zhong et al. [33] compared the surface roughness of 15 types of wood-based panels and 12 types of solid wood commonly used in furniture manufacturing. However, only a rare study was found on investigating the roughness of mortise (RM) and tenon (RT). Hu and Guan [34] used the cut-open mortise and tenon to obtain the friction coefficient between mortise and tenon. Furthermore, the effects of moisture content [35] and interference fit [8] on the withdrawal strengths of M–T joints were investigated in terms of the friction coefficient between the mortise and tenon. However, only a rare study was found on investigating the frictional coefficient relating to RM and RT.
The M–T joint is commonly considered the weakest part in wooden furniture frame construction [36,37,38,39]. The M–T joint failure is usually caused by long-term cyclic loading [40,41]. Previous studies carried out many experimental tests to investigate factors affecting the fatigue life of furniture constructed by M–T joints [42,43,44,45,46,47,48]. Some studies [46,47] reported that the tenon shape significantly influenced the fatigue life of M–T joints, finding that the M–T joint with a rectangular cross section had a longer fatigue life than ones with a diamond cross section, followed by dowels, and then a round cross section. Glued round and rectangular M–T joints had the highest cyclic load resistance. Ratnasingam et al. [49] reported that the fatigue strength of the PVAc adhesive M–T joints was much higher than that of UF adhesive joints. Allowable design stress for PVAc and UF adhesive M–T joints can be set at 30% and 25%, respectively, of their ultimate bending moment. Meanwhile, the M–T joints made of oil palm wood did not perform as well as with rubberwood. The fatigue life decreased with increasing load level [50,51]. Hu et al. [52] investigated the effects of cyclic load type, load amplitude, and joint fit (T-M clearance) on the fatigue life of round-end M–T joints. They suggested that cyclic load amplitude, cyclic load type, and joint fit had significant effects on the fatigue life of round-end M–T joints. The above studies indicate that the main factors influencing fatigue life of M–T joints are joint type (shape and dimension), wood material (wood species and moisture content), loading parameters (load amplitude and load frequency), and glue type (PVAc and UF). It is known that the fatigue of M–T joints does not occur instantly but has a damage evolution progression. Therefore, it can help us to understand comprehensively the fatigue of the M–T joint by knowing the changing laws of roughness, friction coefficient, and their relationships when subjected to long-term cyclic load. However, only a rare study has been found.
The preliminary aim of this study was to obtain the changing laws of RM, RT, and the friction coefficient between mortise and tenon during the fatigue of round-end M–T joints for numerically modeling the fatigue of the M–T joint. The specific aim was as follows: (1) investigate the effects of cyclic load amplitude (CLA) and cyclic load count (CLC) on RM, RT, and the friction coefficient between mortise and tenon; (2) reveal the relationships between RM, RT, and the friction coefficient of the round-end M–T joint when subjected to different CLA and CLC. The final objective was to provide a new insight for comprehensively understanding the FEP of the round-end M–T joint. Additionally, the changing laws presented basic data for the numerical models of the M–T joint, which can provide more details of the M–T joint during FEP.

2. Materials and Methods

2.1. Wood Materials

The wood species used to prepare M–T joint samples was beech (Fagus orientalis) purchased in a wood timber shop (Nanjing, China). The wood lumber had been stored in the wood processing laboratory for more than 5 years and had reached its air-dry condition. The density of the beech wood was 700 kg/m3 measured at a moisture content of 12%.

2.2. Experimental Design

A complete 4 × 4 factorial experiment was designed to investigate the effects of CLA (150 N, 200 N, 250 N, and 300 N) and CLC (25%, 50%, 75%, and 100% fatigue life) on the roughness of mortise (RM) and tenon (RT) as well as the friction coefficient between mortise and tenon. Table 1 summarizes all the experimental combinations tested in this study. Three samples underwent cyclic load tests for each combination of CLA and CLC. Before loading and after completing specified cyclic load counts, the roughness and friction coefficient of each sample were measured 3 times. Therefore, there were 144 data points for each variable evaluated in this study—RM, RT, and friction coefficient. The fatigue lives of the M–T joints evaluated at each of the four CLA levels of 150 N, 200 N, 250 N, and 300 N were found to be 299,269, 37,345, 23,486, and 18,086 cycles, respectively, per our previous study [52].

2.3. Sample Preparations

Figure 1a shows the dimensions of the L-shaped M–T joint sample tested in this study. It is composed of a tenon (horizontal) component and a mortise (vertical) component. The tenon and mortise components were machined by a computer numerical control (CNC) tenon machine (MDK3113B, New MAS Woodworking Machinery & Equipment Co., Ltd., Foshan, China) and a CNC horizontal double-end mortise machine (MS3112, New MAS Woodworking Machinery & Equipment Co., Ltd., Foshan, China), respectively. Figure 1b shows the configurations of the mortise and tenon in top and front views, indicating the head and root of the tenon. The nominal tenon width (WT) measured 0.3 mm more than that of the mortise (WM) to generate an interference fit between mortise and tenon (Figure 1c). In terms of tenon thickness, clearance fit was applied with a value of 1 m (Figure 1c). Based on this construction technique, the friction behavior between mortise and tenon is only in the curved part [53]. All mortise and tenon components were stored in sealed plastic bags to maintain a constant moisture condition. The mortise and tenon components were constructed without glue immediately before each fatigue test.
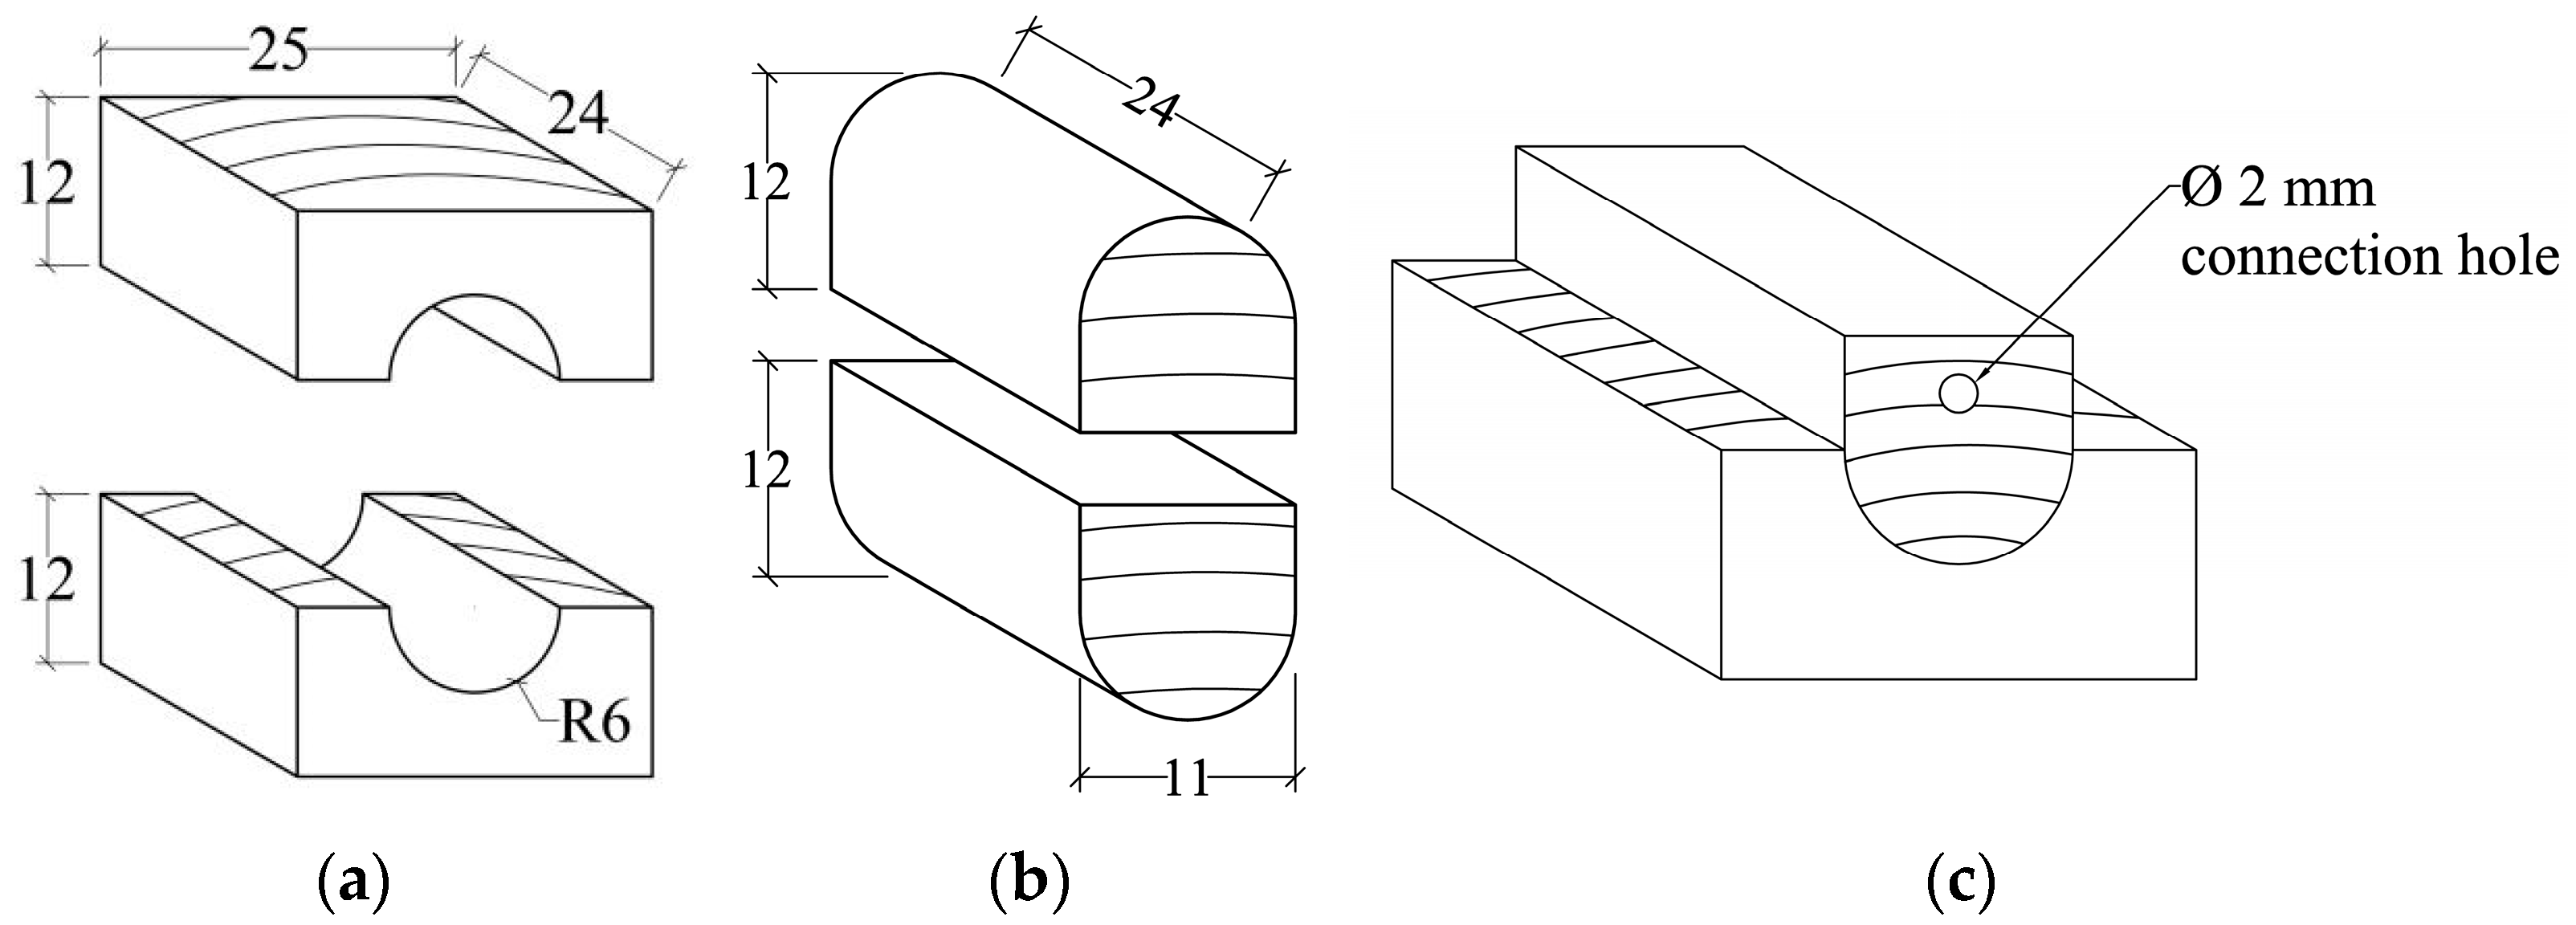
Figure 2a,b show the sizes of the cut-open mortise and tenon used to determine RM and RT, respectively. Figure 2c indicates the samples used to determine the friction coefficient between mortise and tenon. The connection hole was used to fix the steel wire for imposing loads.

2.4. Testing Methods

2.4.1. Cyclic Load Test

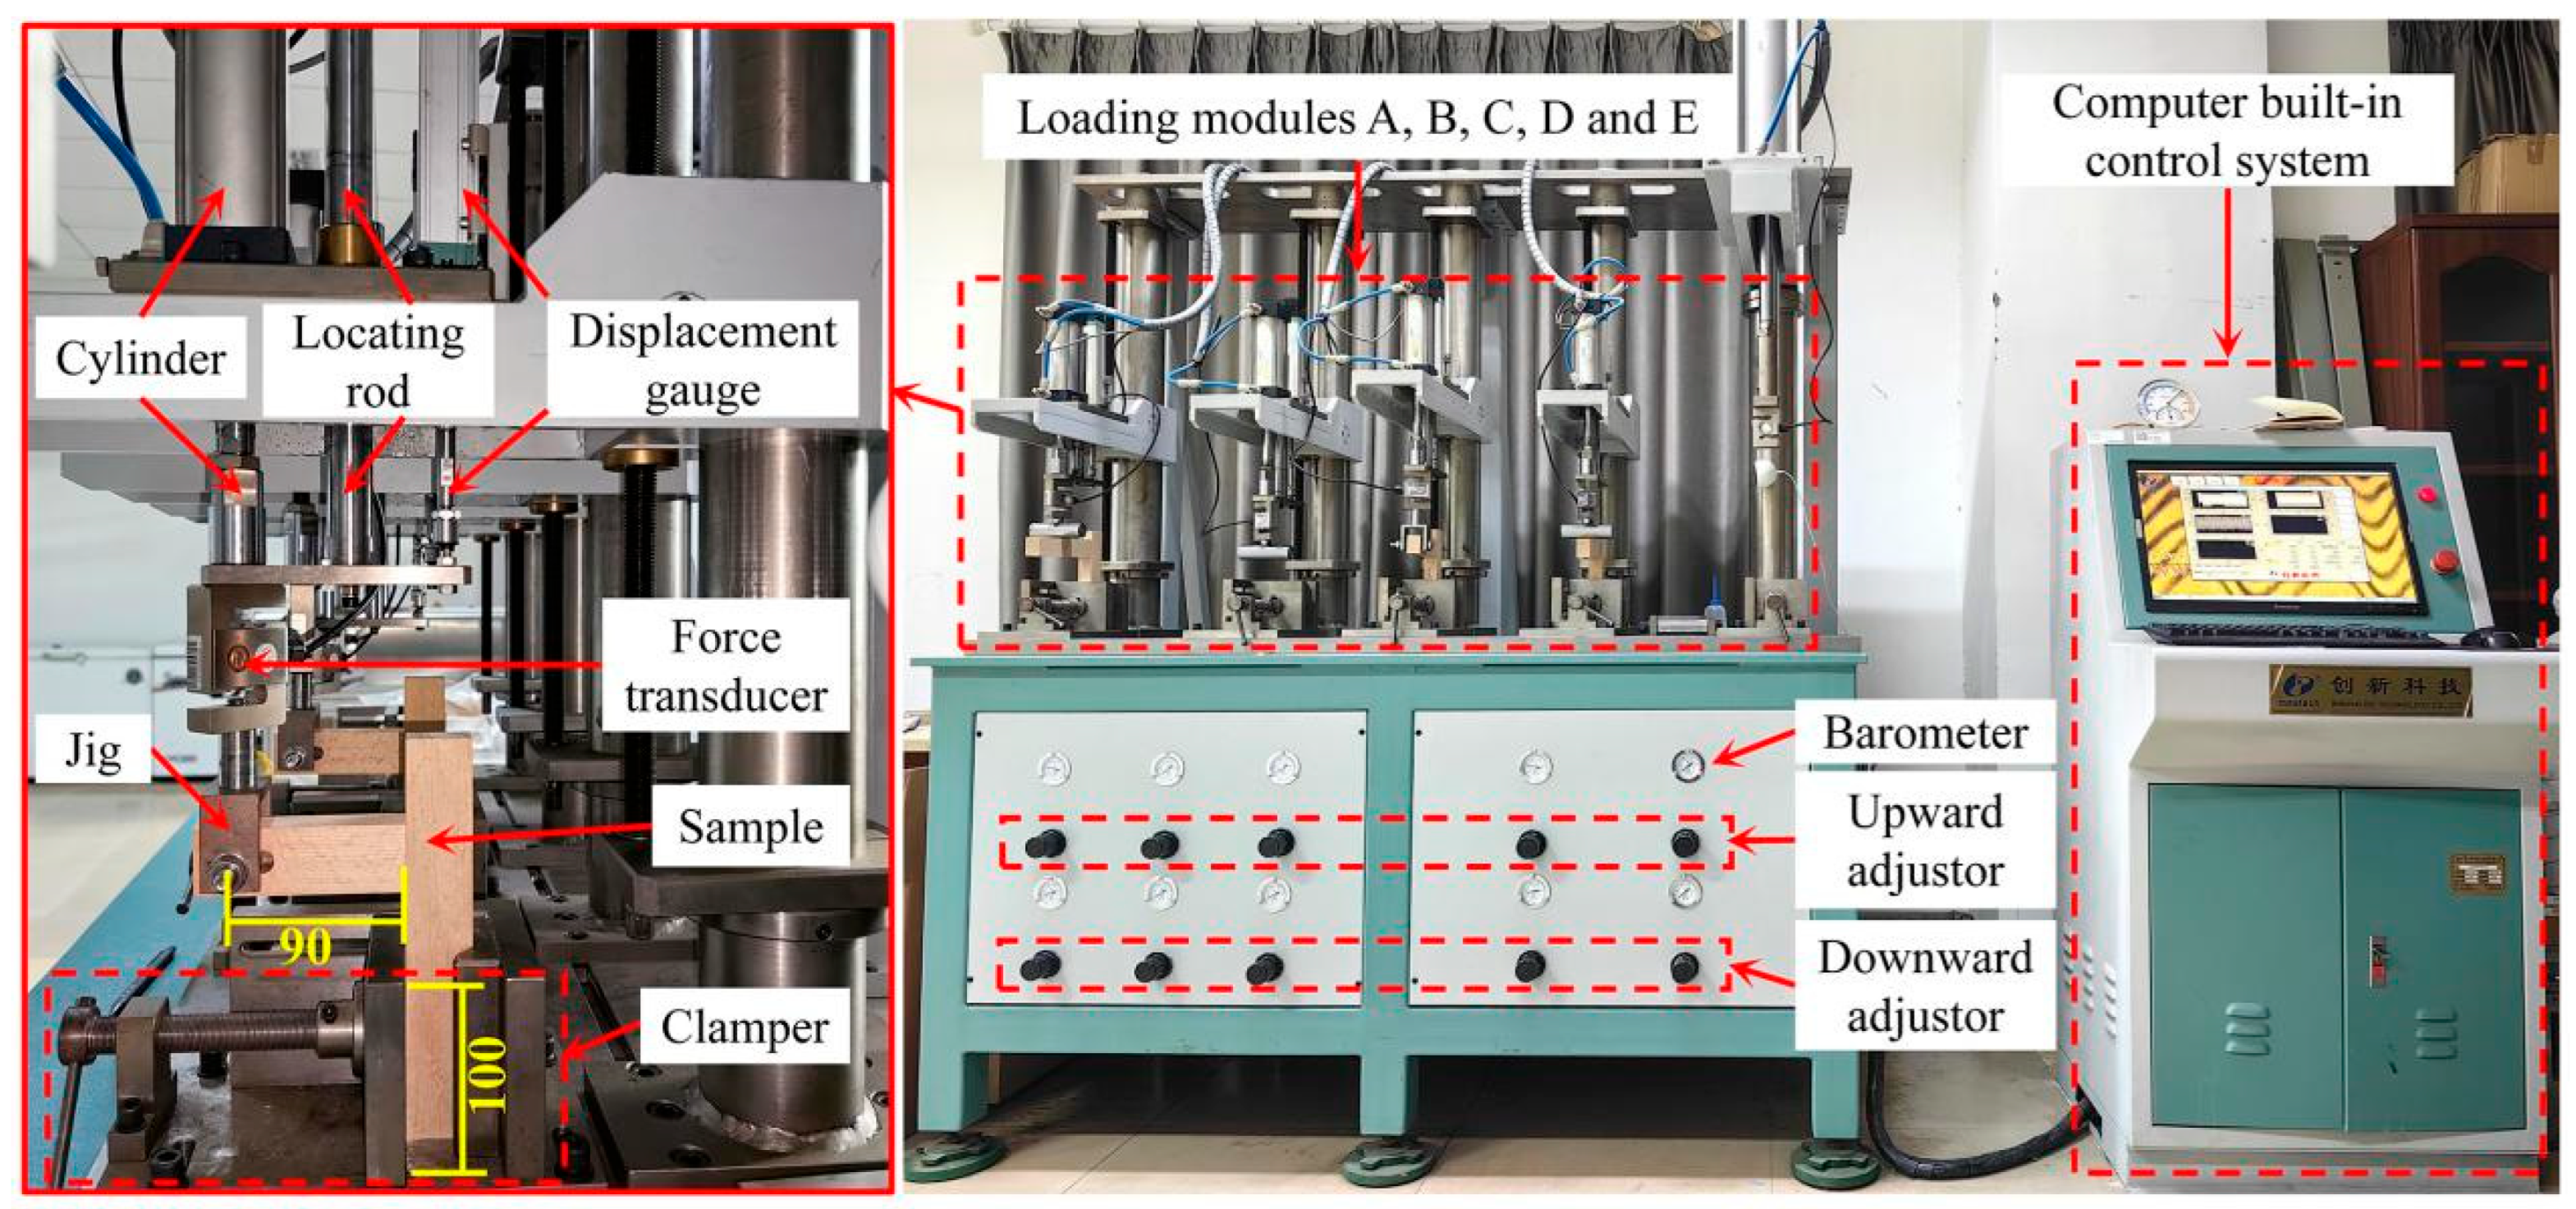
Figure 3 presents the testing machine and setup for conducting cyclic load tests of M–T joints. The setup was achieved by a self-designed air-operated multi-functional fatigue testing machine (CX-8392, Kunshan Innovation Testing Instruments Co., Ltd., Kunshan, China). It is composed of a computer control system for controlling and recording data. All load parameters were controlled by the software (Chunxin Technology system, version 1.13.0.36, Kunshan Innovation Testing Instruments Co., Ltd., Kunshan, China) built into the computer and connected with the test machine. It has 5 loading modules, allowing for conducting cyclic tests of 5 samples at the same time. Each loading module is composed of a cylinder, a loading rod, a displacement gauge, a force transducer connected to a jig, and a clamper for securing the sample. The applied load is adjusted by controlling the air pressure using the upward and downward adjustors. The air pressure is indicated by the barometers located above the adjustors. Operators only need to adjust the air pressure to the specified CLA, which can be seen on the computer screen, synchronizing with the air pressure adjustment. The laboratory temperature and humidity were 25 °C and 65% achieved by air conditioners.
Figure 4 shows the cyclic load spectrum indicating the main loading parameters. The up-and-down reversed load process within a cycle, T, involved the load reaching the specified positive value, F, and remaining at that value for t seconds. Then it reversed and reached the specified negative value, –F, and maintained that value for a further t seconds. The specified load, F, imposed was according to the CLA shown in the experimental design (Table 1). The frequency was set at 20 cycles per minute with each cycle lasting 3 s. Therefore, the value of T is 3 s, and t is 1 s. The roughness and friction coefficient were measured immediately when the CLC reached the specified values shown in Table 1.

2.4.2. Roughness Measurement

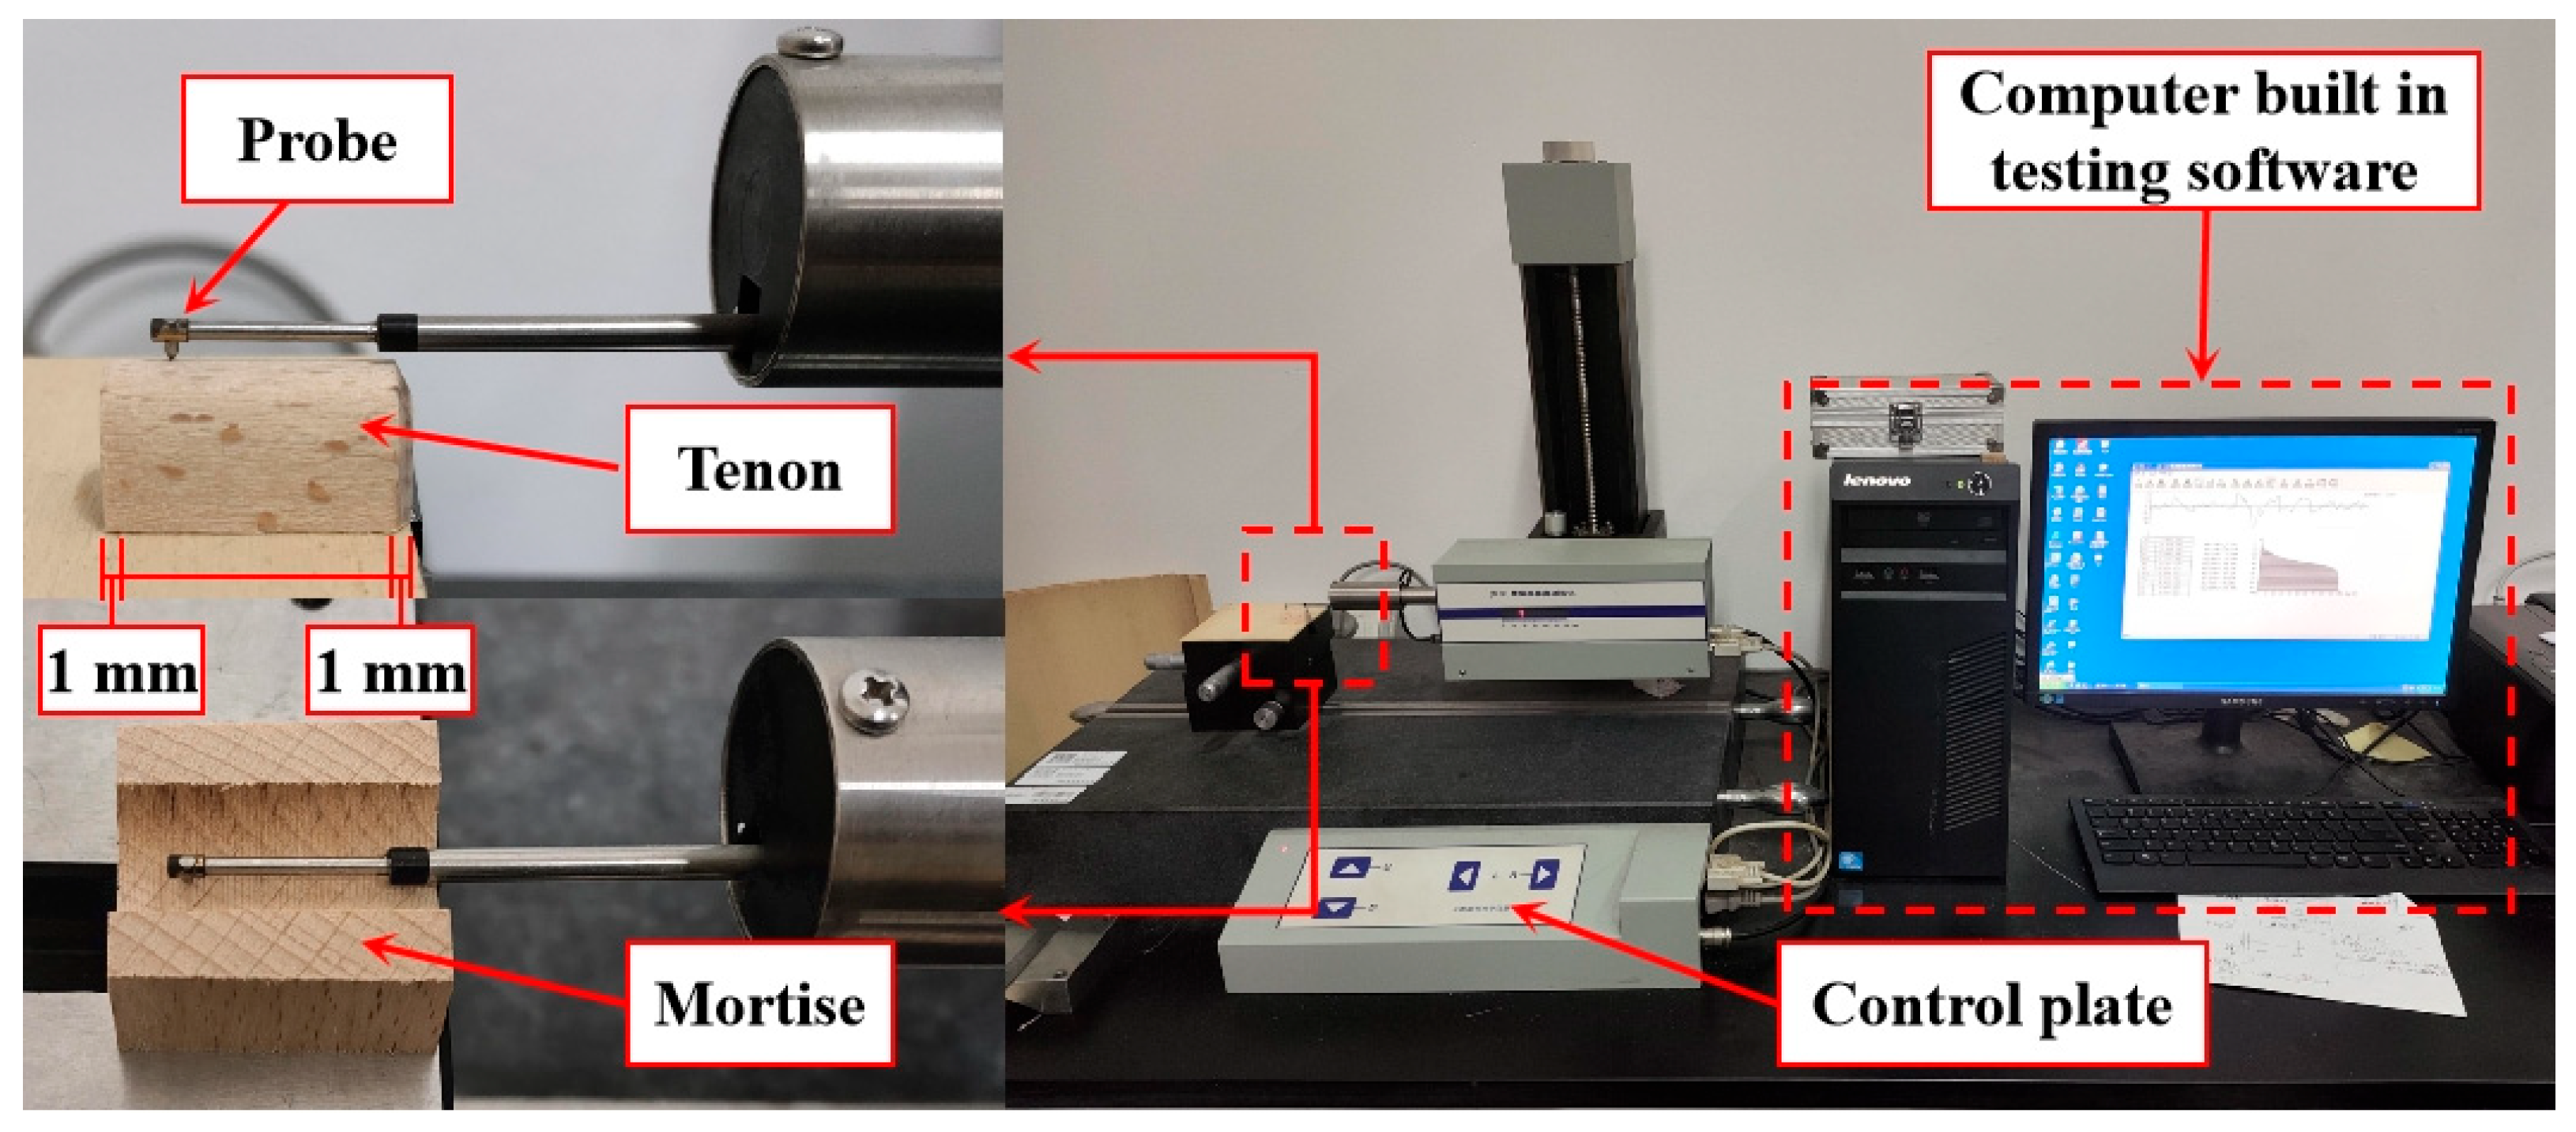
Upon finishing each cyclic load test, the cut-open mortise and tenon components were cut from the fatiguing joints according to Figure 2, which was used for roughness measurement. Figure 5 presents the setup for determining the RM and RT by a profilometer (JB-4C, Shanghai Zhongheng Instrument Co., Ltd., Shanghai, China). The setup consisted of a probe, a control plate, and a computer with data analysis software built in. Upon conducting tests, the tested mortise and tenon were fixed on the measuring plate first. Then, the sample was adjusted to make it slightly contact the probe and the control plate was used to calibrate the initial condition to zero. Finally, the measuring was started. The measured position is at the middle line of the mortise and tenon. The measured length was 22 mm, starting and ending 1 mm from the two ends of the samples. The same procedure was repeated for all samples in terms of the experimental design. The parameter Ra, a common indicator [19,20] outputted by the profilometer, was used to characterize the roughness of the mortise and tenon.

2.4.3. Friction Coefficient Measurement

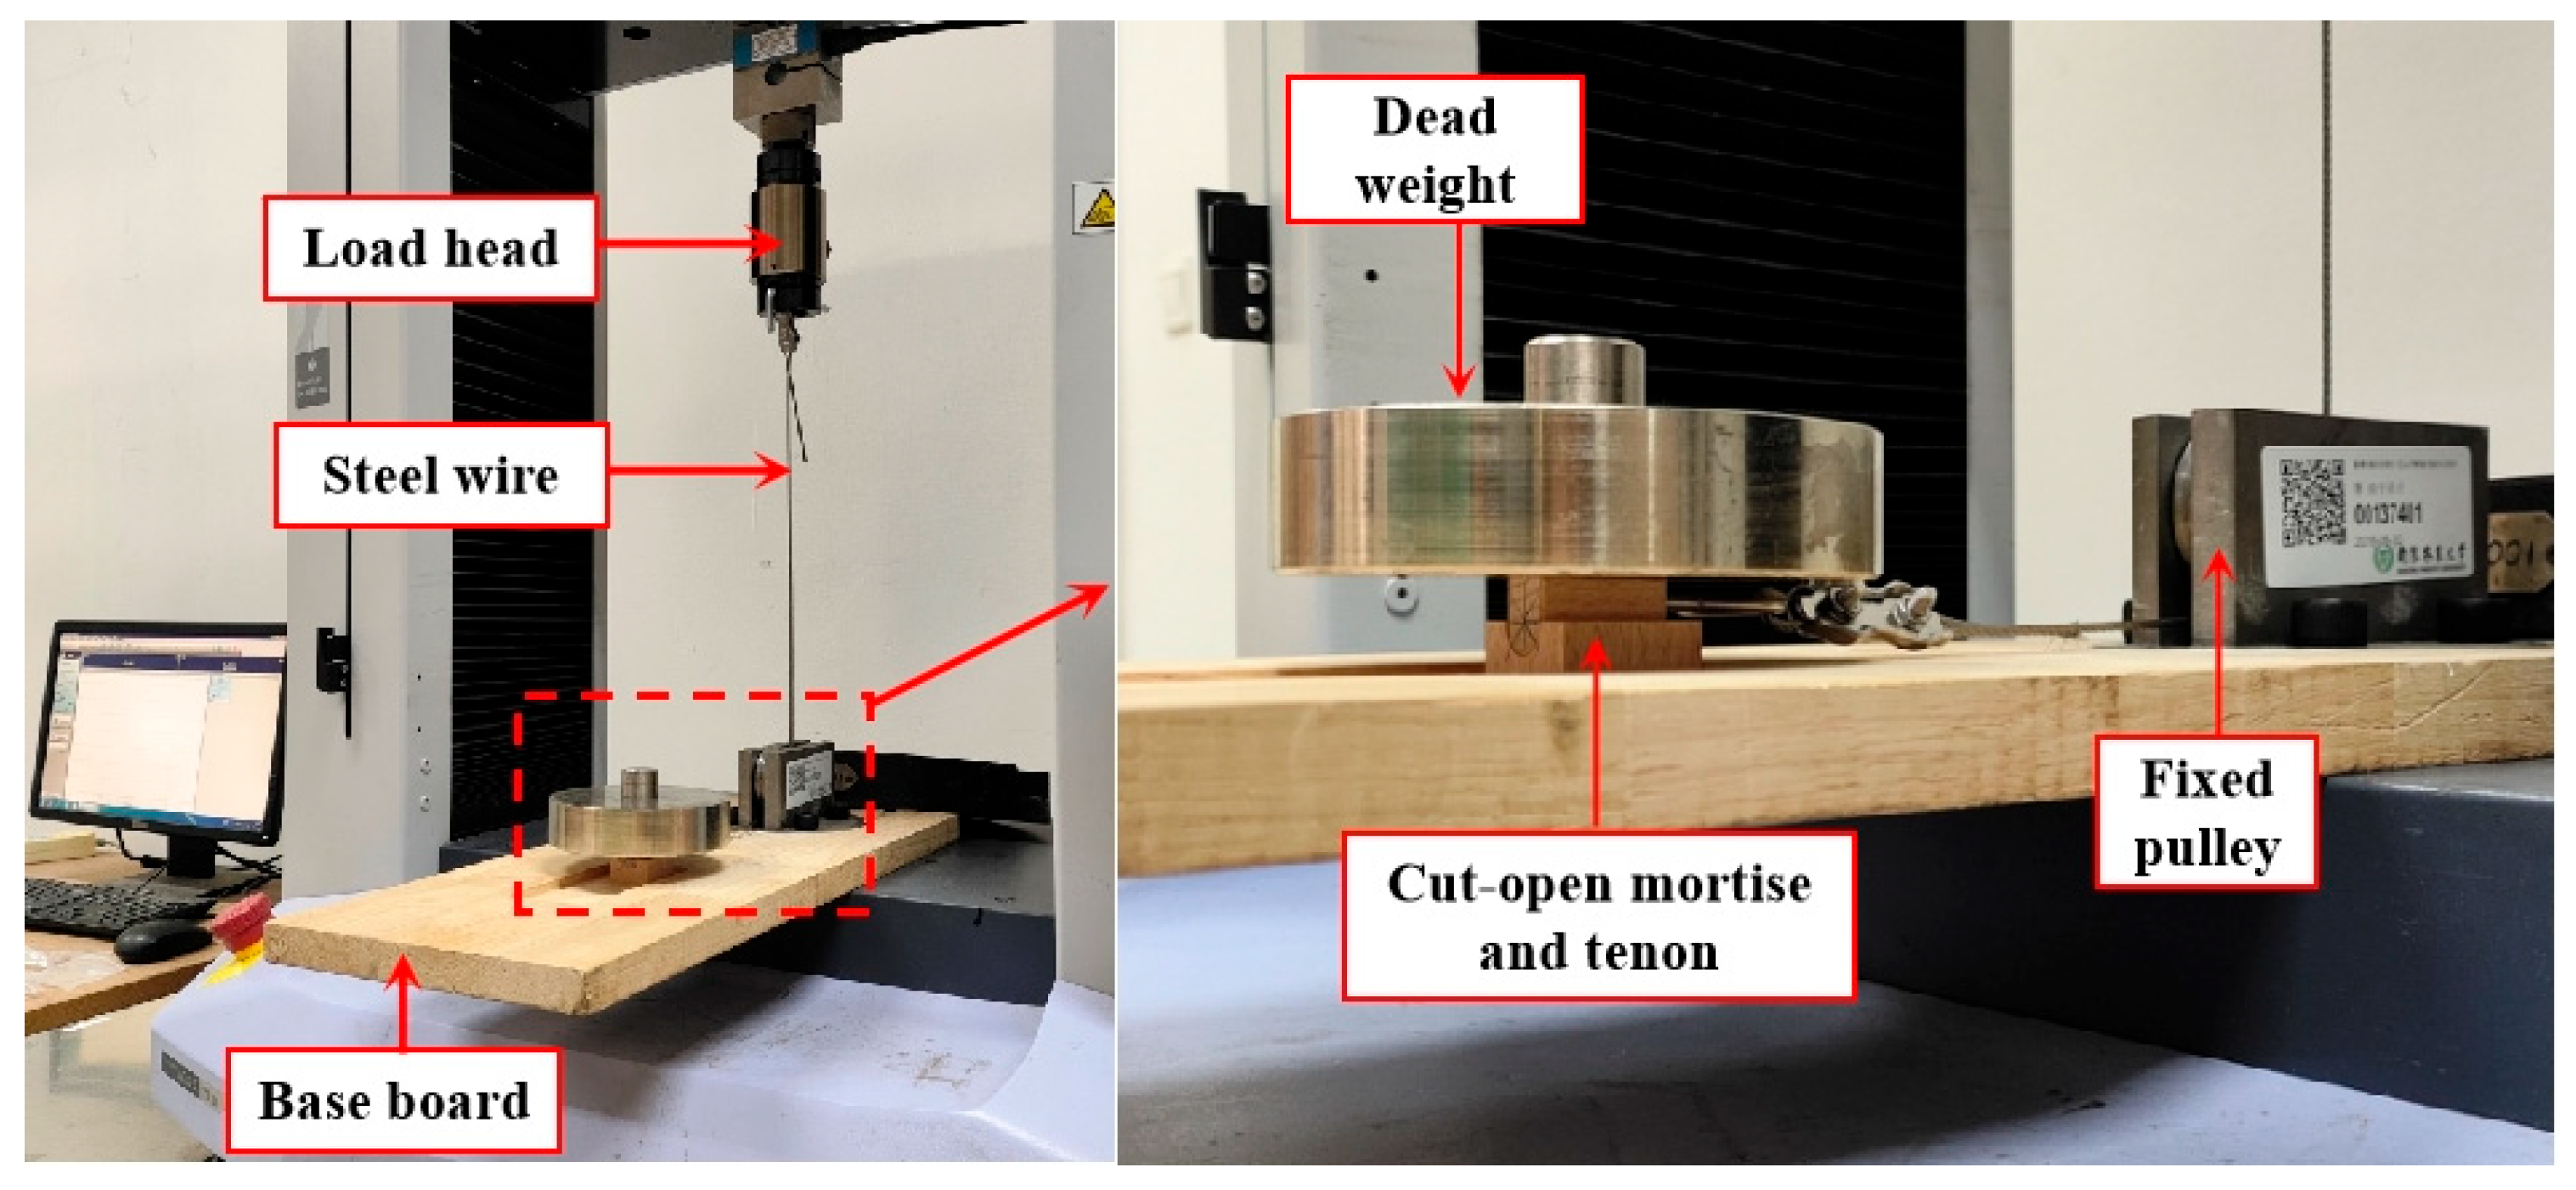
After completing roughness measurements, the tested samples were further tested for friction coefficient measurement. Figure 6 indicates the setup for determining the friction coefficient of the M–T joint using the universal test machine (AGS-X, SHIMADZU, Tokyo, Japan) and self-designed accessories. The cut-open mortise was fixed in the groove of a wooden baseboard. A dead weight was applied to the cut-open tenon. A horizontal load was applied to the tested cut-open tenon through a steel wire that was connected to the load head through a fixed pulley that changed the vertical displacement of the loading head to a horizontal movement on the tested cut-open tenon. The loading head speed was set to 3 mm/min to make the cut-open tenon slip in a stable manner on the cut-open mortise surface. The friction coefficient between mortise and tenon was calculated using Equation (1):
μ = F p ( m 1 + m 2 ) g
where μ is the friction coefficient between cut-open mortise and tenon surfaces, dimensionless; Fp is the static friction force (the horizontal load measured) in N; m1 and m2 are the mass of dead weight and half tenon applied onto a tested cut-open mortise in kg—the total mass of them is 1.6 kg; g is the gravitational acceleration—9.8 m/s2.

2.5. Statistical Analysis

First, the normality of all variances were checked by the Shapiro–Wilk test. Subsequently, univariate and multivariate analysis of covariance (UNIANOVA) was conducted using a generalized linear model to evaluate the effects of CLA and CLC on the roughness and friction coefficient of the M–T joints. Then, mean comparison was conducted using the protected least squares difference multiple comparison procedure. All the above analyses were conducted at 5% significance level by SPSS software (22.0, IBM, USA). Finally, regression analyses were performed to explore the relationships among all evaluated variables.

3. Results and Discussion

3.1. Effects on the Roughness of Mortise and Tenon

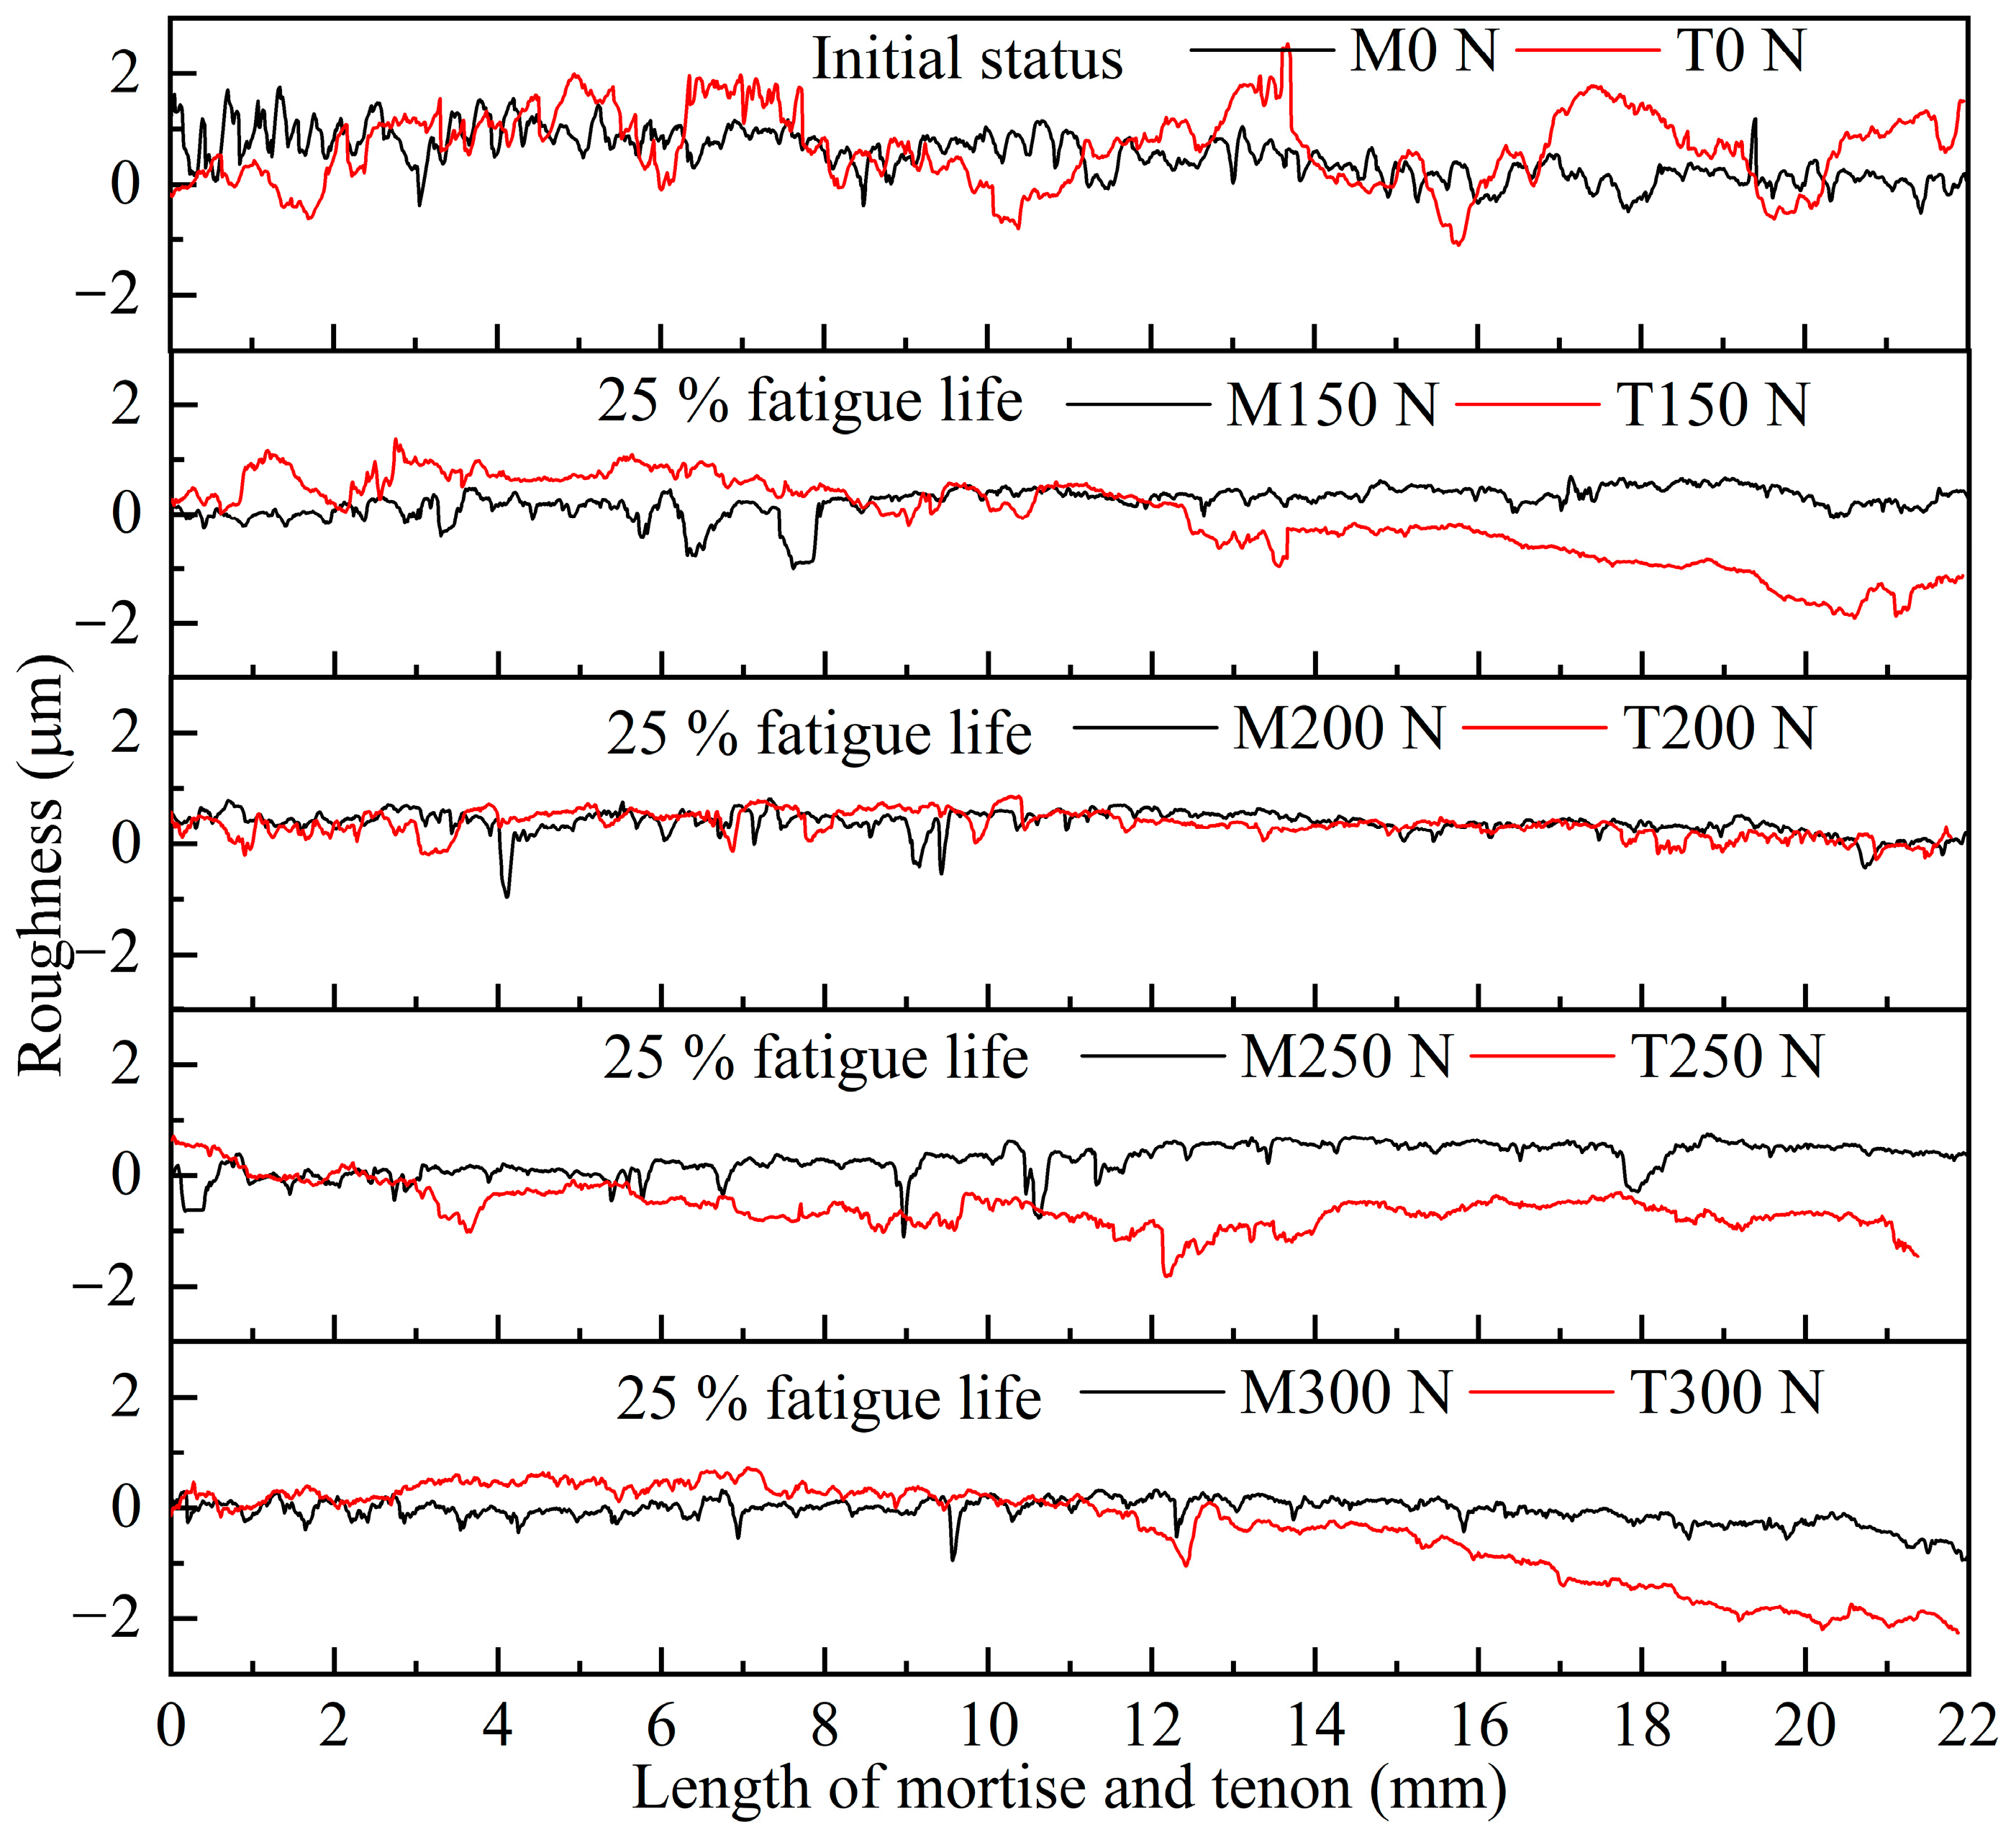
Figure 7 indicates the representative curves of the roughness profiles of mortises and tenons at the initial status without cyclic load and having undergone each of four CLAs, following a CLC of 25% fatigue life of the M–T joints. From all the trends of these curves, both roughness profiles of mortise and tenon wave more seriously at the initial status than those at the CLC of 25% fatigue life, which indicates that the cyclic load imposed on the M–T joints makes the surface of the mortise and tenon smoother than at the initial status. The roughness of the tenons tends to decrease as the length increases from the head to the root of the M–T joint for each CLA. By contrast, the RM in the length direction does not seem obvious. This may be caused by the larger compression on the root of the tenon compared to the mortise during the cyclic load, which makes the root part of the tenon smoother than the head. In addition, the grain orientation of the mortise and tenon in the compression direction is longitudinal and radial, respectively (Figure 2), making the tenon deform more than that of the mortise. Statistical analyses were conducted to further compare the mean roughness, Ra, of the mortise and tenon as the CLA and CLC increase.
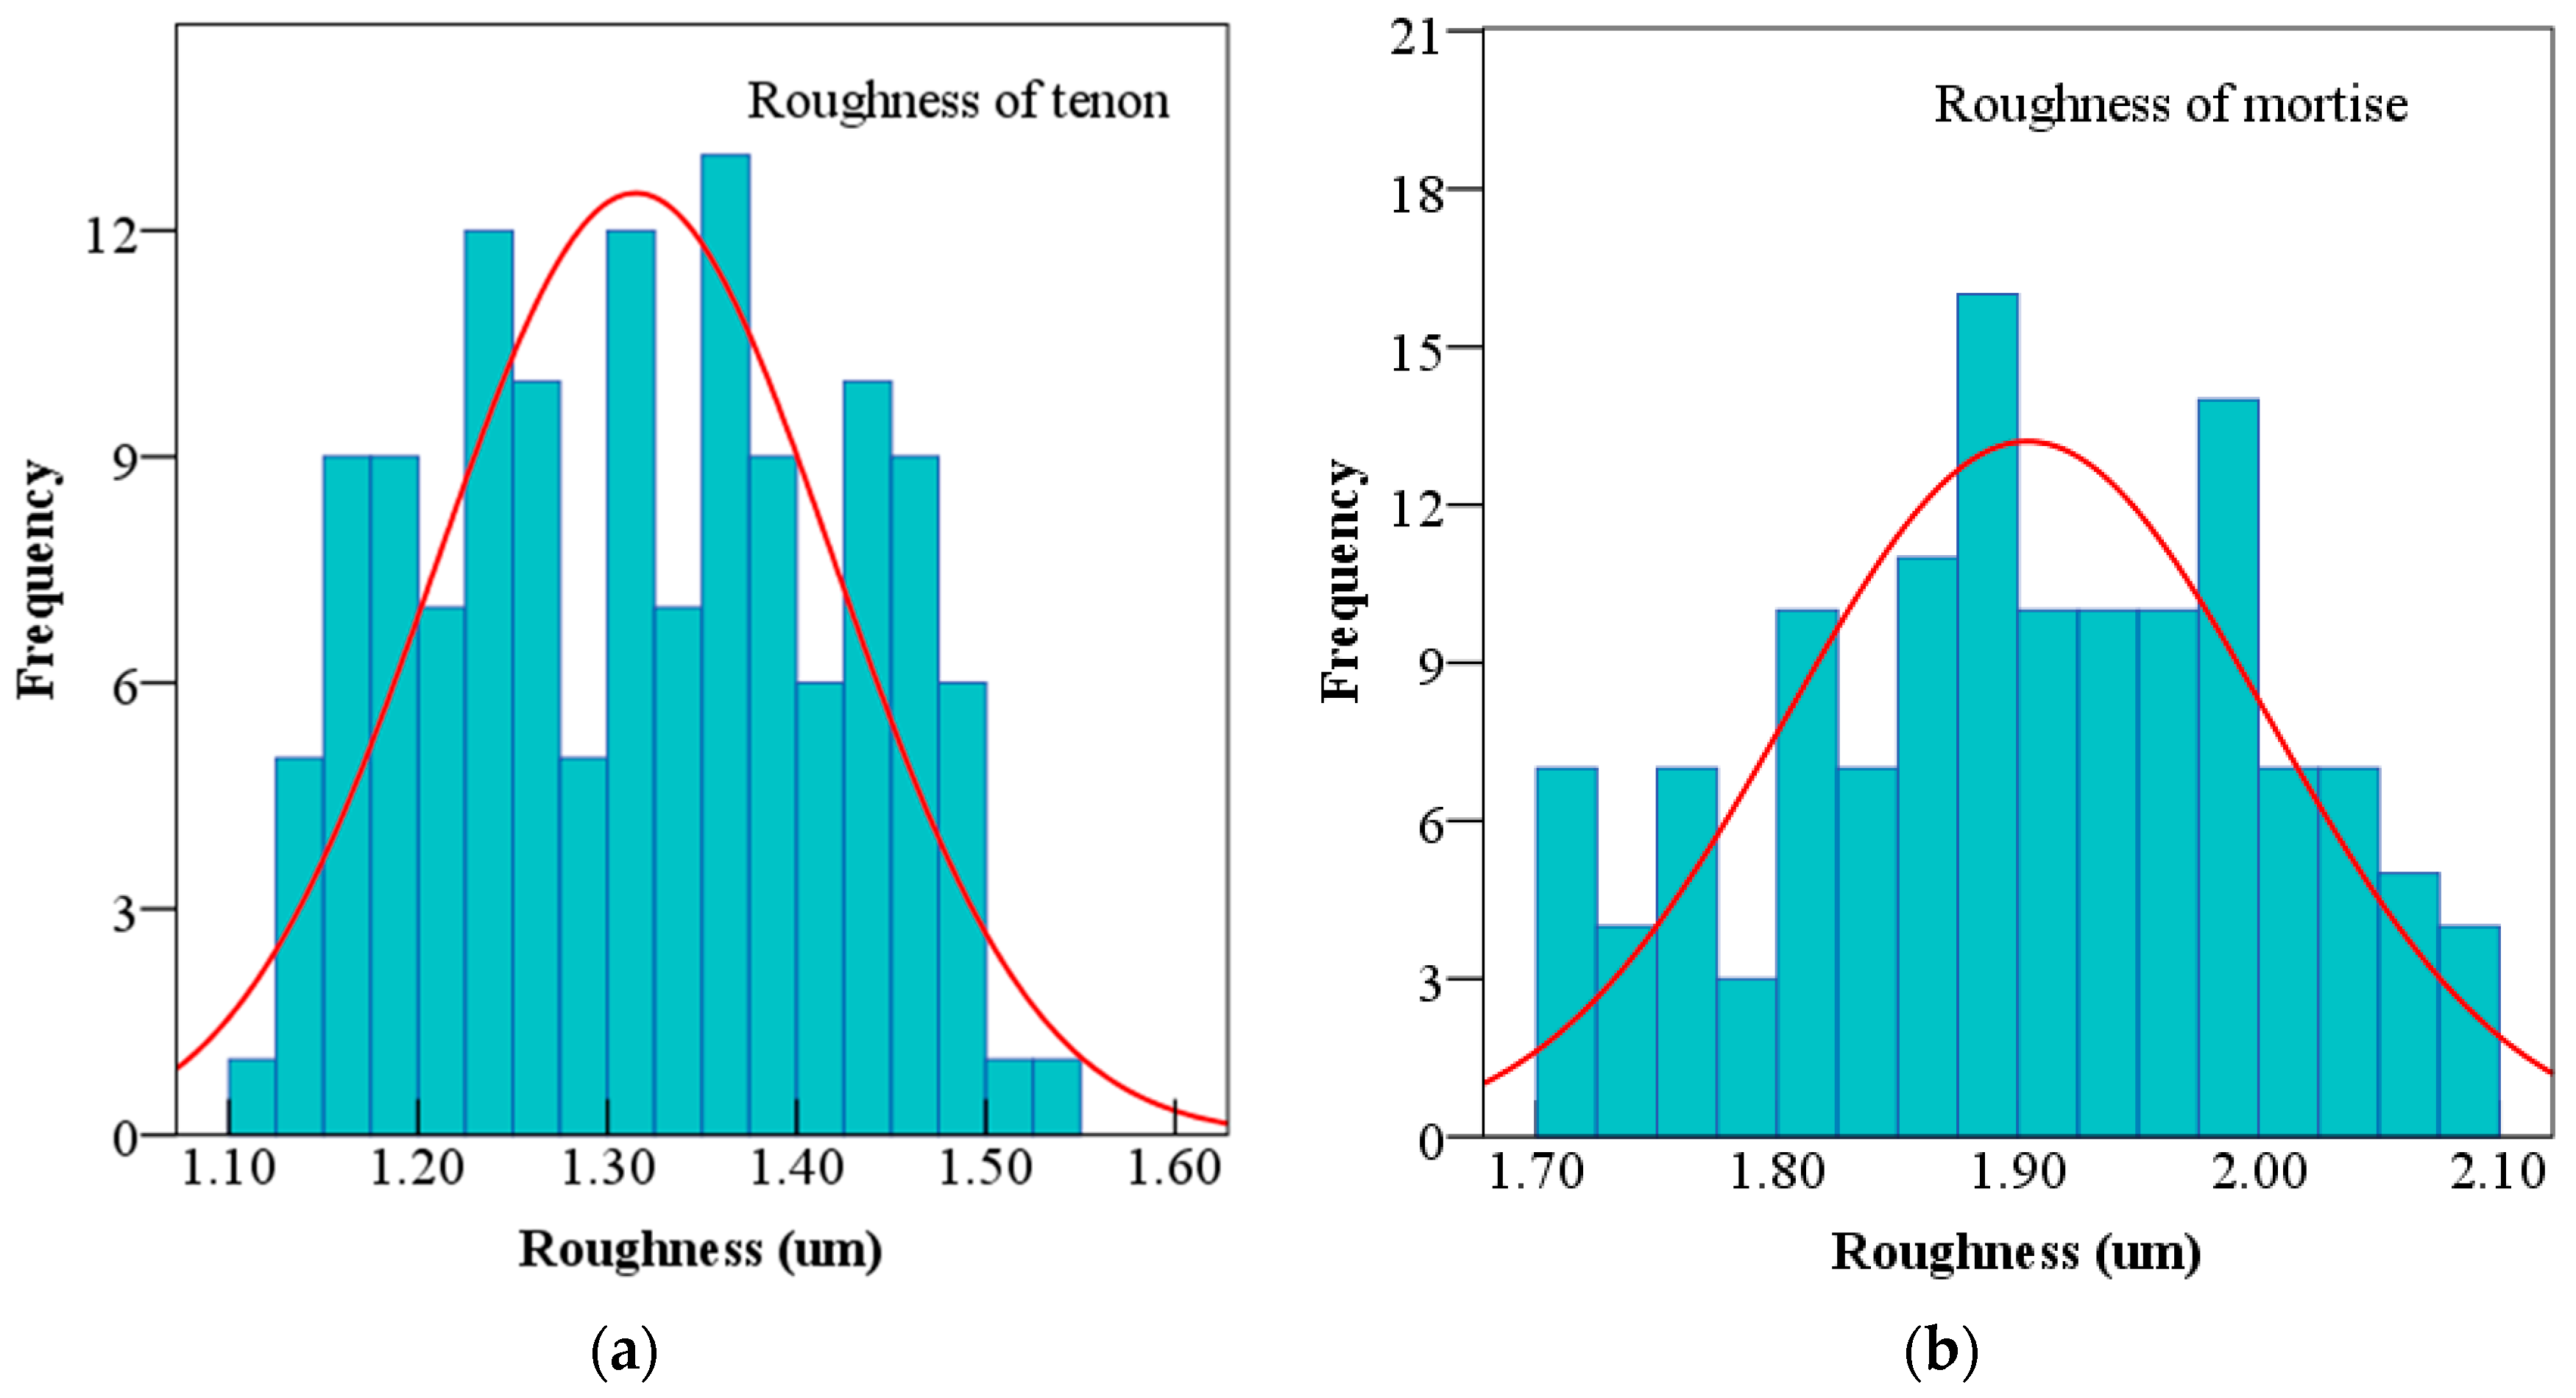
Figure 8a,b show the results of normality tests of the roughness of mortise (RM) and tenon (RT) data, respectively, measured at each combination of CLA and CLC. There were 144 data points analyzed using SPSS software for each. The skewness and kurtosis of the RT were 0.004 and −1.081, respectively, and those for RM were −0.185 and −0.741, respectively, which indicate that the roughness data, RT and RM, suit for normal distributions, and these data can be used to conduct the UNIANOVA analysis.
Table 2 shows the results of the two-way UNIANOVA evaluating the effects of CLA and CLC on RM and RT. In terms of p-value, it demonstrates that the main effects of CLA and CLC on RM and RT are significant. Furthermore, CLA has a greater effect on RM and RT than CLC in terms of the F-value. The interaction effect of CLA and CLC on RT is significant, but that on RM is not significant. To further clarify these differences, post comparisons were conducted.
Table 3 summarizes the roughness, Ra, and the values of mortise and tenon after cyclic load at each combination of CLA and CLC. The initial values of RM and RT are 2.252 (4.9) and 2.171 (6.1) μm, respectively, with a coefficient of variance (COV) in brackets. In the case of the CLC, the RM and RT decrease as the CLC increases for each CLA, except 75% and 100% at CLAs of 250 N and 300 N. It may be caused because reductions of RM and RT have been nearly completed at higher CLA and CLC, which means that the M–T joint has approached its fatigue life. In terms of the CLA, the RM and RT consistently increase with increasing CLA for each CLC without any exception.
To further characterize the changing laws of RM and RT, Figure 9 shows the fitting lines of the roughness of tenon and mortise vs. CLC at each of four CLAs using the non-linear regression method. It indicates that the RM is much higher than that of RT during the whole cyclic load process with all fitting lines of the mortise (Equations (2)–(5)) beyond those of the tenons (Equations (6)–(9)). The power function was viable for fitting the relationships between roughness and CLC at each CLA, with r2 higher than 0.99.
R M 150 N = 7.47 / ( 1 + ( C L C / 165852.23 ) 0.41 ) 5.22
R M 200 N = 10.81 / ( 1 + ( C L C / 117818.37 ) 0.46 ) 8.57
R M 250 N = 1.1 / ( 1 + ( C L C / 171.71 ) 0.59 ) + 1.15
R M 300 N = 0.94 / ( 1 + ( C L C / 61.3 ) 0.52 ) + 1.31
R T 150 N = 5.34 / ( 1 + ( C L C / 43594200 ) 0.13 ) 3.18
R T 200 N = 1.04 / ( 1 + ( C L C / 7.44 ) 0.65 ) + 1.14
R T 250 N = 1.93 / ( 1 + ( C L C / 97.65 ) 0.22 ) + 0.24
R T 300 N = 2.32 / ( 1 + ( C L C / 488.93 ) 0.14 ) 0.15

3.2. Effects on the Friction Coefficient Between Tenon and Mortise

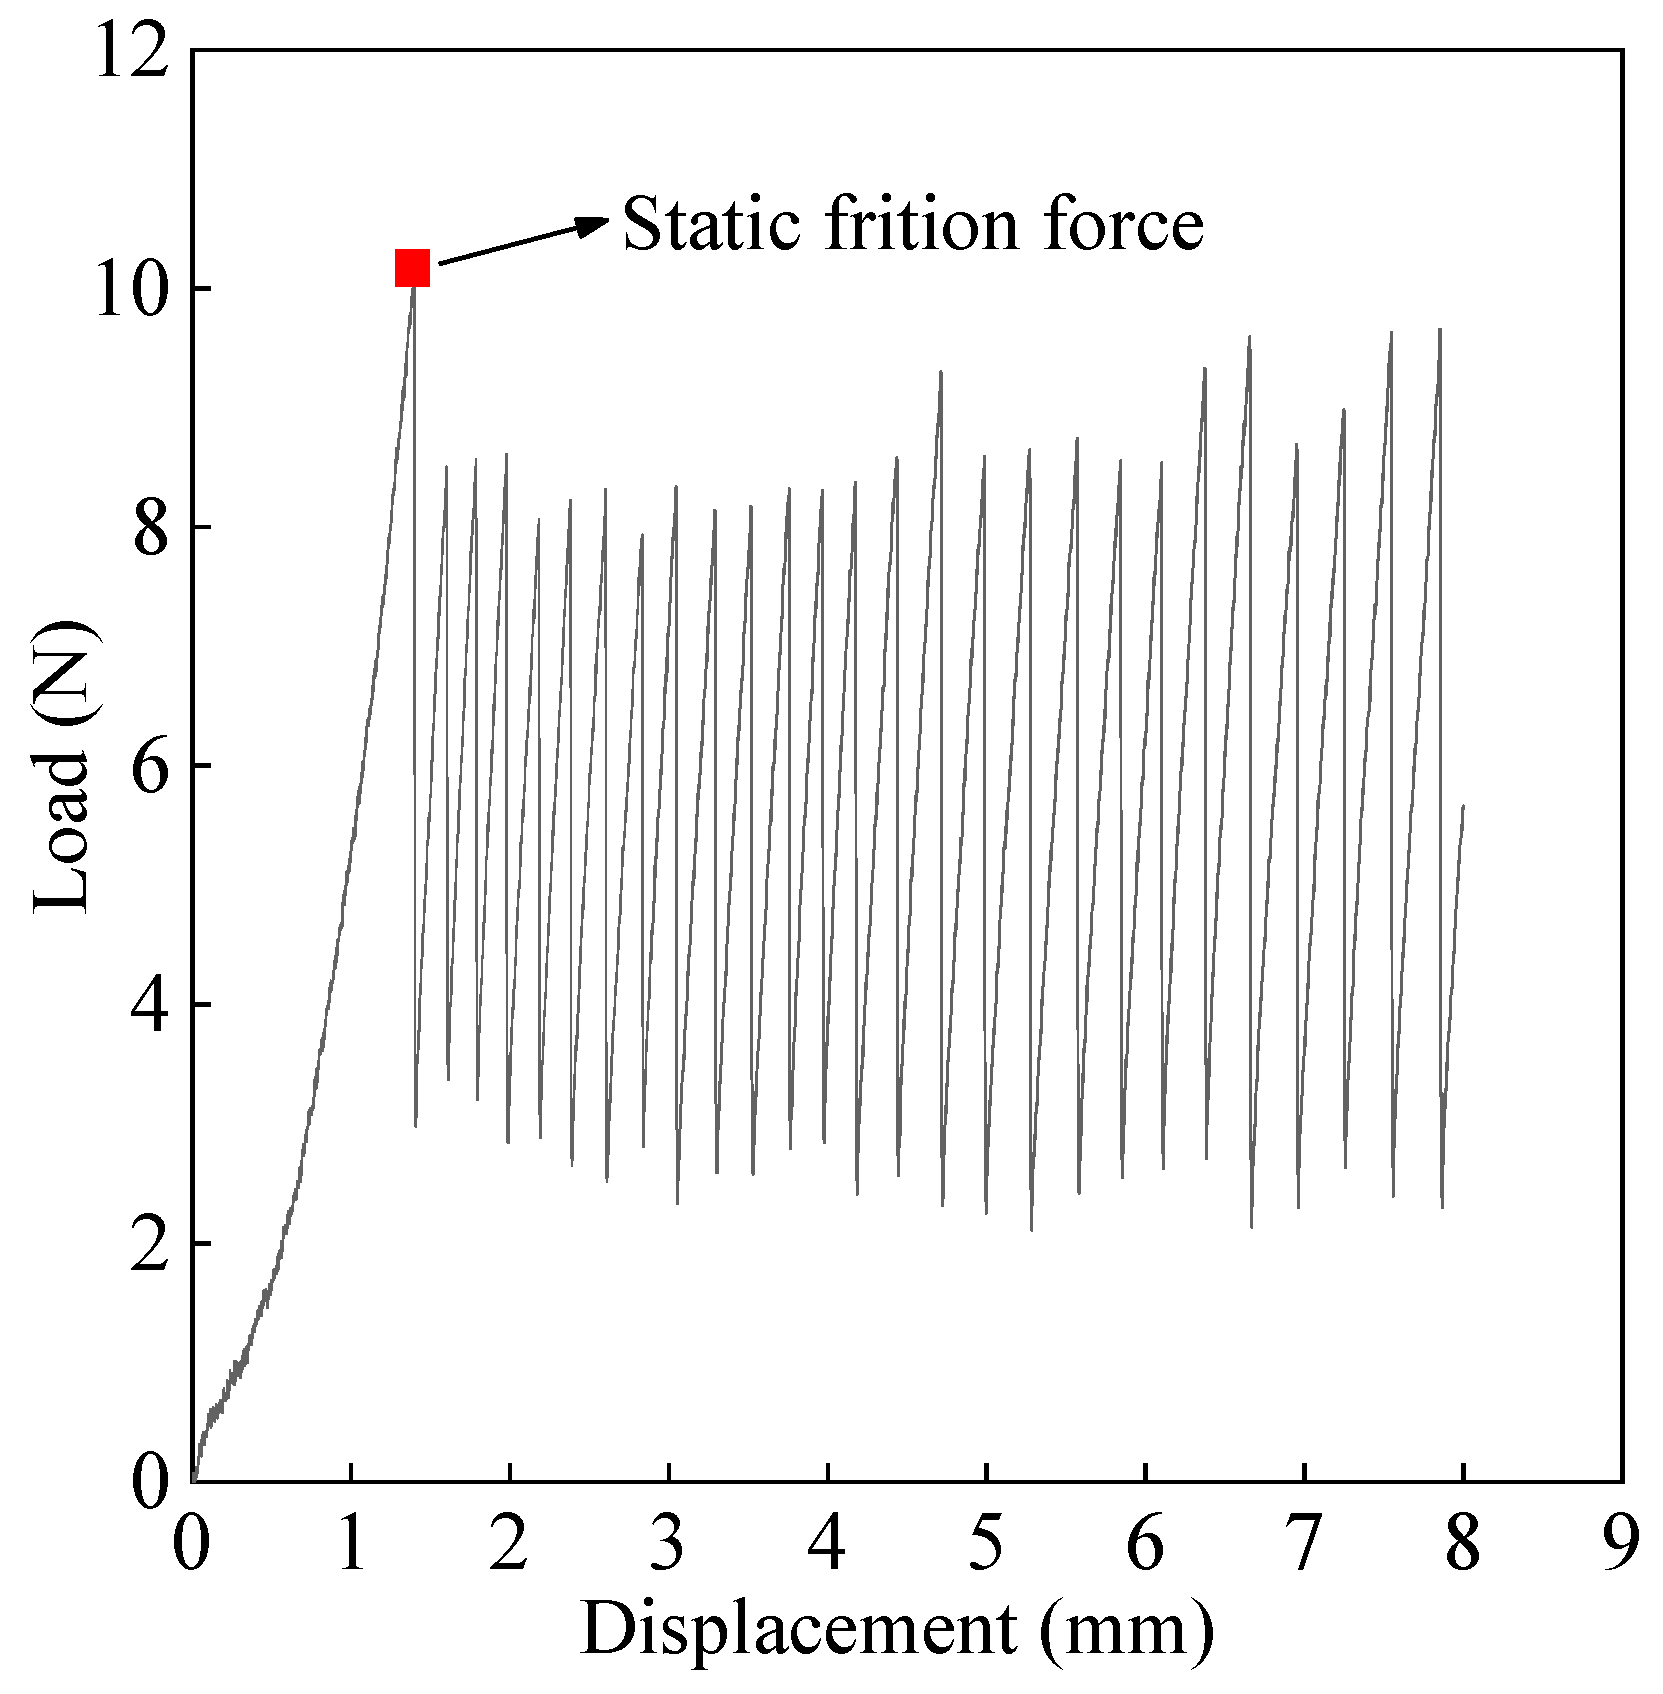
Figure 10 presents a representative load–displacement curve when measuring the friction coefficient using the setup shown in Figure 6. In terms of the mechanical behavior of the curve, it can be found that the maximum value of each peak corresponds to the static friction force because sliding occurs when reaching the peak. Therefore, the static friction coefficient between mortise and tenon is made available using Equation (1). All friction coefficients of M–T joints when subjected to each combination of CLA and CLC were further analyzed using a statistical analysis method to clarify their differences.
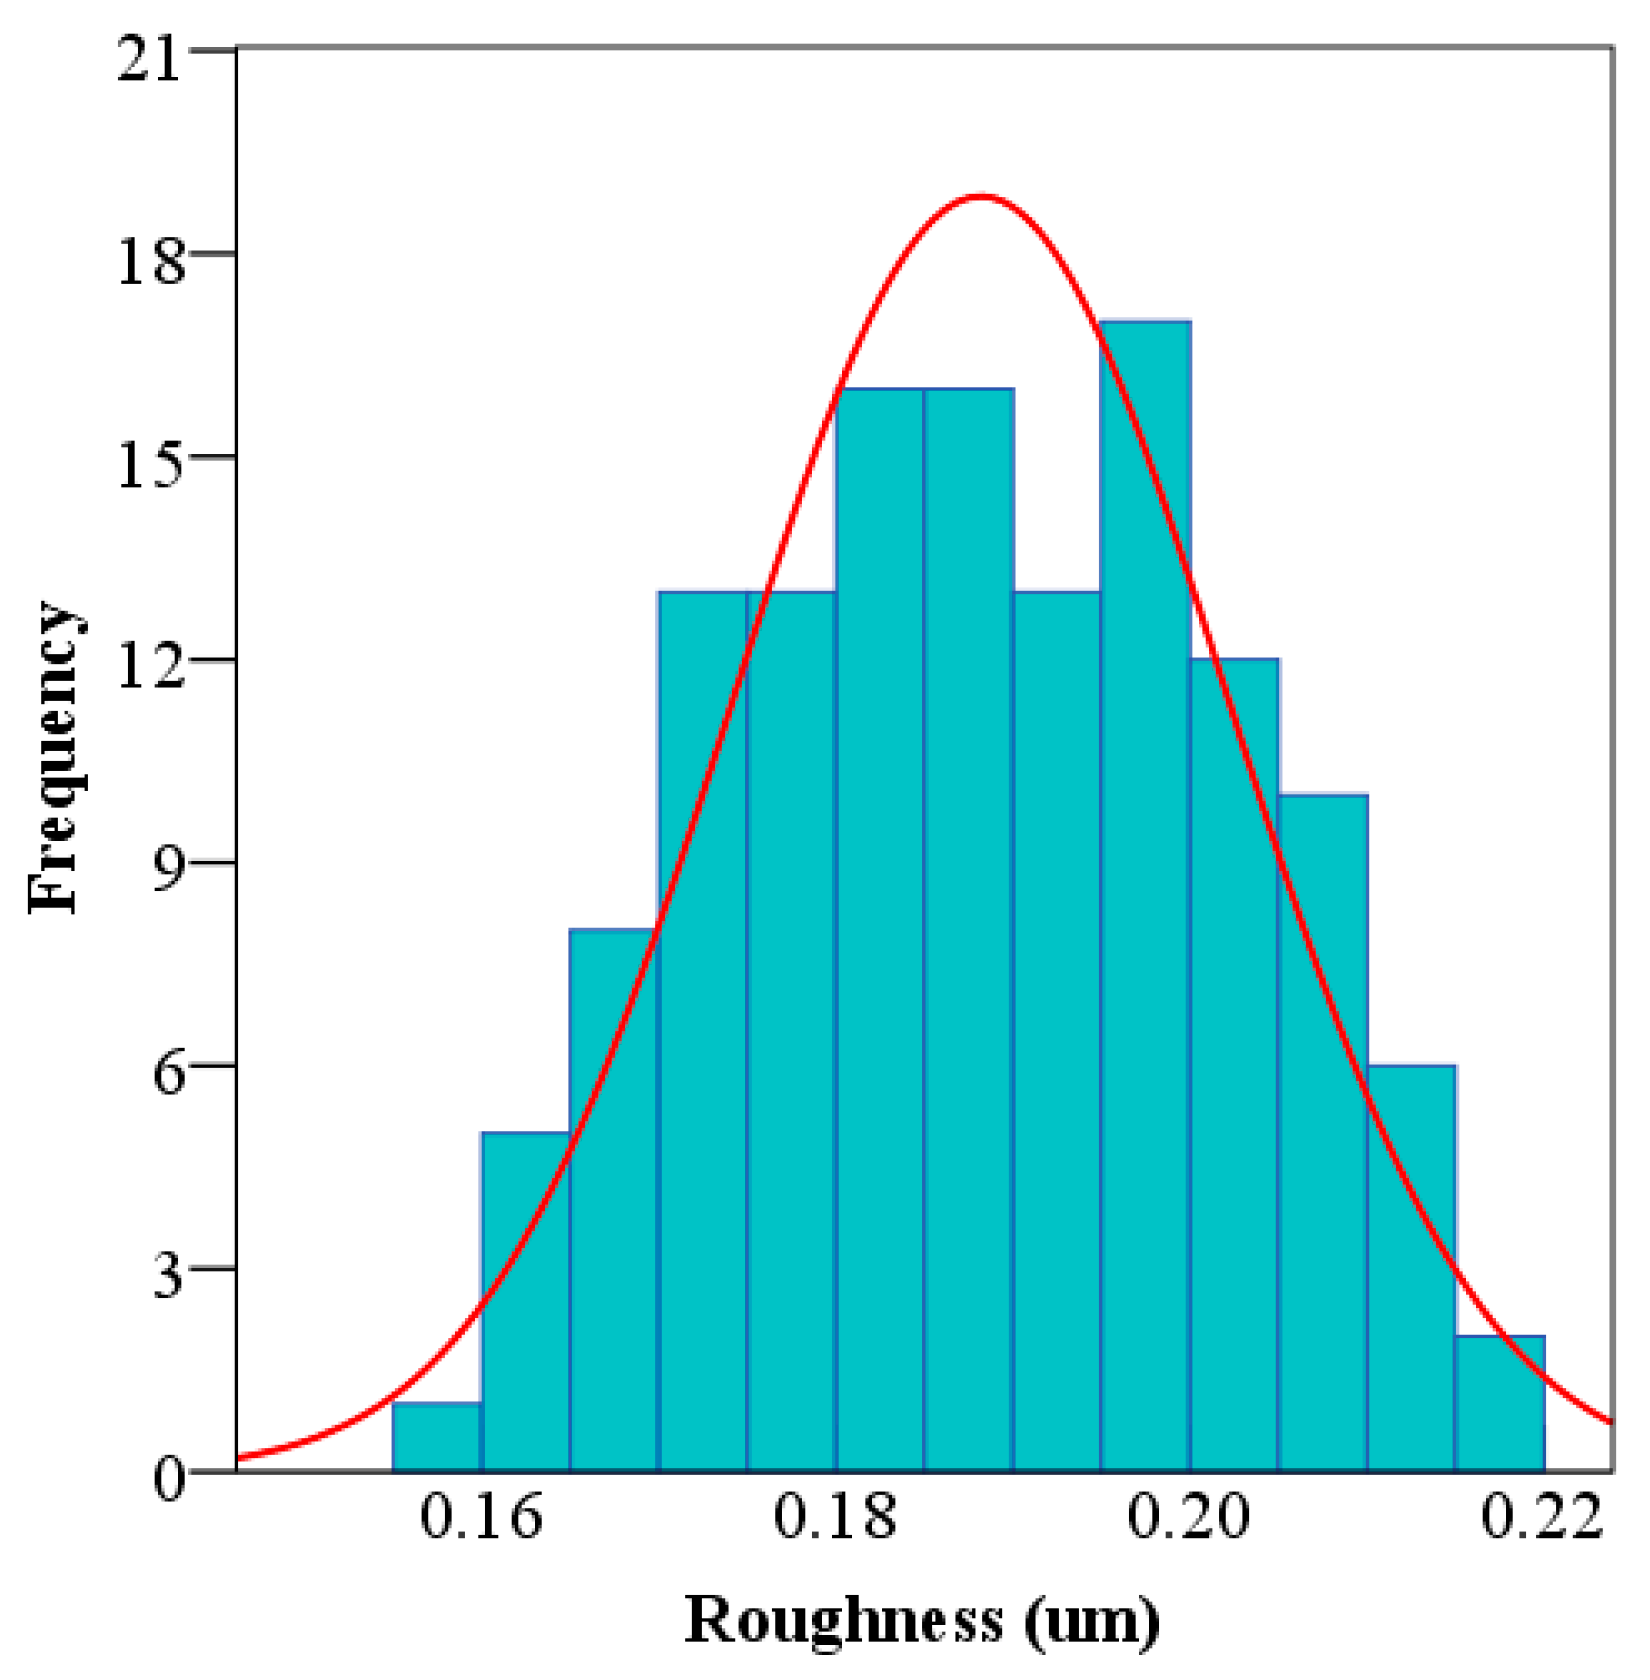
Figure 11 indicates the normality test of the friction coefficient of the M–T joint determined at each combination of CLA and CLC based on 144 measurements. The skewness and kurtosis of the friction coefficient of the tenon are 0.007 and −0.755, respectively, which indicates that these data suit for the normal distribution and can be further used to conduct the UNIANOVA analysis.
Table 4 shows the UNIANOVA results of the effects of CLA and CLC on the friction coefficient of the M–T joint. In terms of p-value, it indicates that CLA and CLC have significant effects on the friction coefficient between mortise and tenon, but the two-way interaction effect is not significant. To further clarify the differences between each combination of CLA and CLC, mean comparisons of friction coefficients were conducted.
Table 5 compares the values of the friction coefficient measured at each combination of CLA and CLC. In terms of CLC, the friction coefficient significantly decreases as CLC increases for almost every CLA, especially from CLC of 0% to 25%. However, for the CLA of 150 N, the differences in friction coefficient between CLC of 25% and 50%, and 75% and 100% are not significant. This may result from the fact that 150 N is nearly the fatigue ultimate load [53], where the fatigue life is commonly regarded as infinite, which causes any two CLCs with a small increase not to have a significant difference. In the case of the CLA, the friction coefficients tend to decrease as the CLA increases. However, for CLC, not more than 25%, there is no significant difference as the CLA increases from 150 N to 250 N. This may be caused by a large margin of reduction from CLC of 0% to 25% for all CLAs.
Figure 12 shows the fitting lines of the friction coefficient of M–T joints relating to CLC using the nonlinear regression method. Equations (10)–(13) indicate that the power function was viable to regress the relationships between the friction coefficient and CLC at each CLA, with r2 higher than 0.99. Fitting lines further demonstrate that the friction coefficient reduces by a large margin as CLC increases from 0% to 25% for each CLA, and a slight reduction is observed from 75% to 100%.
F c 150 N = 0.58 / ( 1 + ( C L C / 1212750 ) 0.09 ) 0.22
F c 200 N = 0.62 / ( 1 + ( C L C / 53253.42 ) 0.14 ) 0.26
F c 250 N = 0.22 / ( 1 + ( C L C / 4.32 ) 0.64 ) + 0.15
F c 300 N = 0.71 / ( 1 + ( C L C / 75624.75 ) 0.14 ) 0.34

3.3. Relationships Between Roughness and Friction Coefficient

Figure 13 presents the relationships between the friction coefficient vs. RM and RT when subjected to each CLA during the cyclic load process. The regression formulas are shown in Equations (14)–(17) corresponding to CLA of 150 N, 200 N, 250 N, and 300 N, respectively, with r2 higher than 0.95. It indicates that their relationships can be well fitted and described by a quadratic model during the fatigue evolution progression:
F 150 N = 0.815 0.463 R T 0.372 R M + 0.108 R T 2 + 0.06 R M 2 + 0.115 R T R M
F 200 N = 0.191 0.059 R T 0.075 R M + 0.055 R T 2 + 0.034 R M 2 + 0.002 R T R M
F 250 N = 0.825 1.048 R T 0.08 R M + 0.354 R T 2 + 0.005 R M 2 + 0.123 R T R M
F 300 N = 1.15 0.693 R T 0.757 R M + 0.102 R T 2 + 0.131 R M 2 + 0.302 R T R M
where F150N, F200N, F250N, and F300N indicate the friction coefficient when subjected to cyclic loads of 150 N, 200 N, 250 N, and 300 N, respectively. RT and RM mean roughness, Ra, of the tenon and mortise, respectively.

4. Limitations and Future Work

In this study, the M–T joint without glue was applied to investigate the roughness and the friction coefficient between the round-end mortise and tenon. It is known that the strengths of M–T joints mainly depend on the interference fit and frictional coefficient between mortise and tenon, while glue is commonly used synchronously to enhance the strengths of the M–T joints. When the mortise and tenon are assembled, in the width direction, the width of the tenon is greater than that of the mortise in order to generate an interference fit between the mortise and tenon. However, in the thickness direction, the thickness of the tenon is commonly equal to or smaller than that of the mortise. It is the most commonly used technique for constructing M–T joints in China and other countries [53,54]. In this context, even though glue is applied, it can be observed only in the thickness direction (clearance fit), but there is no glue in the width direction because of the interference fit. Previous studies [53,54] also proved this point. One of the aims of this study was to provide basic data for modeling the fatigue of the M–T joint. Therefore, the results of this study can also be used in the modeling of glued joints.
In future studies, the fatigue of glued M–T joints will be investigated when subjected to cyclic load and compared with the results of this study. Additionally, the fit between mortise and tenon can also change when subjected to cyclic load because of the deformations of the mortise and tenon. Therefore, the changing laws of M–T joint fit during fatigue evolution progression are also a critical factor that needs to be investigated in future studies. Then, the changing laws of the friction coefficient and M–T joint fit can be used to numerically model the fatigue of the M–T joint when subjected to cyclic load.

5. Conclusions

In this study, the effects of CLA and CLC on RM, RT, and the friction coefficient of the round-end M–T joint were investigated when subjected to cyclic load in order to explore the fatigue evolution progression of the beech wood M–T joint for modeling the fatigue of M–T joints. The following conclusions were drawn.
(1)
Both CLA and CLC have significant effects on RM, RT, and the friction coefficient of the round-end M–T joint, but the effect of CLA is much greater than that of CLC.
(2)
The RM, RT, and friction coefficient between mortise and tenon decrease non-linearly as the CLA and CLC increase, complying with the law of power function.
(3)
The relationships between the friction coefficient and RM and RT can be well fitted by a quadratic model during fatigue evolution progression at each of the four CLAs.
(4)
The fatigue evolution progressions of RM, RT, and the friction coefficient between mortise and tenon provide a new insight for understanding the fatigue of the round-end M–T joint, and supply basic data for numerically modeling the fatigue of the round-end M–T joint using FEM.

Author Contributions

Conceptualization, F.S., W.H., and T.Z.; methodology, F.S., W.H., and T.Z.; software, F.S., W.H., and T.Z.; validation, F.S., W.H., and T.Z.; formal analysis, F.S., W.H., and T.Z.; investigation, F.S., W.H., and T.Z.; resources, W.H., T.Z.; data curation, F.S., W.H., and T.Z.; writing-original draft preparation, F.S., W.H., and T.Z.; writing review and editing, F.S., W.H., and T.Z.; supervision, W.H. and T.Z. All authors have read and agreed to the published version of the manuscript.

Funding

This paper was not supported by any funding.

Data Availability Statement

The data are contained within the article.

Acknowledgments

The authors would like to show their gratitude to the wood carpenter, Yang, for preparing the samples.

Conflicts of Interest

There are no conflicts of interest for any of the authors.

References

  1. Yan, Y.; Xu, Z.; Zhu, L.; Lv, J. Innovative design model for the mortise and tenon structure. BioResources 2024, 19, 5413–5434. [Google Scholar] [CrossRef]
  2. Zhou, C.; Luo, Y.; Kaner, J. Exploring the impact of display types of information about autonomous driving in semi-autonomous vehicles on drivers’ situation awareness and take-over performance under different driving scenarios. PLoS ONE 2025, 20, e0329760. [Google Scholar] [CrossRef] [PubMed]
  3. Hang, J.; Han, Y.; Yan, X.; Li, J. Effect of shellac–rosin microcapsules on the self-healing properties of waterborne primer on wood surfaces. Coatings 2025, 15, 1003. [Google Scholar] [CrossRef]
  4. Xu, X.; Xiong, X.; Yue, X.; Zhang, M. A parametric optimized method for three-dimensional corner joints in wooden furniture. Forests 2023, 14, 1063. [Google Scholar] [CrossRef]
  5. Zhang, W.; Zou, Y.; Yan, X.; Li, J. Influence of two types of microcapsule composites on the performance of thermochromic UV coatings on bleached poplar wood surfaces. Coatings 2025, 15, 1001. [Google Scholar] [CrossRef]
  6. Likos, E.; Haviarova, E.; Eckelman, C.A.; Erdil, Y.Z.; Özcifci, A. Effect of tenon geometry, grain orientation, and shoulder on bending moment capacity and moment rotation characteristics of mortise and tenon joints. Wood Fiber Sci. 2012, 44, 462–469. [Google Scholar]
  7. Miao, Y.; Pan, S.; Xu, W. Staple holding strength of furniture frame joints constructed of plywood and solid wood. Forests 2022, 13, 2006. [Google Scholar] [CrossRef]
  8. Záborský, V.; Boruvka, V.; Kašicková, V.; Ruman, D. Effect of wood species, adhesive type and annual ring directions on the stiffness of rail to leg mortise and tenon furniture joints. BioResources 2017, 12, 7016–7031. [Google Scholar] [CrossRef]
  9. Chen, B.; Guan, H. A novel method and validation for obtaining the optimal interference fit of round-end mortise-and-tenon joint. Wood Mater. Sci. Eng. 2023, 18, 1619–1629. [Google Scholar] [CrossRef]
  10. Hu, W.; Yu, R. Study on the strength mechanism of the wooden round-end mortise-and-tenon joint using the digital image correlation method. Holzforschung 2024, 78, 519–530. [Google Scholar] [CrossRef]
  11. Korkut, I.; Donertas, M.A. The influence of feed rate and cutting speed on the cutting forces, surface roughness and tool–chip contact length during face milling. Mater. Des. 2007, 28, 308–312. [Google Scholar] [CrossRef]
  12. Jiang, S.; Buck, D.; Tang, Q.; Guan, J.; Wu, Z.; Guo, X.; Zhu, Z.; Wang, X. Cutting force and surface roughness during straight-tooth milling of Walnut wood. Forests 2022, 13, 2126. [Google Scholar] [CrossRef]
  13. Đukić, I.; Merhar, M.; Jovanović, J. Analysis of theoretical machined surface roughness profile after sawing solid oak wood (Quercus robur L.) along the grain with a circular saw. Wood Mater. Sci. Eng. 2023, 18, 1534–1544. [Google Scholar] [CrossRef]
  14. Fujiwara, Y.; Fujii, Y.; Okumura, S. Relationship between roughness parameters based on material ratio curve and tactile roughness for sanded surfaces of two hardwoods. J. Wood Sci. 2005, 51, 274–277. [Google Scholar] [CrossRef]
  15. Kilic, M.; Hiziroglu, S.; Burdurlu, E. Effect of machining on surface roughness of wood. Build. Environ. 2006, 41, 1074–1078. [Google Scholar] [CrossRef]
  16. Luo, B.; Zhang, J.; Bao, X.; Liu, H.; Li, L. The effect of granularity on surface roughness and contact angle in wood sanding process. Measurement 2022, 165, 108133. [Google Scholar] [CrossRef]
  17. Adamčík, L.; Dzurenda, L.; Banski, A.; Kminiak, R. Comparison of surface roughness of beech wood after sanding with an eccentric and belt sander. Forests 2023, 15, 45. [Google Scholar] [CrossRef]
  18. Yu, Y.; Buck, D.; Yang, H.; Du, X.; Song, M.; Wang, J.; Zhu, Z. Cutting power, temperature, and surface roughness, a multiple target assessment of beech during diamond milling. Forests 2023, 14, 1163. [Google Scholar] [CrossRef]
  19. Fu, W.; Guan, H.; Chen, B. Investigation on the influence of moisture content and wood section on the frictional properties of beech wood surface. Tribol. Trans. 2021, 64, 830–840. [Google Scholar] [CrossRef]
  20. Karlinasari, L.; Lestari, A.T.; Priadi, T. Evaluation of surface roughness and wettability of heat-treated, fast-growing tropical wood species sengon (Paraserianthes falcataria (L.) I.C.Nielsen), jabon (Anthocephalus cadamba (Roxb.) Miq), and acacia (Acacia mangium Willd.). Int. Wood Prod. J. 2018, 9, 142–148. [Google Scholar] [CrossRef]
  21. Pelit, H.; Arısüt, U. Roughness, wettability, and morphological properties of impregnated and densified wood materials. BioResources 2023, 18, 429–446. [Google Scholar] [CrossRef]
  22. Kang, C.W.; Hashitsume, K.; Jang, E.; Kolya, H. Relationship between wood anatomical features and surface roughness characteristics. Wood Research 2023, 68, 455–464. [Google Scholar] [CrossRef]
  23. Thoma, H.; Peri, L.; Lato, E. Evaluation of wood surface roughness depending on species characteristics. Maderas. Cienc. Y Tecnol. 2015, 17, 285–292. [Google Scholar] [CrossRef]
  24. Dong, Y.; Yan, X. Preparation of high self-healing diels–alder (DA) synthetic resin and its influence on the surface coating properties of poplar wood and glass. Coatings 2025, 15, 988. [Google Scholar] [CrossRef]
  25. Wang, Y.; Jia, M.; Qi, Y.; Ji, X.; Sun, S.; Zhao, Z. Preparation and investigation of a novel plywood eco-friendly adhesive composed with lactic acid and polyvinyl alcohol. Wood Mater. Sci. Eng. 2025, 19, 1–13. [Google Scholar] [CrossRef]
  26. Chang, W.; Han, Y.; Yan, X.; Li, J. Preparation and performance characterization of melamine-formaldehyde-microencapsulated waterborne topcoat–brass powder–waterborne acrylic coating. Coatings 2025, 15, 951. [Google Scholar] [CrossRef]
  27. Qi, Y.; Wang, L.; Sun, S.; Zhao, Z. A comparison of the mechanical properties, chemical composition, and thermoplastic rheological properties of small-and large-diameter round timber. Wood Mater. Sci. Eng. 2025, 19, 1–9. [Google Scholar] [CrossRef]
  28. Zhang, N.; Zhu, Y.; Yan, X. Effect of tea tree essential oil@chitosan microcapsules on surface coating properties of pine wood. Coatings 2025, 15, 938. [Google Scholar] [CrossRef]
  29. Deng, J.; Yan, X. Preparation of tung oil microcapsules coated with chitosan–arabic gum and its effect on the properties of UV coating. Polymers 2025, 17, 1985. [Google Scholar] [CrossRef]
  30. Liu, Q.; Gao, D.; Xu, W. Effect of paint process on the performance of modified poplar wood antique. Coatings 2021, 11, 1174. [Google Scholar] [CrossRef]
  31. Chang, W.; Deng, J.; Yan, X. Influence of chitosan–sodium tripolyphosphate-coated tung oil microcapsules on the UV coating performance of cherry wood surface. Coatings 2025, 15, 949. [Google Scholar] [CrossRef]
  32. Qi, Y.; Sun, Y.; Zhou, Z.; Huang, Y.; Li, J.; Liu, G. Response surface optimization based on freeze-thaw cycle pretreatment of poplar wood dyeing effect. Wood Res. 2023, 68, 293–305. [Google Scholar] [CrossRef]
  33. Zhong, Z.; Hiziroglu, S.; Chan, C. Measurement of the surface roughness of wood based materials used in furniture manufacture. Measurement 2013, 46, 1428–1487. [Google Scholar] [CrossRef]
  34. Hu, W.; Guan, H. A finite element model of semi-rigid mortise-and-tenon joint considering glue line and friction coefficient. J. Wood Sci. 2019, 65, 14. [Google Scholar] [CrossRef]
  35. Fu, W.; Guan, H. Numerical and theoretical analysis of the contact force of oval mortise and tenon joints concerning outdoor wooden furniture structure. Wood Sci. Technol. 2022, 56, 1205–1237. [Google Scholar] [CrossRef]
  36. Eckelman, C.A. The fatigue strength of two-pin moment-resisting dowel joints. For. Prod. J. 1970, 20, 42–45. [Google Scholar]
  37. Wu, W.; Xu, W.; Wu, S. Mechanical performance analysis of double-dovetail joint applied to furniture T-shaped components. BioResources 2024, 19, 5862–5879. [Google Scholar] [CrossRef]
  38. Xu, X.; Zhang, M.; Yue, X.; Xiong, X. Design of furniture mortise-and-tenon joints: A review of mechanical properties and design recommendations. Wood Mater. Sci. Eng. 2025, 19, 1–15. [Google Scholar] [CrossRef]
  39. Ratnasingam, J.; Perkins, M.; Reid, H. Fatigue: It’s relevance to furniture. HolzalsRoh Werkst. 1997, 55, 297–300. [Google Scholar] [CrossRef]
  40. Fu, W.; Guan, H.; Li, W.; Sawata, K.; Zhao, Y. Elastoplastic performance of wood under compression load considering cross-grain orientation and moisture content. Eur. J. Wood Wood Prod. 2023, 81, 111–124. [Google Scholar] [CrossRef]
  41. Haviarova, E.; Eckelman, C.A.; Erdil, Y. Design and testing of environmentally friendly wood school chairs for developing countries. For. Prod. J. 2001, 51, 58–64. [Google Scholar]
  42. Eckelman, C.; Erdil, Y.; Haviarova, E. School chairs for developing countries: Designing for strength and durability, simplicity, and ease of construction. For. Prod. J. 2003, 53, 63–70. [Google Scholar]
  43. Eckelman, C.; Haviarova, E. Performance tests of school chairs constructed with round mortise and tenon joints. For. Prod. J. 2006, 56, 51–57. [Google Scholar]
  44. Likos, E.; Haviarova, E.; Eckelman, C.A.; Erdil, Y.; Ozcifci, A. Static versus cyclic load capacity of side chairs constructed with mortise and tenon joints. Wood Fiber Sci. 2013, 45, 223–227. [Google Scholar]
  45. Uysal, M.; Haviarova, E.; Eckelman, C.A. A comparison of the cyclic durability, ease of disassembly, repair, and reuse of parts of wooden chair frames. Mater. Des. 2015, 87, 75–81. [Google Scholar] [CrossRef]
  46. Haviarova, E.; Eckelman, C.A.; Erdil, Y. Design and testing of wood school desk frames suitable for production by low technology methods from waste wood residues. For. Prod. J. 2001, 51, 79–88. [Google Scholar]
  47. Haviarova, E.; Eckelman, C.A.; Joscak, P. Analysis, design, and performance testing of a gate-leg table. Wood Fiber Sci. 2008, 40, 279–287. [Google Scholar]
  48. Erdil, Y.; Eckelman, C.A.; Haviarova, E. Design and construction of school work tables for developing countries. For. Prod. J. 2009, 59, 50–56. [Google Scholar]
  49. Ratnasingam, J.; Ioras, F. Effect of adhesive type and glue-line thickness on the fatigue strength of mortise and tenon furniture joints. Eur. J. Wood Wood Prod. 2013, 71, 819–821. [Google Scholar] [CrossRef]
  50. Ratnasingam, J.; Ioras, F. Static and fatigue strength of oil palm wood used in furniture. J. Appl. Sci. 2010, 10, 986–990. [Google Scholar] [CrossRef]
  51. Ratnasingam, J.; Ioras, F. Bending and fatigue strength of mortise and tenon furniture joints made from oil palm lumber. Eur. J. Wood Wood Prod. 2011, 69, 677–679. [Google Scholar] [CrossRef]
  52. Hu, W.; Luo, M.; Yu, R.; Zhao, Y. Effects of the selected factors on cyclic load performance of T-shaped mortise-and-tenon furniture joints. Wood Mater. Sci. Eng. 2024, 20, 1092–1101. [Google Scholar] [CrossRef]
  53. Džinčić, I.; Živanić, D. The influence of fit on the distribution of glue in oval tenon/mortise joint. Wood Res. 2014, 59, 297–302. [Google Scholar]
  54. Hu, W.; Guan, H.; Zhang, J. Finite element analysis of tensile load resistance of mortise-and-tenon joints considering tenon fit effects. Wood Fiber Sci. 2018, 50, 121–131. [Google Scholar] [CrossRef]
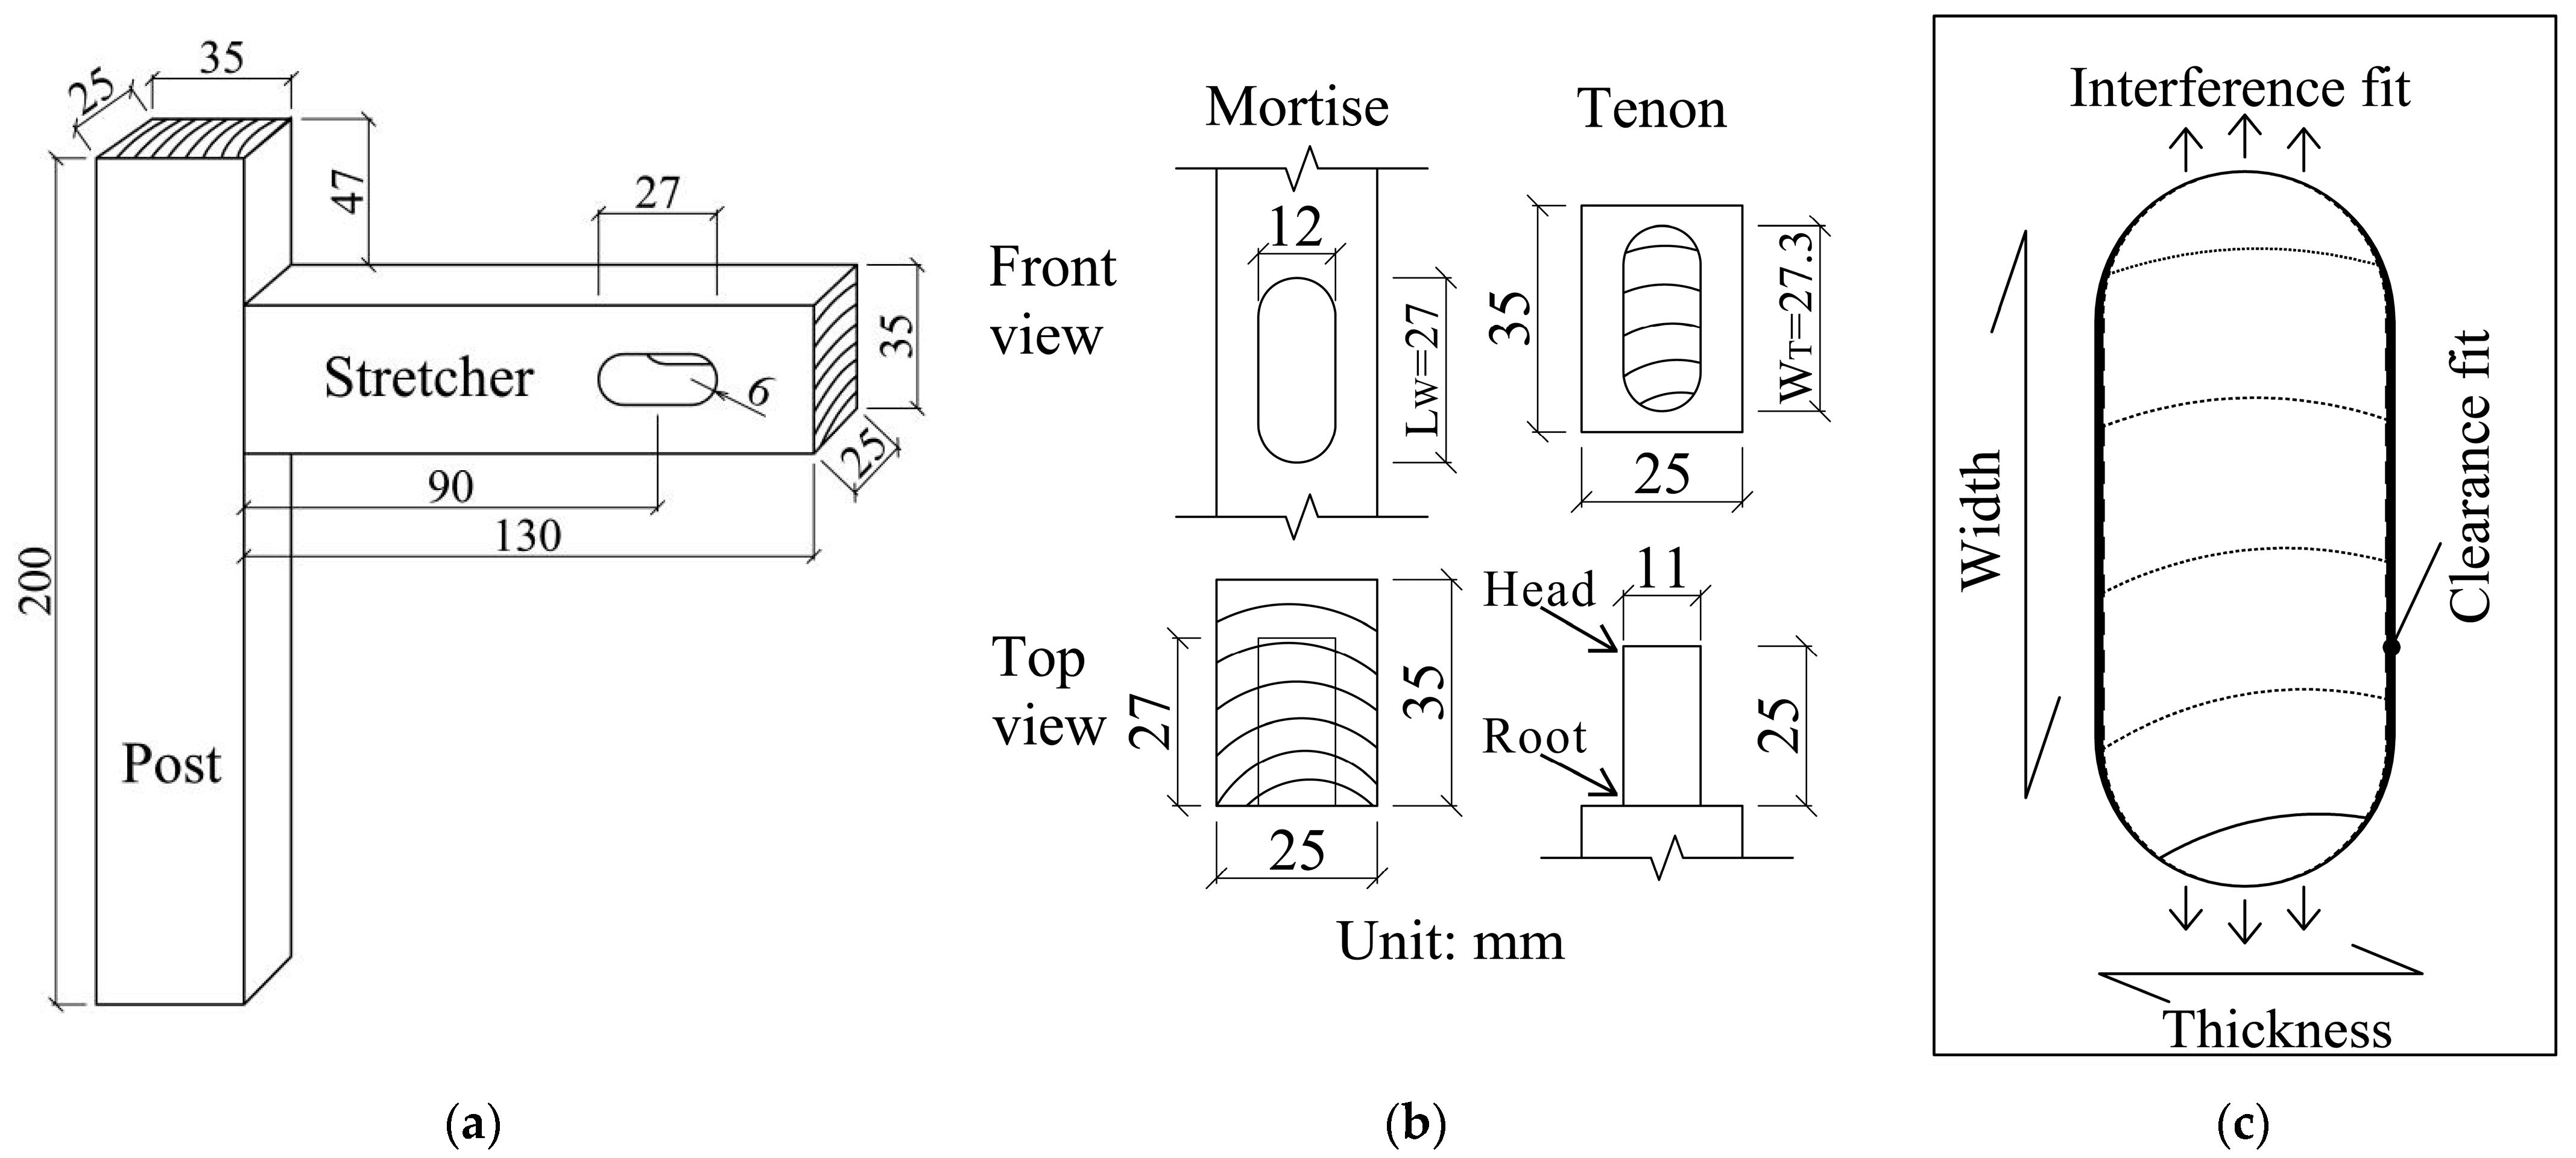
Figure 1. Dimensions (unit: mm) of L-shaped sample (a), mortise and tenon joint (b), and construction condition (c).
Forests 16 01635 g001
Figure 2. Configurations (unit: mm) of the cut-open mortise (a), tenon (b), and sample for determining the friction coefficient of the mortise–tenon joint (c).
Forests 16 01635 g002
Figure 3. Setup for conducting cyclic load tests of mortise–tenon joints (The unit is mm for dimensions in figure).
Forests 16 01635 g003
Figure 4. Cyclic load spectrum used in controlling the fatigue testing machine.
Forests 16 01635 g004
Figure 5. Setup for determining the roughness of mortises and tenons.
Forests 16 01635 g005
Figure 6. Setup for measuring the friction coefficient between mortise and tenon.
Forests 16 01635 g006
Figure 7. Representative roughness profiles of mortise and tenon when subjected to different load amplitudes at initial status and cyclic load count of 25% fatigue life of the mortise–tenon joint.
Forests 16 01635 g007
Figure 8. Normality of all 144 roughness data, Ra, of tenon (a) and mortise (b) involving effects of cyclic load amplitude and cyclic load count.
Forests 16 01635 g008
Figure 9. Relationships between roughness and cyclic load count of mortise and tenon at each cyclic load amplitude.
Forests 16 01635 g009
Figure 10. Representative load and displacement curve during friction coefficient measurements.
Forests 16 01635 g010
Figure 11. Normality test of friction coefficient data considering effects of cyclic load amplitude and cyclic load count.
Forests 16 01635 g011
Figure 12. Relationships between the friction coefficient and cyclic load count at each cyclic load amplitude.
Forests 16 01635 g012
Figure 13. Relationship between the friction coefficient of the mortise–tenon joint vs. roughness of mortise and tenon when subjected to cyclic load amplitudes: 150 N (a), 200 N (b), 250 N (c), and 300 N (d).
Forests 16 01635 g013
Table 1. Arrangements and sample replications of cyclic load tests of mortise–tenon joints.
CLCCLA (N)
150200250300
25%3333
50%3333
75%3333
100%3333
Table 2. Two-way UNIANOVA results of effects of CLA, CLC, and their interaction on roughness, Ra, of mortise and tenon.
SourcesRTRM
F-Valuep-ValueF-Valuep-Value
CLA679<0.001 *285<0.001 *
CLC202<0.001 *226<0.001 *
CLA × CLC30.0031.50.16
* means the factor is significant at 5% significance level.
Table 3. Summaries of roughness, Ra, of tenon and mortise for cyclic load count at each cyclic load amplitude.
ComponentCLA
(N)
Roughness, Ra (μm)
CLC (%)
25%50%75%100%
Tenon1501.479 (1.8) A,a1.442 (1.4) B,a1.403 (1.3) C,a1.368 (1.0) D,a
2001.459 (1.5) A,b1.366 (1.7) B,b1.324 (1.5) C,b1.295 (1.8) D,b
2501.350 (2.2) A,c1.284 (2.3) B,c1.233 (1.8) C,c1.212 (2.6) C,c
3001.247 (1.5) A,d1.195 (1.3) B,d1.161 (1.1) C,d1.141 (2.4) C,d
Mortise1502.055 (2.2) A,a2.005 (2.5) B,a1.952 (2.6) C,a1.917 (2.1) D,a
2002.030 (2.7) A,b1.969 (2.4) B,b1.899 (2.1) C,b1.858 (2.7) D,b
2501.985 (1.9) A,c1.894 (2.2) B,c1.835 (2.3) C,c1.789 (2.9) D,c
3001.886 (2.4) A,d1.815 (2.4) B,d1.739 (2.6) C,d1.724 (2.1) D,d
Note: The values in the parentheses are coefficients of variance (COV). The values within the same row not followed by a common upper-case letter are significantly different from one another. The values in the same column within a component, tenon or mortise, not followed by a common lower-case letter, are significantly different from one another.
Table 4. Two-way UNIANOVA results of effects of CLA, CLC, and their interaction on the friction coefficient of the round-end mortise–tenon joints.
SourcesFriction Coefficient
F-Valuep-Value
CLA48<0.001 *
CLC54<0.001 *
CLA × CLC1.30.24
* means the factor is significant at the 5% significance level.
Table 5. Mean comparisons of the friction coefficient between mortise and tenon after fatigue tests with each combination of cyclic load amplitude and cyclic load count.
CLA
(N)
CLC in Percentage of Fatigue Life (%)
0255075100
1500.365 (8.4) A 0.205 (3.7) B,a 0.202 (3.5) B,a0.195 (4.1) C,a0.192 (2.7) C,a
2000.365 (8.4) A0.204 (4.9) B,a0.193 (5.1) C,b0.187 (3.7) C,b0.179 (5.1) D,b
2500.365 (8.4) A0.200 (5.0) B,a0.184 (5.1) C,c0.176 (2.8) D,c0.172 (3.4) D,bc
3000.365 (8.4) A0.191 (3.2) B,b0.181 (3.1) C,c0.170 (4.0) D,d0.165 (3.4) D,c
Note: The values in the parentheses are coefficients of variance (COV). The values within the same row not followed by a common upper-case letter are significantly different from one another. The values in the same column within a component, tenon or mortise, not followed by a common lower-case letter, are significantly different from one another.
Disclaimer/Publisher’s Note: The statements, opinions and data contained in all publications are solely those of the individual author(s) and contributor(s) and not of MDPI and/or the editor(s). MDPI and/or the editor(s) disclaim responsibility for any injury to people or property resulting from any ideas, methods, instructions or products referred to in the content.