Article

Modeling Carbon Sequestration and Economic Returns Using 3-PG in the FSC-Certified Simcoe County Forest

Institute of Forestry and Conservation, John H. Daniels Faculty of Architecture, Landscape, and Design, University of Toronto, 33 Willcocks Street, Toronto, ON M5S 3B3, Canada
*
Author to whom correspondence should be addressed.
This manuscript is part of a Master’s thesis by Fanxuan Sun at the University of Toronto. The full thesis is available online at https://utoronto.scholaris.ca/items/ccce554b-c515-4094-8048-8767075bbd8e (accessed on 4 August 2025).
Forests 2025, 16(10), 1610; https://doi.org/10.3390/f16101610
Submission received: 4 September 2025 / Revised: 6 October 2025 / Accepted: 14 October 2025 / Published: 20 October 2025
(This article belongs to the Special Issue Economic Research on Forest Ecosystem Services)

Abstract

In this study, we developed three forest management scenarios for Simcoe County Forest in Southern Ontario, Canada, using the Physiological Principles Predicting Growth (3-PG) model to simulate future forest growth and carbon dynamics. The focus was on four main species: Red pine (Pinus resinosa), White pine (Pinus strobus), Sugar maple (Acer saccharum), and Red oak (Quercus rubra). We parameterized, calibrated, and validated parameters of the 3-PG model for these four species and applied the model to evaluate the performance of management scenarios incorporating timber and carbon values in Simcoe County Forest. The first scenario, “business as usual,” maintained the existing management plan for the forest, ensuring stable timber income (531.2 CAD/hectare) and moderate carbon sequestration. The second scenario aimed to optimize management for the highest timber Net Present Value (NPV), with half of the trees harvested before 2030, followed by gradual thinning over 15 years. This approach yielded the highest financial returns (1634.1 CAD/hectare) but the lowest carbon sequestration potential. The third scenario integrated carbon certification, emphasizing the retention of sugar maple stands over the next 20 years. This scenario produced financial returns (580.2 CAD/hectare) higher than the “business as usual” scenario, while saving 49.33 tons of biomass per hectare. Overall, this study provides a reference for the implementation of carbon sequestration projects.

1. Introduction

Due to the intensification of climate change, the increase in carbon dioxide levels, and the worsening of global warming, various industries are striving to reduce carbon dioxide emissions [1,2]. As early as 2018, the Ontario government issued Ontario Regulation O. Reg. 390/18, which encourages organizations or companies to create their own carbon projects to mitigate climate change. The Canadian voluntary carbon market also has a high acceptance of other standards, such as the Gold Standard and Verified Carbon Standard (VCS), but forestry carbon sequestration projects remain in their infancy in the Canadian forestry industry [3]. At present, there are relatively few cases in the Ontario carbon market, with most activity concentrated in agricultural soil projects rather than forestry. For instance, Paul et al. (2023) examined soil carbon certificates as a potential tool for carbon markets, highlighting the emphasis on agricultural approaches [4]. In contrast, while British Columbia has developed forest carbon offset initiatives [5], Ontario lacks comparable forestry-based programs, underscoring the early stage of this sector in the province’s carbon market [4,5]. Sustainable forest management practices are the main ways to achieve additional carbon sequestration in forests, and previous research has examined different management methods from multiple perspectives as follows: short and midterm project feasibility in Northern forests (Ontario) [6], integration with quota and trading schemes (U.S.) [7], and ecological dynamics of carbon in forest ecosystems (Europe) [8]. In addition, Galinato et al. [9] studied the ecological and economic benefits of medium—to long-term carbon sequestration projects (Africa and Southeast Asia). However, Ontario still clearly lacks research on feasible long-term forest carbon certification programs, and this may lead to a lack of confidence among forestry industry companies, governments, and organizations in entering the forestry carbon market, thereby weakening the forestry industry’s role in combating climate change.
During the carbon project period, the evolution of carbon market policies poses significant challenges and opportunities for the economic feasibility of forest management scenarios. The carbon market is dynamic, with prices influenced by policy changes, market demand, and global carbon reduction commitments [10,11,12]. As global attention on carbon neutrality intensifies, the Canadian government has implemented a carbon pricing mechanism, resulting in a general upward trend in carbon credit prices [13]. Prior to 2015, the price of carbon credits was unstable due to the impact of economic crises and fluctuations in the carbon market [14,15,16,17]. At present, the Gold Standard, VCS Standard, Environment and Climate Change Canada Offset Credit System and other mechanisms have a high influence and acceptance in the Canadian carbon market, especially VCS, which has been certified by the Standards Council of Canada (SCC), demonstrating its importance in the Canadian market [18,19,20,21]. In Canada, the development of forest carbon project standards has been strongly influenced by federal and provincial policies, such as the federal carbon pricing backstop and Ontario’s brief experience with a cap-and-trade program [20,21]. These regional dynamics shape the feasibility of carbon sequestration projects and highlight the specific relevance of studying Ontario’s forest context. These standards provide validated frameworks for carbon sequestration projects across sectors such as forestry, agriculture, and renewable energy, ensuring rigorous assessment of carbon offsets [21,22,23,24]. Carbon certification helps achieve quantifiable emission reduction effects, and it also provides an opportunity for economic returns in carbon emission reduction projects [22,25]. After obtaining certification for carbon reduction, the provincial government or third-party organizations will distribute carbon credits to enterprises. By selling the remaining carbon credits in the voluntary carbon market, enterprises can generate additional revenue beyond their own compliance needs. Forest carbon sequestration projects, such as forest restoration and sustainable forest management, can be validated under recognized certification standards and thereby issue qualified carbon credits [22,25], which may then be traded to companies or governments seeking to offset their emissions [5,26,27].
Forest Stewardship Council (FSC) certification is one of the most recognized systems for verifying responsible forest management, ensuring that forests are managed in ways that preserve biodiversity and benefit local communities. These benefits may include employment opportunities in forest restoration, capacity building through training, and revenue-sharing mechanisms that support local development projects such as education or infrastructure [28,29]. The target forest of this study, Simcoe County Forest, had obtained FSC certification in the early 21st century, becoming one of the first county-level forests in Canada to receive this certification [30]. In 2016, it was proposed that the Simcoe Forest has good carbon sequestration potential [31]. Through the new FSC standards or in combination with carbon certification mechanisms such as the Gold Standard or VCS, these FSC-certified forests may potentially gain additional economic benefits through carbon credit trading while promoting climate change response [5].
The Physiological Principles Predicting Growth (3-PG) model was originally developed by Landsberg (CSIRO, Canberra, Australia) and Waring (Oregon State University, Corvallis, USA) in the late 1990s [32], as a simplified, process-based model grounded in physiological principles to predict forest growth and productivity. Subsequent studies have validated and extended the model across a wide range of forest types [33,34]. 3-PG is currently widely used worldwide and can simulate climate change scenarios by changing parameters [35,36,37,38]. Compared with empirical yield-table approaches, the 3-PG model provides a more mechanistic representation of forest growth by explicitly linking physiological processes (e.g., photosynthesis, respiration, and transpiration) with environmental drivers. This allows it to capture the effects of changing climate conditions on productivity and carbon balance, making it particularly suitable for long-term scenario analysis under climate variability [39,40,41,42,43]. Red pine, White pine, Sugar maple and Red oak are the four main tree species in Simcoe County Forest. They have important economic and scientific value in the Ontario forest area, but in the 3-PG model, no species-specific parameterization of these trees has yet been developed. The growth dynamics, carbon sequestration potential, and biomass accumulation values of these four species obtained using regular formulas and yield tables are not accurate when facing different positions and soil textures [33,44,45]. We will obtain parameters of these four tree species and apply them to the 3-PG model to fill this gap.
This study aims to simulate the economic and carbon sequestration values of Simcoe County Forest under three management scenarios by calibrating the 3-PG model with parameters specific to the four dominant tree species. Scenario one: business as usual; this scenario is to maintain the original management plan of Simcoe County Forest without significant changes. Scenario two: max timber value; this scenario is to develop new management plans for different sites to optimize financial returns in the next 20 years. Scenario three: introducing carbon certification; this scenario is to develop a carbon project following the program regulation of VCS to see the carbon potential and economic value. By linking these international policy frameworks, such as VCS, with Ontario’s regional context, this study provides a timely contribution by evaluating management scenarios that integrate both economic and carbon certification perspectives.

2. Materials and Method

2.1. Study Area

Simcoe County Forest is located in central Southern Ontario, Canada, and it is one of the largest county-level public forests in Canada. It has been gradually established in 1920 with the initial goal of restoring severely eroded and barren land through large-scale afforestation [30]. The forest stands were originally planted predominantly as monospecific plantations, but over time, natural succession and management interventions have led to the development of more mixed stands [30]. Over time, Simcoe County Forest has continued to expand and currently covers over 11,000 hectares of forest land, distributed across multiple locations in the county. Four main species dominate approximately 8681 hectares (78.9%) of the total forest area: Sugar Maple (2609 ha; 23.7%), White pine (1486 ha; 13.5%), Red pine (3460 ha; 31.5%), and Oak (1126 ha; 10.2%) [30]. This forest not only plays an important role in ecological restoration and economic resources but also provides important ecological services to the local community, including water quality protection, carbon sequestration, and soil stability [30] (Figure 1).

2.2. Dataset

We input the average meteorological data from Toronto Meteorological Station (1840 to 2002) and Toronto North York Meteorological Station (2003 to 2024). In addition, based on formulas released by the Faculty of Forestry at the University of British Columbia, we calculated the incident solar radiation and frost days using latitude, longitude, altitude, temperature, and other data [46].
Two types of site data are obtained: stand-level data and plot-level data. The main data input is stand-level data, while plot-level data is used as a reference. We chose stands with a single tree species coverage rate greater than 70% in stands for the operation of the model. The age of the trees in the model is based on the time of the stands establishment.
The model requires soil data as an input; to address this, each forest plot was assigned a soil classification based on the predominant soil type, with plots categorized according to the soil type that covered more than 50% of the area [47]. The results show that over 98% of the Simcoe County Forest falls within three primary soil classes: sand, sandy loam, and clay. For each tree species, a total of 12 or more representative stands is selected as data inputs based on different soil types.
Logging periods are considered based on Simcoe Forest Management Plan: Red pine will follow a 9-year cutting cycle and 358 hectares per year; Sugar maple will follow a 15-year cutting cycle, and 152 hectares are harvested per year; Average annual harvest area for White pine is 125 hectares and cutting circle is 10-year; Average annual harvest area of Red oak is 81 hectares and cutting circle is 15-year [30].
After obtaining soil and other environmental data, we estimated 82 ecological and environmental parameters for each tree species using plausible prior values informed by literature ranges and supplemented by reasonable assumptions, which formed our default model [45]. Since the forestry data from Simcoe Forest is not directly related to biomass, we used DBH (Diameter at Breast Height), tree height and tree age data to calculate the Stem biomass, Root biomass, and Foliage biomass by applying species-specific allometric equations in the literature for Red pine [48], White pine [49], Sugar maple [50,51], and Red oak [50], rather than direct field measurements.

2.3. Calibration and Validation

The 3-PG model includes 82 parameters that require calibration, making it impractical to adjust all of them manually. To address this, the Morris sensitivity analysis method was applied to select the 40 parameters that have the greatest impact on the model’s results (results shown in Figures S1–S4). In order to improve parameter selection and enhance prediction accuracy, some studies have applied Bayesian calibration methods. For example, Minunno et al. [52] and Van Oijen et al. [53] explored canonical correlation and multi-model comparison methods and validated the reliability of Bayesian methods. Wang et al. [54] developed a system for visualizing tree biomass using a parameter-optimized 3-PG model. Bagnara et al. [55] applied Bayesian calibration methods to models with multiple illumination layers. Researchers have also combined Bayesian calibration with Markov Chain Monte Carlo (MCMC) methods to dynamically adjust model parameters, making simulations closer to observed data [41,56,57].
The error analysis methods we used are consistent with those introduced by Forrester and Tang [35]: calculating e% (Relative Error Percentage), MAE% (Mean Absolute Error Percentage), MSE (Mean Squared Error), and R2 (coefficient of determination).
e % = 100 × P ¯ O ¯ O ¯
M A E % = 100 × 1 n i = 1 n P i O i O ¯
M S E = i = 1 n P i O i 2 n
P refers to the predicted value of the model, and O refers to the actual observed value (calculated through the allometric growth equation and actual observations).

2.4. Maximize Economic Values

After completing the model creation, Scenario one business-as-usual forest management plan in Simcoe County Forest can be simulated. While the purpose of Scenario two is to find the most economically beneficial logging method. Genetic Algorithm (GA) is used to solve this problem. The GA function is used to optimize forest management strength strategies by adjusting the harvest methods in model simulations to maximize or minimize the NPV (Net Present Value). We plan to calculate the maximum timber value for two thinning operations based on the management plan over the next 20 years. During the first thinning, the cutting year was T1, and the cutting year in the second thinning is T2. Bcut1 and Bcut2 represent the biomass harvested during the first and second thinning. Bprev is the biomass from the previous year, and Bcurrent is the standing biomass in the current year.
B i o m a s s ( B c u t 1 + B c u t 2 ) = B p r e v ( T 1 1 ) + B p r e v ( T 2 1 ) B c u r r e n t ( T 1 ) B c u r r e n t ( T 2 )
We assume a fixed discount rate r = 4% for the NPV calculations, a value commonly used in forestry economic planning [58]. The Net Present Value (NPV1 and NPV2) of the income obtained from the first and second logging can be calculated as follows:
N P V t o t a l = N P V 1 + N P V 2 = V alue B c u t 1 1 + r T 1 T c u r r e n t + V alue B c u t 2 1 + r T 2 T c u r r e n t
we assume Tend as the final year of the project, representing the end of the planning horizon (e.g., 20 years), and Bend is the value of biomass in the end year. The final harvest is expressed as Future Value in the end year to reflect long-term sustainability constraints and intergenerational equity.
F uture   V alue = V alue B e n d 1 + r Tend T c u r r e n t
The goal is to maximize the NPV by repeatedly adjusting the age of the first and second harvests, as well as the remaining tree quantity, to find the best solution.
Optimal   N P V = max i = 1 2 N P V i + F u t u r e   V a l u e
After getting the harvest solution, the remaining biomass (Bremaining) can be calculated. Btree species is the biomass from 4 tree species.
B remaining = T ree   species + S oil   types B T r e e   s p e c i e s × Soil   type   hectares
Biomass is converted into carbon credits according to the formula:
C a r b o n C r e d i t = B i o m a s s × ( 1 D e d u c t i o n ) × C a r b o n % × 44 12
The prices of various woods are determined based on the Bid Price records of Simcoe County Forest (see Table S1). By using volume and density, the biomass harvested by different species can be calculated, and then converted into the price corresponding to the biomass per ton of wood, based on the price: Red pine 116.94 CAD/ton; Sugar maple 134.94 CAD/ton; Red oak 88.25 CAD/ton; and White pine 94.54 CAD/ton [59,60,61,62].

2.5. Carbon Certification

Scenarios one and two do not involve carbon sequestration, but in scenario three, carbon sequestration certification will be taken into consideration. We refer to the VCS carbon project certification as the standard (VM0012) https://verra.org/methodologies/vm0012-improved-forest-management-in-temperate-and-boreal-forests/(accessed on 15 August 2024) because it is one of the most widely used carbon standards globally (see project fee in Table S2) [63]. We will postpone the harvest of Sugar maple until 20 years later and see how much biomass can be saved. The harvesting of other tree species will still be carried out according to the original management plan. The carbon sequestration formula will automatically deduct a certain percentage of the predicted carbon credits based on the possibility of inaccurate estimation, as an emergency measure. This includes approximate shares for different components, namely Buffer Pool Deduction (~20%), Risk Deduction (~15%), and Conservative rules (~10%). Due to the relatively low natural disaster risk and limited human disturbance records in Simcoe County Forest, we considered this aggregate deduction of 45% to be a cautious but reasonable assumption for the scenario analysis.
All data analyses were conducted in R (4.5.1).

3. Result

3.1. Model Outputs

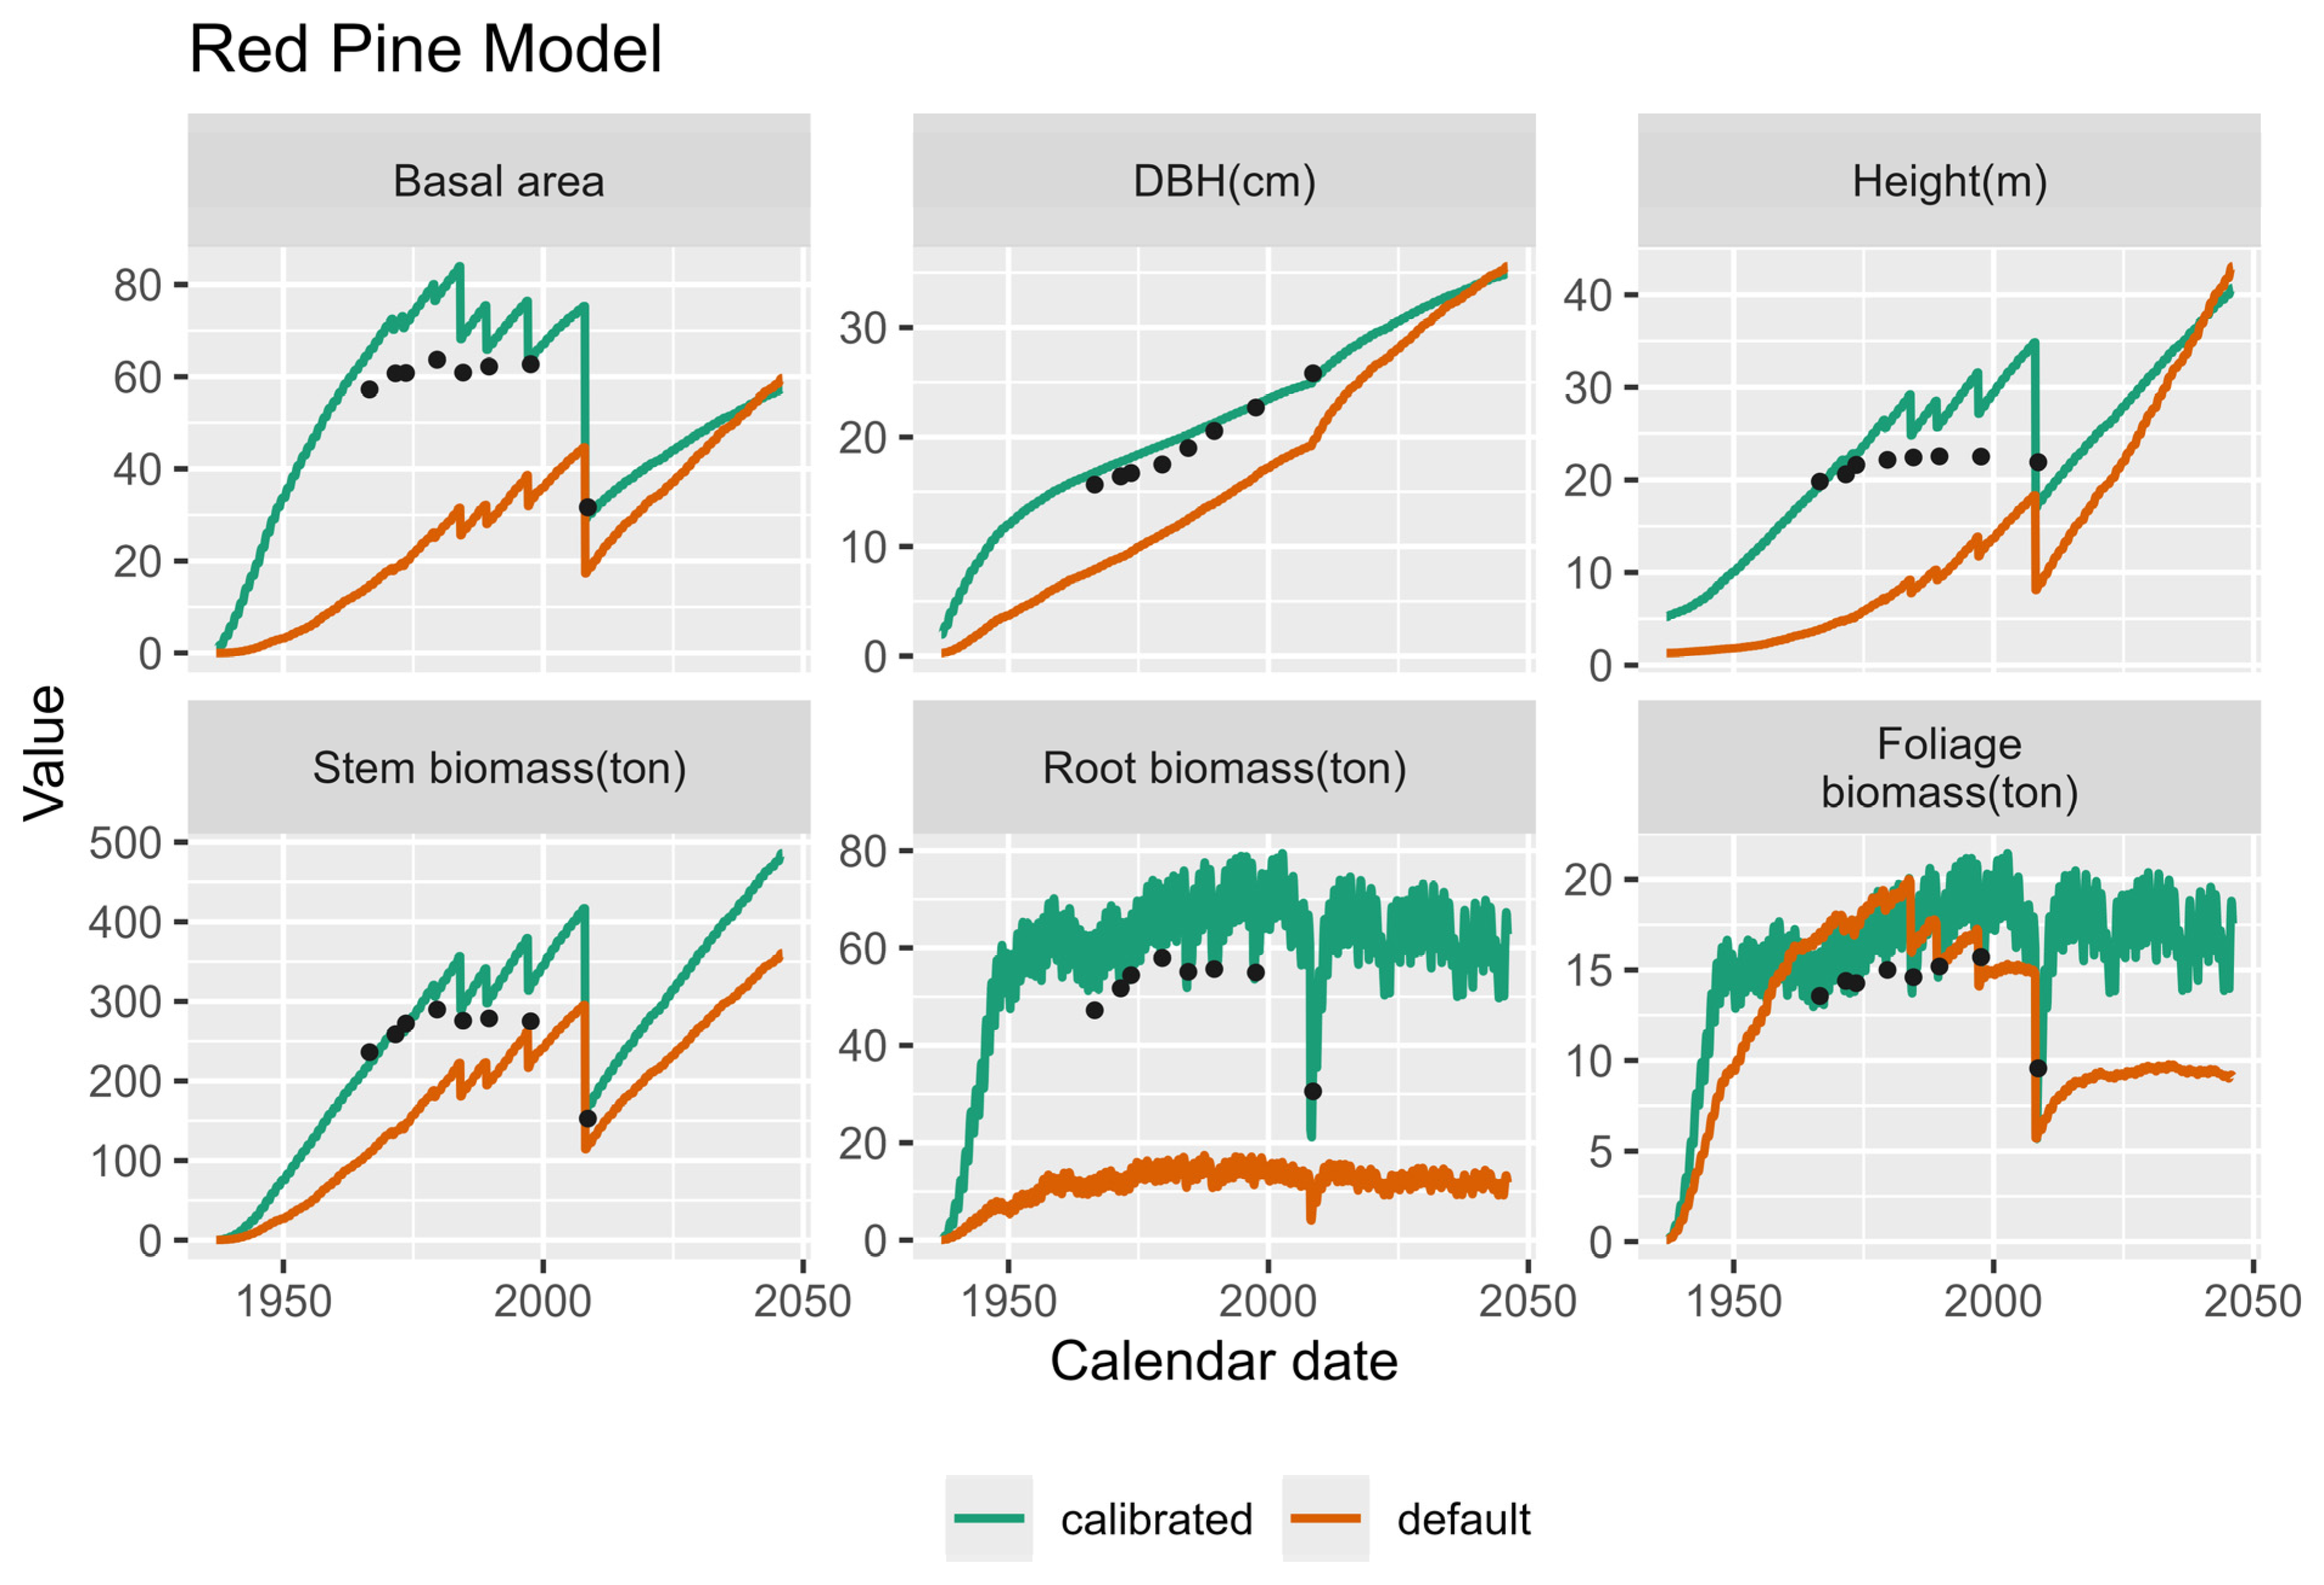
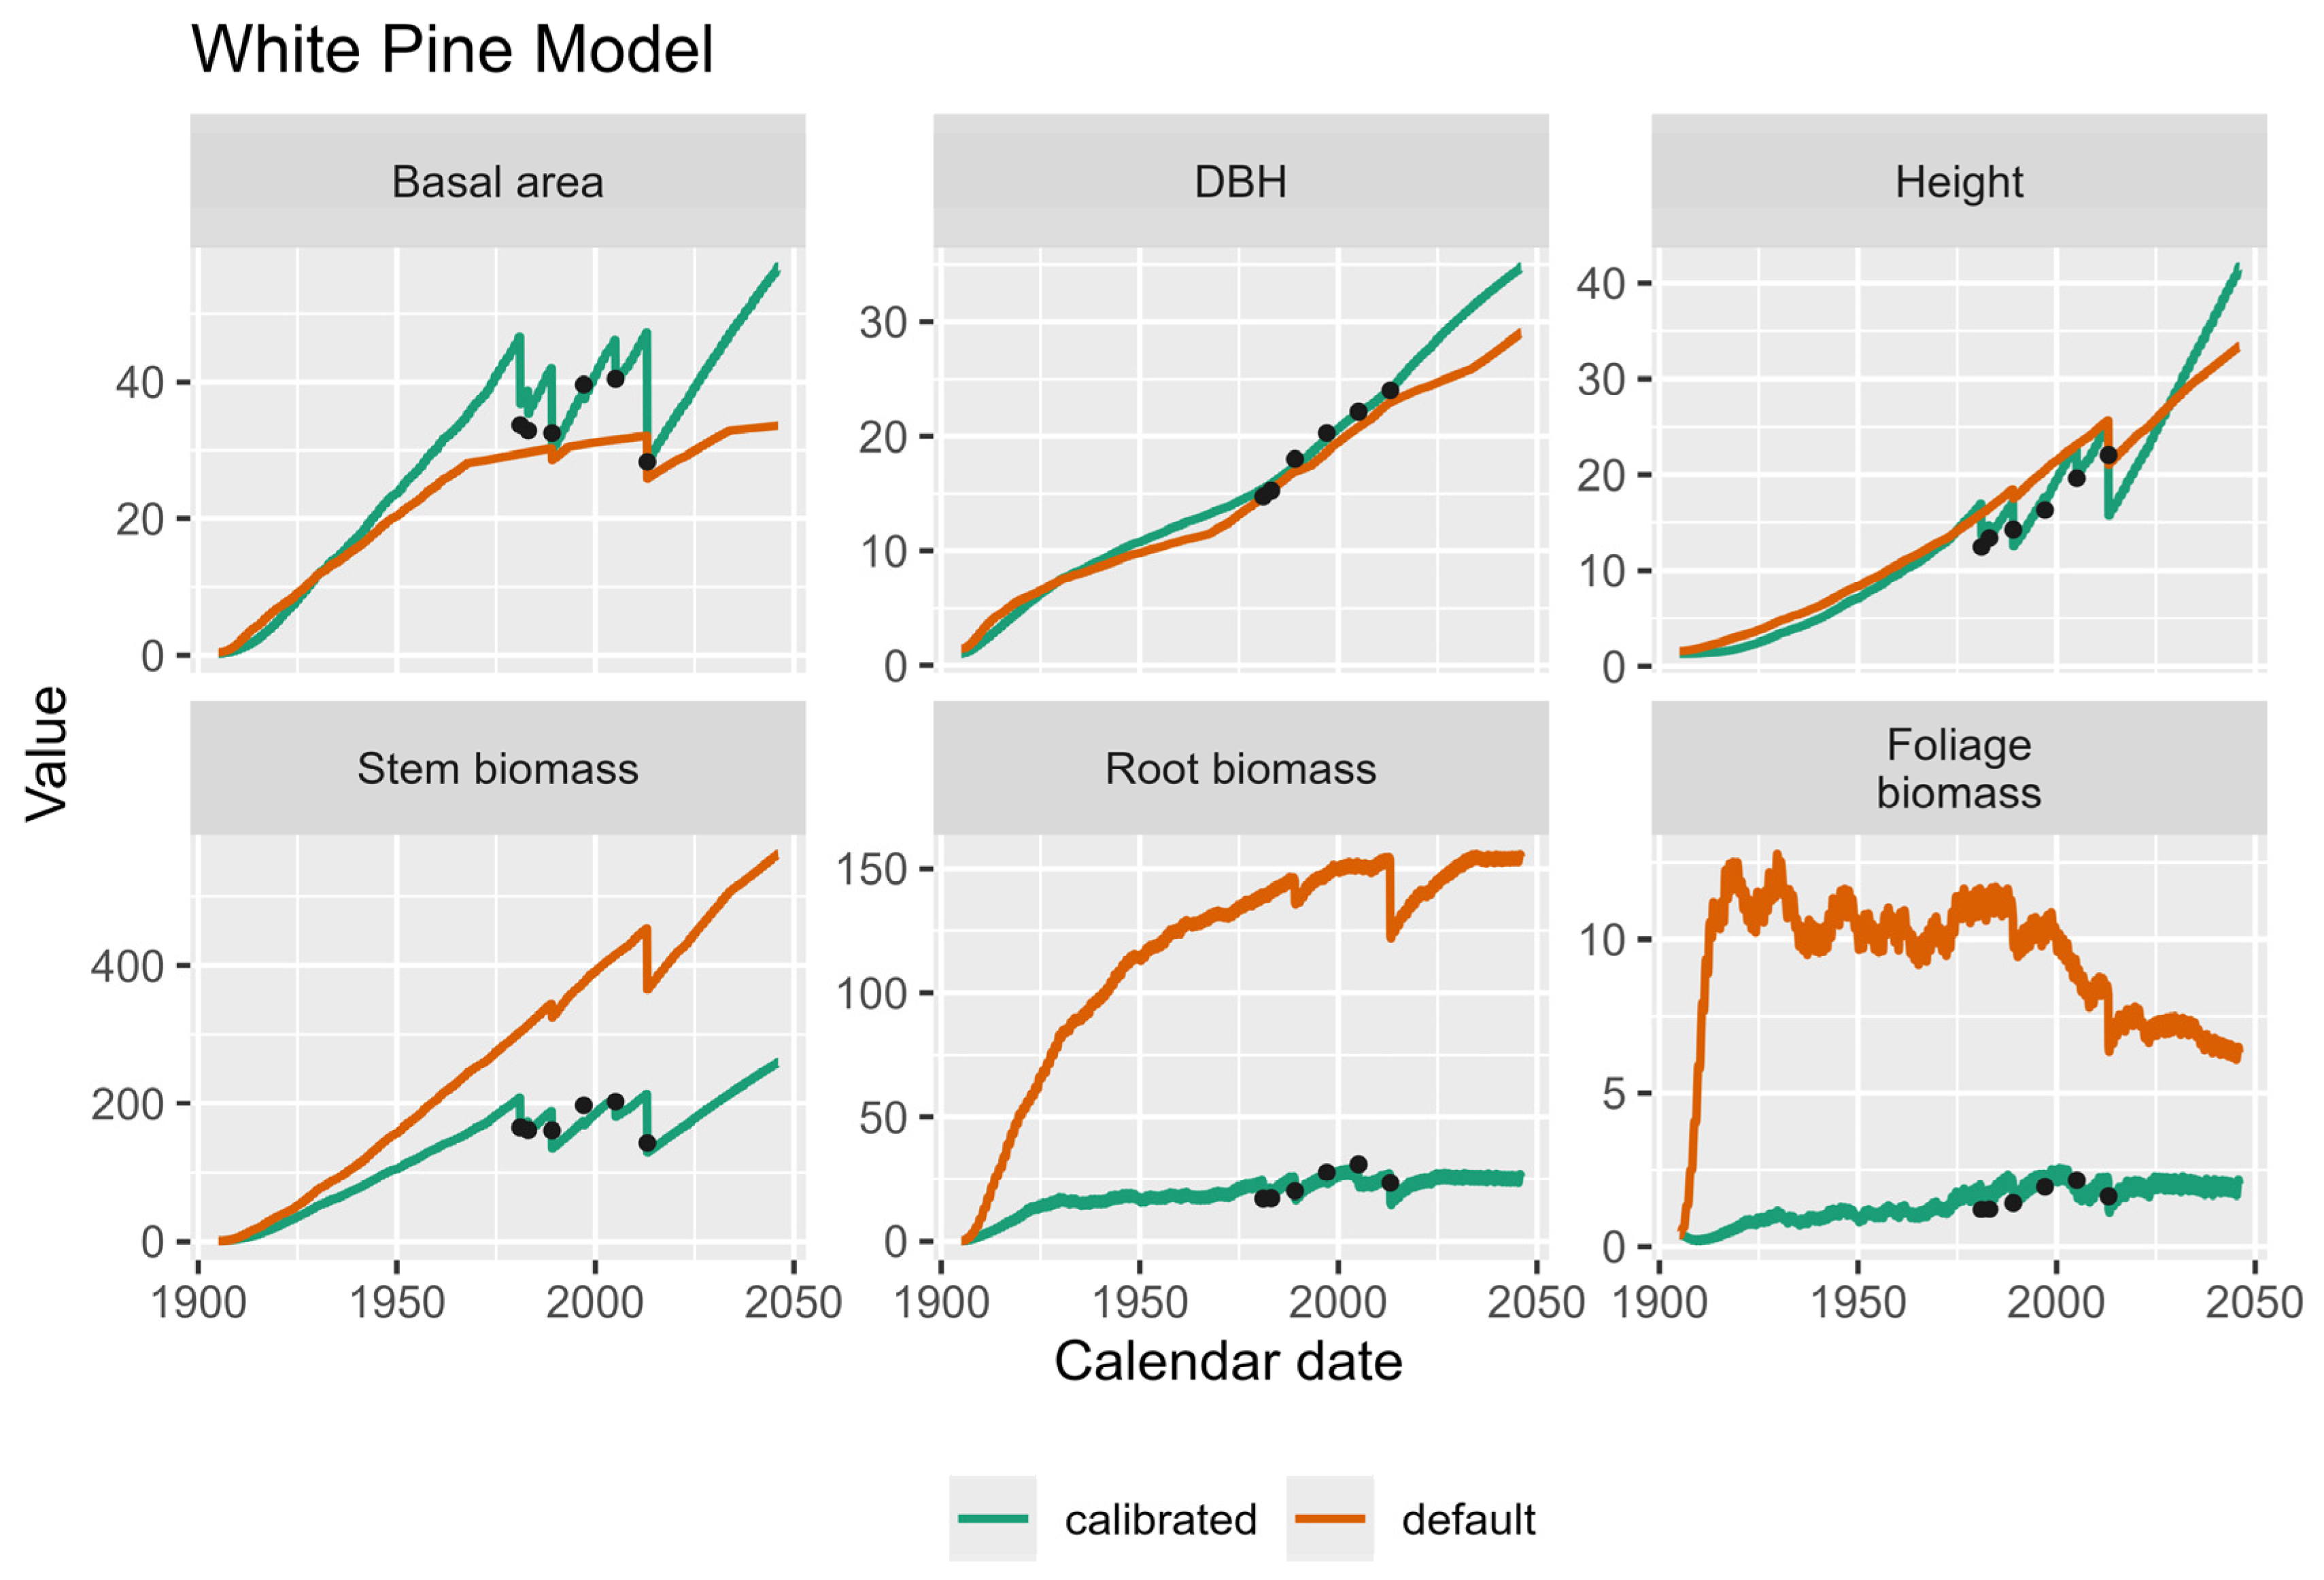
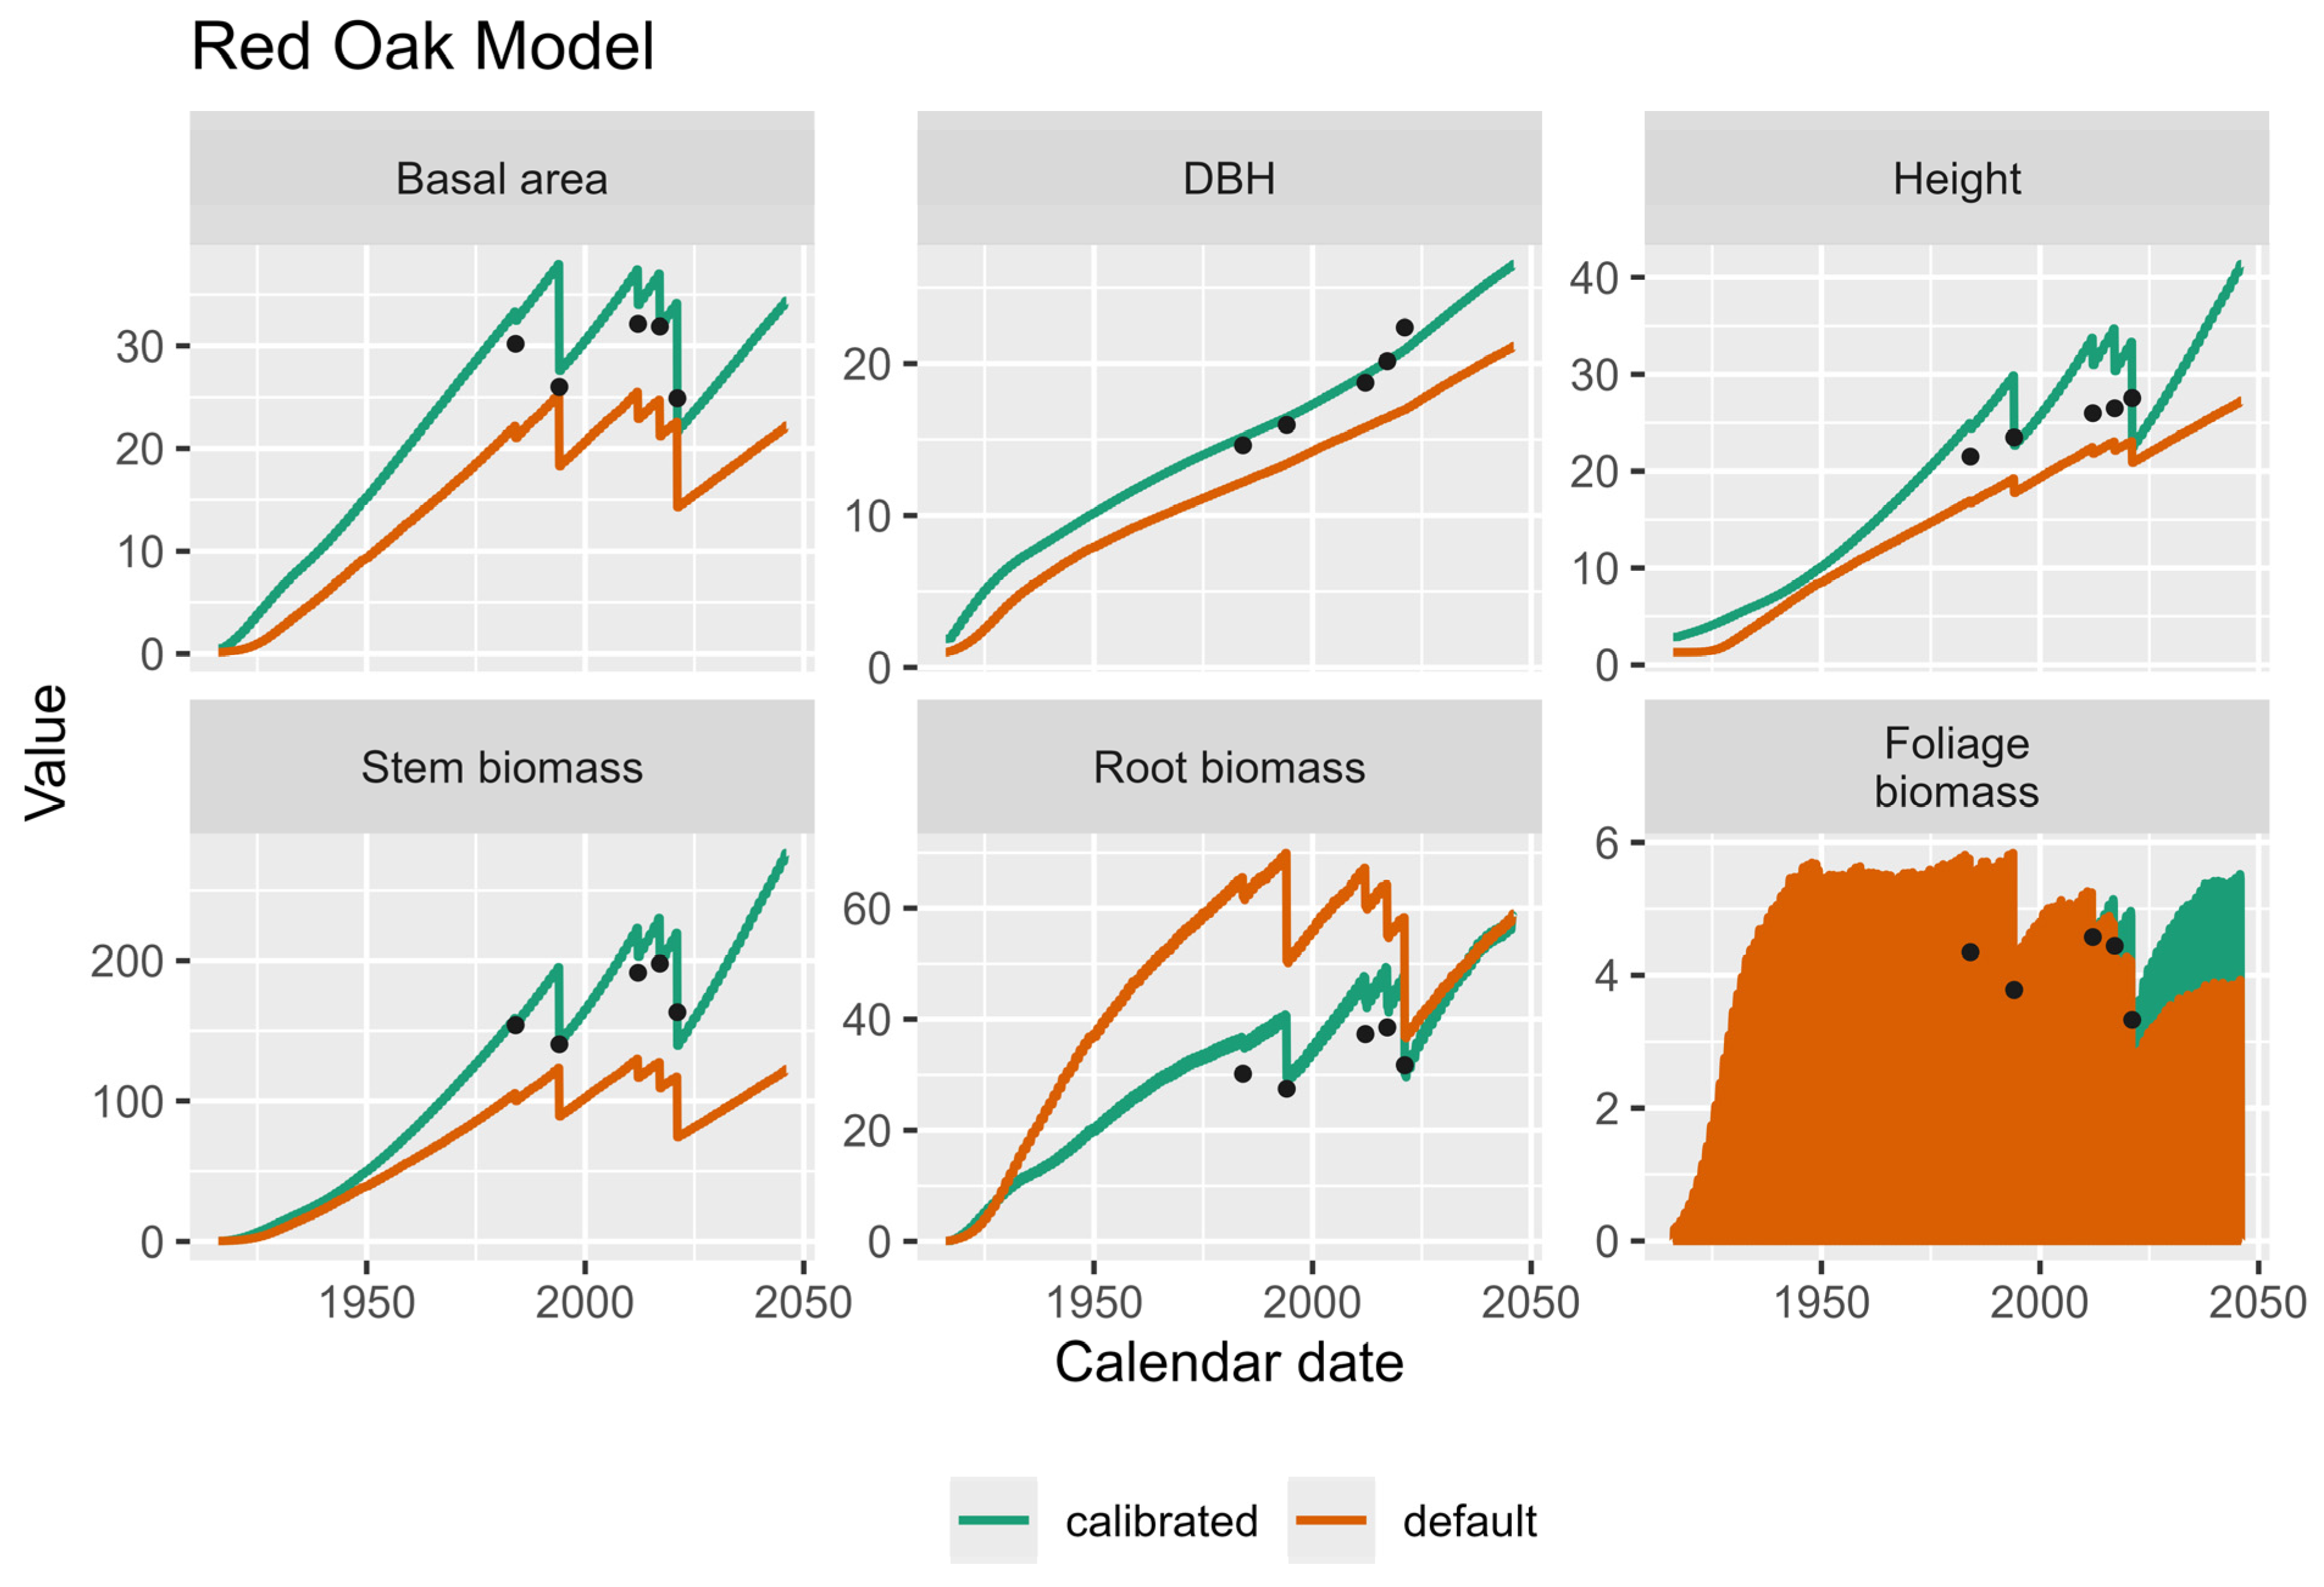
The following Figure 2, Figure 3, Figure 4 and Figure 5 show the results of the sample plot models for four tree species. The orange line represents the default model results before calibration, the green line represents the corrected results, and the black dots represent the actual observed values (calculated by biomass equations). After calibration, the green line is closer to the actual observed value, and the prediction of the calibrated model is more accurate (Table S3 shows parameters of four tree species).

3.2. Calibration and Validation Errors

Errors of the calibrated models are first evaluated. We compared the results generated by the model with the actual results. In this study, Table 1 shows MAE% values below 20% and R2 values above 0.7 are generally considered acceptable for forest growth model applications, consistent with previous studies [57]. MSE values were also within ranges typically reported for ecological models [57].

3.3. Three Scenarios

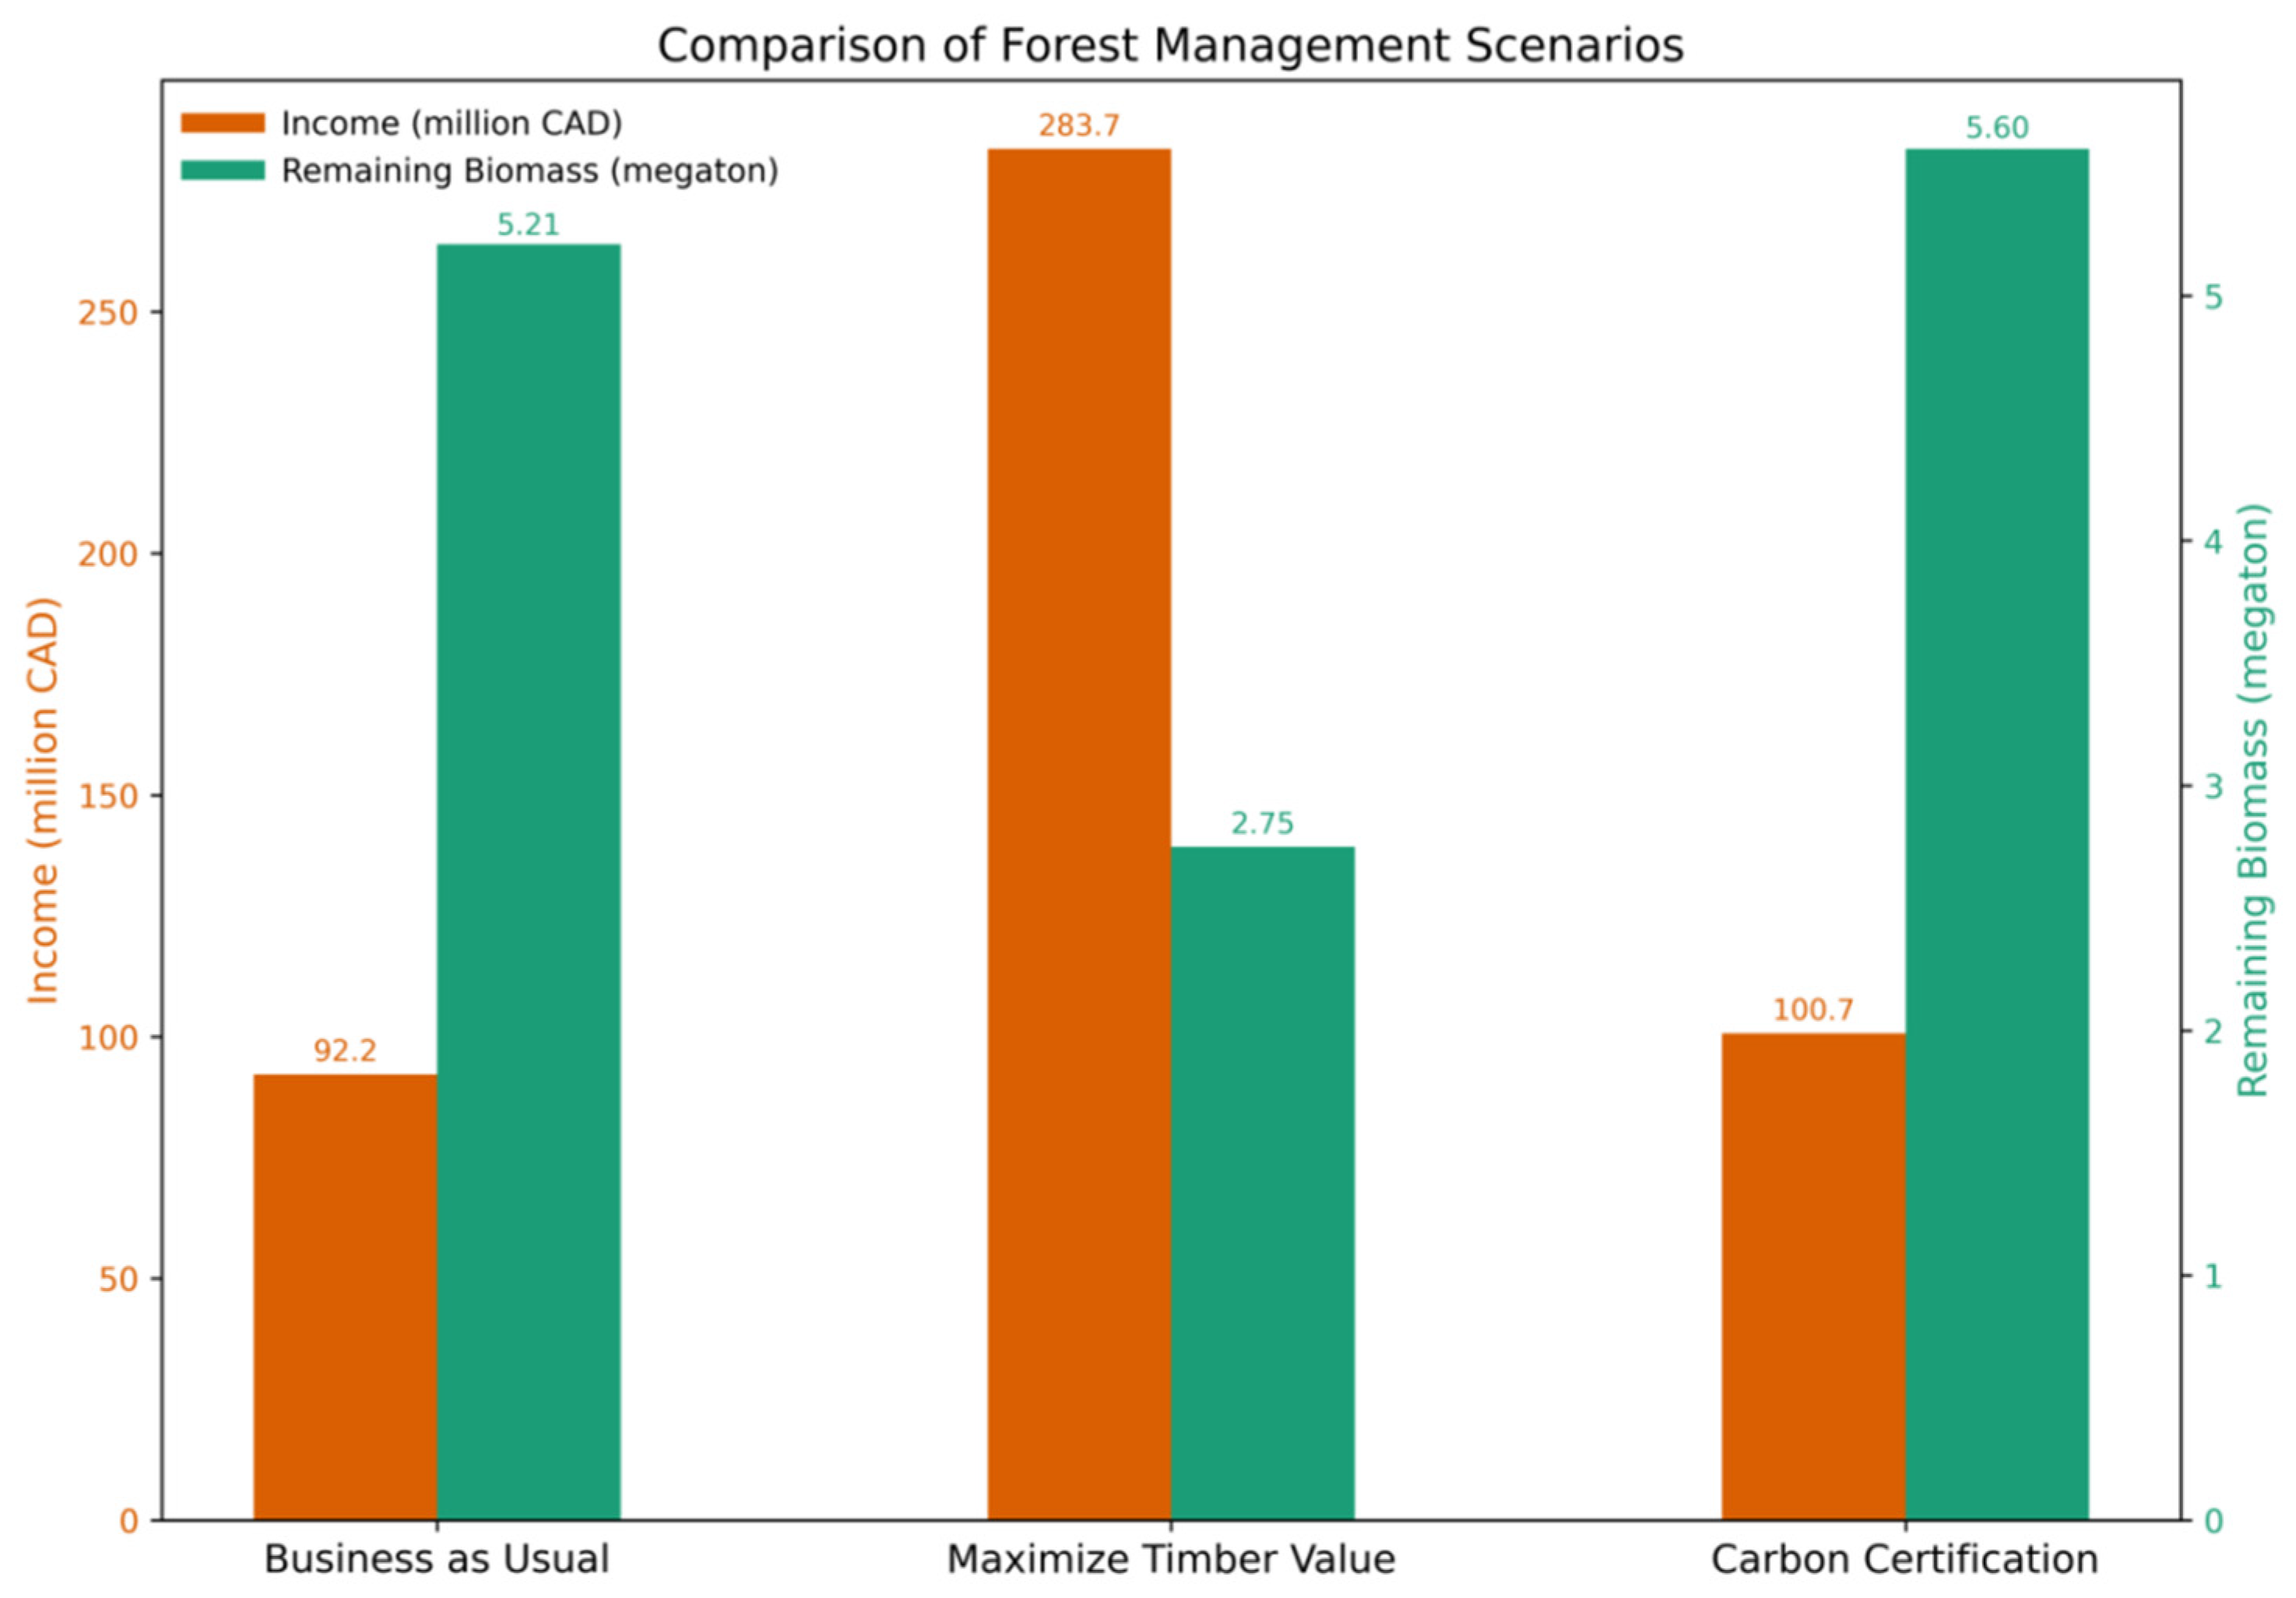
Figure 6 presents a summary of the three management scenarios, while the detailed calculation results for each scenario are provided in Tables S4–S6 (Supplementary Materials). In the business-as-usual scenario, the potential revenue from forest timber in Simcoe County over the next 20 years is 92.23 million CAD. According to recent timber market statistics, the net profit margin is approximately 5%, with a potential net profit of approximately 4.61 million CAD (531.2 CAD/hectare) [64]. It is expected that by 2045, the entire forest will store accumulated gross 9.36 megatons of carbon dioxide (5.21 megatons of biomass). In the scenario of maximizing income, although the total timber income for the next 20 years reached 283.71 million CAD (net profit 1634.1 CAD/hectare), it was obtained at the expense of future income prospects. Additionally, the amount of carbon dioxide stored in the forest is only 4.94 megatons (2.75 megatons of biomass), less than half of the first scenario. In the third scenario of introducing carbon certification, the expected gross carbon dioxide storage capacity is 10.13 megatons (5,60 megatons of biomass), which is higher than the first scenario. The total revenue from timber is 64.76 million CAD (net profit 373 CAD/hectare), and the net profit from carbon credits is 35.98 million CAD (207.2 CAD/hectare). The income under the third scenario is higher than that of the original management plan, which excludes the potential revenue from Sugar maple harvests after 2045 and the logging cost.

4. Discussion and Recommendation

4.1. 3-PG Parameters Rationality

The reliability of the 3-PG model outputs depends on a rigorous evaluation of parameter values, as sometimes incorrect parameters can still yield data results that match the observed values [35]. Whether it is raw data, such as soil fertility, soil type, or calculated data, such as absorbed solar radiation data, frost days, we ensure that their values are within the correct range. In addition, some model parameters, such as nutrient allocation parameters for roots, stems, and leaves, etc., were set within a range of values during Bayesian calibration to ensure the rationality of the parameters. After obtaining the results, we also validated the model result numbers, ensuring that DBH, basal area, and biomass of roots, stems, and leaves were all within the appropriate range.
In the 3-PG model, there may be some unrealistic growth outcomes when encountering extreme situations (such as leaving only a small number of trees). 3-PG models typically assume that resources (such as light, water, and nutrients) are relatively uniform when predicting growth, and the model calculates growth based on the competitive relationships and resource allocation among trees [65,66]. If there are only a few trees left, the model will “assume” that these trees have acquired a large amount of resources, resulting in their growth being excessively amplified. Currently, our response strategy is to avoid this situation by leaving at least 50 trees per hectare after each harvest, which is also in line with the conservation concept of leaving some trees in the post-harvest plot [67,68].

4.2. Trade-Off Between Economic Returns and Carbon Sequestration

The project highlights a trade-off between maximizing economic returns and promoting carbon sequestration. While the second scenario, which focuses on optimizing NPV, yields the highest financial returns, it also has the lowest carbon sequestration potential. This suggests that intensive logging, particularly the large-scale harvesting scheduled, diminishes the forest’s capacity to function as a carbon sink. Pursuing short-term timber revenues through such intensive practices may undermine the long-term sustainability of forest stands by eroding structural diversity, constraining natural regeneration, and ultimately reducing future harvest potential [29,68]. A balanced approach that slightly adjusts the harvesting schedule could be explored. For instance, instead of concentrating the majority of logging activities in a single year, a more distributed approach over the 20-year period might be better for sustainable forest management, while still providing reasonable economic benefits [69,70]. Integrating selective logging or promoting natural regeneration could also help maintain both economic and ecological sustainability [71,72,73]. In addition, future work could incorporate sensitivity analysis to evaluate how uncertainties in forest growth, mortality rates, or carbon pricing trajectories may influence long-term sequestration outcomes.
The third scenario, which introduces carbon certification, demonstrates a promising pathway toward maintaining financial stability while maximizing carbon sequestration potential. Retaining Sugar maple stands and obtaining carbon credits under VCS certification provides a dual benefit of financial returns and environmental stewardship. Although the biomass retained by Scenario three is not much higher than the baseline scenario, the manager is still able to obtain the carbon credit of 425,934.1. It is expected that the government-mandated carbon price will rise to $170/unit by 2030 [13]. And the expected maximum benefit can be calculated as $72.41 million CAD. And the price of the voluntary carbon market will be lower than this number (assuming $85/unit), and after deducting the certification fee, the expected reasonable income that can also be calculated is $36.20 million CAD. This scenario should be seriously considered as a long-term strategy for Simcoe County Forest. The certification process could open new revenue streams through carbon markets while enhancing the forest’s contribution to climate mitigation. It would be valuable to analyze further the potential market for carbon credits and how fluctuating carbon prices might influence long-term financial outcomes.
The literature in Ontario forestry suggests per-hectare returns and carbon uptake broadly in line with the Simcoe model results. The performance of the 3-PG model was validated against both empirical ranges and literature benchmarks. For example, our model predicted that mature hardwood stands in Simcoe can store approximately 300 tons of carbon per hectare, which closely aligns with estimates for mature Picea (spruce) stands at 81 years of age in Canadian boreal mixed woods—258  ± 15 t C/ha as reported by Payne et al. [74]. Moreover, our management scenarios reflect findings in the literature that extending the rotation age enhances carbon sequestration [75,76]. The third scenario effectively delays intensive harvesting and promotes natural growth and regeneration, a strategy that contributes to both increased standing biomass and long-term carbon storage. While some studies suggest that relatively low carbon prices can already yield financial returns, our results in Scenario three show that even at a high carbon price (170 CAD per ton of CO2), the implementation of carbon certification and reduced harvesting only achieves comparable economic returns to conventional harvesting [75,77]. This discrepancy may be attributed to our more comprehensive consideration of costs associated with monitoring, reporting, and verification (MRV), as well as the inclusion of carbon leakage and risk buffer requirements.

4.3. Limitations

Our three scenarios also have some limitations, such as the omission of the stand changes caused by deforestation. From 2011 to 2021, the most notable plantation changes involved red pine, which experienced a decline in total area due to deteriorating health and replanting efforts. Specifically, the Red pine area decreased by 464 hectares as stands were converted to other forest types. In contrast, the areas occupied by White pine, tolerant hardwoods, and upland oak increased. White pine expanded by 291 hectares, tolerant hardwood by 511 hectares, and upland oak by 1148 hectares [30]. Ignoring the changes in tree species composition caused by logging and replanting may affect the model’s accurate predictions of carbon sequestration capacity, economic benefits, and biodiversity. The carbon sequestration rates and economic values of different tree species vary, and ignoring these changes may lead to overestimation or underestimation of carbon sinks and economic returns and overlook the health and adaptability of forest ecosystems [78,79].
Meteorological data were obtained from the Toronto station (1840 to 2002) and the North York station (2003 to 2024) to represent the climatic conditions of Simcoe County Forest. While these stations provide long-term continuous records, their representativeness for Simcoe’s microclimate is limited. Simcoe County lies further North at a higher elevation (200–300 m compared to ~76 m in Toronto) [30]. These differences imply that the Toronto/North York data may slightly overestimate mean temperature, underestimate winter severity, and thus introduce uncertainty into the model simulations.
Soil properties were classified into four texture classes (sand, sandy loam, loam, clay) following the standard 3-PG framework. This categorical approach allows parameterization of available soil water and fertility effects. While practical and consistent with the model structure, this simplification may overlook finer-scale variation in soil hydrology and nutrient status, which could influence simulated productivity and carbon storage.

4.4. Future Research

The project cycle for carbon certification may extend for 10, 20, or even longer years. During this period, the management must comply with the conditions stipulated in the carbon certification contract and restrict any activities that are detrimental to carbon storage. Some carbon certification projects require reducing or delaying logging within the certified area to ensure that carbon storage is maintained or even increased. These restrictions aim to ensure the long-term function of forests as carbon sinks, which indirectly increases the rotation time and may have an impact on sustainable logging plans for forest land [80,81]. In addition, the long-term impacts of carbon sequestration projects remain uncertain [79]. Investigating the effects of carbon certification projects beyond the initial project cycle can offer valuable insights for sustainable forest management. Adaptive management strategies can be formulated based on ongoing monitoring and feedback. Future research could incorporate sensitivity analysis to evaluate how variations in climate variables, carbon prices, interest rate, or model management intensity might influence long-term projections of biomass accumulation and carbon sequestration.

5. Conclusions

This study contributes innovatively by coupling ecological modelling with economic evaluation to provide an integrated assessment of management strategies in Simcoe County Forest, offering insights that are directly relevant to regional carbon policy and certification frameworks. The “business as usual” scenario offers a balanced approach, maintaining current management practices with moderate carbon sequestration and stable income. The second scenario, focusing on maximizing NPV, achieves the highest financial returns but at the expense of reduced carbon sequestration, which could undermine long-term sustainability goals. Conversely, the third scenario, incorporating carbon certification, emphasizes carbon sequestration and long-term ecosystem health while still providing competitive financial returns through carbon credits. The results indicate that incorporating carbon certification into forest management can play a crucial role in achieving financial and environmental goals. By delaying the harvest of Sugar maple and introducing additional Red pine plantations, the third management scenario can not only improve carbon storage but also ensure compliance with the VCS and FSC requirements. Despite the uncertainty of changes in tree species composition and future carbon markets, the dual benefits of economic benefits and environmental management make carbon certification a viable long-term strategy for sustainable forest management. Future research could further enhance this framework by integrating remote sensing data to improve the spatiotemporal resolution of biomass and carbon estimates, expanding the analysis to include additional ecosystem services, and incorporating dynamic carbon price scenarios.

Supplementary Materials

The following supporting information can be downloaded at: https://www.mdpi.com/article/10.3390/f16101610/s1, Table S1. Biomass price per ton; Table S2. VCS program fee list [82]; Table S3. Species parameters in 3-PG model; Table S4. Scenario1-Business as usual. The first two columns of this table show the area of four tree species growing in each soil type. The third column shows the timber biomass obtained by logging each tree species in different soil types. The last column shows the remaining biomass of the site by 2045 after logging is completed; Table S5. Scenario2-maximize timber value; Table S6. Scenario3-introduce carbon certification. Figure S1. Red pine model parameters sensitivity analysis. Figure S2. White pine model parameters sensitivity analysis. Figure S3. Sugar maple model parameters sensitivity analysis. Figure S4. Red oak model parameters sensitivity analysis.

Author Contributions

Conceptualization, F.S. and R.Y.; methodology, F.S. and R.Y.; software, F.S. and R.Y.; validation, F.S. and R.Y.; formal analysis, F.S. and R.Y.; investigation, F.S. and R.Y.; resources, F.S. and R.Y.; data curation, F.S. and R.Y.; writing—original draft preparation, F.S.; writing—review and editing, F.S. and R.Y.; visualization, F.S. and R.Y.; supervision, R.Y.; project administration, R.Y.; funding acquisition, R.Y. All authors have read and agreed to the published version of the manuscript.

Funding

This research was funded by Canadian NSERC Discovery grant.

Data Availability Statement

The raw data supporting the conclusions of this article will be made available by the authors on request.

Acknowledgments

We wish to extend authors’ sincere gratitude to Graeme Davis and William Cox for granting access to their forest data and providing logistical assistance during the study in Simcoe County. We also thank Mengyuxin Zhang for his assistance in data collection and on-site investigation.

Conflicts of Interest

The authors declare no conflicts of interest.

References

  1. De Meyer, F.; Jouenne, S. Industrial carbon capture by absorption: Recent advances and path forward. Curr. Opin. Chem. Eng. 2022, 38, 100868. [Google Scholar] [CrossRef]
  2. Olabi, A.G.; Wilberforce, T.; Elsaid, K.; Sayed, E.T.; Maghrabie, H.M.; Abdelkareem, M.A. Large scale application of carbon capture to process industries—A review. J. Clean. Prod. 2022, 362, 132300. [Google Scholar] [CrossRef]
  3. Greenhouse Gas Emissions: Quantification, Reporting and Verification, Ontario Regulation 390/18. 2018. Available online: https://canlii.ca/t/56fnz (accessed on 29 September 2024).
  4. Paul, C.; Bartkowski, B.; Dönmez, C.; Don, A.; Mayer, S.; Steffens, M.; Weigl, S.; Wiesmeier, M.; Wolf, A.; Helming, K. Carbon farming: Are soil carbon certificates a suitable tool for climate change mitigation? J. Environ. Manag. 2023, 330, 117142. [Google Scholar] [CrossRef]
  5. Peterson St-Laurent, G.; Hagerman, S.; Hoberg, G. Emergence and influence of a new policy regime: The case of forest carbon offsets in British Columbia. Land Use Policy 2017, 60, 169–180. [Google Scholar] [CrossRef]
  6. Biggs, J.; Laaksonen-Craig, S. Viability of carbon offset-generating afforestation projects in boreal Ontario. For. Chron. 2006, 82, 70–76. [Google Scholar] [CrossRef]
  7. Daniels, T.L. Integrating forest carbon sequestration into a cap-and-trade program to reduce net CO2 emissions. J. Am. Plann. Assoc. 2010, 76, 463–475. [Google Scholar] [CrossRef]
  8. Lorenz, K.; Lal, R. Carbon Sequestration in Forest Ecosystems: The Natural Dynamic of Carbon in Forest Ecosystems; Springer Science + Business Media: Dordrecht, The Netherlands, 2010. [Google Scholar]
  9. Galinato, G.I.; Olanie, A.; Uchida, S.; Yoder, J.K. Long-term versus temporary certified emission reductions in forest carbon sequestration programs. Aust. J. Agric. Resour. Econ. 2011, 55, 537–559. [Google Scholar] [CrossRef]
  10. Aldy, J.E.; Stavins, R.N. The promise and problems of pricing carbon. J. Environ. Dev. 2012, 21, 152–180. [Google Scholar] [CrossRef]
  11. Ji, C.J.; Hu, Y.J.; Tang, B.J. Research on carbon market price mechanism and influencing factors: A literature review. Nat. Hazards 2018, 92, 761–782. [Google Scholar] [CrossRef]
  12. Zhang, W.; Li, J.; Li, G.; Guo, S. Emission reduction effect and carbon market efficiency of carbon emissions trading policy in China. Energy 2020, 196, 117117. [Google Scholar] [CrossRef]
  13. Environment and Natural Resources Canada. The Federal Carbon Pollution Pricing Benchmark. 2023. Available online: https://www.canada.ca/en/environment-climate-change/services/managing-pollution/energy-production/fuel-regulations/clean-fuel-regulations.html (accessed on 11 September 2024).
  14. Blyth, W.; Bunn, D.; Kettunen, J.; Wilson, T. Policy interactions, risk and price formation in carbon markets. Energ. Policy 2009, 37, 5192–5207. [Google Scholar] [CrossRef]
  15. Hintermann, B. Allowance price drivers in the first phase of the EU ETS. J. Environ. Econ. Manag. 2010, 59, 43–56. [Google Scholar] [CrossRef]
  16. Lederer, M. Market making via regulation: The role of the state in carbon markets. Regul. Gov. 2012, 6, 524–544. [Google Scholar] [CrossRef]
  17. Kreibich, N.; Hermwille, L. Caught in between: Credibility and feasibility of the voluntary carbon market post-2020. Clim. Policy 2021, 21, 939–957. [Google Scholar] [CrossRef]
  18. Benítez, P.C.; McCallum, I.; Obersteiner, M.; Yamagata, Y. Global potential for carbon sequestration: Geographical distribution, country risk and policy implications. Ecol. Econ. 2007, 60, 572–583. [Google Scholar] [CrossRef]
  19. Swallow, B.M.; Goddard, T.W. Developing Alberta’s greenhouse gas offset system within Canadian and international policy contexts. Int. J. Clim. Change Strateg. Manag. 2016, 8, 318–337. [Google Scholar] [CrossRef]
  20. Brisson, J.; Dreibelbis, M.; Robinson, A. Canada Launches Its First Federal Greenhouse Gas Offset Credit System. Environment, Land & Resources. 2022. Available online: https://www.globalelr.com/2022/07/canada-launches-its-first-federal-greenhouse-gas-offset-credit-system/ (accessed on 21 August 2024).
  21. Environment and Climate Change Canada. 2024. Available online: https://www.canada.ca/en/environment-climate-change.html (accessed on 11 September 2024).
  22. Raihan, A.; Begum, R.A.; Mohd Said, M.N.; Abdullah, S.M.S. A review of emission reduction potential and cost savings through forest carbon sequestration. Asian J. Water Environ. Pollut. 2019, 16, 1–7. [Google Scholar] [CrossRef]
  23. Legislative Services. Consolidated Federal Laws of Canada, Greenhouse Gas Pollution Pricing Act. 2024. Available online: https://laws-lois.justice.gc.ca/eng/acts/g-11.55/ (accessed on 9 October 2024).
  24. Roy, A.; Bhan, M. Carbon Market Initiatives for Forests in India. India Water Portal. 2024. Available online: https://www.indiawaterportal.org/articles/carbon-market-initiatives-forests-india (accessed on 23 August 2024).
  25. Galinato, G.I.; Uchida, S. The effect of temporary certified emission reductions on forest rotations and carbon supply. Can. J. Agric. Econ. 2010, 59, 145–164. [Google Scholar] [CrossRef]
  26. Phelan, L.; Henderson-Sellers, A.; Taplin, R. Climate change, carbon prices and insurance systems. Int. J. Sustain. Dev. World Ecol. 2010, 17, 95–108. [Google Scholar] [CrossRef]
  27. Li, L.; Ye, F.; Li, Y.; Chang, C.T. How will the Chinese certified emission reduction scheme save cost for the national carbon trading system? J. Environ. Manag. 2019, 244, 99–109. [Google Scholar] [CrossRef] [PubMed]
  28. Overdevest, C.; Rickenbach, M.G. Forest certification and institutional governance: An empirical study of forest stewardship council certificate holders in the United States. For. Policy Econ. 2006, 9, 93–102. [Google Scholar] [CrossRef]
  29. Moore, S.E.; Cubbage, F.; Eicheldinger, C. Impacts of forest stewardship council (FSC) and sustainable forestry initiative (SFI) forest certification in North America. J. For. 2012, 110, 79–88. [Google Scholar] [CrossRef]
  30. Simcoe County Forest. Simcoe County Forest 2011–2030 Revised 2023; Simcoe County Forest: Toronto, ON, Canada, 2023. [Google Scholar]
  31. Puric-Mladenovic, D.; Gleeson, J.; Nielsen, G. Estimating Carbon Storage in Southern Ontario Forests at Regional and Stand Levels; Ontario Ministry of Natural Resources and Forestry: Toronto, ON, Canada, 2016. [Google Scholar]
  32. Landsberg, J.J.; Waring, R.H. A generalised model of forest productivity using simplified concepts of radiation-use efficiency, carbon balance and partitioning. For. Ecol. Manag. 1997, 95, 209–228. [Google Scholar] [CrossRef]
  33. Landsberg, J.J.; Waring, R.H.; Coops, N.C. Performance of the forest productivity model 3-PG applied to a wide range of forest types. For. Ecol. Manag. 2003, 172, 199–214. [Google Scholar] [CrossRef]
  34. Bai, Y.; Pang, Y.; Kong, D. Integrating remote sensing and 3-PG model to simulate the biomass and carbon stock of Larix olgensis plantation. For. Ecosyst. 2024, 11, 100213. [Google Scholar] [CrossRef]
  35. Forrester, D.I.; Tang, X. Analysing the spatial and temporal dynamics of species interactions in mixed-species forests and the effects of stand density using the 3-PG model. Ecol. Model. 2016, 319, 233–254. [Google Scholar] [CrossRef]
  36. Forrester, D.I.; Ammer, C.H.; Annighöfer, P.J.; Avdagic, A.; Barbeito, I.; Bielak, K.; Brazaitis, G.; Coll, L.; Del Río, M.; Drössler, L.; et al. Predicting the spatial and temporal dynamics of species interactions in Fagus sylvatica and Pinus sylvestris forests across Europe. For. Ecol. Manag. 2017, 405, 112–133. [Google Scholar] [CrossRef]
  37. Gupta, R.; Sharma, L.K. The process-based forest growth model 3-PG for use in forest management: A review. Ecol. Model. 2019, 397, 55–73. [Google Scholar] [CrossRef]
  38. Lin, S.; He, Z.; Huang, H.; Chen, L.; Li, L. Mixed forest specific calibration of the 3-pgmix model parameters from site observations to predict post-fire forest regrowth. For. Ecol. Manag. 2022, 515, 120208. [Google Scholar] [CrossRef]
  39. Vega-Nieva, D.J.; Tomé, M.; Tomé, J.; Fontes, L.; Soares, P.; Ortiz, L.; Basurco, F.; Rodrígez-Soalleiro, R. Developing a general method for the estimation of the fertility rating parameter of the 3-PG model: Application in Eucalyptus globulus plantations in northwestern Spain. Can. J. For. Res. 2013, 43, 627–636. [Google Scholar] [CrossRef]
  40. Augustynczik, A.L.D.; Hartig, F.; Minunno, F.; Kahle, H.P.; Diaconu, D.; Hanewinkel, M.; Yousefpour, R. Productivity of Fagus sylvatica under climate change—A Bayesian analysis of risk and uncertainty using the model 3-PG. For. Ecol. Manag. 2017, 401, 192–206. [Google Scholar] [CrossRef]
  41. Trotsiuk, V.; Hartig, F.; Forrester, D.I. R3PG—An R package for simulating forest growth using the 3-PG process-based model. Methods Ecol. Evol. 2020, 11, 1470–1475. [Google Scholar] [CrossRef]
  42. Lessa Derci Augustynczik, A.; Yousefpour, R. Assessing the synergistic value of ecosystem services in European beech forests. Ecosyst. Serv. 2021, 49, 101264. [Google Scholar] [CrossRef]
  43. Palma, J.H.; Hakamada, R.; Moreira, G.G.; Nobre, S.; Rodriguez, L.C.E. Using 3PG to assess climate change impacts on management plan optimization of Eucalyptus plantations. A case study in southern Brazil. Sci. Rep. 2021, 11, 2708. [Google Scholar] [CrossRef]
  44. Tomback, D.F.; Achuff, P. Blister rust and western forest biodiversity: Ecology, values and outlook for white pines. For. Pathol. 2010, 40, 186–225. [Google Scholar] [CrossRef]
  45. Anand, M.; Leithead, M.; Silva, L.C.; Wagner, C.; Ashiq, M.W.; Cecile, J.; Drobyshev, I.; Bergeron, Y.; Das, A.; Bulger, C. The scientific value of the largest remaining old-growth red pine forests in North America. Biodivers. Conserv. 2013, 22, 1847–1861. [Google Scholar] [CrossRef]
  46. UBC Forestry. 3PG Course: Lectures: 3-PG Forest Growth Model. 2020. Available online: https://3pg.forestry.ubc.ca/3-pg-course/ (accessed on 19 May 2024).
  47. Agriculture and Agri-Food Canada. Soil Survey of Simcoe County. 2024. Available online: https://sis.agr.gc.ca/cansis/publications/surveys/on/on29/index.html (accessed on 24 September 2024).
  48. Alban, D.H.; Laidly, P.R. Generalized biomass equations for Jack and red pine in the Lake States. Can. J. For. Res. 1982, 12, 913–921. [Google Scholar] [CrossRef]
  49. Peichl, M.; Arain, M.A. Allometry and partitioning of above- and belowground tree biomass in an age-sequence of white pine forests. For. Ecol. Manag. 2007, 253, 68–80. [Google Scholar] [CrossRef]
  50. Chapman, J.W.; Gower, S.T. Aboveground production and canopy dynamics in sugar maple and red oak trees in southwestern Wisconsin. Can. J. For. Res. 1991, 21, 1533–1543. [Google Scholar] [CrossRef]
  51. Ouimet, R.; Camiré, C.; Brazeau, M.; Moore, J.D. Estimation of coarse root biomass and nutrient content for sugar maple, Jack Pine, and black spruce using stem diameter at breast height. Can. J. For. Res. 2008, 38, 92–100. [Google Scholar] [CrossRef]
  52. Minunno, F.; van Oijen, M.; Cameron, D.R.; Pereira, J.S. Selecting parameters for Bayesian calibration of a process-based model: A methodology based on canonical correlation analysis. J. Uncertain. Quantif. 2013, 1, 370–385. [Google Scholar] [CrossRef]
  53. Van Oijen, M.; Reyer, C.; Bohn, F.J.; Cameron, D.R.; Deckmyn, G.; Flechsig, M.; Härkönen, S.; Hartig, F.; Huth, A.; Kiviste, A.; et al. Bayesian calibration, comparison and averaging of six forest models, using data from Scots pine stands across Europe. For. Ecol. Manag. 2013, 289, 255–268. [Google Scholar] [CrossRef]
  54. Wang, H.; Ma, Y.; Zhou, W.; Shi, Y.; Su, X. Development of a system for simulating and visualizing the biomass of fir trees using a parameter optimized 3-PG model. In Proceedings of the Fourth International Conference on Applied Mathematics, Modelling, and Intelligent Computing (CAMMIC 2024), Kaifeng, China, 22–24 March 2024. [Google Scholar]
  55. Bagnara, M.; Van Oijen, M.; Cameron, D.; Gianelle, D.; Magnani, F.; Sottocornola, M. Bayesian calibration of simple forest models with multiplicative mathematical structure: A case study with two light use efficiency models in an Alpine forest. Ecol. Model. 2018, 371, 90–100. [Google Scholar] [CrossRef]
  56. Liu, C.; Zheng, X.; Ren, Y. Parameter optimization of the 3PG model based on sensitivity analysis and a Bayesian method. Forests 2020, 11, 1369. [Google Scholar] [CrossRef]
  57. Forrester, D.I.; Hobi, M.L.; Mathys, A.S.; Stadelmann, G.; Trotsiuk, V. Calibration of the process-based model 3-PG for major Central European tree species. Eur. J. For. Res. 2021, 140, 847–868. [Google Scholar] [CrossRef]
  58. Sauter, P.A.; Mußhoff, O. What is your discount rate? Experimental evidence of foresters’ risk and time preferences. Ann. For. Sci. 2018, 75, 10. [Google Scholar] [CrossRef]
  59. Matweb. The Online Materials Information Resource. 1999. Available online: https://www.matweb.com/search/search.aspx (accessed on 16 July 2024).
  60. Santantonio, D.; Hermann, R.K.; Overton, W.S. Root biomass studies in forest ecosystems. Pedobiologia 1977, 17, 1–31. [Google Scholar] [CrossRef]
  61. Wood Database. Eastern White Pine. 2017. Available online: https://www.wood-database.com/eastern-white-pine/ (accessed on 29 May 2024).
  62. Wood Database. Red Oak. 2022. Available online: https://www.wood-database.com/red-oak/ (accessed on 29 May 2024).
  63. Grafton, R.Q.; Chu, H.L.; Nelson, H.; Bonnis, G. A global analysis of the cost-efficiency of forest carbon sequestration. OECD Environ. Work. Pap. 2021, 17, 1–66. [Google Scholar]
  64. CSIMarket. Forestry & Wood Products Industry Profitability. 2025. Available online: https://csimarket.com/Industry/industry_Profitability_Ratios.php?hist=1&ind=105&utm (accessed on 1 October 2024).
  65. Amichev, B.Y.; Hangs, R.D.; Van Rees, K.C.J. A novel approach to simulate growth of multi-stem willow in bioenergy production systems with a simple process-based model (3PG). Biomass Bioenerg. 2011, 35, 473–488. [Google Scholar] [CrossRef]
  66. Wei, L.; Marshall, J.D.; Zhang, J.; Zhou, H.; Powers, R.F. 3-PG simulations of young ponderosa pine plantations under varied management intensity: Why do they grow so differently? For. Ecol. Manag. 2014, 313, 69–82. [Google Scholar] [CrossRef]
  67. Kuuluvainen, T.; Lindberg, H.; Vanha-Majamaa, I.; Keto-Tokoi, P.; Punttila, P. Low-level retention forestry, certification, and biodiversity: Case Finland. Ecol. Process. 2019, 8, 47. [Google Scholar] [CrossRef]
  68. Großmann, J.; Carlson, L.; Kändler, G.; Pyttel, P.; Kleinschmit, J.R.; Bauhus, J. Evaluating retention forestry 10 years after its introduction in temperate forests regarding the provision of tree-related microhabitats and dead wood. Eur. J. For. Res. 2023, 142, 1125–1147. [Google Scholar] [CrossRef]
  69. Peng, C. Understanding the role of forest simulation models in sustainable forest management. Environ. Impact Assess. Rev. 2000, 20, 481–501. [Google Scholar] [CrossRef]
  70. Rist, L.; Moen, J. Sustainability in forest management and a new role for resilience thinking. For. Ecol. Manag. 2013, 310, 416–427. [Google Scholar] [CrossRef]
  71. Kant, S. Economics of sustainable forest management. For. Policy Econ. 2004, 6, 197–203. [Google Scholar] [CrossRef] [PubMed]
  72. Chazdon, R.L.; Lindenmayer, D.; Guariguata, M.R.; Crouzeilles, R.; Benayas, J.M.R.; Chavero, E.L. Fostering natural forest regeneration on former agricultural land through economic and policy interventions. Environ. Res. Lett. 2020, 15, 099501. [Google Scholar] [CrossRef]
  73. Li, R.; Yan, Q.; Xie, J.; Wang, J.; Zhang, T.; Zhu, J. Effects of logging on the trade-off between seed and sprout regeneration of dominant woody species in secondary forests of the Natural Forest Protection Project of China. Ecol. Process. 2022, 11, 16. [Google Scholar] [CrossRef]
  74. Payne, N.J.; Cameron, D.A.; Leblanc, J.D.; Morrison, I. Carbon storage and net primary productivity in Canadian boreal mixedwood stands. J. For. Res. 2019, 30, 1667–1678. [Google Scholar] [CrossRef]
  75. Foley, T.G.; Richter, D.D.; Galik, C.S. Extending rotation age for carbon sequestration: A cross-protocol comparison of North American forest offsets. For. Ecol. Manag. 2009, 259, 201–209. [Google Scholar] [CrossRef]
  76. Yemshanov, D.; Mckenney, D.; Fraleigh, S.; D’eon, S. An integrated spatial assessment of the investment potential of three species in southern Ontario, Canada inclusive of carbon benefits. For. Policy Econ. 2004, 10, 48–59. [Google Scholar] [CrossRef]
  77. Guo, J.; Gong, P. The potential and cost of increasing forest carbon sequestration in Sweden. J. For. Econ. 2017, 29, 78–86. [Google Scholar] [CrossRef]
  78. López-Serrano, F.R.; Martínez-García, E.; Dadi, T.; Rubio, E.; García-Morote, F.A.; Lucas-Borja, M.E.; Andrés-Abellán, M. Biomass growth simulations in a natural mixed forest stand under different thinning intensities by 3-PG process-based model. Eur. J. For. Res. 2014, 134, 167–185. [Google Scholar] [CrossRef]
  79. Bouwman, M.; Forrester, D.I.; den Ouden, J.; Nabuurs, G.J.; Mohren, G.M.J. Species interactions under climate change in mixed stands of Scots pine and pedunculate oak. For. Ecol. Manag. 2021, 481, 118615. [Google Scholar] [CrossRef]
  80. Roberge, J.M.; Laudon, H.; Björkman, C.; Ranius, T.; Sandström, C.; Felton, A.; Sténs, A.; Nordin, A.; Granström, A.; Widemo, F.; et al. Socio-ecological implications of modifying rotation lengths in forestry. Ambio 2016, 45, 109–123. [Google Scholar] [CrossRef] [PubMed]
  81. Nakajima, T.; Shiraishi, N.; Kanomata, H.; Matsumoto, M. A method to maximise forest profitability through optimal rotation period selection under various economic, site and silvicultural conditions. N. Z. J. For. Sci. 2017, 47, 4. [Google Scholar] [CrossRef]
  82. VCS Program Fee. Program Fee Schedule V4.3 Final. 2024. Available online: https://www.scribd.com/document/660303304/Program-Fee-Schedule-v4-3-FINAL (accessed on 25 July 2024).
Figure 1. Overview of study area. (a) Location of the Ontario province. (b) Location of Simcoe County. (c) Simcoe County forest map. (d,e) Tree Pictures in Simcoe County Forest.
Forests 16 01610 g001
Figure 2. Red pine model evolution from default to final model.
Forests 16 01610 g002
Figure 3. Sugar maple model evolution from default to final model.
Forests 16 01610 g003
Figure 4. White pine model evolution from default to final model.
Forests 16 01610 g004
Figure 5. Red oak model evolution from default to final model.
Forests 16 01610 g005
Figure 6. Income and remaining biomass across three forest management scenarios.
Forests 16 01610 g006
Table 1. Calibration and validation errors of models.
Red PineSugar MapleWhite PineRed Oak
CalibrationValidationCalibrationValidationCalibrationValidationCalibrationValidation
e_percent_stem5.420.290.994.96−6.8−6.37−0.747.71
MAE_percent_stem7.144.723.265.346.86.554.038.28
MSE_stem489.36306.30111.75344.44201.73 123.98108.72559.22
e_percent_root4.632.58−14.05−17.64−8.04 −0.97 7.970.82
MAE_percent_root4.636.9514.0517.6411.546.387.98 7.00
MSE_root8.5029.6744.3286.4512.675.9610.319.39
e_percent_foliage2.45 −7.8213.869.813.0610.13−6.206.12
MAE_percent_foliage2.678.0614.310.649.8011.696.606.37
MSE_foliage0.174.191.811.100.030.060.160.11
R square0.790.940.960.930.650.780.800.69
Disclaimer/Publisher’s Note: The statements, opinions and data contained in all publications are solely those of the individual author(s) and contributor(s) and not of MDPI and/or the editor(s). MDPI and/or the editor(s) disclaim responsibility for any injury to people or property resulting from any ideas, methods, instructions or products referred to in the content.