Article

Assessing Anthropogenic Impacts on the Carbon Sink Dynamics in Tropical Lowland Rainforest Using Multiple Remote Sensing Data: A Case Study of Jianfengling, China

1
Intelligent Forestry Key Laboratory of Haikou City, School of Tropical Agriculture and Forestry, Hainan University, Haikou 570228, China
2
School of Ecology, Hainan University, Haikou 570228, China
3
Hainan Academy of Forestry (Hainan Academy of Mangrove), Haikou 571100, China
*
Authors to whom correspondence should be addressed.
These authors contributed equally to this work.
Forests 2025, 16(10), 1611; https://doi.org/10.3390/f16101611
Submission received: 7 September 2025 / Revised: 14 October 2025 / Accepted: 16 October 2025 / Published: 20 October 2025
(This article belongs to the Special Issue Modelling and Estimation of Forest Biomass)

Abstract

Aboveground biomass (AGB) is a key indicator of forest structure and carbon sequestration, yet its dynamics under concurrent anthropogenic disturbances remain poorly understood. This study investigates the spatiotemporal dynamics and driving mechanisms of AGB in the Jianfengling tropical lowland rainforest (JFLTLR) within Hainan Tropical Rainforest National Park (NRHTR) from 2015 to 2023. Six machine learning models—Extreme Gradient Boosting (XGBoost), Gradient Boosting Machine (GBM), Support Vector Machine (SVM), k-Nearest Neighbors (KNN), Decision Tree (DT), and Random Forest (RF)—were evaluated, with RF achieving the highest accuracy (R2 = 0.83). Therefore, RF was employed to generate high-resolution annual AGB maps based on Sentinel-1/2 data fusion, field surveys, socio-economic indicators, and topographic variables. Human pressure was quantified using the Human Influence Index (HII). Threshold analysis revealed a critical breakpoint at ΔHII ≈ 0.1712: below this level, AGB remained relatively stable, whereas beyond it, biomass declined sharply (≈−2.65 mg·ha−1 per 0.01 ΔHII). Partial least squares structural equation modeling (PLS-SEM) identified plantation forests as the dominant negative driver, while GDP (−0.91) and road (−1.04) exerted strong indirect effects through HII, peaking in 2019 before weakening under ecological restoration policies. Spatially, biomass remained resilient within central core zones but declined in peripheral regions associated with road expansion. Temporally, AGB exhibited a trajectory of decline, partial recovery, and renewed loss, resulting in a net reduction of ≈ 0.0393 × 10⁶ mg. These findings underscore the urgent need for a “core stabilization–peripheral containment” strategy integrating disturbance early-warning systems, transportation planning that minimizes impacts on high-AGB corridors, and the strengthening of ecological corridors to maintain carbon-sink capacity and guide differentiated rainforest conservation.

1. Introduction

Forest ecosystems constitute the largest terrestrial carbon sink, sequestering nearly one-third of anthropogenic carbon emissions and storing about 45% of global terrestrial carbon stocks, thereby playing a vital role in climate regulation and ecosystem stability [1,2,3]. Aboveground biomass (AGB), the dominant component of forest carbon stocks, serves as a key indicator for evaluating forest structural integrity, ecological functioning, and carbon sequestration potential [4]. However, AGB is highly sensitive to external disturbances. Rapid urban expansion, road network development, and agricultural activities have collectively transformed land-use patterns, reduced biodiversity, and impaired the ecological stability of regional forest ecosystems. Combined with climate change, these disturbances impose persistent, multiscale impacts on vegetation productivity and species composition, leading to temporal fluctuations and pronounced spatial heterogeneity in AGB dynamics [5,6]. Therefore, precise quantification of AGB dynamics and a systematic understanding of the mechanistic link with anthropogenic disturbance are essential for enhancing regional carbon storage capacity and ensuring long-term ecosystem resilience.
AGB monitoring and quantification rely mainly on three approaches: field plot inventories, ecological process models, and remote sensing inversion [7]. Previous studies have successfully estimated AGB across multiple spatial scales, ranging from individual trees to landscapes, regions, and the global biosphere, accounting for diverse geographic origins, developmental stages, and biogeographic attributes [8,9,10,11,12]. Due to its spatial continuity and temporal resolution, remote sensing technology effectively captures the spatiotemporal dynamics of forest vegetation and has been widely applied to disturbance detection, species composition analysis, and AGB estimation [13,14,15,16]. Among remote sensing techniques, optical remote sensing, light detection and ranging (LiDAR), and synthetic aperture radar (SAR) are most employed for AGB estimation. Optical remote sensing, which leverages spectral and textural features, is effective for large-scale carbon monitoring but often suffers from signal saturation in dense canopy or high leaf area index conditions [17]. LiDAR excels in capturing vertical vegetation structure but lacks spectral information and is constrained by limited canopy penetration, reducing its accuracy over large areas [18,19]. In contrast, SAR effectively characterizes forest structural attributes and complements the limitations of optical remote sensing and LiDAR in high-biomass or dense-canopy environments [20]. Nonetheless, SAR-based inversion is also prone to saturation under extremely high AGB, although its threshold is generally higher than that of optical remote sensing [21,22]. Integrating SAR and optical remote sensing, capitalizing on their complementary sensitivities to structural and spectral vegetation properties, can mitigate data gaps caused by persistent cloud cover in tropical regions and is particularly effective for monitoring large-scale AGB heterogeneity.
Recent advancements in remote sensing have made multi-source data integration an effective strategy to overcome the limitations of single-sensor data, substantially improving the accuracy of AGB estimation [23,24,25]. However, multi-source remote sensing fusion can introduce redundant features and increase model uncertainty. To address these challenges, machine learning-based feature selection has been widely applied. By combining feature importance metrics with advanced algorithms, the key variables most strongly correlated with AGB can be extracted from high-dimensional remote sensing datasets, enabling the capture of complex, nonlinear relationships and improving model performance [26]. Recent studies have demonstrated the efficacy of combining multi-source remote sensing data with machine learning for AGB mapping in tropical and subtropical forests. For instance, Li et al. [27], integrated Landsat-8, Sentinel-1 (SAR), and Sentinel-2 (optical remote sensing) data with linear regression, random forest (RF), and extreme gradient boosting (XGBoost) models to achieve accurate AGB estimation in subtropical rainforests. Similarly, Salazar-Villegas et al. [28], developed a cost-effective AGB estimation framework for Colombian tropical dry forests using Sentinel-1 SAR and Sentinel-2 MSI data with ensemble learning models. Antunes et al. [29], conducted a systematic comparison of RF and XGBoost performance for AGB estimation in the Amazon rainforest. Nevertheless, most research has focused on static AGB estimates for broad forest types, with limited attention to tropical lowland rainforests—ecosystems that tend to have complex vertical structure, and high leaf area and AGB. These ecosystems are also highly ecologically sensitive and subject to intense human disturbance. In regions with high population density, rapid economic expansion, and extensive transportation networks, the dynamic evolution of AGB in tropical lowland rainforests and its mechanistic link with persistent disturbance remain underexplored and insufficiently quantified, leaving the carbon sink-source status of these forests poorly defined. Understanding AGB responses under persistent and high-intensity disturbance is therefore critical for refining regional carbon budgets and formulating targeted conservation strategies.
The tropical lowland rainforests of Hainan Island, a characteristic zonal vegetation type on the northern edge of Asian rainforests, are mainly distributed across the island’s central mountainous belt, which encompasses the Hainan tropical rainforest national park (NPHTR). These forests are dominated by natural secondary stands formed through historical slash-and-burn cultivation and commercial logging, and they exhibit the high humidity, evergreen canopy, and structural complexity tropical lowland rainforests [30,31]. Jianfengling, the core pilot zone for NPHTR reforms, lies at the interface between intense human development pressures and ecological conservation priorities [32]. Owing to its low elevation and high accessibility, the Jianfengling tropical lowland rainforest (JFLTLR) is subject to intense human disturbances, including population growth, infrastructure expansion, and large-scale plantation development [33,34]. Farmland encroachment, proliferation of commercial plantations, and conversion of natural forests to urban expansion have driven substantial deforestation. Between 2010 and 2020, approximately 24%–28% of new construction lands originated from tropical lowland rainforests, leading to a severe loss of low-elevation forests and disruption of altitudinal migration corridors, thereby weakening the region’s capacity for carbon-cycle regulation [35,36]. Moreover, rapid expansion of the road network has intensified fragmentation and edge effects, and heightened ecosystem vulnerability, resulting in pronounced spatiotemporal heterogeneity of AGB within the JFLTLR region. These combined pressures have emerged as key drivers of declining carbon storage capacity in tropical lowland rainforests in this region [37]. The mechanisms by which human activities affect carbon dynamics in the JFLTLR, particularly within the NPHTR, need to be understood. Quantitative research on the spatiotemporal evolution of AGB and its driving factors is lacking, leaving critical knowledge gaps on carbon dynamics and conservation implications.
These gaps mainly concern the limited understanding of how human disturbances influence AGB and regional carbon dynamics. To bridge them, this study proposes a remote-sensing-first framework that constructs the Human Influence Index (HII) and employs multi-scenario analysis to quantify AGB responses and identify dominant disturbance pathways. Leveraging five temporal phases of Sentinel-1/2 imagery (2015–2023), field inventory plots, and socio-economic datasets, we build a multi-source inversion powered by a majority-vote, six-method predictor-selection ensemble to retrieve annual high-resolution AGB (2015–2023). The HII was derived from human disturbance variables and systematically analyzed to quantify its influence on AGB spatiotemporal dynamics. The specific objectives are to: (1) characterize the spatiotemporal patterns and trends of AGB in the JFLTLR from 2015 to 2023; (2) quantify human disturbance factors using XGBoost, construct the HII, and apply Partial least squares structural equation model (PLS-SEM) to identify direct and indirect drivers of AGB; and (3) assess AGB–HII spatial coupling using bivariate Moran’s I (AGB vs. spatially lagged HII) and identify restoration and spatial-planning leverage points for stabilizing tropical lowland rainforest carbon sinks. Our study establishes a robust methodological framework for carbon budget assessment and provides new insights into the mechanisms governing carbon sequestration and ecosystem resilience in tropical lowland rainforests. The paper is organized as follows: Section 2 covers data and methods (AGB mapping, HII construction, and diagnostics); Section 3 presents results (AGB/HII dynamics, breakpoint analysis, model performance, and factor contributions); Section 4 examines human-disturbance mechanisms, compares with prior work, outlines management implications, and notes limitations; Section 5 provides conclusions and recommendations for carbon sink management.

2. Materials and Methods

2.1. Study Area

Jianfengling is situated in the southwest of Hainan Island (18°20′ N–18°57′ N, 108°41′ E–109°12′ E) and forms part of the NPHTR (Figure 1). Covering approximately 678.4 km2, it is one of the five major forest regions on Hainan Island, with a forest cover rate exceeding 98% and structural characteristics representative of primary tropical lowland rainforests [38,39,40]. The region experiences a tropical monsoon climate, characterized by a mean annual temperature of 25.6 °C, consistently high relative humidity (average ~88%), annual precipitation of approximately 2500–3000 mm, and distinct wet and dry seasons [7]. The terrain transitions from coastal plains to central mountainous zones, creating pronounced altitudinal gradients that strongly influence forest composition, structure, and biomass distribution. Tropical lowland rainforests are primarily concentrated at elevations of 300–900 m in relatively flat terrain, but it is also highly accessible and experiences intensified anthropogenic pressure, highlighting the need for disturbance analysis and AGB monitoring.

2.2. Data Source and Processing

Our study is based on data from remote sensing, field plot inventories, and socio-economic datasets, all of which are summarized in Table S1.

2.2.1. Remote Sensing Imagery

We used Sentinel-2 MSI and Sentinel-1 SAR imagery obtained from the Google Earth Engine (GEE) platform to characterize vegetation and structural features in the study area (Table S4) [41,42]. To achieve high-accuracy AGB estimation, multi-source features derived from Sentinel-2 and Sentinel-1 data were integrated with machine-learning algorithms. Sentinel-2A imagery (10 m resolution, 13 spectral bands) was preprocessed in GEE for atmospheric correction, cloud masking, regional clipping, and vegetation index calculation [43]. A total of 11 vegetation indices, including Normalized Difference Vegetation Index (NDVI), Enhanced Vegetation Index (EVI), Red-edge Normalized Difference Vegetation Index (NDVIre), and Modified Soil Adjusted Vegetation Index 2 (MSAVI2), were generated to characterize canopy vigor and chlorophyll content, thereby reflecting variations in canopy structure and soil background [44,45]. Sentinel-1 C-band SAR data (dual-polarization VV/VH, 5–40 m resolution) underwent radiometric calibration and speckle filtering in GEE, yielding nine radar indices—such as polarization ratios, Radar Vegetation Index (RVI), and Normalized Difference Index (NDI)—to complement optical data often degraded by persistent cloud cover in the JFLTLR [46]. In addition, eight texture features (mean, variance, homogeneity, contrast, dissimilarity, entropy, second moment, and correlation) were extracted from Sentinel-1/2 imagery using the gray-level co-occurrence matrix method in GEE, improving structural characterization of AGB and enabling a systematic sensitivity assessment [47]. All derived variables (vegetation indices, radar indices, and texture metrics) were standardized and exported as raster layers for subsequent modeling and analysis (Table S1) [48].

2.2.2. Plot and Terrain Data

The ground data comprised a total of 154 plots, including both permanent and temporary plots. Permanent plots (25.82 m × 25.82 m) were sourced from the continuous forest resource inventory of Hainan (2015–2023). We generated temporary plots using the fishnet tool in ArcGIS Pro with a 2 km × 2 km grid. We allocated plot centers based on the spatial distribution of the JFLTLR and its terrain and vegetation characteristics. A total of 154 field plots were surveyed, including 51 temporary 20 m × 20 m quadrats and 103 permanent plots. For each plot, tree height, diameter at breast height (DBH), dominant species, elevation, and slope were recorded. Field AGB values were spatially matched with multi-source predictor layers to generate 658 valid samples for model training. The sample-to-feature ratio (~44:1, 15 predictors) was adequate for machine-learning AGB estimation [49,50,51]. The topographic variables essential for AGB estimation were acquired from the Shuttle Radar Topography Mission (SRTM) data of NASA [52]. These data were reprojected and clipped on the GEE to extract elevation, slope, and aspect, which were used to quantify the influence of topographic gradients on spatial heterogeneity in AGB and to infer underlying control mechanisms (Table S1) [47].

2.2.3. Anthropogenic Disturbance Data

The human disturbance factors considered in this study include GDP, land-use intensity “Landuse”, plantation coverage “Artificial forest”, building proportion “Building proportion”, nighttime light index “Light”, road development intensity “Road”, and population density “Population”. These variables were employed to characterize the spatiotemporal distribution and structural heterogeneity of human disturbance across the region from 2015 to 2023 [35]. Population density and GDP data from the Hainan statistical yearbook were interpolated to generate continuous raster layers [53]. Building proportion was quantified using the normalized difference built-up index “NDBI” derived from Sentinel-2 imagery on GEE, which was chosen to represent construction intensity [54,55]. The nighttime light index was obtained from the VIIRS DNB dataset using an annual maximum composite approach [37,53]. Road development intensity was derived from OpenStreetMap (OSM) data through buffer analysis, kernel density estimation, and Kriging interpolation to produce a transportation disturbance raster [38,54]. Land-use intensity was assessed using the CLCD dataset by analyzing transition frequencies among built-up areas, croplands, forests, and other land-cover classes to capture regional development dynamics [39,56]. Plantation coverage was determined using data from the Hainan statistical yearbook, regional plantation statistics, and supplementary references [57,58,59]. All raster datasets were resampled to a 10 m spatial resolution and reprojected to UTM Zone 49N for consistency (Table S1).

2.3. Methods

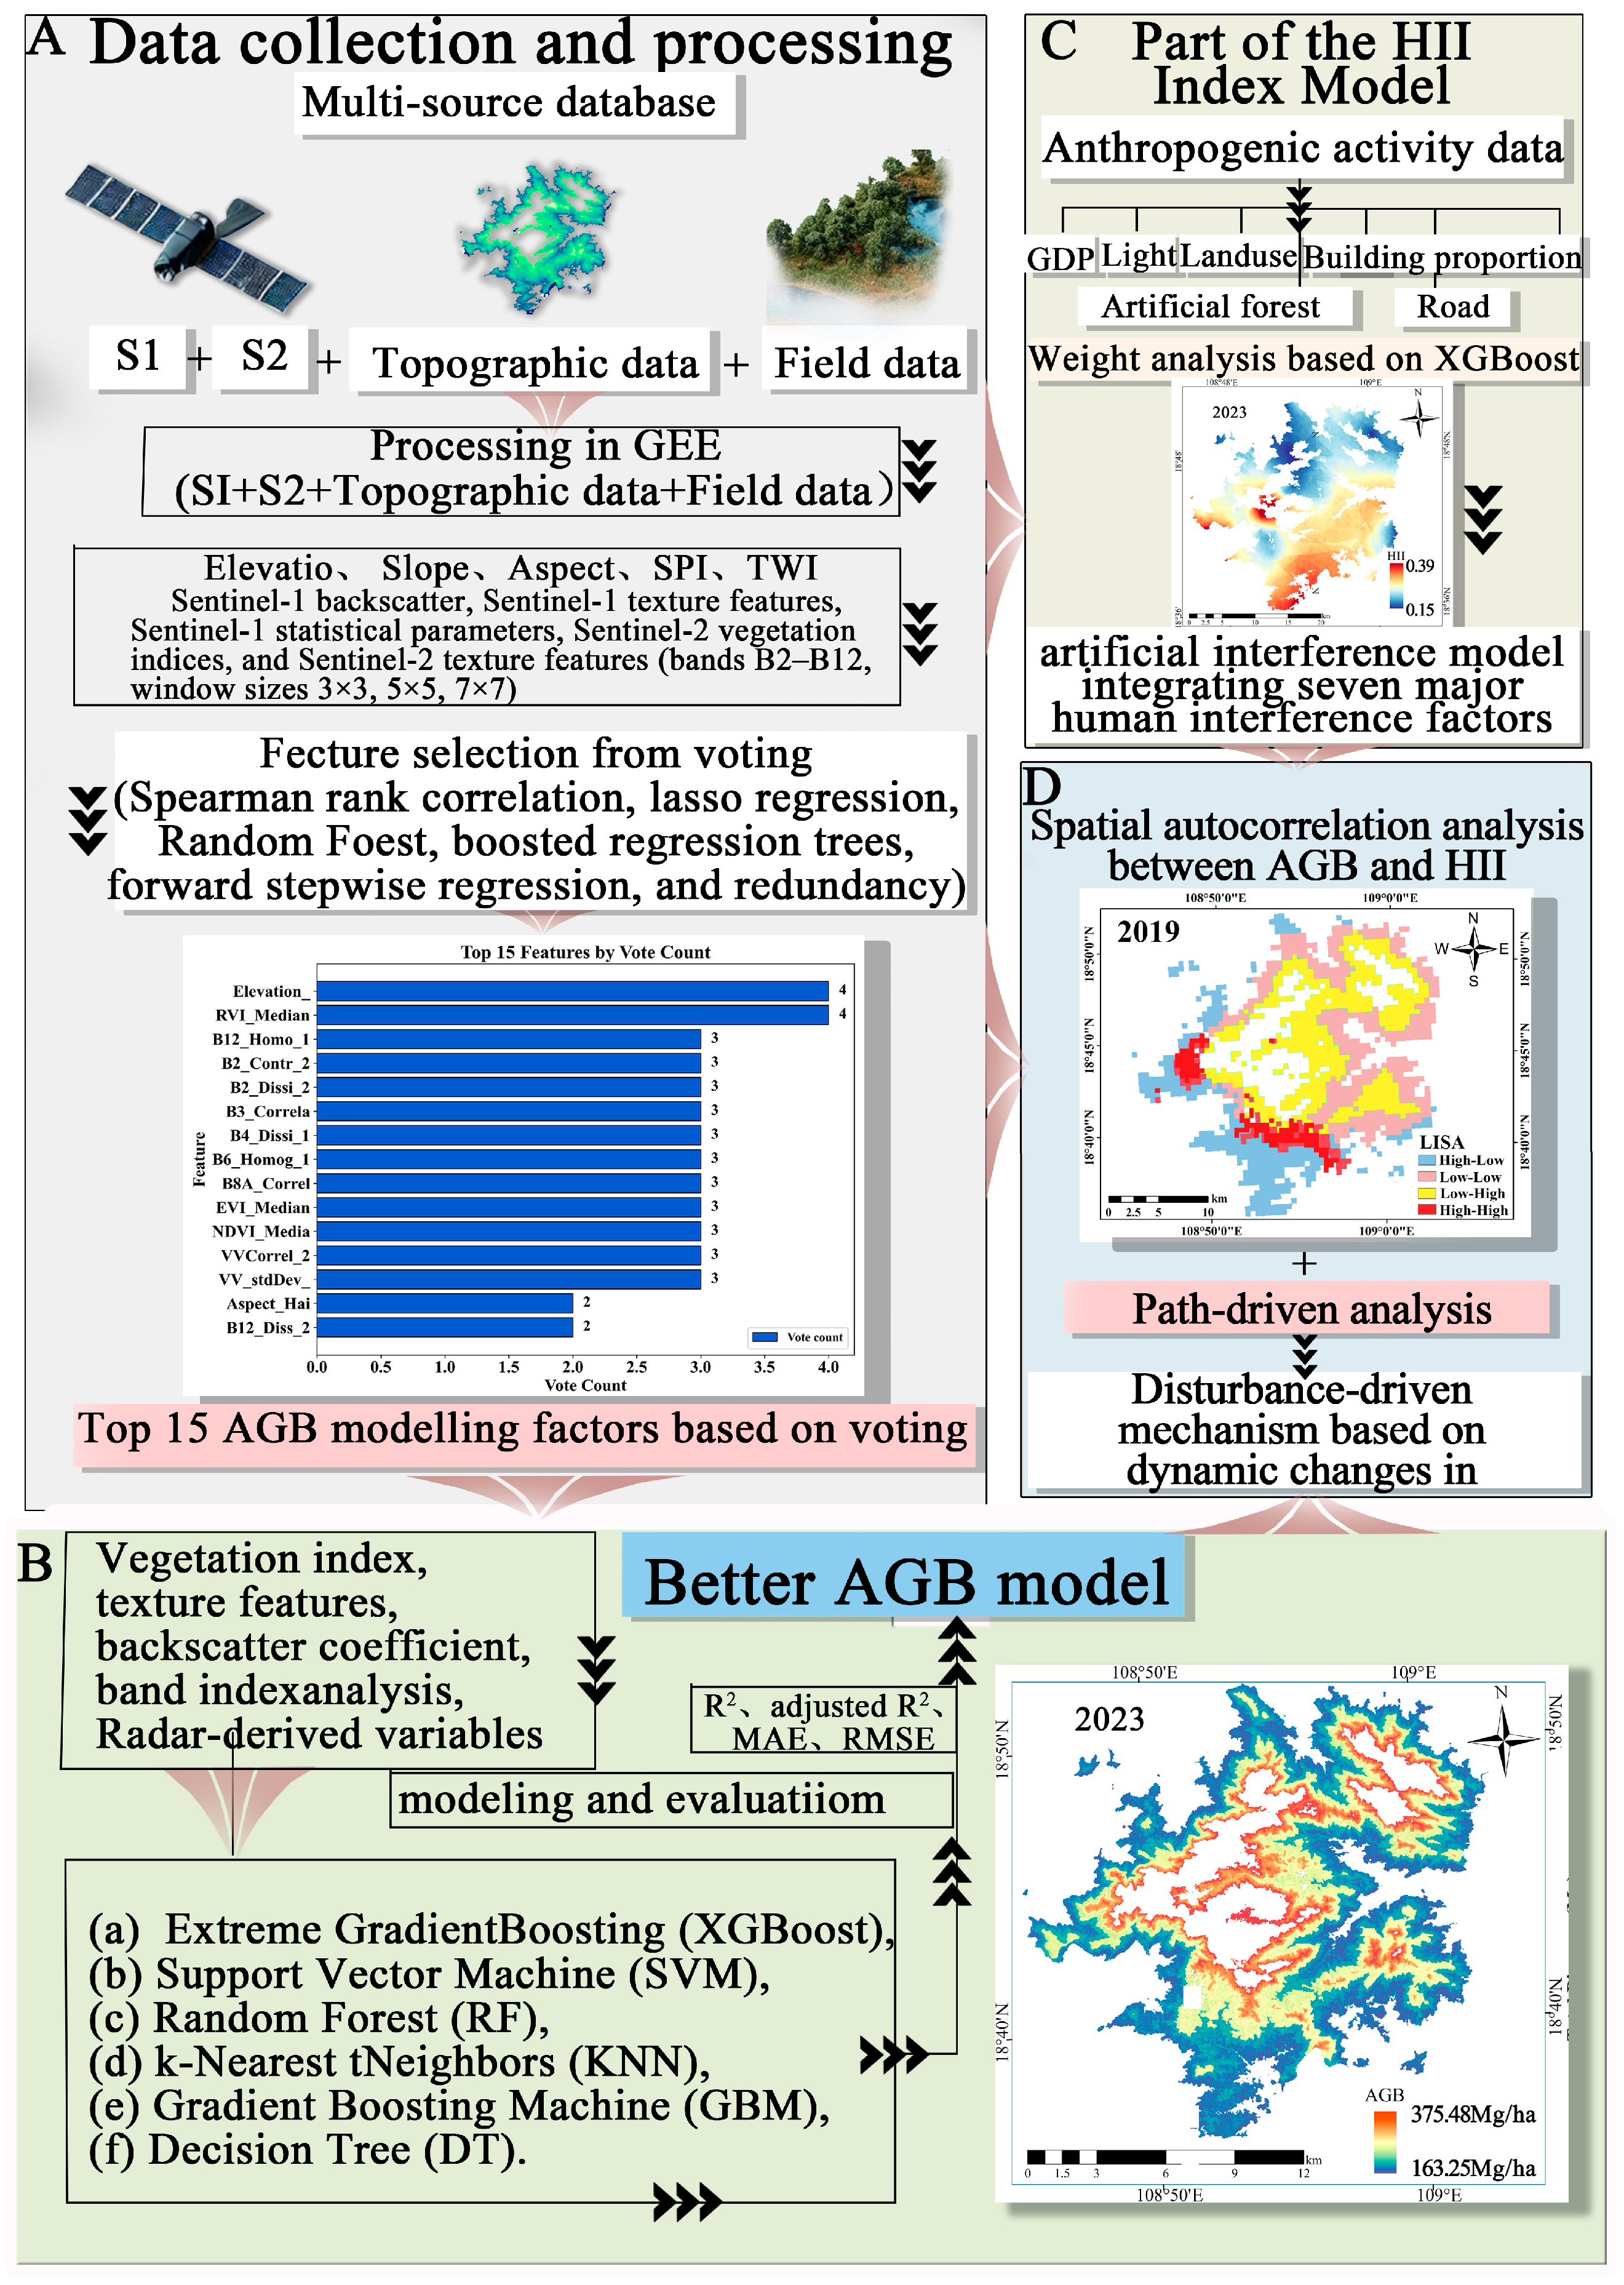
The integrated research framework proposed in this study comprises four main components (Figure 2): (A) data collection and preprocessing; (B) aboveground biomass (AGB) model construction; (C) development of the Human Influence Index (HII); and (D) integrated analyses linking AGB with HII. The full list of abbreviations is provided in Table S3.

2.3.1. AGB Estimation Based on Multi-Source Remote Sensing Data

(1) Model-based independent variable screening
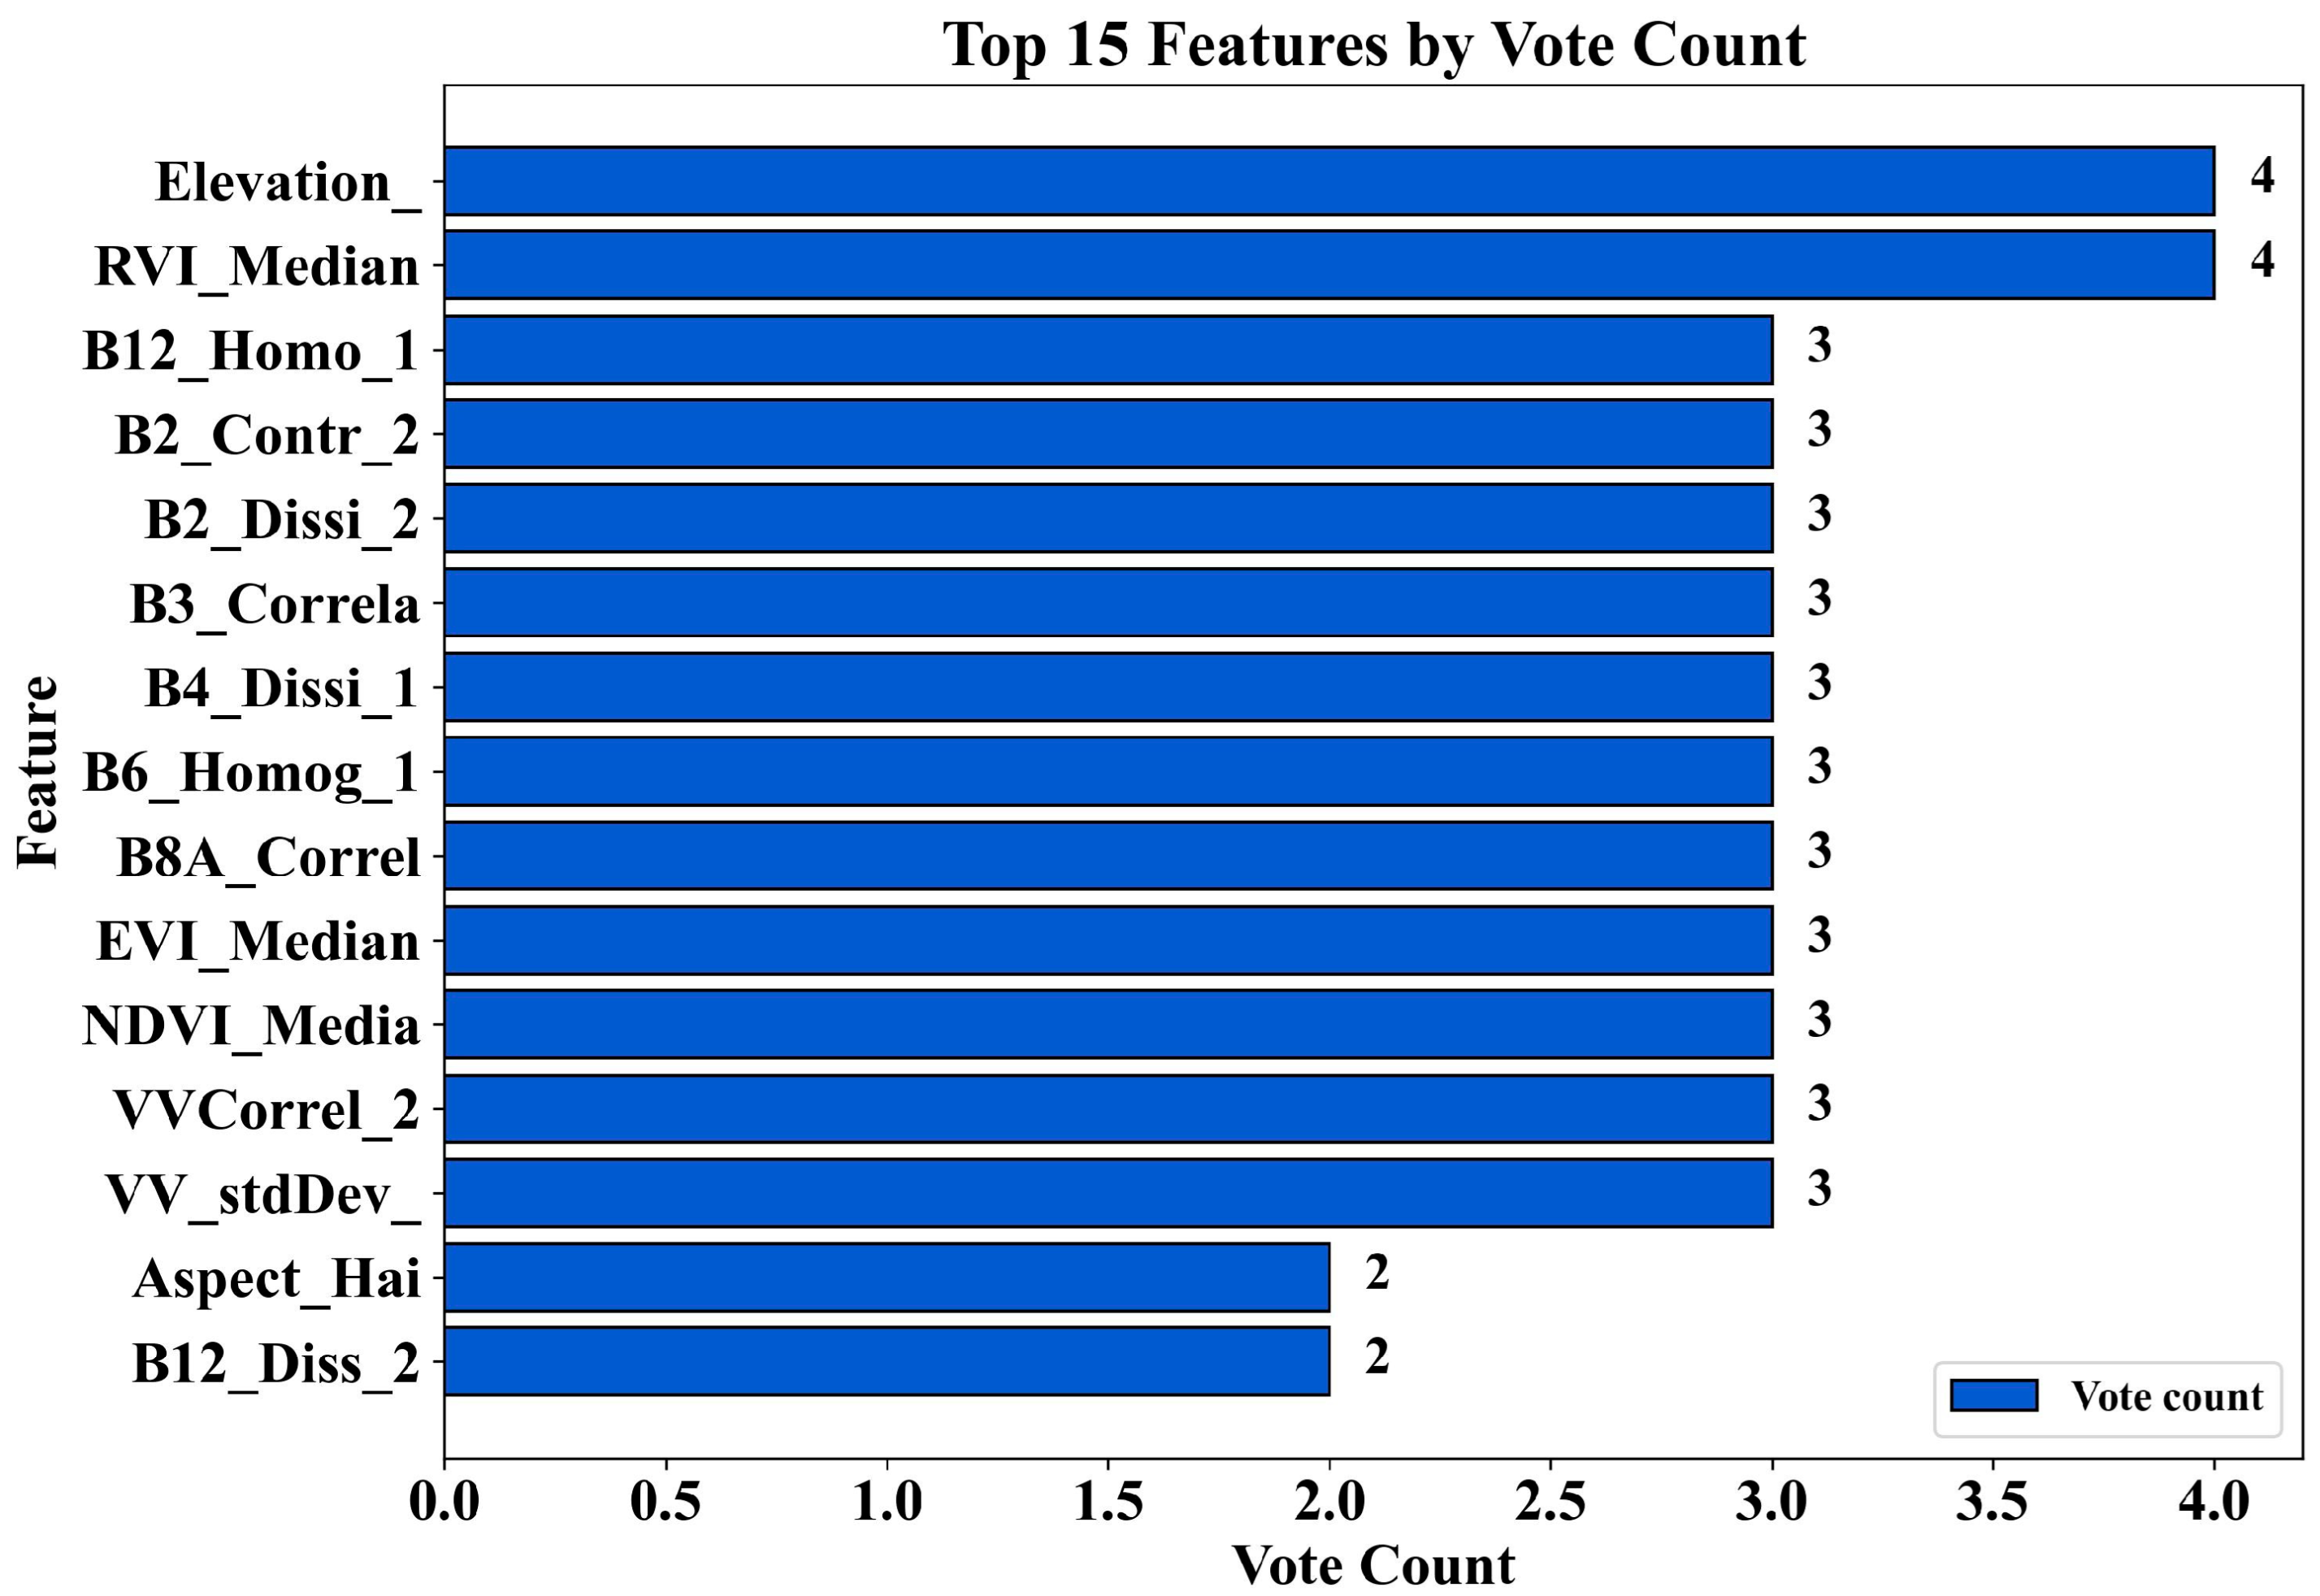
To enhance the predictive accuracy and generalization capability of the AGB estimation model, we adopted an ensemble approach that integrates six methods with a voting-based selection strategy, while accounting for variable correlation, predictive contribution, and redundancy control [60,61,62,63]. We used six complementary feature-selection methods, including Spearman rank correlation, Least Absolute Shrinkage and Selection Operator (LASSO), RF, Boosted Regression Trees (BRT), forward stepwise regression, and redundancy analysis (RDA), in Google Colab to limit multicollinearity and model-specific bias and to identify stable AGB predictors. Because different algorithms emphasize importance differently (for example, RF can favor correlated variables), we integrated results with a frequency-based voting scheme and retained the top 15 variables for modeling and validation. All Colab and GEE scripts are provided in the Supplementary Materials for reproducibility [64,65].
(2) Remote sensing estimation model
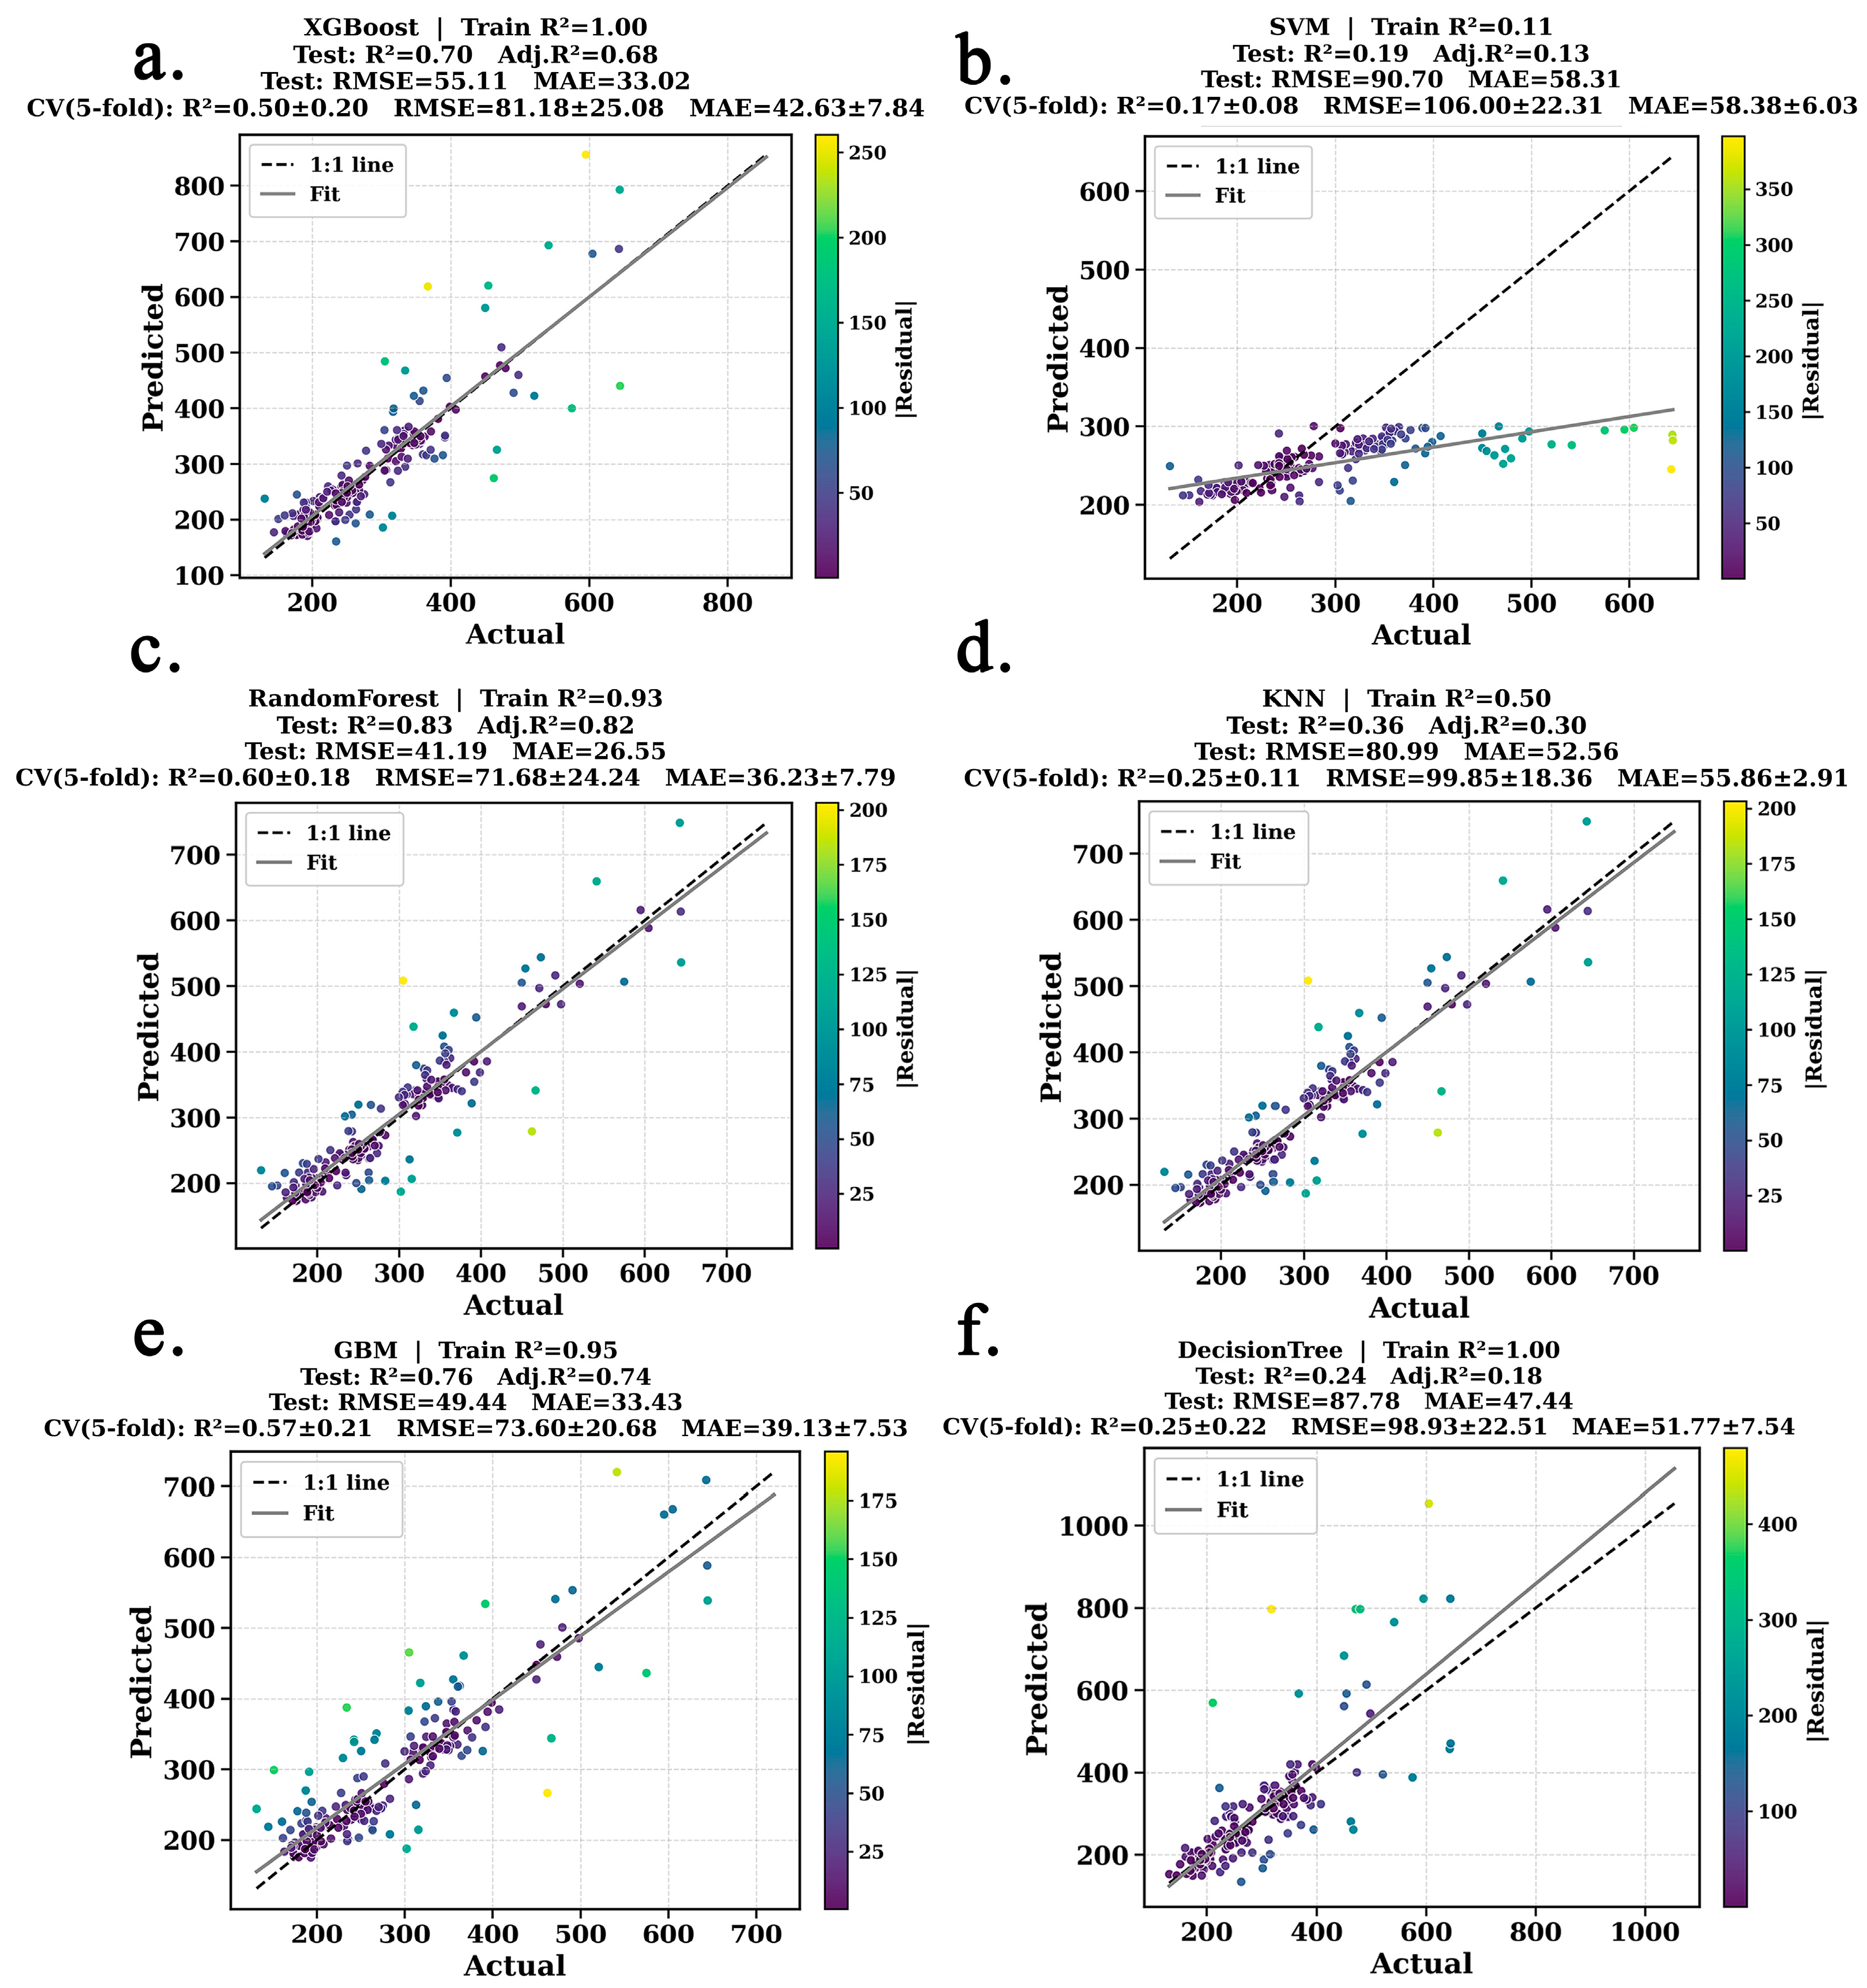
To achieve high-accuracy AGB modelling and prediction for JFLTLR, we used the remote sensing feature variables listed in Table S4 as predictors and field-measured AGB as the response variable. A multi-model comparison framework was implemented in Google Colab using six representative machine learning regression algorithms—XGBoost, RF, gradient boosting machine (GBM), support vector machine (SVM), k-nearest neighbor (KNN), and decision tree (DT). To prevent overfitting, RF was regularized by limiting tree depth and leaf size. XGBoost applied early stopping (100 rounds) with L2 regularization and subsampling, while GBM and DT were likewise constrained through early stopping and structural pruning. The model with the highest goodness-of-fit, as evaluated by coefficient of determination (R2), root mean square error (RMSE), adjusted R2, and mean absolute error (MAE), was subsequently selected for final prediction [66,67,68,69].
(3) Model accuracy evaluation
Among the tested algorithms, the model with the lowest cross-validated RMSE (Random Forest) was selected as the final model. It was trained using the 2023 field-measured AGB and corresponding remote-sensing predictors and subsequently applied to 2015, 2017, 2019, and 2021 using identical sampling locations and year-specific Sentinel-1/2 variables to ensure temporal comparability and minimize potential autocorrelation. Model performance for AGB prediction was evaluated based on the R2, RMSE, adjusted R2, and MAE [70]. Cross-year consistency tests further indicated high distributional similarity (JS ≤ 0.19) and stable AGB–HII structural relationships, confirming the model’s robustness and temporal generalization capability [71,72,73]. While R2 evaluates the proportion of variance explained by the model (ranging from 0 to 1, with higher values indicating a better fit), RMSE represents the mean discrepancy between predicted and observed values, with lower values reflecting improved predictive accuracy. Adjusted R2 penalizes model complexity relative to sample size, providing a more reliable estimate of explained variance. MAE captures the average magnitude of prediction errors in absolute terms [69,70]. The metrics are computed as follows:
R 2 = 1 i = 1 n ( y i y ^ i ) 2 i = 1 n ( y i y ¯ ) 2
Adjusted R 2 = 1 1 R 2 n 1 n p 1
R M S E = 1 n i = 1 n ( y i y ^ i ) 2
M A E = 1 n i = 1 n | y i y ^ i |
where y i denotes the actual observed value of the i t h sample; y ^ i represents the corresponding model-predicted value; y ¯ is the mean of all samples, and n is the sample size.

2.3.2. The Establishment of the HII Model

We constructed an HII model based on seven human disturbance factors for the matched annual AGB datasets spanning 2015–2023. The XGBoost algorithm was employed to quantify the relative contributions of each disturbance factor to the spatial variability of AGB, and the feature importance scores were used to determine the weights wi of the HII, thereby assessing the relative explanatory power of each factor for interannual AGB variations [74]. All the factor raster datasets were subsequently standardized using Z-scores to eliminate dimensional differences and unify numerical ranges [75]. The HII was calculated as follows:
H I I ( x ,   y ) = i = 1 n w i Z i ( x , y )
where HII (x, y) represents the HII value at pixel (x, y); Zi (x, y) denotes the standardized value of the i t h factor; wi is the weight of that factor as derived from XGBoost; and n is the total number of variables considered.

2.3.3. Mann–Kendall of AGB and HII

To analyze the spatiotemporal variations of AGB and HII between 2015 and 2023, we conducted a trend analysis based on five temporal phases of AGB and HII. The non-parametric Mann–Kendall (MK) was applied to identify overall trends and evaluate their statistical significance [76,77]. The test statistic S and the standardized statistic Z are defined as follows:
S = i = 1 n 1 j = i + 1 n s g n x j x i
where x j and x i represent the j t h and i t h elements in the time series, and n denotes the length of the time series.
s g n ( x ) = 1 , x > 0 0 , x = 0 1 , x < 0
Under the null hypothesis (no trend), the mathematical expectation of S is 0, and its variance is calculated as:
V a r ( S ) = n ( n 1 ) ( 2 n + 5 ) 18
Based on the above statistics, the standardized test statistic Z is defined as follows:
Z = S 1 V a r ( S ) , S > 0 0 , S = 0 S + 1 V a r ( S ) , S < 0
where S denotes the test statistic and Z is the standardized statistic. A pixel is considered to exhibit a significant upward or downward trend when Z > Z 1 α / 2 (α = 0.05). The sign of Z indicates the direction of the trend: positive values denote an increasing trend, while negative values denote a decreasing trend. At the 5% significance level, a trend is considered significant when Z > 1.96 .
Finally, the corresponding significance probability (p-value) is further calculated from the Z value as follows:
p = 2 ( 1 Φ ( | Z | ) )
where Φ represents the cumulative distribution function (CDF) of the standard normal distribution. The p-value indicates the statistical significance of the trend; when p < 0.05, the trend is considered significant at the 95% confidence level, and smaller p-values indicate stronger statistical significance of the trend.

2.3.4. Spatial Autocorrelation Analysis Between AGB and HII

Based on five phases of standardized AGB and HII, spatial autocorrelation analysis was performed to assess the spatial coupling between AGB and HII. The bivariate global Moran’s I statistic was derived based on a Queen contiguity weight matrix at a 500 m grid resolution [78]:
M o r a n s   I = n S 0 i j w ¯ i j x i x ¯ y j y ¯ i ( x i x ¯ ) 2 ¯ j y ¯ j y ¯ 2
where x i and y j represent the HII and AGB values at pixels i and j, respectively, and w i j denotes the spatial weight [75]. Local bivariate LISA was then used to identify significant spatial clustering patterns, which can be expressed as:
I i = ( x i x ¯ ) j w ¯ i j y j y ¯
Four clustering types—high-high (H-H), low-low (L-L), high-low (H-L), and low-high (L-H)—were identified, and their significance was assessed via permutation tests [79].

2.3.5. Construction of the Partial Least Squares Structural Equation Modeling (PLS-SEM) of Anthropogenic Factors

In this study, a Partial Least Squares Structural Equation Modeling (PLS-SEM) was constructed with five temporal phases of AGB as endogenous variables and seven categories of human disturbance factors as exogenous predictors, to quantify the direct and indirect effects of these factors on AGB dynamics [80]. All variables were expressed as regional means derived from the five phases of raster data and were standardized using the Z-score method for comparability. The PLS-SEM was specified as a single-layer direct path model [81], which can be formally expressed as follows:
A G B = i = 1 n β i X i + ε
where X i represents the ith human disturbance factor; β i denotes its path coefficient; and ε is the model error term. The model was implemented in Google Colab using the partial least squares algorithm, and its evaluation was conducted using metrics such as the coefficient of determination (R2), the adjusted R2, and a pseudo-goodness-of-fit (GOF*) statistic [82].

3. Results

3.1. AGB Model Based on Vote-Based Variable Screening

Using six cross-validated methods for variable importance evaluation (Spearman, LASSO, RF, BRT, Forward Step, and RDA), 15 key factors with the highest explanatory power for AGB variation were identified (Figures S1 and S2, Figure 3, Tables S2 and S4). Vegetation indices such as the Enhanced Vegetation Index (EVI), Ratio Vegetation Index (RVI), and Normalized Difference Vegetation Index (NDVI) showed the strongest correlations with AGB, highlighting that canopy greenness and photosynthetic activity are the primary biological drivers of biomass accumulation. Radar-derived variables (e.g., VV_Correlation_2, VV_stdDev) complemented optical indices by capturing canopy structure under dense forest conditions, while texture metrics (B12_Homogeneity_1, B2_Contrast_2, B2_Dissimilarity_2) reflected the regulatory role of forest patch heterogeneity in shaping biomass patterns. Topographic factors such as elevation, slope, and aspect influenced AGB by affecting microclimate, soil moisture, and vegetation distribution, with high-elevation cores generally preserving intact forests and low-lying areas more exposed to human disturbance. Overall, this multi-source feature set demonstrates that AGB variation in JFLTLR is jointly regulated by vegetation vigor, structural heterogeneity, and topographic gradients, thereby linking technical predictors with clear ecological interpretations.
The predictive performance of the AGB estimation models varied significantly. Among them, the RF model performed best (adjusted R2 = 0.82, RMSE = 41.18 mg·ha−1), achieving both high accuracy and stability. GBM ranked second (adjusted R2 = 0.74, RMSE = 49.44 mg·ha−1). Although XGBoost showed a good fit on the training set (adjusted R2 = 0.68), its validation performance was poor, indicating overfitting. SVM and KNN exhibited weaker predictive capabilities. Notably, the DT model achieved an R2 of 1 on the training set but dropped to 0.24 on the validation set, with an RMSE of 87.78 mg·ha−1, reflecting its limited robustness for high-dimensional feature modeling. Considering accuracy, stability, and generalization, RF was identified as the optimal approach for AGB inversion in the JFLTLR (Figure 4 and Figure S3).

3.2. Spatiotemporal Estimation and Dynamic Analysis of AGB

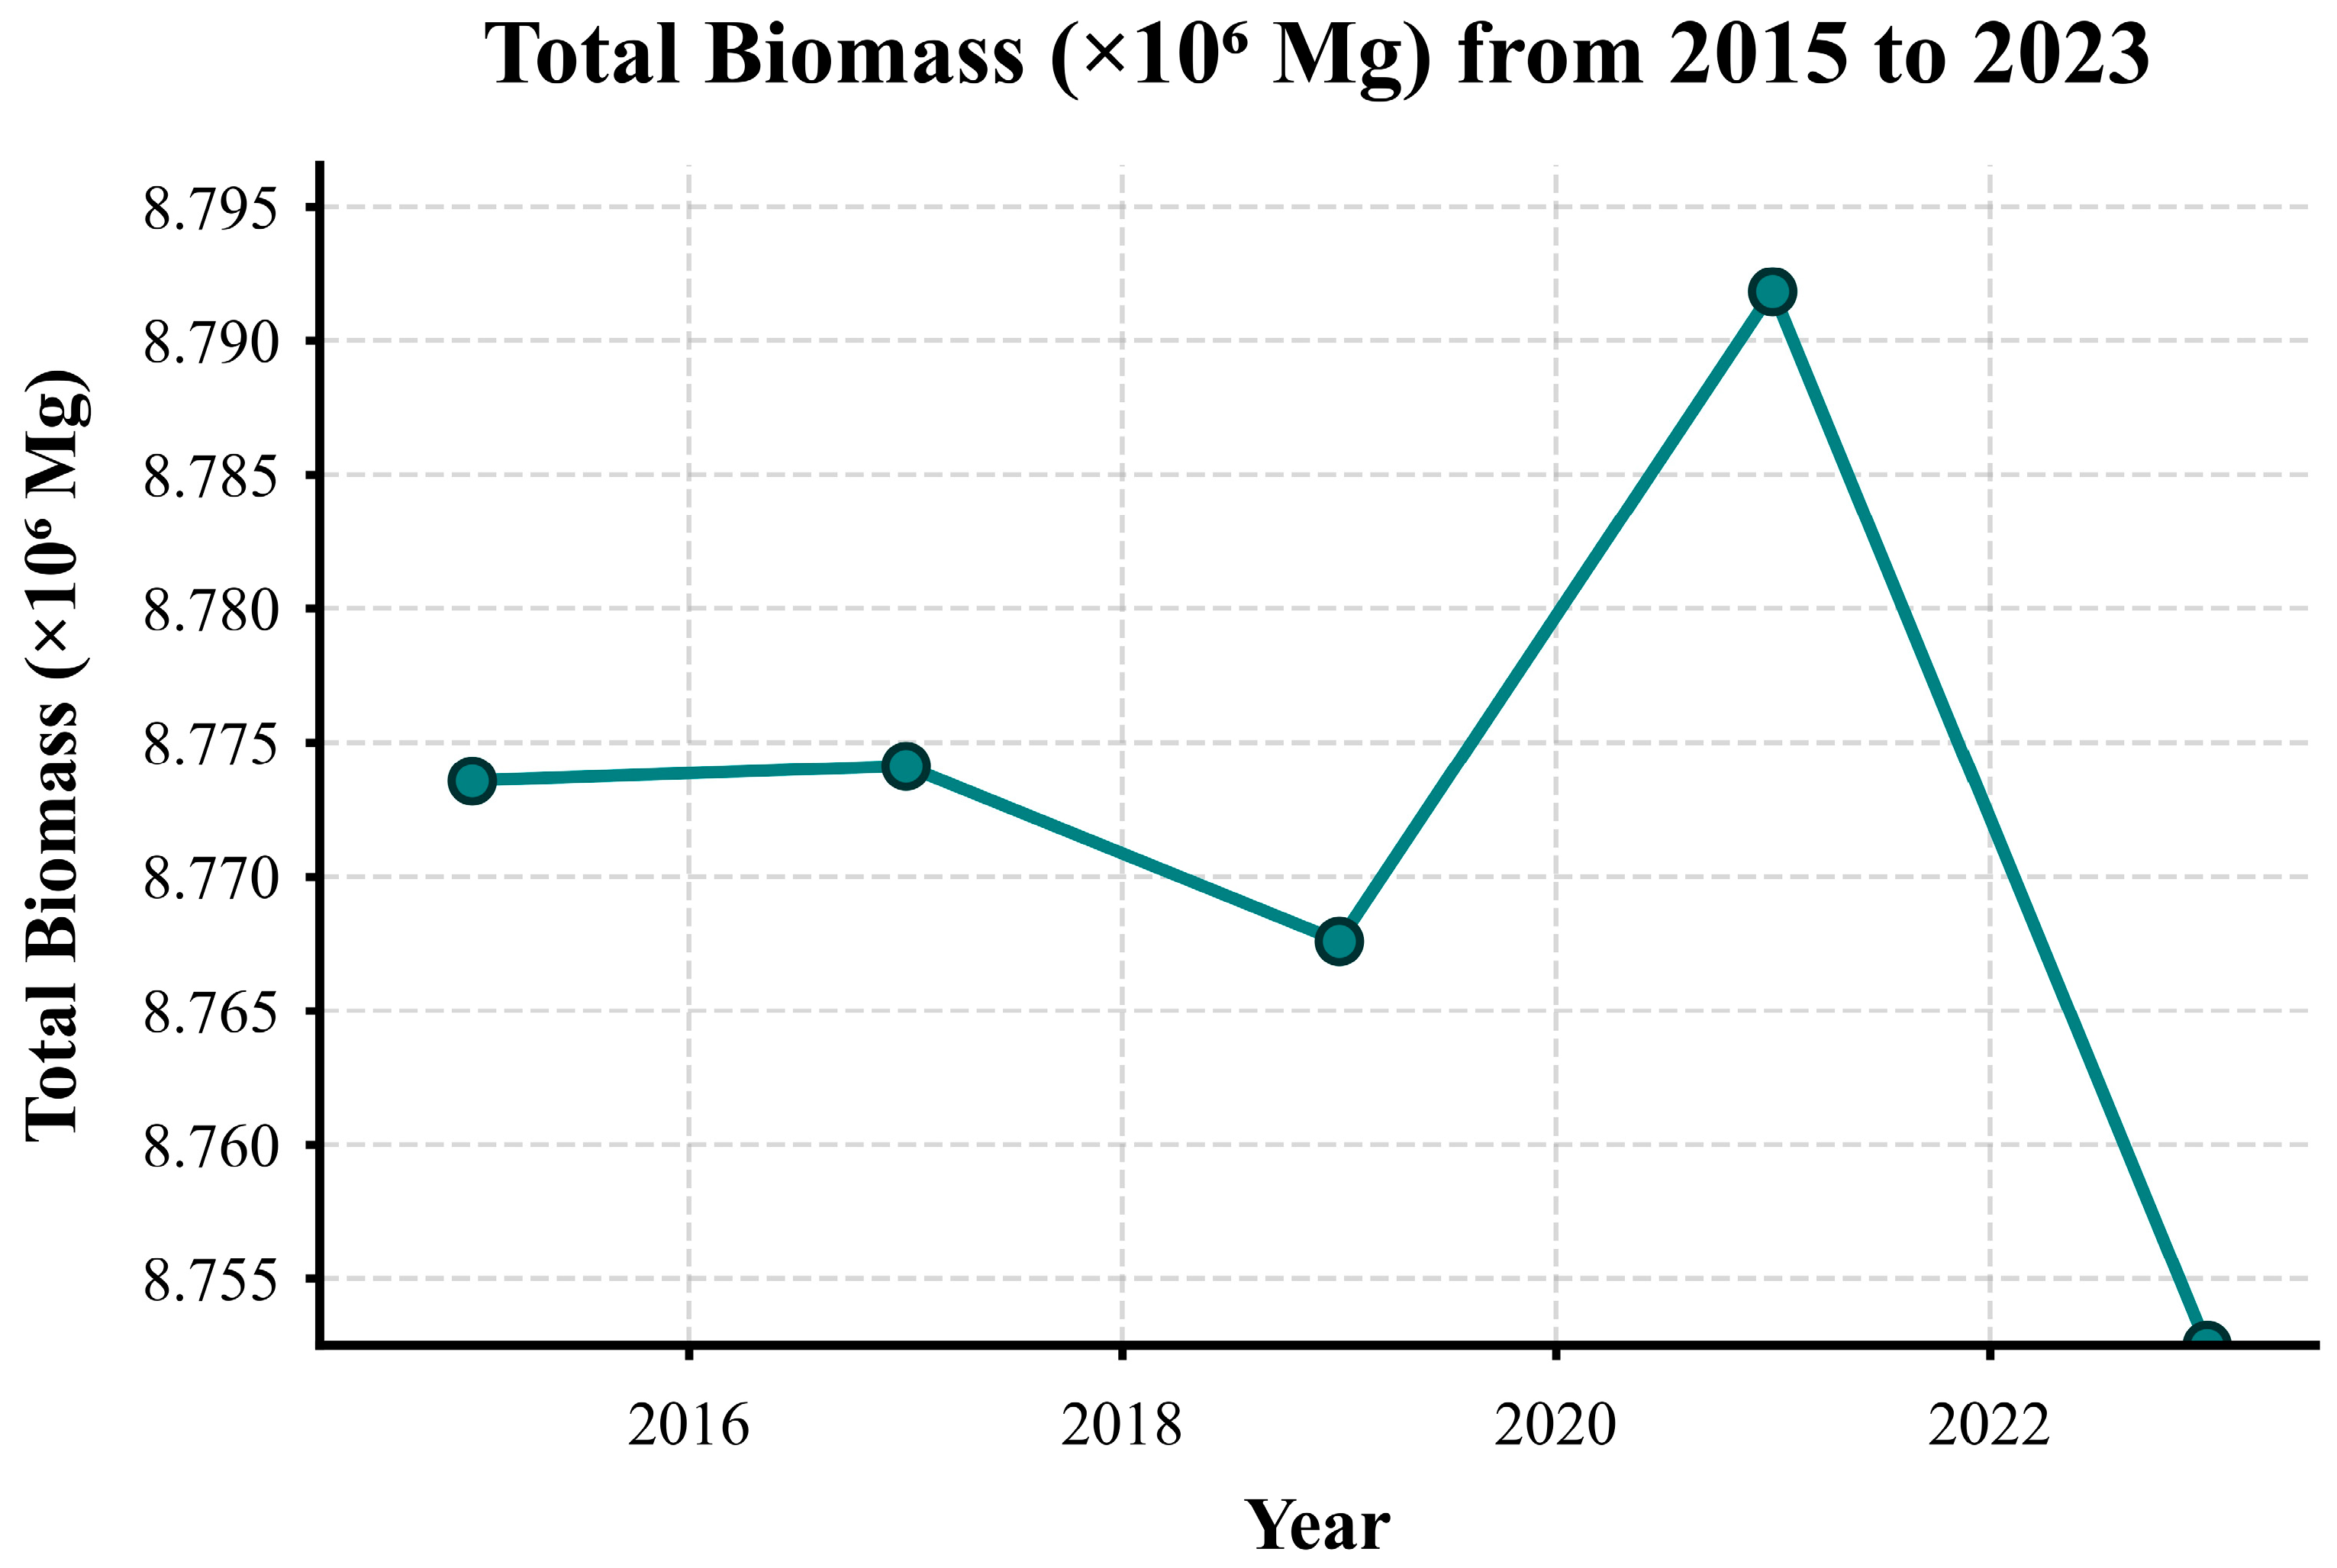
Between 2015 and 2023, the overall AGB pattern in the JFLTLR remained largely stable. AGB peaked in 2021 (8.7918 × 10⁶ mg) and declined to its lowest value in 2023 (8.7525 × 10⁶ mg). Spatially, AGB exhibited marked heterogeneity, characterized by high biomass in mountain areas at middle to high elevations and low biomass in peripheral lowlands (Figure 5 and Figure S4). High AGB was primarily concentrated in mid- to high-elevation mountain zones, where complex terrain and limited human activity have preserved intact forest structures and well-developed secondary forests. In contrast, low AGB was concentrated in low-lying peripheries near settlements and orchards, areas characterized by intensive human disturbance, vegetation fragmentation, and simplified forest structures. Monoculture plantations of betel nut, rubber, and eucalyptus, managed under extensive practices, have further accelerated AGB decline, intensifying spatial gradients in regional carbon sink capacity. Overall, AGB in the JFLTLR follows a spatial pattern of “stable central high-elevation cores and fragile peripheries.” The mountainous core areas exhibit strong ecological resilience and high carbon sink capacity, while the peripheral lowlands face greater cumulative disturbance and degradation risks, characterized by pronounced forest fragmentation and heightened sensitivity to anthropogenic impacts. Although total AGB varied only modestly (~1%), likely reflecting interannual climate fluctuations, the spatial contrast between stable high-elevation cores and disturbed peripheries underscores the continued influence of human activities and land-use practices on forest biomass.

3.3. The Construction of HII and the Recognition of Temporal Patterns

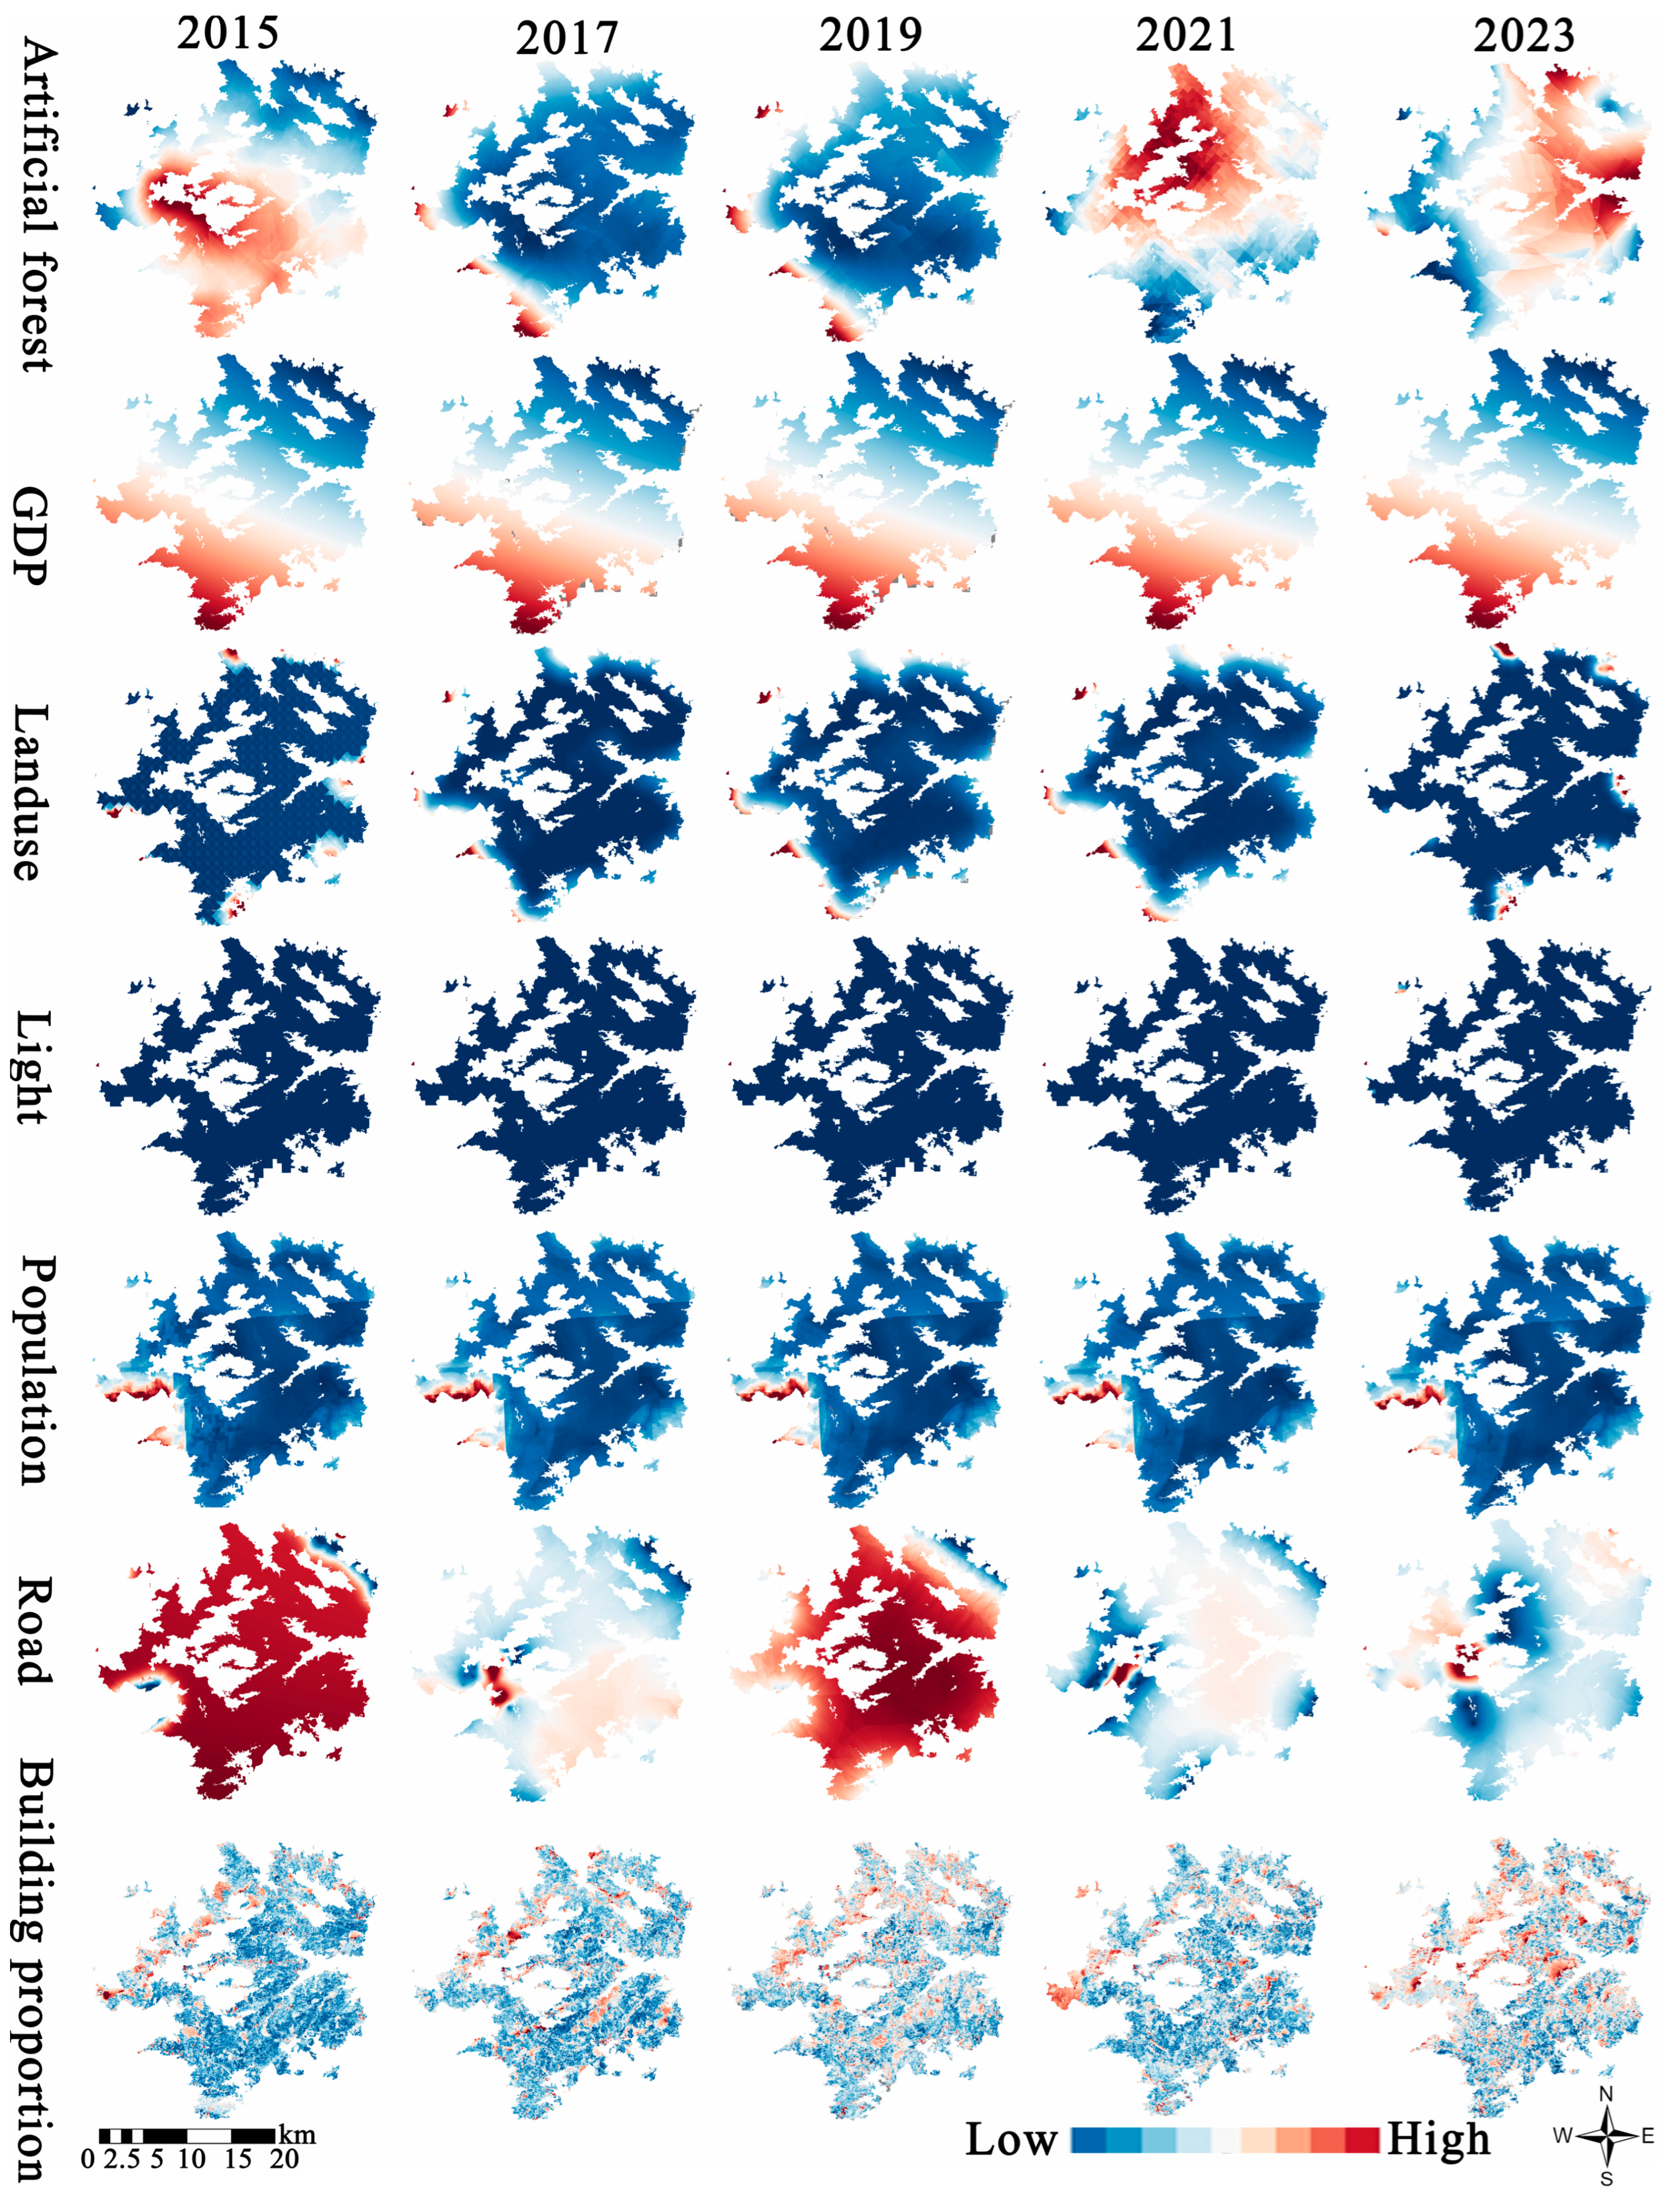
The spatial patterns of the seven human disturbance factors in the JFLTLR exhibited marked temporal evolution (Figure 6). Artificial forest, initially concentrated in high-value zones in the south in 2015, expanded northwestward from 2017 to 2019 and shifted northeast from 2021 to 2023, with local coverage increasing to 40%–50%, reflecting ongoing afforestation projects. GDP maintained a persistent “high in the south, low in the north” gradient, with the southwestern economic core consistently reaching 40%–50%. Road development intensity followed a “rise–then–fall” pattern, with high values in 2015, a sharp decline and expansion of low-value areas in 2017, a peak in the central and southern areas in 2019 (around 75%), and a slight decrease between 2021 and 2023, as accessibility in core areas stabilized. This reflects an expected trend of initial expansion followed by stabilization. Land-use change, strongly correlated with road development, continued to increase, highlighting the dominant influence of transportation infrastructure on land-use dynamics. In contrast, building proportion, nighttime light index, and population density showed comparatively minor temporal fluctuations.
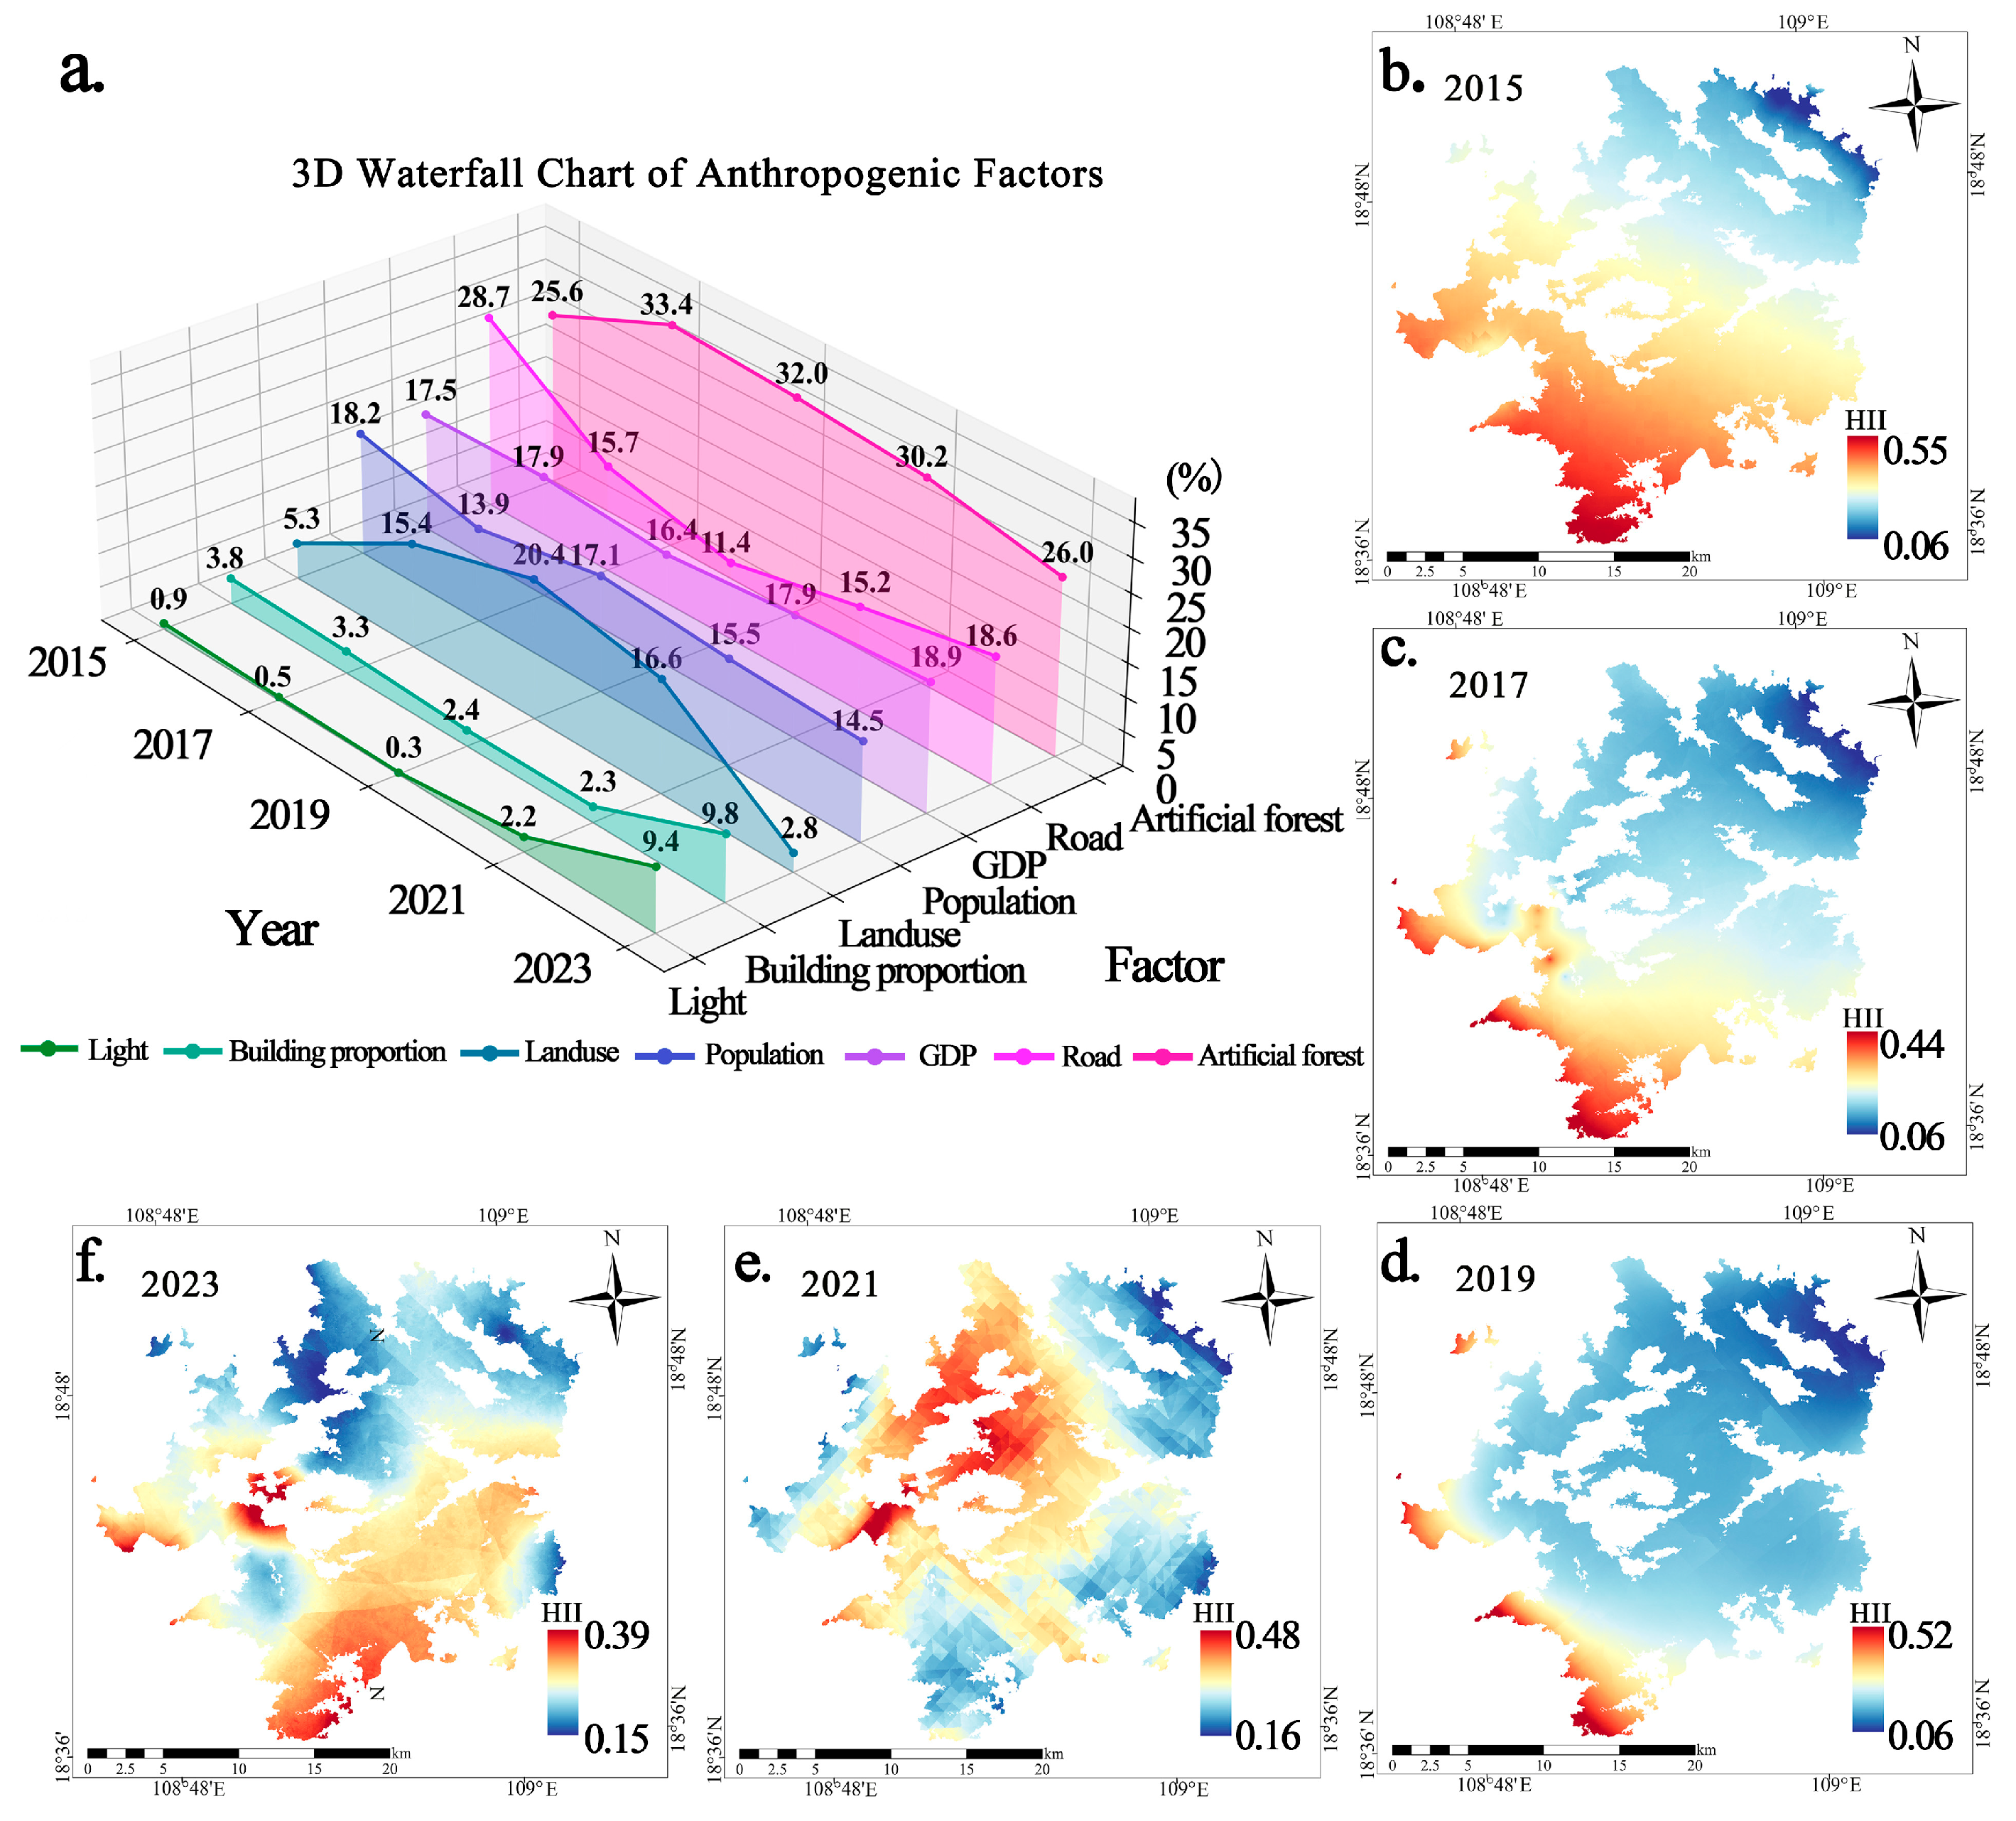
HII in the JFLTLR exhibited a temporal pattern of “phased intensification-temporary mitigation-peripheral expansion,” accompanied by pronounced spatial heterogeneity (Figure 7b–f). Southern areas, the southwestern plains, and regions near transportation hubs consistently showed high HII (0.39–0.55). Due to flat terrain and high accessibility, these areas remain highly vulnerable to development pressures, accelerating forest conversion into secondary forests, shrublands, and grasslands. In contrast, northern and mid-to-high-elevation zones displayed relatively low HII (0.06–0.15), where topographic constraints limit human activity, thereby preserving forest integrity and maintaining stable ecological functions. Notably, between 2021 and 2023, new high HII clusters emerged along central and northern boundaries, indicating that human disturbances are encroaching from lowlands toward higher elevations and the ecological boundaries of core protected areas, posing a potential threat to regional carbon sink stability. Addressing this risk requires strengthened boundary control and sustainable forest management to enhance carbon sequestration and ecosystem resilience. Among the disturbance factors, road development intensity and plantation extent were the dominant drivers of AGB variation, with early contributions exceeding 25%. Artificial forest cover peaked at 33.4%, signifying the roles of infrastructure expansion and artificial vegetation growth as the dominant forces behind intensified disturbance. Land use change rose sharply to 20.4% between 2017 and 2019, reflecting frequent land-use conversions likely driven by concentrated development or large-scale economic plantations of fast-growing timber species (Figure 7a). By contrast, Population and GDP maintained contributions of 15%–20%, indicating a stable, background regulatory role rather than a direct driver of AGB change. Light and Building proportion consistently remained below 10% with limited temporal variation, suggesting that socioeconomic activity and urban expansion exert weak direct effects, primarily expressed as gradual peripheral penetration. These findings were further confirmed through the Shapley additive exPlanations (SHAP) based interpretability analysis (Figure S5), which enhanced the reliability of the weight-derived results.

3.4. Analysis of the Changing Trends Between AGB and HII

Significance analysis revealed that most pixel-level Z-values of AGB change in the central and mid- to high-elevation forested areas of JFLTLR ranged between 0.0000 and +1.9600, with corresponding p-values generally exceeding 0.0500 (Figure S6a). Although AGB showed a slight upward trend, the change was not statistically significant, indicating that forest structures in these areas remain stable, minimally disturbed, and continue to function as carbon sinks. In contrast, low-elevation peripheral zones exhibited a significant decline in AGB, with minimum Z-values around −1.7900 and most p-values below 0.0500. This decline is driven by edge effects and human disturbances, which have simplified forest structures, increased ecosystem vulnerability, and heightened the risk of carbon sink loss or even a shift to a carbon source. HII changes displayed pronounced spatial heterogeneity. In the northeastern peripheral zones, HII Z-values rose sharply (up to +2.2000), with significant p-values around 0.0300, indicating that human disturbances are gradually expanding toward the ecological boundaries of intact forest. This trend is largely attributed to construction land spillovers and the expansion of major transportation corridors. Conversely, in the central and southwestern forested zones, HII Z-values were negative (as low as −1.7100), with most p-values above 0.0500, suggesting that human activities within the central protected areas remain limited and disturbance intensity is stable or slightly alleviated (Figure S6b). These Z and p values represent pixel-level statistics derived from raster-based Mann–Kendall trend analysis rather than single aggregated metrics.
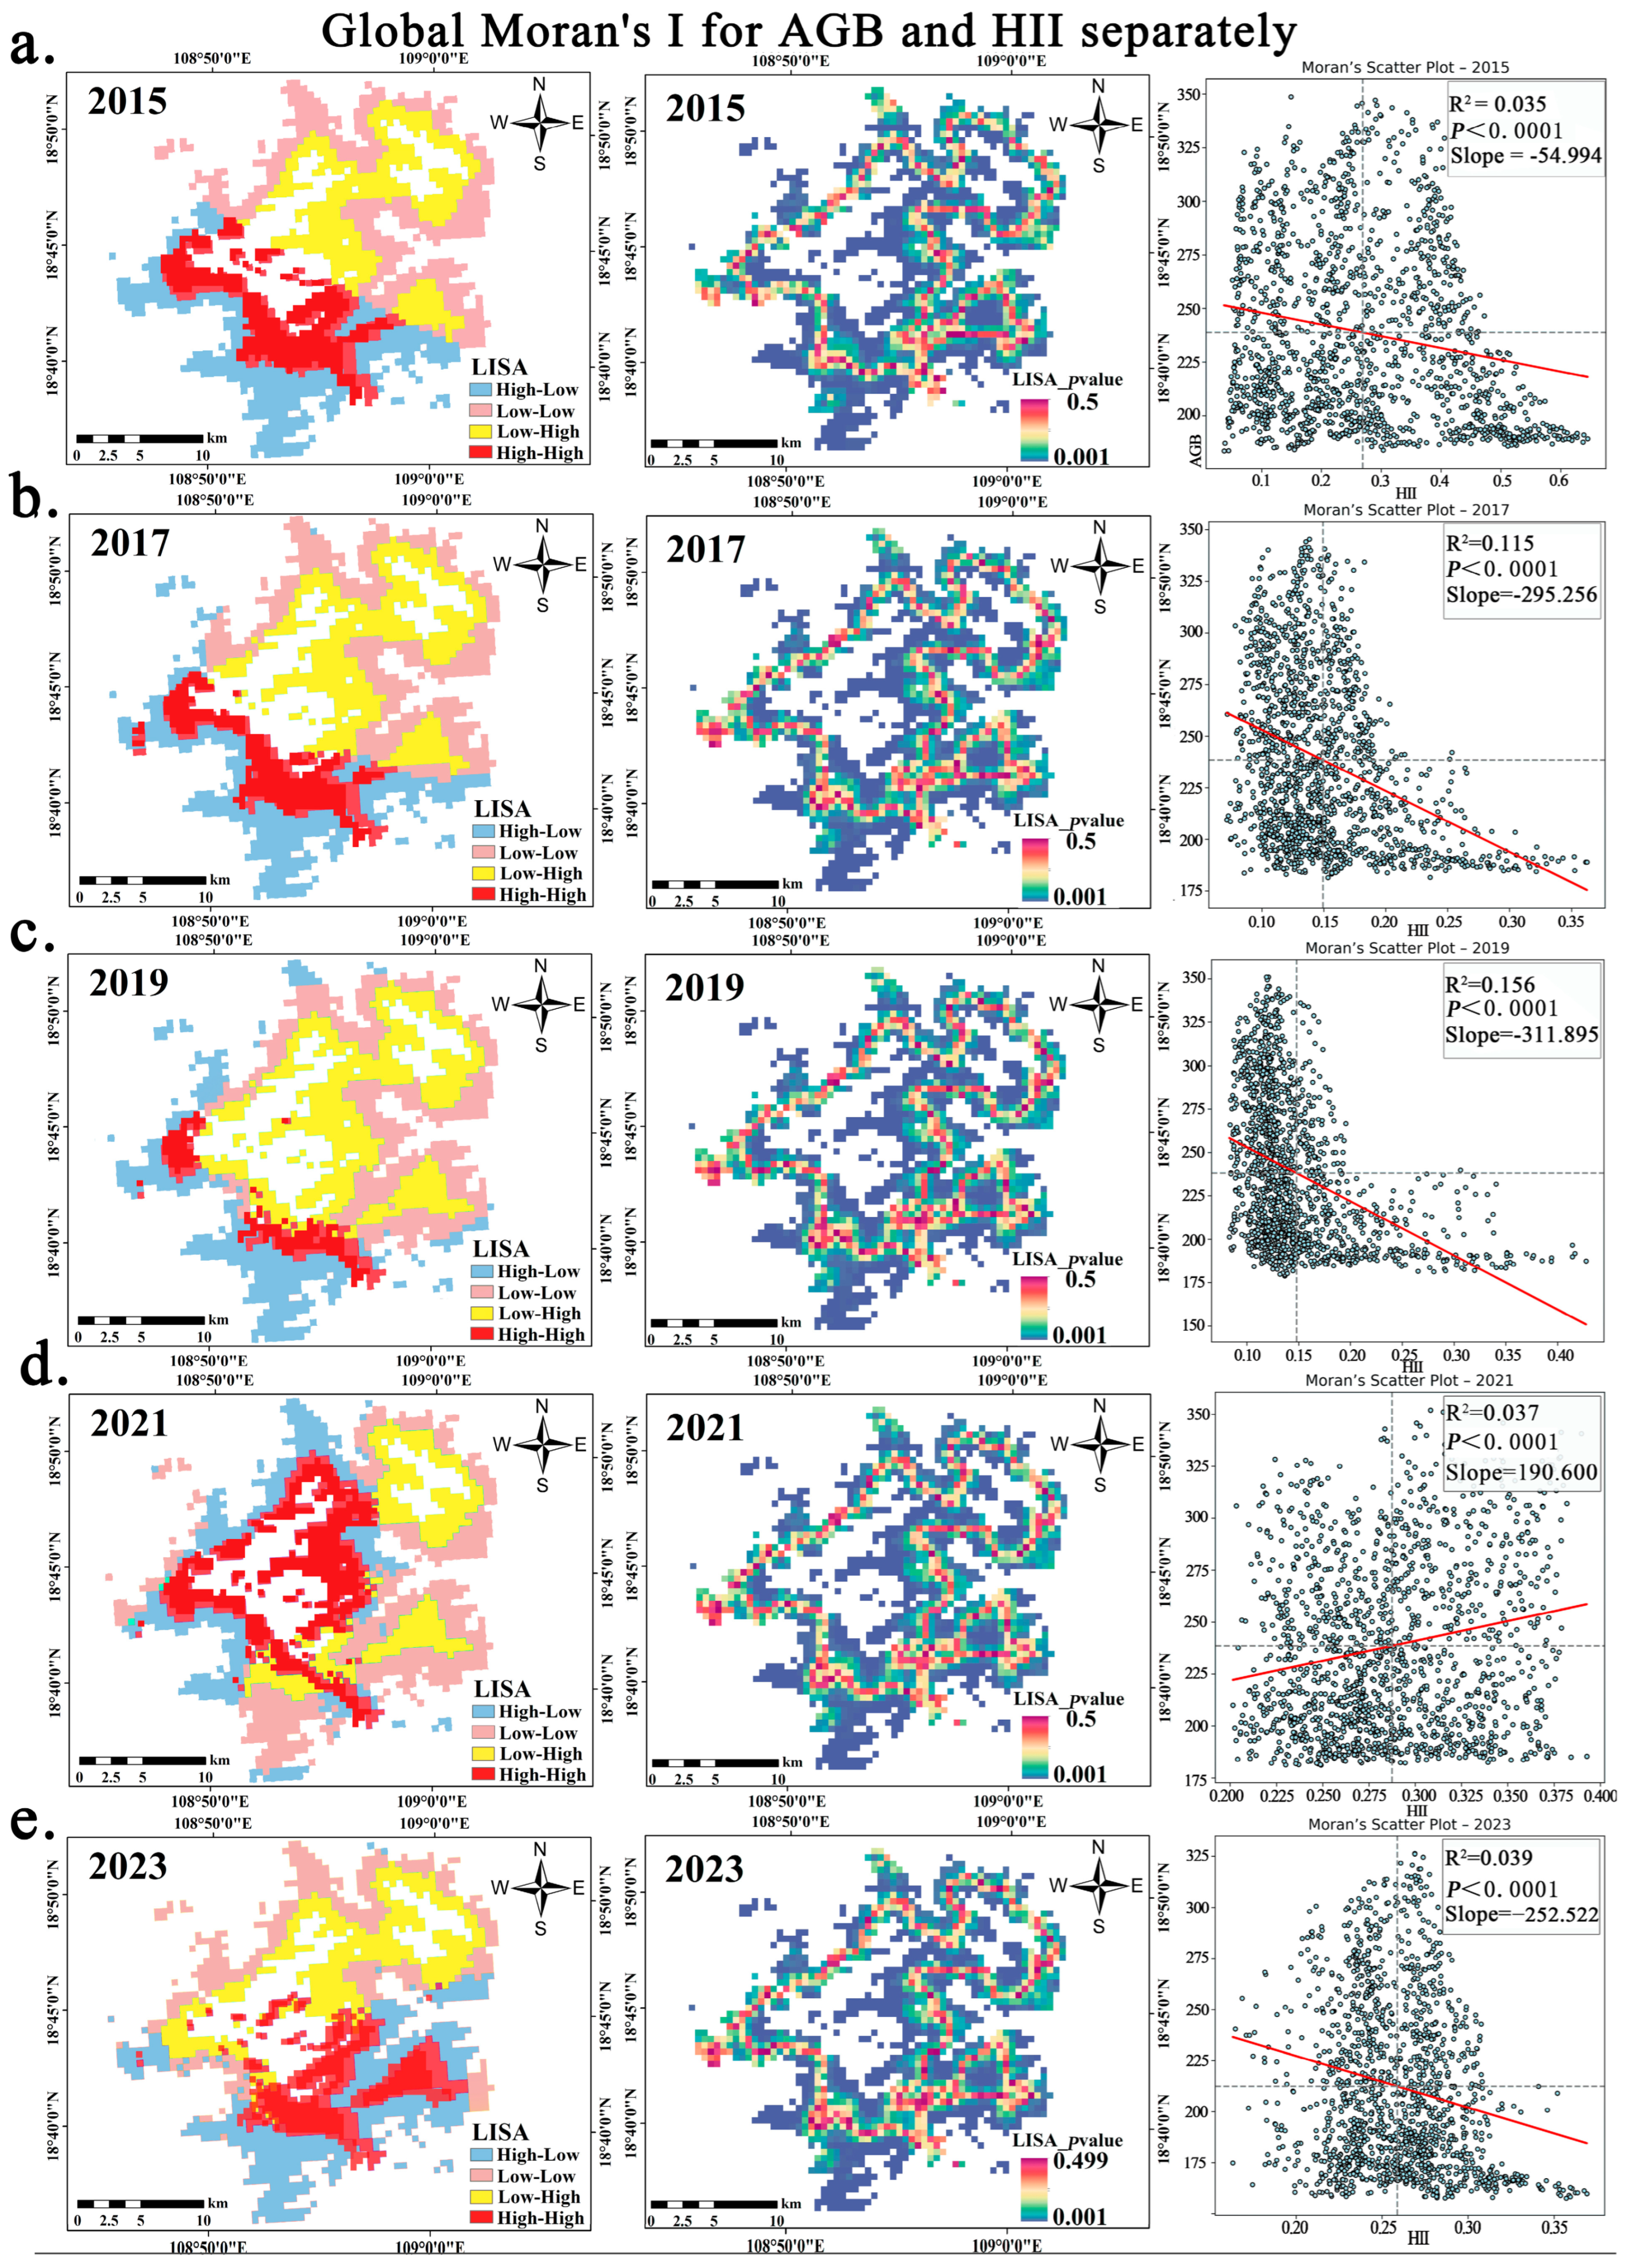
From 2015 to 2023, AGB and HII were significantly negatively correlated in the JFLTLR, displaying a spatial pattern of gradual AGB increase in the center and persistent disturbances at the periphery (Table 1). LISA analysis further revealed that H–H clusters (high HII–high AGB) were mainly distributed in localized core areas, showing gradual stabilization under conservation measures. Meanwhile, L–H clusters (low HII–high AGB) in central regions continued to expand and remain stable, whereas H–L clusters (high HII–low AGB) on the periphery experienced initial contraction followed by renewed expansion, and L–L clusters (low HII–low AGB) persisted along the degraded edges (Figure 8a–e). Disturbance has progressively encroached from northeastern mountain edges and southern slopes into the central protected zones, with cluster expansion intensifying again by 2023. Notably, a positive correlation was detected only in 2021 (Moran’s I = 0.1455), whereas significant negative correlations (p < 0.0001) were observed in all other years, suggesting that AGB recovery in 2021 was temporary. The strongest negative spatial coupling occurred in 2019 (Moran’s I = −0.2976).

3.5. Breakpoints and Segmented Responses in the ΔHII–ΔAGB Relationship

Using same-pixel adjacent-period differences (ΔHII, ΔAGB) with HII min–max normalized to [0, 1] across 2015–2023, a piecewise regression of ΔAGB on ΔHII identified a threshold at ΔHII of approximately 0.171 (Figure 9a): below this level, the marginal effect was small (−0.025 mg·ha−1 per 0.01 ΔHII), whereas at or above it AGB declined sharply (−2.65 mg·ha−1 per 0.01 ΔHII), consistent with Moran’s I clusters of high ΔHII and negative ΔAGB. This pattern shows that JFLTLR can tolerate small increases in human disturbance when ΔHII remains below ~0.171, with only minor biomass changes. Once this threshold is crossed, AGB declines steeply (≈ −2.65 mg·ha−1 per 0.01 ΔHII), reflecting a highly sensitive nonlinear response. The spatial overlap of high ΔHII and negative ΔAGB clusters highlights edge degradation and fragmentation as dominant processes beyond the threshold. Thus, ΔHII ≈ 0.171 can be regarded as a critical ecological tipping point for maintaining biomass stability.

3.6. Construction of PLS-SEM of Anthropogenic Factors

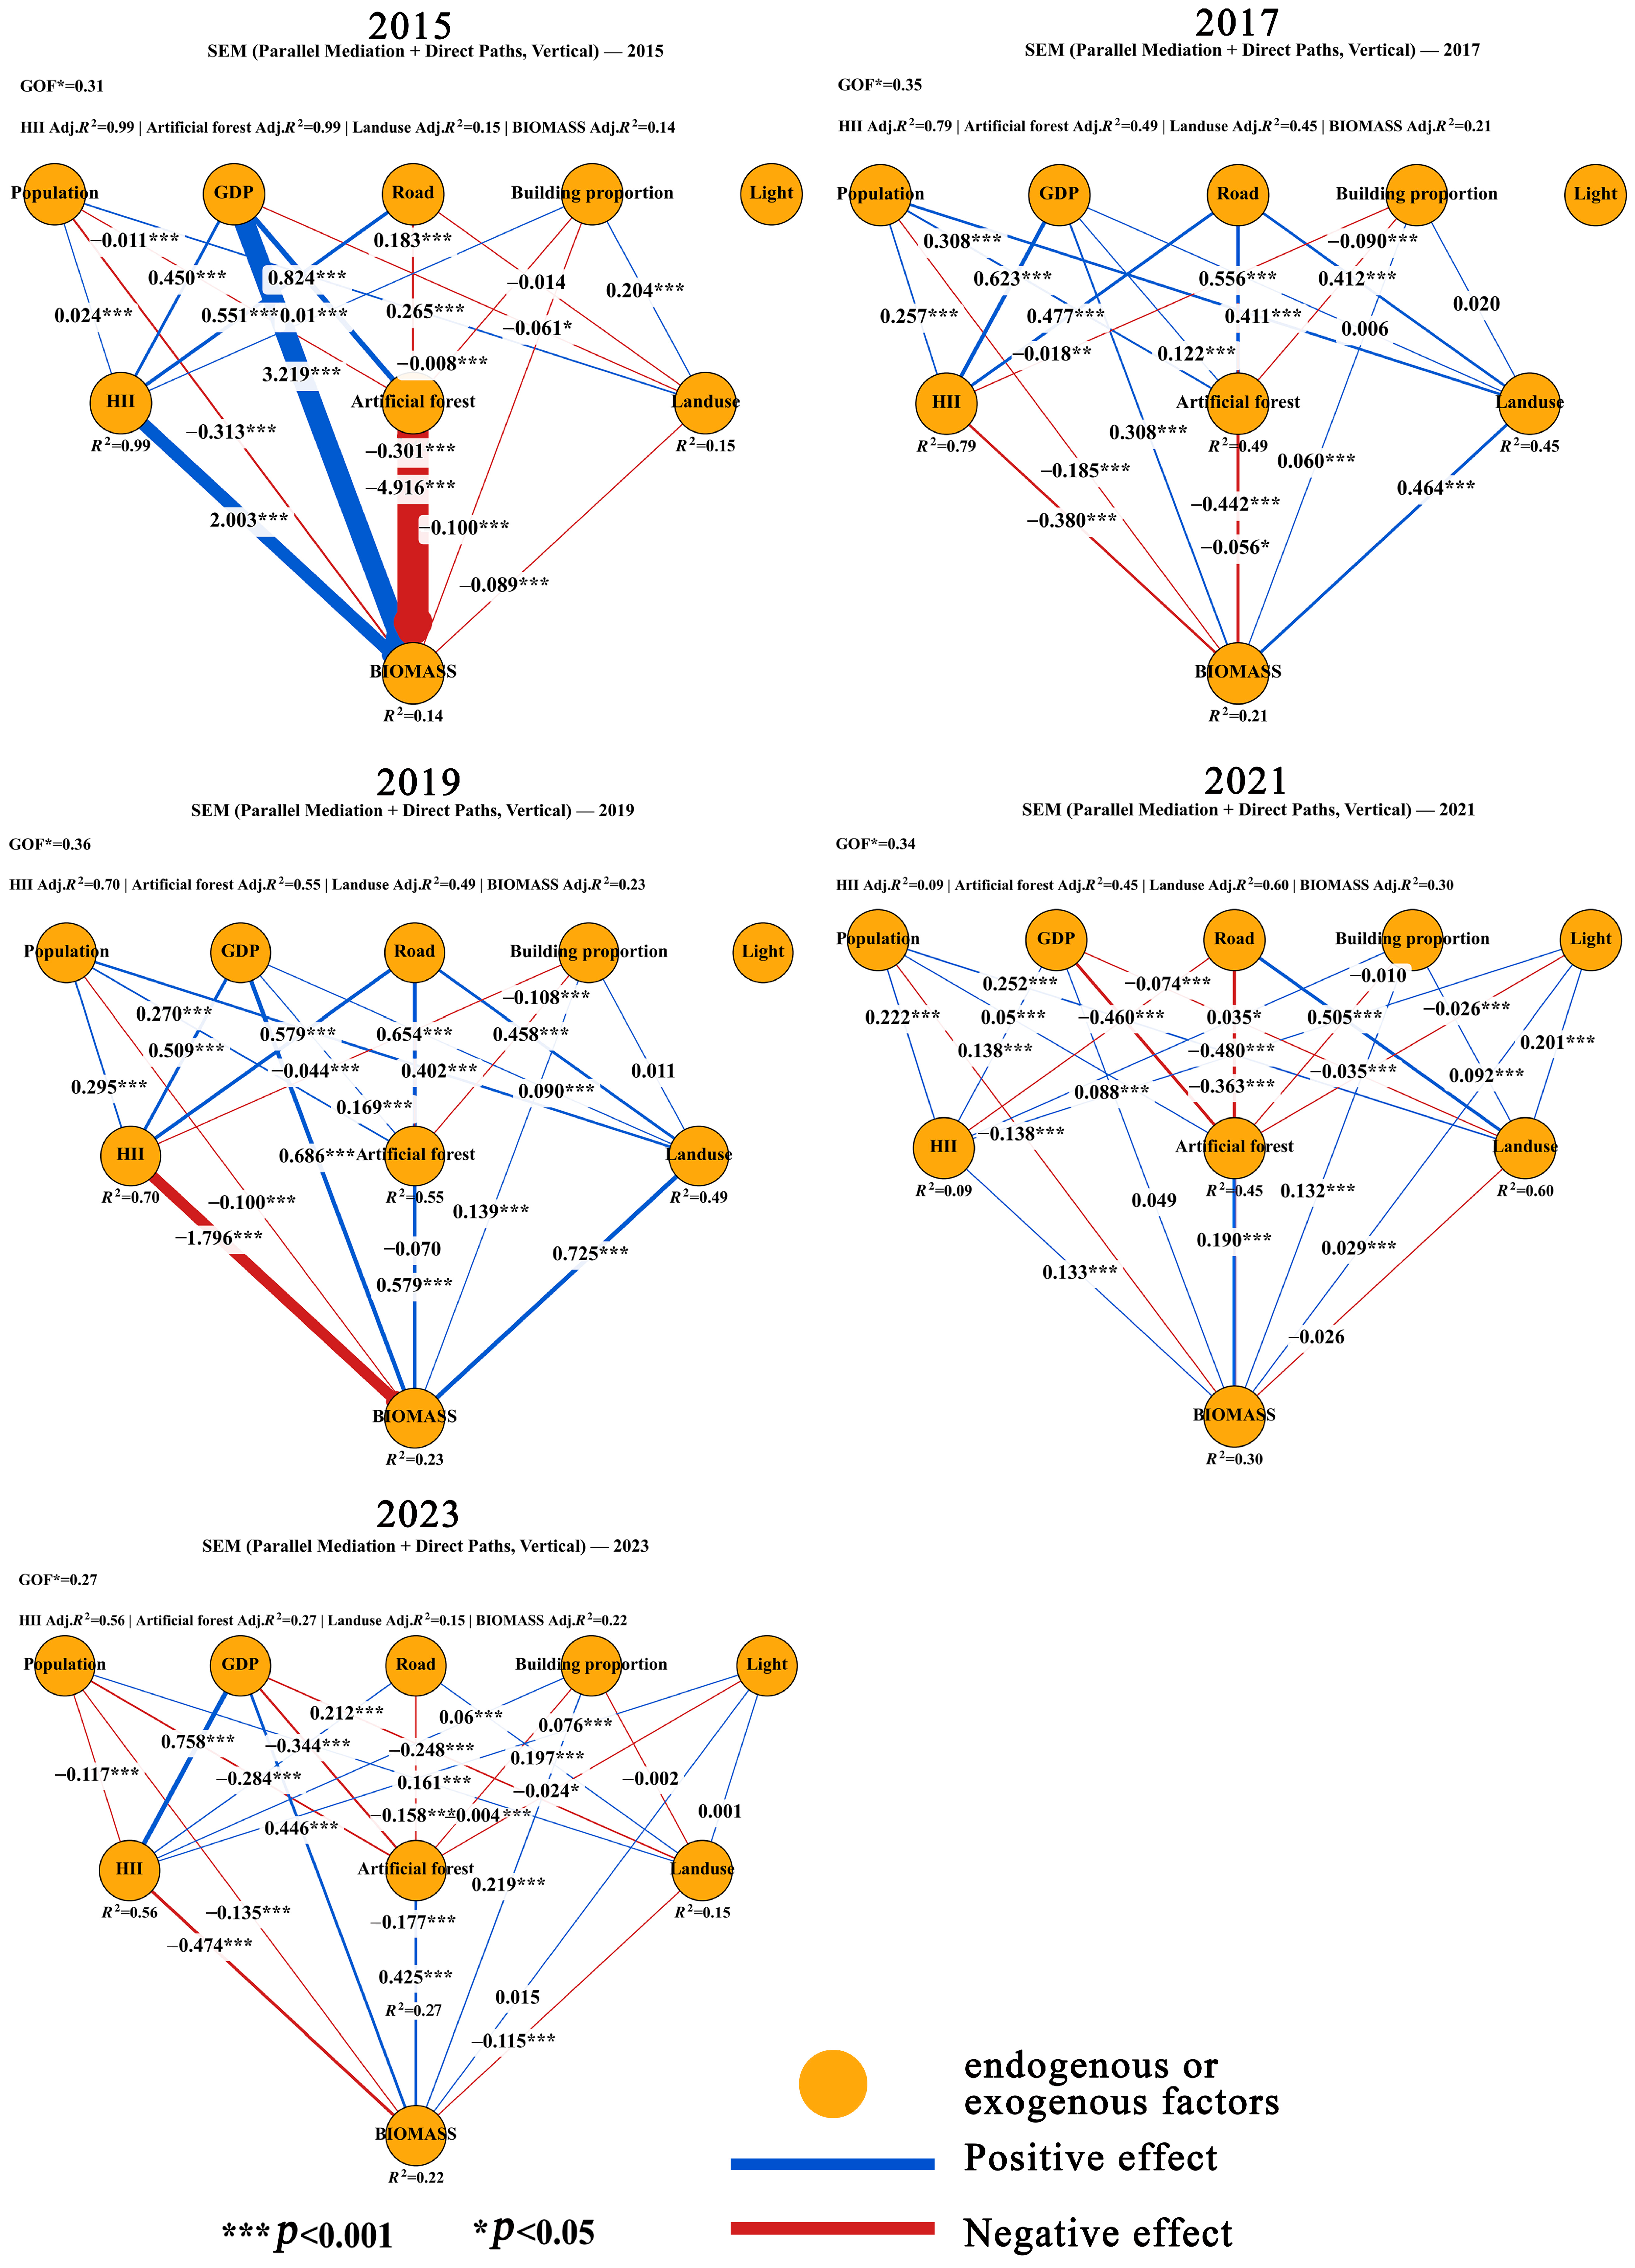
From 2015 to 2023, the GOF* of the PLS-SEM model and the adjusted R2 of endogenous variables were approximately 0.30, indicating moderate explanatory power. Path directions were consistent across years, supporting structural validity. Direct paths to AGB were formed by HII, Artificial forest, and Landuse, whereas Population, GDP, Road, and Light acted upstream as latent drivers via HII. AGB responses to human disturbance in JFLTLR unfolded in four stages (Figure 10 and Figure S7):
Disturbance-dominant phase (2015): Artificial forest exerted the strongest direct inhibition on AGB (−4.916), reinforced by population (−0.1) growth and road expansion (−0.089). At the same time, GDP amplified indirect disturbance through its influence on artificial forest, producing a pattern of compounded pressure and marked biomass decline (0.824).
Phase of synergistic transition (2017–2019): road density became the main direct suppressor of AGB (−0.056 to −0.070), while the role of artificial forest weakened and even shifted to a temporary positive effect in 2019. Indirect pressures from GDP (0.622 in 2017, 0.668 in 2019) and population peaked during this period (0.258 in 2017, 0.295 in 2019), marking a stage of “persistent direct inhibition combined with rising indirect stress.”
Disturbance mitigation (2021): direct inhibitory effects from road (−0.026) and land use (−0.026) remained, but indirect pathways via HII weakened substantially. Building proportion contributed a small positive effect (0.029). Overall, the system showed signs of disturbance alleviation and partial recovery, consistent with ecological protection policies.
Phase of ecological support accumulation (2023): road continued as the principal direct inhibitor (−0.225), but the strength of negative drivers eased overall. Indirect pathways through GDP (0.758) and Light (0.001) became weakly positive, while population (−0.117) exerted only a minor negative effect. This stage reflects a gradual weakening of disturbance dominance and the slow accumulation of ecological support.

4. Discussion

4.1. Disturbance Responses and Edge Effects in AGB Spatial Patterns

HII was constructed from population density, land-use intensity, and road development to characterize anthropogenic pressure on regional AGB. Potential impact pathways were quantified using PLS-SEM. Mann–Kendall trend tests and spatial autocorrelation analyses showed a significant negative association between HII and AGB, with pronounced spatial differentiation across disturbance gradients, strongest in low-elevation marginal zones of JFLTLR. At low elevations, native evergreen broadleaf forests dominated by Schima superba, Cryptocarya chinensis, and Cratoxylum cochinchinense have been progressively converted, under slash-and-burn agriculture, commercial logging, and urbanization, into secondary evergreen broadleaf stands, shrublands, and grasslands; in some areas, they have been replaced by monoculture plantations of Hevea brasiliensis, Eucalyptus globulus, and Acacia. These transitions markedly altered forest structure and composition and reduced biomass density relative to primary forests. The results corroborate prior evidence reported by Wang et al. [83,84,85]. Concurrently, the opening of tourist roads in Hainan Tropical Rainforest National Park and the rapid expansion of ecotourism increased accessibility across the study area. This amplified roadside edge effects and human disturbance, promoting highly fragmented linear patches and indirectly accelerating the decline of regional AGB [86,87]. In contrast, AGB in the high elevation core remained stable and even increased, owing to topographic shielding and strict park protection policies that preserved forest structural integrity. Overall, from 2015 to 2023, the AGB spatial pattern shifted toward steady growth in the central core, whereas along the margins, patches with low AGB and strong human disturbance expanded, and vegetation degradation progressed in parallel along a nonlinear trajectory.
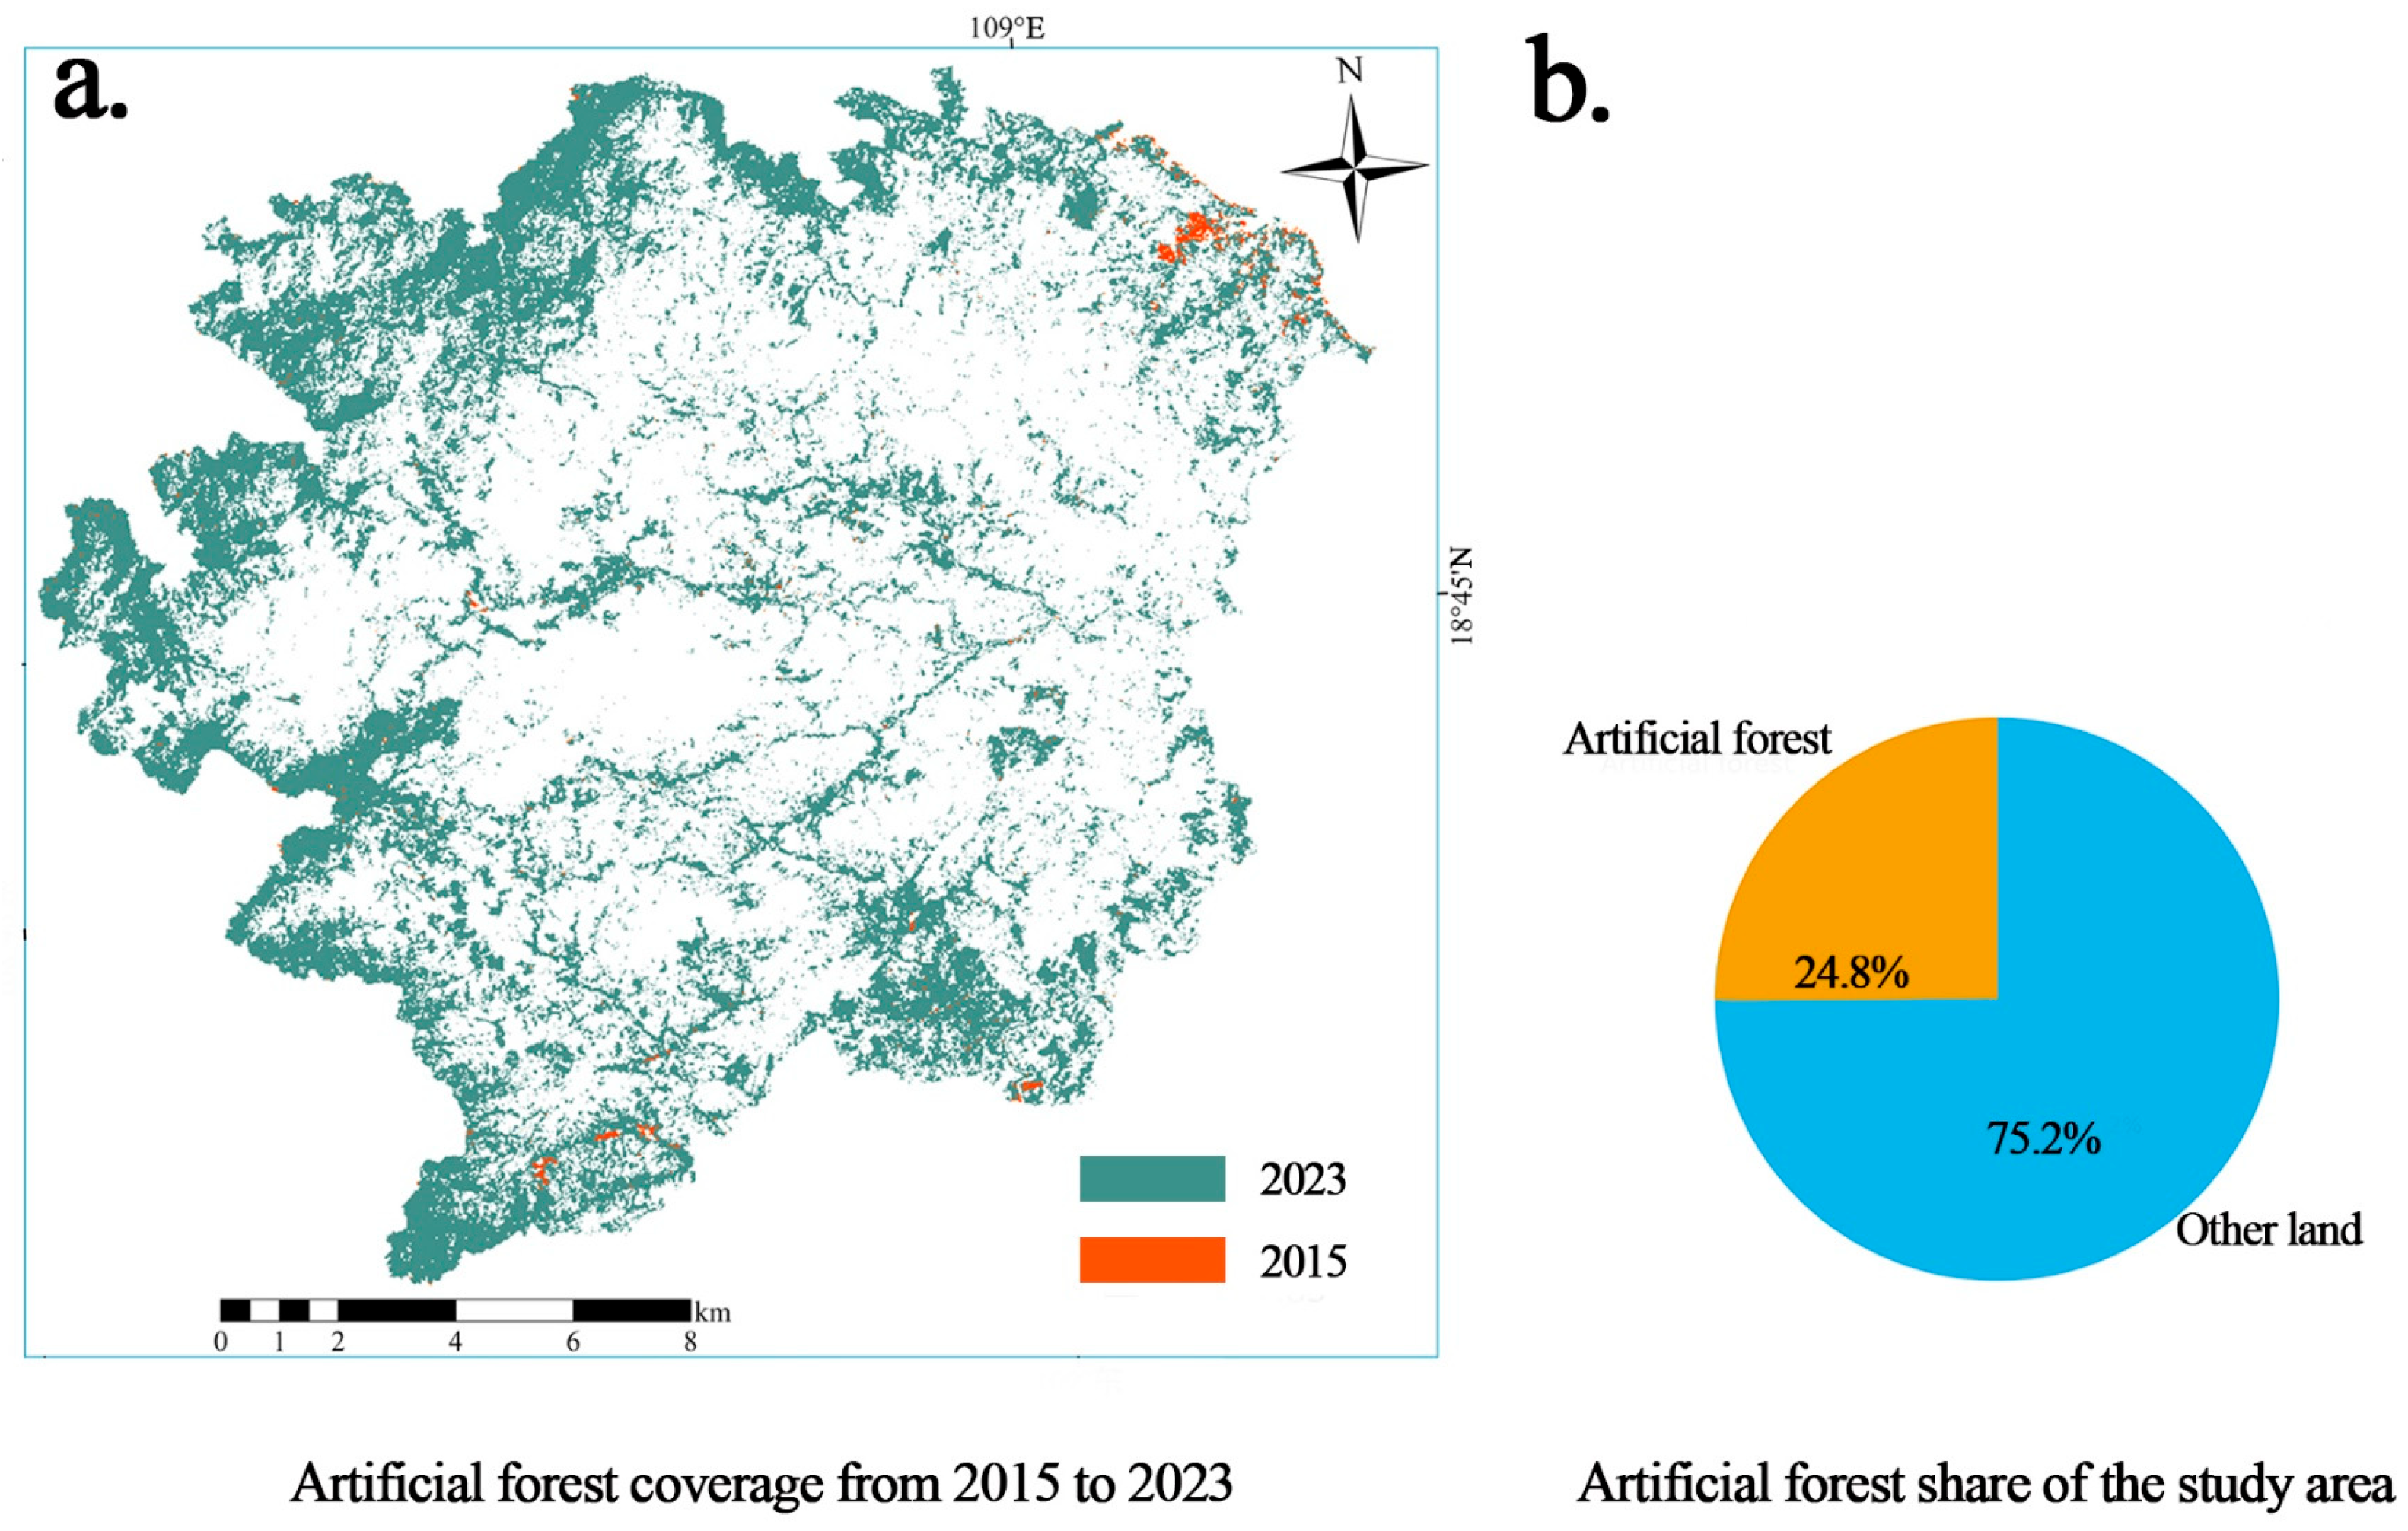
PLS-SEM addressed multicollinearity via a latent-variable framework and showed that AGB in JFLTLR is primarily influenced by anthropogenic drivers (Artificial forest, Landuse, and GDP), consistent with the observations of Baccini et al. From 2015 to 2023, Artificial forest remained the dominant driver, with direct effects ranging from −4.916 (2015) to 0.579 (2019). Meanwhile, the vegetation pattern in JFLTLR further corroborates the dominant role of Artificial forests [88]. To data, Artificial forests cover approximately 8611.8 ha, representing about 25% of the study area (Figure 11). Transitions between a carbon source and a carbon sink are largely determined by forest management, including afforestation, stand tending, and harvesting. Prior studies indicate that appropriate silvicultural practices can substantially enhance carbon sequestration, allowing forests to realize their carbon-sink potential [89]. Currently, JFLTLR is witnessing an expansion in forest cover due to curbs on deforestation and degradation, advancing afforestation, and the conversion of cropland to forest. Timber plantations are dominated by Acacia chinensis, eucalyptus, rubber, and pine, while commercial orchards mainly include longan, mango, litchi, and cashew. However, planted forests and degraded secondary forests are often managed extensively or left to natural regeneration, so their carbon sequestration potential remains underused. Across the tropics, economic incentives have driven widespread replacement of primary forests with plantations such as oil palm, rubber, and fast-growing timber species [90,91]. These plantations typically contain much lower aboveground biomass per unit area than primary forests [92], consistent with our findings in Hainan. Therefore, as the area of planted forests expands, a key challenge is to maintain or increase stand-level carbon density across the region through appropriate silvicultural practices such as optimizing species composition and restructuring stands.
GDP via HII ranged from about −0.50 (2015) to 0.01 (2021), showing alternating weak facilitation and inhibition, while Road via HII ranged from −0.62 (2015) to 0.04 (2017), remaining predominantly inhibitory overall. In JFLTLR, government policies have supported the expansion and investment in tourism, and road networks have increased accessibility and broadened the footprint of human disturbance in forested sites. These changes intensify edge effects and habitat fragmentation, leading to declines in roadside AGB, similar to what we found [93,94]. Although road expansion improves access and mobility, it also intensifies pressure on roadside forests, damaging natural broadleaf stands, creating fragmentation belts, and amplifying edge effects that accelerate degradation. These changes impair ecosystem functions and strongly disturb regional forest carbon stocks, reshaping the spatial pattern of AGB. This result is consistent with the evidence reported by Ordway et al. that road networks can reduce forest carbon storage per hectare by at least 30% [95,96,97]. Evidence from Xishuangbanna by Dissanayake and colleagues further shows that new or widened roads reduce AGB in both natural forests and plantations such as rubber and tea [98]. As GDP grows, investment in transport and tourism infrastructure increases. Spillover of construction land and higher land use intensity elevate the road network density and expand nodes, amplifying negative indirect effects on AGB through pathways such as increased road access leading to land use change. At the same time, GDP growth can yield compensatory benefits via ecological investment, stand tending and rehabilitation, and stronger enforcement, which helps explain why the effect magnitude is weak or near zero in some years [99]. Overall, the GDP effect on AGB is context dependent and nonlinear: stronger at low elevations, along edges and road buffers, and weaker in core protected areas, as reported in Barber et al. [100]. Cross-regional studies reveal comparable patterns in how disturbances affect AGB in tropical lowland rainforests. In the Amazon, de Avila et al. [101] highlighted that the intensification of road networks and frontier development consistently led to biomass depletion and forest fragmentation, with edge effects extending from tens to several hundred meters into previously intact stands. In Southeast Asia, Razafindratsima et al. [102] reported that the rapid replacement of primary forests with monoculture systems, including oil palm and fast-growing timber species, resulted in threshold-like declines in AGB, most evident at lower elevations and along major development corridors. Put simply, the steepest biomass reductions tend to occur adjacent to transportation routes and forest edges, a pattern that resonates with our observations. Importantly, the disturbance threshold identified in this study (ΔHII ≈ 0.1712) aligns with the sensitive ranges documented in other tropical regions. The attenuation detected after 2019 further indicates that strict policy enforcement and topographic buffering can mitigate post-threshold biomass losses, highlighting both the broader consistency and the site-specific nuances of AGB responses to human pressure [101,102,103,104,105].

4.2. Policy Interventions and Time-Lag Effects

The relationship between anthropogenic disturbances and AGB is strongly influenced by policies and management measures; however, their effects often exhibit significant time lags. Policy adjustments are not immediately reflected in forest AGB changes and typically require prolonged periods of ecological recovery. The primary lag effects are manifested in two key aspects:
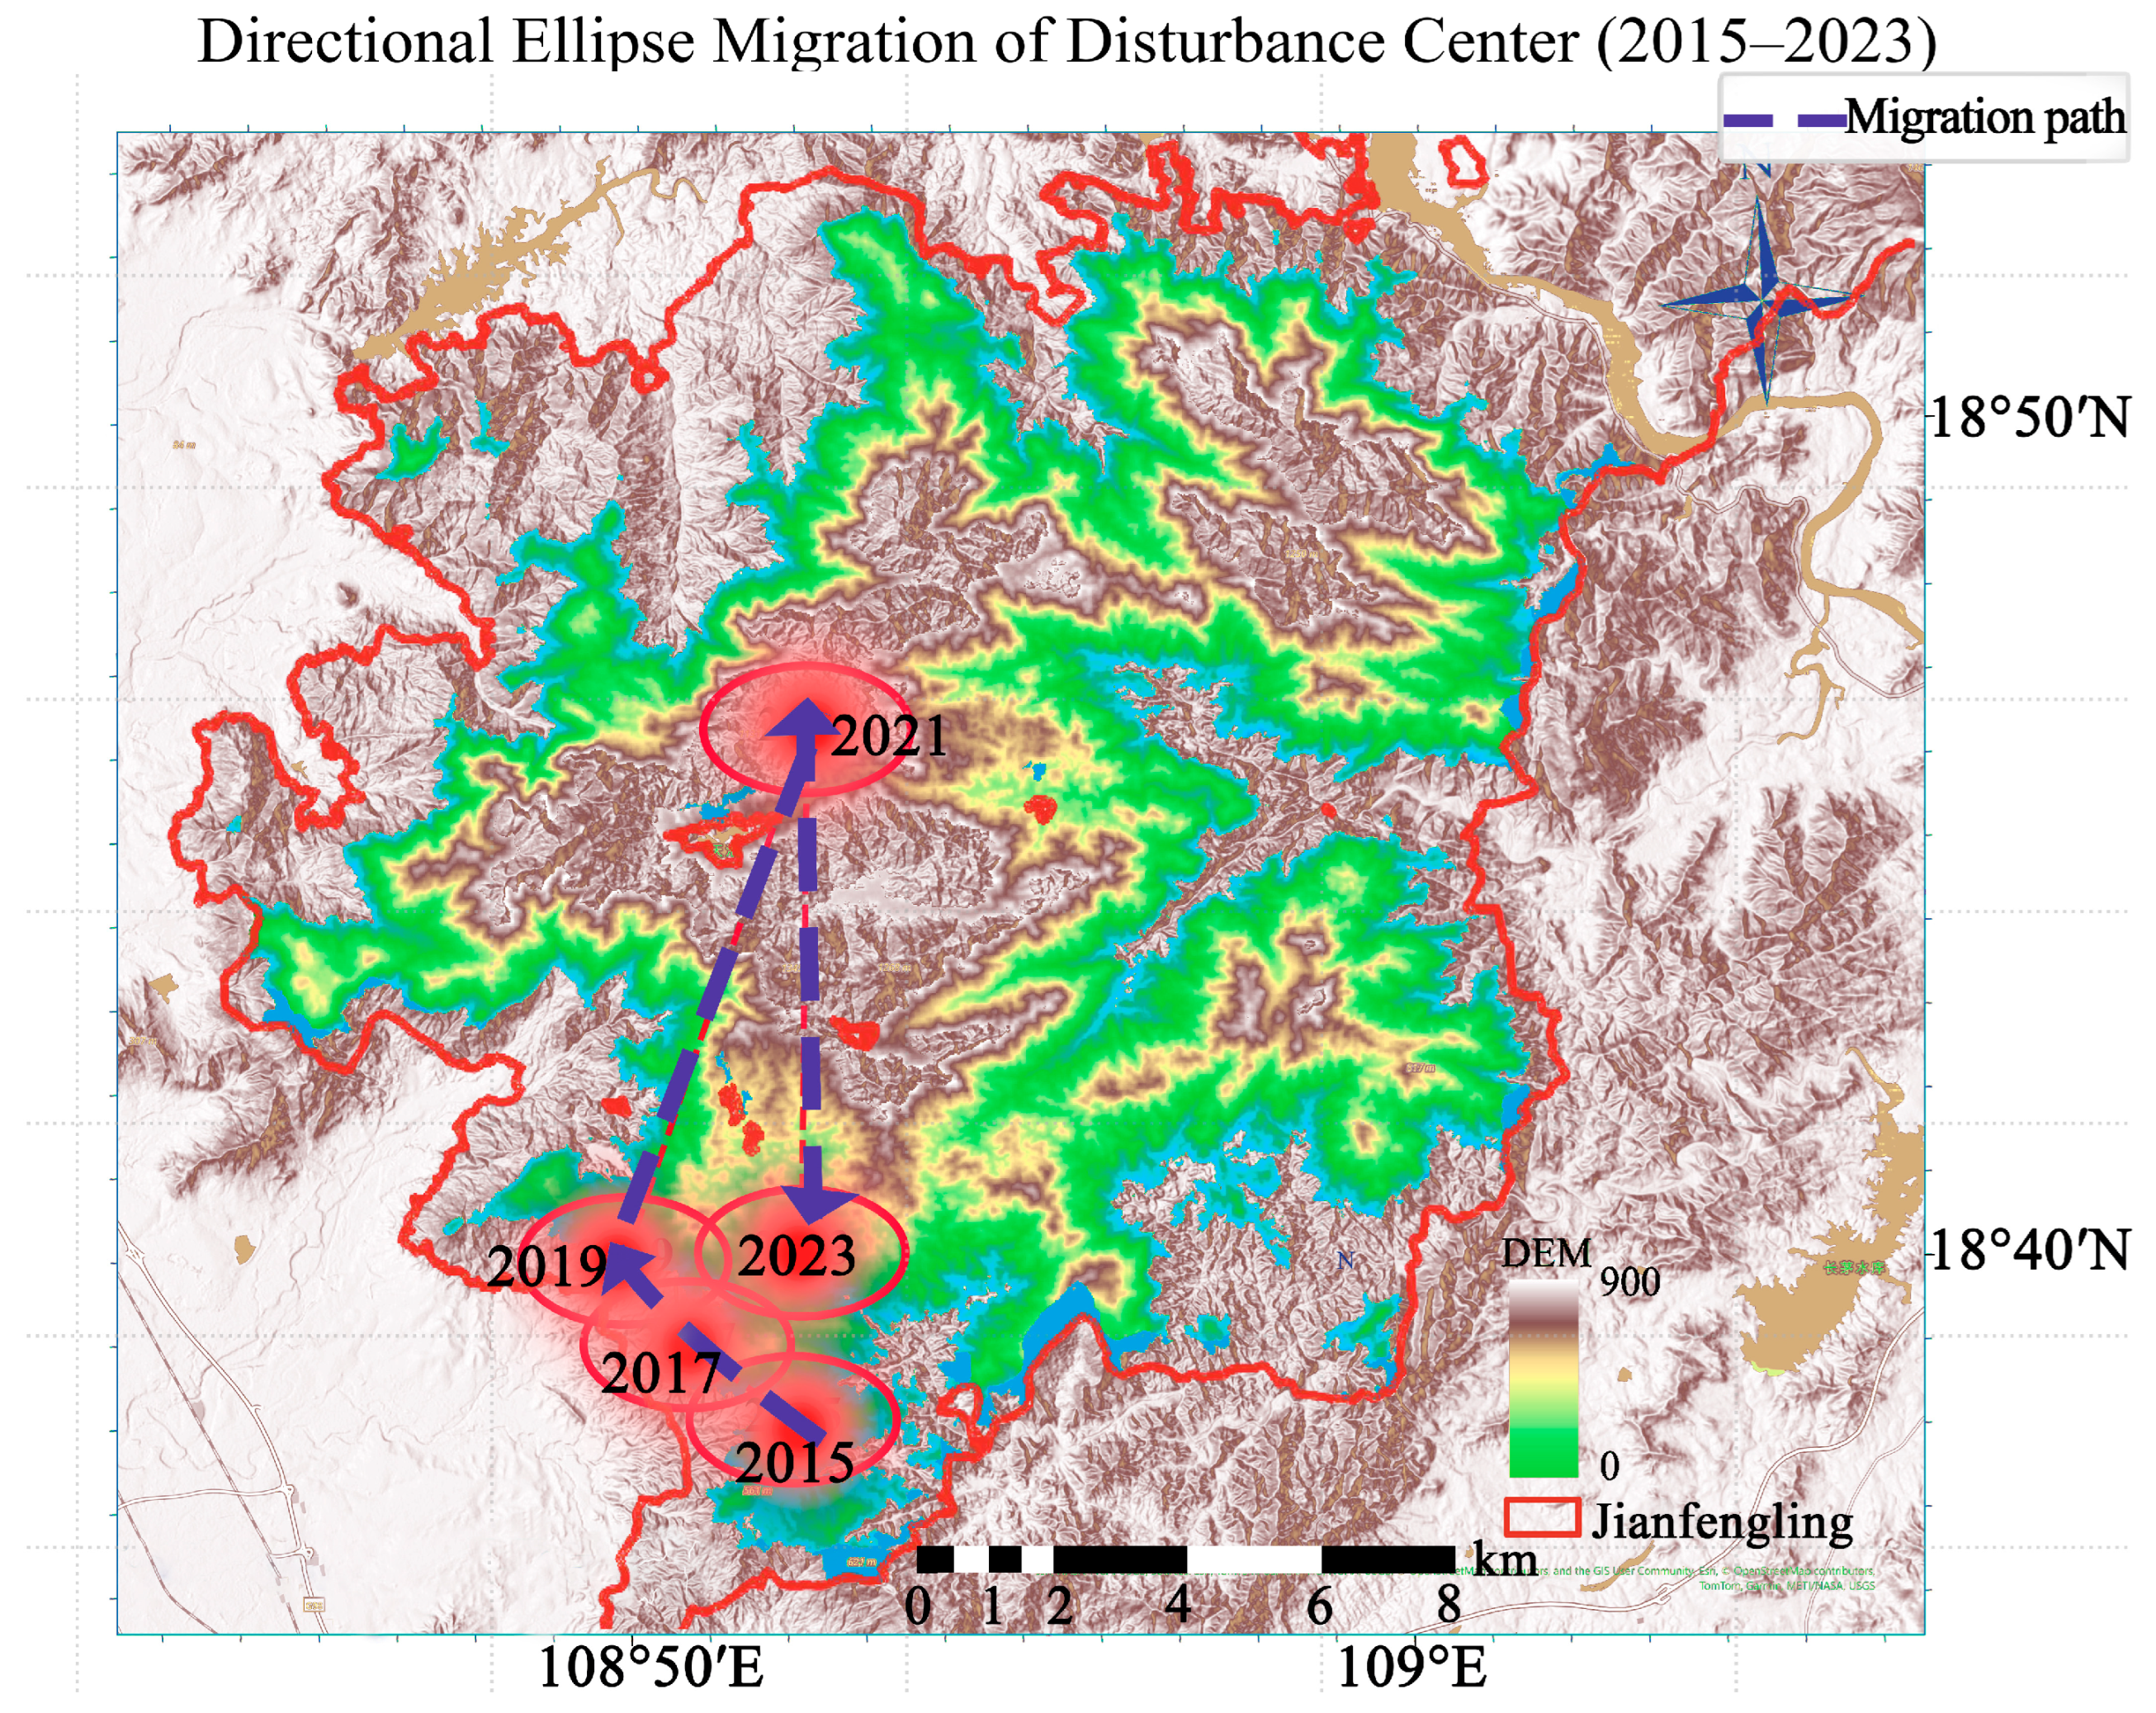
One, ecological protection policies produce delayed positive effects. Forest recovery and AGB enhancement depend on long-term ecological processes, which rarely yield substantial improvements in the short term. For example, China’s natural forest protection program and grain-for-green program, launched in 1998, have increased forest cover in many regions and reduced landscape fragmentation. However, due to slow tree growth and delayed ecosystem recovery, AGB restoration follows a gradual, cumulative trajectory. Florian et al. [106], report that tropical secondary forests average only 122 mg·ha−1 after 20 years of natural recovery and require approximately 66 years to reach 90% of primary forest AGB. Similarly, Poorter and Craven [107] noted that secondary forests take about 20 years to reach roughly 78% of primary forest AGB. These findings underscore that while policies can improve forest structure, AGB recovery requires decades of sustained accumulation. Since the designation of Jianfengling as a national nature reserve in 2002, forest resources have partially recovered under ecological protection measures. Although AGB in the central tropical lowland rainforest has increased steadily each year, it remains well below the levels observed in primary forests, reaffirming the lagged effects of policies on regional AGB recovery. In 2021, the Chinese government established the NPHTR and designated Jianfengling as a core protected zone, implementing stricter measures to limit infrastructure expansion and land-use conversion, effectively curbing the spread of anthropogenic disturbances in core areas. Under these conditions, AGB in the central region has maintained a steady upward trajectory, demonstrating tangible ecological benefits of policy interventions. In contrast to the global trend of ongoing AGB decline in tropical rainforests lacking long-term protection, these results highlight the positive, albeit delayed, effects of protected-area policies but also the pivotal role of macro-level policies in promoting forest restoration and regulating the feedback mechanisms between disturbances and AGB dynamics. This lagged response is further evident in the migration of the HII centroid during 2015–2023, which lagged major policy milestones (2002 reserve designation; 2021 national park core zoning) and stabilized only after the 2021 tightening (Figure 12).
Two, the negative impacts of unfavorable policy shifts or economic downturns often exhibit a pronounced temporal lag. Studies indicate that the peak of forest degradation typically occurs several years after policy implementation, with subsequent illegal logging and cumulative land clearing further accelerating AGB decline [7,76]. Residual disturbance effects from earlier adverse policies can continue to damage forest structure, intensify edge fragmentation, and cause sustained AGB losses [108]. The severe fragmentation and AGB reduction observed in the peripheral zones of JFLTLR exemplify this phenomenon. Overall, AGB responses to policy changes are characterized by notable time-lag and buffering effects, underscoring the need for long-term continuous monitoring to accurately assess the true impacts of human disturbances on forest ecosystems. This further highlights the importance of focusing on cumulative long-term effects rather than short-term responses when analyzing the spatial coupling and driving mechanisms between AGB and HII. Therefore, the advancement of long-term and systematic forestry policies, together with enhanced protection measures and refined management practices, is essential for stabilizing regional carbon sinks, safeguarding ecological security, and supporting the achievement of sustainable development goals.

4.3. Contributions, Limitations, and Prospects

Through our study, we make three key contributions. Firstly, we develop the first high-precision AGB estimation model integrating multi-temporal remote sensing data, enabling high-resolution, time-series monitoring of forest carbon stocks in the JFLTLR under complex tropical lowland and mountainous conditions. In this framework, piecewise regression identified a single threshold at ΔHII of approximately 0.1712: below it, AGB declines slowly; above it, the decline accelerates markedly. Secondly, by combining HII with LISA analysis, we show the nonlinear spatial coupling between forest AGB and human disturbances, and through analyses of HII centroid migration and peripheral patch dynamics, we elucidated the feedback mechanisms driving human disturbances and the retrogressive shift of disturbance centers. Thirdly, within the context of NPHTR construction and implementation, we provide empirical evidence demonstrating the time-lag effects and buffering roles of conservation policies in the dynamic evolution of tropical rainforest AGB.
Despite these contributions, our study has several limitations. The current spatial resolution of remote sensing data is insufficient to capture fine-scale forest disturbances. Future research could integrate high-resolution satellite imagery or LiDAR to improve forest structure detection [109]. Due to limitations in socio-economic data, the PLS-SEM was unable to fully quantify the pathways through which critical factors such as tourism flows, human activities, management investments, and logging influence forest AGB, which reduces the explanatory power of the model to some extent. Moreover, the interactive effects of natural factors and their combined responses along ecological gradients (topography and climate) were not examined in depth, warranting further exploration to enhance the scientific rigor of ecosystem resilience assessments [110]. Although our findings show that policy interventions have mitigated AGB decline and provided ecological buffering effects, their governance effectiveness remains insufficiently evaluated through systematic quantitative methods and long-term monitoring. Future studies should incorporate refined policy analysis, extensive public surveys, and continuous ecological monitoring to establish a “policy-disturbance-AGB response” feedback framework for assessing the long-term effectiveness of policy interventions.

5. Conclusions

The intricate nature of carbon dynamics in tropical lowland rainforests at Jianfengling was revealed by integrating Sentinel-1/2 imagery, field plot inventories, and socio-economic datasets to construct a high-precision remote sensing inversion model of AGB and HII. Combined with spatial statistical methods and PLS-SEM, the analysis investigates AGB dynamics and dominant disturbance mechanisms from 2015 to 2023, highlighting a trajectory of initial decline, partial recovery, and renewed loss, with spatially stable central cores contrasting degraded peripheries. The mean regional AGB was approximately 237 mg·ha−1 during the study period, displaying a stable core and a degraded periphery. Artificial forest was the strongest direct driver, predominantly negative but briefly positive in 2019 (0.579). Road and Landuse also act as direct inhibitors, whereas the proportion of built-up areas has a significant impact in some years. GDP and Road exerted indirect impacts mediated by HII, strongest in 2015 (GDP: −0.503; Road: −0.615) and weakening after 2019 under policy intervention, suggesting attenuation of economic-and road-driven cascades. AGB and HII showed a significant negative spatial correlation, with the strongest negative coupling in 2019 (Moran’s I = −0.2976). A temporary positive correlation was observed only in 2021 (Moran’s I = 0.1455), likely reflecting partial AGB recovery in the central zone following the implementation of NPHTR policies, which alleviated disturbance pressures. Threshold analysis further revealed a critical breakpoint at ΔHII ≈ 0.1712: below this value, AGB losses were minimal (≈ 0.025 mg·ha−1 per 0.01 ΔHII), whereas above it, declines intensified sharply (≈2.65 mg·ha−1 per 0.01 ΔHII), consistent with the clustering of high-HII and low-AGB patches. At the same time, the annual migration of the HII centroid, when combined with the spatial evolution of the seven human disturbance factors, indicates a progressive shift of disturbance pressure from core to peripheral zones, thereby reinforcing the dual dynamic of “core recovery and edge degradation.” These policies have mitigated anthropogenic impacts in core areas, fostering recovery, while peripheral zones continue to experience disturbance feedback and expansion, resulting in dual dynamics of core ecological recovery and peripheral degradation, accompanied by a decline in carbon sink capacity. In response, this study recommends a differentiated ecological management strategy of “core stabilization-peripheral prevention and control”, supported by early warning and dynamic monitoring systems, optimized infrastructure planning, and the creation of ecological corridors. Importantly, the identified ΔHII threshold provides a quantitative reference for policy, suggesting that keeping disturbance levels below this breakpoint is critical for sustaining biomass stability. This insight can inform threshold-based early-warning frameworks and adaptive zoning to maintain carbon sink resilience. These measures aim to curb disturbance spillovers from transportation development, land-use expansion, and construction activities, thereby mitigating peripheral degradation, strengthening regional carbon sink resilience, and providing a scientific foundation for refined carbon management and long-term conservation planning in tropical rainforest edge zones.

Supplementary Materials

The following supporting information can be downloaded at: https://www.mdpi.com/article/10.3390/f16101611/s1. Tables S1. Summary of remote sensing, field, and socio-economic datasets used in this study. Table S2. The variable selection results derived from six methods: Spearman rank correlation, Least Absolute Shrinkage and Selection Operator (LASSO) regression, Random Forest, Boosted Regression Trees (BRT), Forward Stepwise Regression, and Redundancy Analysis (RDA). Table S3. List of abbreviations used in this study. Table S4. Summary of Sentinel-2 and Sentinel-1 variables for forest AGB model. Figure S1. From top to bottom, the figure presents the variable importance results derived from Spearman correlation, LASSO regression, and Random Forest models. Figure S2. From top to bottom, the figure presents the variable importance results derived from BRT (Boosted Regression Trees), Forward Stepwise regression, and RDA (Redundancy Analysis) models. Figure S3. Comprehensive evaluation of model performance using four complementary metrics (R2, adjusted R2, RMSE, MAE) and five-fold cross-validation stability. Figure S4. The spatiotemporal characteristics of the JFLTLR from 2015 to 2023. Figure S5. SHAP summary plot based on the XGBoost model, showing the mean contribution (%) of each factor to AGB variation across all years. Figure S6. Mann–Kendall trends of AGB and HII (2015–2023). Figure S7. Analysis of Direct and Indirect Effects Driven by Human Activities from 2015 to 2023 based on PLS-SEM.

Author Contributions

Conceptualization, S.M. and M.M.; methodology, S.M. and M.W.; software, Y.M.; validation, Y.M. and Y.C.; formal analysis, S.M. and R.C.; investigation, Y.C. and X.Z.; resources, W.G., M.W. and J.J.; data curation, S.M., Y.C. and R.C.; writing—original draft preparation, S.M.; writing—review and editing, S.M., M.M., X.Z. and J.X.; visualization, Y.C., Y.M. and J.X.; supervision, M.M., W.G. and L.W.; project administration, M.M., W.G. and J.J.; funding acquisition, W.G. and L.W. All authors have read and agreed to the published version of the manuscript.

Funding

This research was supported by the National Natural Science Foundation of China (No. 32360386), the Hainan Provincial Natural Science Foundation of China (No. 322MS023), and the Intelligent Forestry Key Laboratory of Haikou City (No. 2020-057).

Data Availability Statement

The processed data and codes generated in this study are available from Zenodo (https://zenodo.org/records/16779771, accessed on 13 October 2025). Additional relevant data will be provided by the authors upon reasonable request.

Conflicts of Interest

The authors declare no conflicts of interest.

References

  1. Bonan, G.B. Forests and Climate Change: Forcings, Feedbacks, and the Climate Benefits of Forests. Science 2008, 320, 1444–1449. [Google Scholar] [CrossRef] [PubMed]
  2. Pan, Y.; Birdsey, R.A.; Fang, J.; Houghton, R.; Kauppi, P.E.; Kurz, W.A.; Phillips, O.L.; Shvidenko, A.; Lewis, S.L.; Canadell, J.G. A Large and Persistent Carbon Sink in the World’s Forests. Science 2011, 333, 988–993. [Google Scholar] [CrossRef] [PubMed]
  3. Zhang, Q.; Liu, Y.; Huang, H.; Chen, C.; Li, B.; Jiang, S. Changes in Species-Level Biomass and Its Relationship with Climate and Forest Disturbances in the Great Xing’an Mountains. Acta Ecol. Sin. 2019, 39, 4442–4454. [Google Scholar]
  4. An, Y.; Tan, X.; Ren, H.; Li, Y.; Zhou, Z. Historical Changes and Multi-Scenario Prediction of Land Use and Terrestrial Ecosystem Carbon Storage in China. Chin. Geogr. Sci. 2024, 34, 487–503. [Google Scholar] [CrossRef]
  5. Dale, V.H.; Joyce, L.A.; McNulty, S.; Neilson, R.P.; Ayres, M.P.; Flannigan, M.D.; Hanson, P.J.; Irland, L.C.; Lugo, A.E.; Peterson, C.J.; et al. Climate Change and Forest Disturbances. BioScience 2001, 51, 723–734. [Google Scholar] [CrossRef]
  6. Zhen, Y.; Zhang, X.; Zhang, C.; Gao, Q.; Dong, J.; Zhang, L.; Lu, X.; Wang, Y. Effects of Climate Change and Land Use/Cover Changes on Carbon Sequestration in Forest Ecosystems in the Coastal Area of China. Front. For. Glob. Change 2023, 6, 1271239. [Google Scholar] [CrossRef]
  7. Piao, S.; Fang, J.; Ciais, P.; Peylin, P.; Huang, Y.; Sitch, S.; Wang, T. The Carbon Balance of Terrestrial Ecosystems in China. Nature 2009, 458, 1009–1013. [Google Scholar] [CrossRef]
  8. Feng, Y.; Wang, J.; Sang, W. Biomass Allocation, Morphology and Photosynthesis of Invasive and Noninvasive Exotic Species Grown at Four Irradiance Levels. Acta Oecologica 2007, 31, 40–47. [Google Scholar] [CrossRef]
  9. Houghton, R.A.; Lawrence, K.T.; Hackler, J.L.; Brown, S. The Spatial Distribution of Forest Biomass in the Brazilian Amazon: A Comparison of Estimates. Glob. Change Biol. 2001, 7, 731–746. [Google Scholar] [CrossRef]
  10. Tahvanainen, T.; Forss, E. Individual Tree Models for the Crown Biomass Distribution of Scots Pine, Norway Spruce and Birch in Finland. For. Ecol. Manag. 2008, 255, 455–467. [Google Scholar] [CrossRef]
  11. Ou, G.; Xu, H. A Review on Forest Biomass Models. J. Southwest For. Univ. 2020, 40, 1–10. [Google Scholar] [CrossRef]
  12. Wang, X.; Chang, Y.; Chen, H.; Hu, Y.; Jiao, L.; Feng, Y.; Wu, W.; Wu, H. Spatial Pattern of Forest Biomass and Its Influencing Factors in the Great Xing’an Mountains, Heilongjiang Province, China. Chin. J. Appl. Ecol. 2014, 25, 974–982. [Google Scholar] [CrossRef]
  13. Beaudoin, A.; Bernier, P.Y.; Guindon, L.; Villemaire, P.; Guo, X.J.; Stinson, G.; Bergeron, T.; Magnussen, S.; Hall, R.J. Mapping Attributes of Canada’s Forests at Moderate Resolution through KNN and MODIS Imagery. Can. J. For. Res. 2014, 44, 521–532. [Google Scholar] [CrossRef]
  14. Giardina, C.P.; Ryan, M.G.; Binkley, D.; Fownes, J.H. Primary Production and Carbon Allocation in Relation to Nutrient Supply in a Tropical Experimental Forest. Glob. Change Biol. 2003, 9, 1438–1450. [Google Scholar] [CrossRef]
  15. Savage, S.L.; Lawrence, R.L.; Squires, J.R. Predicting Relative Species Composition within Mixed Conifer Forest Pixels Using Zero-Inflated Models and Landsat Imagery. Remote Sens. Environ. 2015, 171, 326–336. [Google Scholar] [CrossRef]
  16. Zhang, Q.; He, H.S.; Liang, Y.; Hawbaker, T.J.; Henne, P.D.; Liu, J.; Huang, S.; Wu, Z.; Huang, C. Integrating Forest Inventory Data and MODIS Data to Map Species-Level Biomass in Chinese Boreal Forests. Can. J. For. Res. 2018, 48, 461–479. [Google Scholar] [CrossRef]
  17. Fu, A.; Gao, X.; Wang, P.; Wu, F.; Zhou, R. Research on Forest Biomass and Stock Volume Model Based on Stand Height and Canopy Density. For. Resour. Manag. 2021, 2, 61–67. [Google Scholar] [CrossRef]
  18. Du, Z.; Zheng, G.; Shen, G.; Moskal, L.M. Characterizing Spatiotemporal Variations of Forest Canopy Gaps Using Aerial Laser Scanning Data. Int. J. Appl. Earth Obs. Geoinf. 2021, 104, 102588. [Google Scholar] [CrossRef]
  19. Swatantran, A.; Dubayah, R.; Roberts, D.; Hofton, M.; Blair, J.B. Mapping Biomass and Stress in the Sierra Nevada Using Lidar and Hyperspectral Data Fusion. Remote Sens. Environ. 2011, 115, 2917–2930. [Google Scholar] [CrossRef]
  20. Dubois-Fernandez, P.C.; Souyris, J.C.; Angelliaume, S.; Garestier, F. The Compact Polarimetry Alternative for Spaceborne SAR at Low Frequency. IEEE Trans. Geosci. Remote Sens. 2008, 46, 3208–3222. [Google Scholar] [CrossRef]
  21. Chen, E.; Li, Z.; Pang, Y.; Tian, X. Polarimetric Synthetic Aperture Radar Interferometry Based Mean Tree Height Extraction Technique. Sci. Silvae Sin. 2007, 43, 66–70+145. [Google Scholar]
  22. Lan, L.; Chen, E.; Li, Z.; Qi, F.; Lei, Z. A Review on Forest Height and Above-Ground Biomass Estimation Based on Synthetic Aperture Radar. Chin. J. Plant Ecol. 2016, 31, 625–633. [Google Scholar] [CrossRef]
  23. Huang, T.; Ou, G.; Wu, Y.; Xu, X.; Wang, Z.; Lin, R.; Xu, C. Multi-Source Remote Sensing Estimation of Forest Biomass Based on Machine Learning Algorithm. J. Northwest For. Univ. 2024, 39, 10–18. [Google Scholar] [CrossRef]
  24. Wang, X.; Liu, C.; Lv, G.; Xu, J.; Cui, G. Integrating Multi-Source Remote Sensing to Assess Forest Aboveground Biomass in the Khingan Mountains of North-Eastern China Using Machine-Learning Algorithms. Remote Sens. 2022, 14, 1039. [Google Scholar] [CrossRef]
  25. Tian, X.; Yan, M.; van der Tol, C.; Li, Z.; Su, Z.; Chen, E.; Li, X.; Li, L.; Wang, X.; Pan, X.; et al. Modeling Forest Above-Ground Biomass Dynamics Using Multi-Source Data and Incorporated Models: A Case Study over the Qilian Mountains. Agric. For. Meteorol. 2017, 246, 1–14. [Google Scholar] [CrossRef]
  26. López-Serrano, P.M.; Cárdenas-Domínguez, J.L.; Corral-Rivas, J.J.; Jiménez, E.; López-Sánchez, C.A.; Vega-Nieva, D.J. Modeling of Aboveground Biomass with Landsat 8 OLI and Machine Learning in Temperate Forests. Forests 2020, 11, 11. [Google Scholar] [CrossRef]
  27. Li, Y.; Li, M.; Li, C.; Liu, Z. Forest Aboveground Biomass Estimation Using Landsat 8 and Sentinel-1A Data with Machine Learning Algorithms. Sci. Rep. 2020, 10, 9952. [Google Scholar] [CrossRef]
  28. Salazar-Villegas, M.H.; Qasim, M.; Csaplovics, E.; González-Martínez, R.; Rodríguez-Buritica, S.; Ramos-Abril, L.N.; Salazar-Villegas, B. Examining the Potential of Sentinel Imagery and Ensemble Algorithms for Estimating Aboveground Biomass in a Tropical Dry Forest. Remote Sens. 2023, 15, 5086. [Google Scholar] [CrossRef]
  29. Antunes, R.; Luiz, L., Jr.; Costa, G.; Feitosa, R.; Bias, E.D.S.; Cereda, A., Jr.; Almeida, C.; La Rosa, L.E.C.; Happ, P.; Chiamulera, L. Leveraging SAR and Optical Remote Sensing for Enhanced Biomass Estimation in the Amazon with Random Forest and XGBoost Models. ISPRS Ann. Photogramm. Remote Sens. Spat. Inf. Sci. 2024, X-3-2024, 21–27. [Google Scholar] [CrossRef]
  30. Huang, Y.; Ding, Y.; Zang, R.; Li, X.; Zou, Z.; Han, W. Spatial Pattern of Trees in Tropical Lowland Rain Forest in Bawangling of Hainan Island, China. Chin. J. Plant Ecol. 2012, 36, 269–280. [Google Scholar] [CrossRef]
  31. Li, C.; Li, D.; Yang, X.; Shi, J.; Zhao, J.; Li, L.; Chen, L.; Zhang, P.; Tian, L. Variations in Species Composition and Community Structure of Natural Forests in Central Hainan’s Mountainous Region. J. Trop. Biol. 2022, 13, 287. [Google Scholar] [CrossRef]
  32. Du, L.; Liu, H.; Liu, H.; Liu, W.; Quan, Z.; Zhang, Y. Value Assessment and Prediction of Regulating Ecosystem Services in Hainan Tropical Rainforest National Park, China. Sustainability 2024, 16, 9170. [Google Scholar] [CrossRef]
  33. Laurance, W.F.; Goosem, M.; Laurance, S.G. Impacts of Roads and Linear Clearings on Tropical Forests. Trends Ecol. Evol. 2009, 24, 659–669. [Google Scholar] [CrossRef] [PubMed]
  34. Armenteras, D.; Rodríguez, N.; Retana, J.; Morales, M. Understanding Deforestation in Montane and Lowland Forests of the Colombian Andes. Reg. Environ. Change 2011, 11, 693–705. [Google Scholar] [CrossRef]
  35. Ning, J.; Liu, J.; Kuang, W.; Xu, X.; Zhang, S.; Yan, C.; Li, R.; Wu, S.; Hu, Y.; Du, G. Spatiotemporal Patterns and Characteristics of Land-Use Change in China during 2010–2015. J. Geogr. Sci. 2018, 28, 547–562. [Google Scholar] [CrossRef]
  36. Sloan, S.; Jenkins, C.N.; Joppa, L.N.; Gaveau, D.L.A.; Laurance, W.F. Remaining Natural Vegetation in the Global Biodiversity Hotspots. Biol. Conserv. 2014, 177, 12–24. [Google Scholar] [CrossRef]
  37. Laurance, W.F.; Sayer, J.; Cassman, K.G. Agricultural Expansion and Its Impacts on Tropical Nature. Trends Ecol. Evol. 2014, 29, 107–116. [Google Scholar] [CrossRef]
  38. Wang, Y.; Li, J.; Xu, H.; Liu, M.; Li, Y. Numerical Characteristics of Plant Sexual System of the Woody Plants in the 60 ha Plot in the Tropical Rain Forest in Jianfengling, Hainan Island. Biodivers. Sci. 2019, 27, 297–305. [Google Scholar] [CrossRef]
  39. Yang, S.; Zhang, Q.; Sun, X.; Li, J.; Yang, X.; Hu, G.; Shen, D. Structural Features of Root-Associated Fungus–Plant Interaction Networks in the Tropical Montane Rainforest of Jianfengling, China. Biodivers. Sci. 2019, 27, 314–326. [Google Scholar] [CrossRef]
  40. Zhu, Q.; Guo, H.; Zhang, L.; Liang, D.; Liu, X.; Wan, X.; Liu, J. Tropical Forests Classification Based on Weighted Separation Index from Multi-Temporal Sentinel-2 Images in Hainan Island. Sustainability 2021, 13, 13348. [Google Scholar] [CrossRef]
  41. Fang, G.; Yu, H.; Fang, L.; Zheng, X. Synergistic Use of Sentinel-1 and Sentinel-2 Based on Different Preprocessing for Predicting Forest Aboveground Biomass. Forests 2023, 14, 1615. [Google Scholar] [CrossRef]
  42. Gorelick, N.; Hancher, M.; Dixon, M.; Ilyushchenko, S.; Thau, D.; Moore, R. Google Earth Engine: Planetary-Scale Geospatial Analysis for Everyone. Remote Sens. Environ. 2017, 202, 18–27. [Google Scholar] [CrossRef]
  43. Zhu, Z.; Woodcock, C.E. Automated Cloud, Cloud Shadow, and Snow Detection in Multitemporal Landsat Data: An Algorithm Designed Specifically for Monitoring Land Cover Change. Remote Sens. Environ. 2014, 152, 217–234. [Google Scholar] [CrossRef]
  44. Drusch, M.; Del Bello, U.; Carlier, S.; Colin, O.; Fernandez, V.; Gascon, F.; Hoersch, B.; Isola, C.; Laberinti, P.; Martimort, P.; et al. Sentinel-2: ESA’s Optical High-Resolution Mission for GMES Operational Services. Remote Sens. Environ. 2012, 120, 25–36. [Google Scholar] [CrossRef]
  45. Shang, S.; Lee, Z.; Wei, G. Characterization of MODIS-Derived Euphotic Zone Depth: Results for the China Sea. Remote Sens. Environ. 2011, 115, 180–186. [Google Scholar] [CrossRef]
  46. El Moussaoui, E.; Moumni, A.; Lahrouni, A. Assessing the Influence of Different Synthetic Aperture Radar Parameters and Digital Elevation Model Layers Combined with Optical Data on the Identification of Argan Forest in Essaouira Region, Morocco. iForest 2024, 17, 100–108. [Google Scholar] [CrossRef]
  47. Chen, L.; Wang, Y.; Ren, C.; Zhang, B.; Wang, Z. Optimal Combination of Predictors and Algorithms for Forest Above-Ground Biomass Mapping from Sentinel and SRTM Data. Remote Sens. 2019, 11, 414. [Google Scholar] [CrossRef]
  48. Haralick, R.M.; Shanmugam, K.; Dinstein, I. Textural Features for Image Classification. IEEE Trans. Syst. Man Cybern. 1973, SMC-3, 610–621. [Google Scholar] [CrossRef]
  49. Yan, Y.; Wang, W.; Zhang, X.; Li, J. Forest Aboveground Biomass Estimation Using Multi-Source Remote Sensing and Machine Learning Algorithms in Complex Mountain Areas. Sensors 2024, 24, 7071. [Google Scholar] [CrossRef]
  50. Zhao, P.; Lu, D.; Wang, G.; Wu, C.; Huang, Y.; Yu, S. Examining Spectral Reflectance Saturation in Landsat Imagery and Corresponding Solutions to Improve Forest Aboveground Biomass Estimation. Remote Sens. 2016, 8, 469. [Google Scholar] [CrossRef]
  51. Lamahewage, C.; Owari, T.; Tsuyuki, S.; Matsuura, T. Aboveground Biomass Estimation Using Multimodal Remote Sensing: Evaluating the Fusion of LiDAR, Hyperspectral, and SAR Data. Sci. Rep. 2025, 15, 2245. [Google Scholar] [CrossRef]
  52. U.S. Geological Survey. Shuttle Radar Topography Mission (SRTM) Digital Elevation Model. Available online: https://www.usgs.gov/centers/eros/science/usgs-eros-archive-digital-elevation-shuttle-radar-topography-mission-srtm-void?qt-science_center_objects=0#qt-science_center_objects (accessed on 20 August 2025).
  53. China National Knowledge Infrastructure (CNKI). GDP and Population Data. Available online: https://data.cnki.net/ (accessed on 20 August 2025).
  54. Laurance, W.F.; Clements, G.R.; Sloan, S.; O’Connell, C.S.; Mueller, N.D.; Goosem, M.; Venter, O.; Edwards, D.P.; Phalan, B.; Balmford, A.; et al. A Global Strategy for Road Building. Nature 2014, 513, 229–232. [Google Scholar] [CrossRef] [PubMed]
  55. European Space Agency (ESA)/Copernicus. Sentinel-2 MSI Level-2A Surface Reflectance (2017–2023), Distributed by Google Earth Engine. Available online: https://developers.google.com/earth-engine/datasets/catalog/COPERNICUS_S2_SR_HARMONIZED (accessed on 20 August 2025).
  56. Resource and Environmental Science Data Center, Chinese Academy of Sciences. Land Use Data. Available online: https://www.resdc.cn/data.aspx?DATAID=264 (accessed on 13 October 2025).
  57. Li, X.; Chen, J.; Zhao, Y. China’s Planted Forest Maps from 1990 to 2020. ISPRS J. Photogramm. Remote Sens. 2024, 207, 52–67. [Google Scholar]
  58. National Ecosystem Science Data Center; Zenodo. Artificial Forest Dataset. 2024. Available online: https://doi.org/10.5281/zenodo.10701417 (accessed on 20 August 2025).
  59. Zhang, Y.; Wang, L.; Liu, H. Spatial Distribution of Planted Forests in East Asia—Final Products. Sci. Data 2023, 10, 45. [Google Scholar] [CrossRef]
  60. Dormann, C.F.; Elith, J.; Bacher, S.; Buchmann, C.; Carl, G.; Carré, G.; García Marquéz, J.R.; Gruber, B.; Lafourcade, B.; Leitão, P.J.; et al. Collinearity: A Review of Methods to Deal with It and a Simulation Study Evaluating Their Performance. Ecography 2013, 36, 27–46. [Google Scholar] [CrossRef]
  61. Li, Z.; Bi, S.; Hao, S.; Cui, Y. Aboveground Biomass Estimation in Forests with Random Forest and Monte Carlo-Based Uncertainty Analysis. Ecol. Indic. 2022, 142, 109246. [Google Scholar] [CrossRef]
  62. Zhang, Y.; Liu, J.; Li, W.; Liang, S. A Proposed Ensemble Feature Selection Method for Estimating Forest Aboveground Biomass from Multiple Satellite Data. Remote Sens. 2023, 15, 1096. [Google Scholar] [CrossRef]
  63. He, X. Influencing Factors and Models of Stand Biomass for Natural Conifer–Broad-Leaved Mixed Forest in Jilin Province. Ph.D. Thesis, Chinese Academy of Forestry, Beijing, China, 2022. [Google Scholar] [CrossRef]
  64. Xiao, Y.; Wang, Q. Monitoring Planted Forest Expansion from 1990–2020 in China. Earth Syst. Sci. Data Discuss. 2025. preprint. [Google Scholar] [CrossRef]
  65. Hsu, H.-J.; Huang, C.-Y.; Jasinski, M.; Li, Y.; Gao, H.; Yamanokuchi, T.; Wang, C.-G.; Chang, T.-M.; Ren, H.; Kuo, C.-Y.; et al. A Semi-Empirical Scheme for Bathymetric Mapping in Shallow Water by ICESat-2 and Sentinel-2: A Case Study in the South China Sea. ISPRS J. Photogramm. Remote Sens. 2021, 178, 1–19. [Google Scholar] [CrossRef]
  66. Belgiu, M.; Drăguţ, L. Random Forest in Remote Sensing: A Review of Applications and Future Directions. ISPRS J. Photogramm. Remote Sens. 2016, 114, 24–31. [Google Scholar] [CrossRef]
  67. Breiman, L. Random Forests. Mach. Learn. 2001, 45, 5–32. [Google Scholar] [CrossRef]
  68. Friedman, J.H. Greedy Function Approximation: A Gradient Boosting Machine. Ann. Stat. 2001, 29, 1189–1232. [Google Scholar] [CrossRef]
  69. Qadeer, A.; Shakir, M.; Wang, L.; Talha, S.M. Evaluating Machine Learning Approaches for Aboveground Biomass Prediction in Fragmented High-Elevated Forests Using Multi-Sensor Satellite Data. Remote Sens. Appl. Soc. Environ. 2024, 36, 101291. [Google Scholar] [CrossRef]
  70. Du, J.; Fu, B.; Guo, Q.; Shi, P. Monitoring and Assessment of the Oasis Ecological Resilience Improved by Rational Water Dispatching Using Multiple Remote Sensing Data: A Case Study of the Heihe River Basin, Silk Road. Remote Sens. 2020, 12, 2577. [Google Scholar] [CrossRef]
  71. Junttila, V.; Gautam, B.; Karky, B.S.; Maguya, A.; Tegel, K.; Kauranne, T.; Gunia, K.; Hämäläinen, J.; Latva-Käyrä, P.; Nikolaeva, E.; et al. Robustness of Model-Based High-Resolution Prediction of Forest Biomass against Different Field Plot Designs. Carbon Balance Manag. 2015, 10, 29. [Google Scholar] [CrossRef]
  72. Kang, J.; Wang, Z.; Sui, L.; Yang, X.; Ma, Y.; Wang, J. Consistency Analysis of Remote Sensing Land Cover Products in the Tropical Rainforest Climate Region: A Case Study of Indonesia. Remote Sens. 2020, 12, 1410. [Google Scholar] [CrossRef]
  73. Liu, C.; Shi, S.; Liao, Z.; Wang, T.; Gong, W.; Shi, Z. Estimation of Woody Vegetation Biomass in Australia Based on Multi-Source Remote Sensing Data and Stacking Models. Sci. Rep. 2025, 15, 34975. [Google Scholar] [CrossRef]
  74. Xing, S.; Xing, J.; Ju, J.; Hou, Q.; Ding, X. Collaborative Consistent Knowledge Distillation Framework for Remote Sensing Image Scene Classification Network. Remote Sens. 2022, 14, 5186. [Google Scholar] [CrossRef]
  75. Ma, B.; Xie, Y.; Zhang, T.; Zeng, W.; Xue, Y. Construction of a Human–Wildlife Spatial Interaction Index in the Three-River Source Region, China. Ecol. Indic. 2021, 129, 107986. [Google Scholar] [CrossRef]
  76. Czerwinski, C.J.; King, D.J.; Mitchell, S.W. Mapping Forest Growth and Decline in a Temperate Mixed Forest Using Temporal Trend Analysis of Landsat Imagery, 1987–2010. Remote Sens. Environ. 2014, 141, 188–200. [Google Scholar] [CrossRef]
  77. Liu, S.; Cheng, F.; Dong, S.; Zhao, H.; Hou, X.; Wu, X. Spatiotemporal Dynamics of Grassland Aboveground Biomass on the Qinghai–Tibet Plateau Based on Validatad MODIS NDVI. Sci. Rep. 2017, 7, 4182. [Google Scholar] [CrossRef]
  78. Ai, M.; Chen, X.; Yu, Q. Spatial Correlation Analysis between Human Disturbance Intensity (HDI) and Ecosystem Services Value (ESV) in the Chengdu–Chongqing Urban Agglomeration. Ecol. Indic. 2024, 158, 111555. [Google Scholar] [CrossRef]
  79. Huang, X.; Wang, C.; Lu, J. Understanding the Spatiotemporal Development of Human Settlement in Hurricane-Prone Areas on the US Atlantic and Gulf Coasts Using Nighttime Remote Sensing. Nat. Hazards Earth Syst. Sci. 2019, 19, 2141–2155. [Google Scholar] [CrossRef]
  80. Bakshi, B.; Polasky, S.; Frelich, L.E. Using Structural Equation Models (SEM) to Link Climate Change, Forest Composition, Deer, and Outdoor Recreation. Ecol. Model. 2024, 493, 110731. [Google Scholar] [CrossRef]
  81. Hsieh, M.-C.; Huang, G.-H.; Dmitriev, A.V.; Lin, C.-H. Deep Learning Application for Classification of Ionospheric Height Profiles Measured by Radio Occultation Technique. Remote Sens. 2022, 14, 4521. [Google Scholar] [CrossRef]
  82. Barrett, P. Structural Equation Modelling: Adjudging Model Fit. Personal. Individ. Differ. 2007, 42, 815–824. [Google Scholar] [CrossRef]
  83. Sheil, D.; Bongers, F. Interpreting Forest Diversity–Productivity Relationships: Volume Values, Disturbance Histories and Alternative Inferences. For. Ecosyst. 2020, 7, 6. [Google Scholar] [CrossRef]
  84. Wang, J.; Wang, H.; Ding, Y.; Zhang, Y.; Cong, W.; Zang, R.; Liu, S. Shifting Cultivation and Logging Change Soil Organic Carbon Functional Groups in Tropical Lowland Rainforests on Hainan Island in China. For. Ecol. Manag. 2023, 549, 121447. [Google Scholar] [CrossRef]
  85. Wang, W.; Pechacek, P.; Zhang, M.; Xiao, N.; Zhu, J.; Li, J. Effectiveness of Nature Reserve System for Conserving Tropical Forests: A Statistical Evaluation of Hainan Island, China. PLoS ONE 2013, 8, e57561. [Google Scholar] [CrossRef]
  86. Wang, S.; Xie, C. Securing the Future of Hainan’s Tropical Rainforest: Challenges and Strategies for Conservation. Front. For. Glob. Change 2025, 8, 1576900. [Google Scholar] [CrossRef]
  87. Yang, L.; Peng, Y.; Zhu, G.; Yue, F.; Zhao, X.; Fu, J. The Landscape Pattern Evolution and Ecological Security Pattern Construction under the Interference of Transportation Network in National Park. Forests 2025, 16, 1393. [Google Scholar] [CrossRef]
  88. Baccini, A.; Walker, W.; Carvalho, L.; Farina, M.; Sulla-Menashe, D.; Houghton, R.A. Tropical Forests Are a Net Carbon Source Based on Aboveground Measurements of Gain and Loss. Science 2017, 358, 230–234. [Google Scholar] [CrossRef] [PubMed]
  89. Ameray, A.; Bergeron, Y.; Valeria, O.; Montoro Girona, M.; Cavard, X. Forest Carbon Management: A Review of Silvicultural Practices and Management Strategies across Boreal, Temperate and Tropical Forests. Curr. For. Rep. 2021, 7, 245–266. [Google Scholar] [CrossRef]
  90. Dislich, C.; Keyel, A.C.; Salecker, J.; Kisel, Y.; Meyer, K.M.; Auliya, M.; Barnes, A.D.; Corre, M.D.; Darras, K.; Faust, H.; et al. A Review of the Ecosystem Functions in Oil Palm Plantations, Using Forests as a Reference System. Biol. Rev. 2017, 92, 1539–1569. [Google Scholar] [CrossRef]
  91. Guillaume, T.; Kotowska, M.M.; Hertel, D.; Knohl, A.; Krashevska, V.; Murtilaksono, K.; Scheu, S.; Kuzyakov, Y. Carbon Costs and Benefits of Indonesian Rainforest Conversion to Plantations. Nat. Commun. 2018, 9, 2388. [Google Scholar] [CrossRef]
  92. Liao, C.; Luo, Y.; Fang, C.; Li, B. Ecosystem Carbon Stock Influenced by Plantation Practice: Implications for Planting Forests as a Measure of Climate Change Mitigation. PLoS ONE 2010, 5, e10867. [Google Scholar] [CrossRef]
  93. Jaeger, J.A.G.; Schwarz-von Raumer, H.-G.; Esswein, H.; Müller, M.; Schmidt-Lüttmann, M. Time Series of Landscape Fragmentation Caused by Transportation Infrastructure and Urban Development—A Case Study from Baden-Württemberg, Germany. Ecol. Soc. 2007, 12, 22. [Google Scholar] [CrossRef]
  94. Selva, N.; Kreft, S.; Kati, V.; Schluck, M.; Jonsson, B.-G.; Mihok, B.; Okarma, H.; Ibisch, P.L. Roadless and Low-Traffic Areas as Conservation Targets in Europe. Environ. Manag. 2011, 48, 865–877. [Google Scholar] [CrossRef]
  95. Asner, G.P.; Knapp, D.E.; Martin, R.E.; Tupayachi, R.; Anderson, C.B.; Mascaro, J.; Sinca, F.; Chadwick, K.D.; Higgins, M.; Farfan, W.; et al. Targeted Carbon Conservation at National Scales with High-Resolution Monitoring. Proc. Natl. Acad. Sci. USA 2014, 111, E5016–E5022. [Google Scholar] [CrossRef]
  96. Haddad, N.M.; Brudvig, L.A.; Clobert, J.; Davies, K.F.; Gonzalez, A.; Holt, R.D.; Lovejoy, T.E.; Sexton, J.O.; Austin, M.P.; Collins, C.D.; et al. Habitat Fragmentation and Its Lasting Impact on Earth’s Ecosystems. Sci. Adv. 2015, 1, e1500052. [Google Scholar] [CrossRef]
  97. Ordway, E.M.; Asner, G.P. Carbon Declines along Tropical Forest Edges Correspond to Heterogeneous Effects on Canopy Structure and Function. Proc. Natl. Acad. Sci. USA 2020, 117, 7863–7870. [Google Scholar] [CrossRef]
  98. Dissanayake, D.M.N.J.; Zhai, D.-L.; Dossa, G.G.O.; Shi, J.; Luo, Q.; Xu, J. Roads as Drivers of Above-Ground Biomass Loss at Tropical Forest Edges in Xishuangbanna, Southwest China. Land Degrad. Dev. 2019, 30, 1325–1335. [Google Scholar] [CrossRef]
  99. Griscom, B.W.; Adams, J.; Ellis, P.W.; Houghton, R.A.; Lomax, G.; Miteva, D.A.; Schlesinger, W.H.; Shoch, D.; Siikamäki, J.V.; Smith, P.; et al. Natural Climate Solutions. Proc. Natl. Acad. Sci. USA 2017, 114, 11645–11650. [Google Scholar] [CrossRef] [PubMed]
  100. Barber, C.P.; Cochrane, M.A.; Souza, C.M.; Laurance, W.F. Roads, Deforestation, and the Mitigating Effect of Protected Areas in the Amazon. Biol. Conserv. 2014, 177, 203–209. [Google Scholar] [CrossRef]
  101. de Avila, A.L.; van der Sande, M.T.; Dormann, C.F.; Peña-Claros, M.; Poorter, L.; Mazzei, L.; Ruschel, A.R.; Silva, J.N.M.; de Carvalho, J.O.P.; Bauhus, J.; et al. Disturbance Intensity Is a Stronger Driver of Biomass Recovery than Remaining Tree-Community Attributes in a Managed Amazonian Forest. J. Appl. Ecol. 2018, 55, 1647–1657. [Google Scholar] [CrossRef]
  102. Razafindratsima, O.H.; Brown, K.A.; Carvalho, F.; Johnson, S.E.; Wright, P.C.; Dunham, A.E. Edge Effects on Components of Diversity and Above-Ground Biomass in a Tropical Rainforest. J. Appl. Ecol. 2018, 55, 977–985. [Google Scholar] [CrossRef]
  103. Chaplin-Kramer, R.; Ramler, I.; Sharp, R.; Haddad, N.M.; Gerber, J.S.; West, P.C.; Mandle, L.; Engstrom, P.; Baccini, A.; Sim, S.; et al. Degradation in Carbon Stocks near Tropical Forest Edges. Nat. Commun. 2015, 6, 10158. [Google Scholar] [CrossRef]
  104. Ewers, R.M.; Orme, C.D.L.; Pearse, W.D.; Zulkifli, N.; Yvon-Durocher, G.; Yusah, K.M.; Yoh, N.; Yeo, D.C.J.; Wong, A.; Williamson, J.; et al. Thresholds for Adding Degraded Tropical Forest to the Conservation Estate. Nature 2024, 631, 8022. [Google Scholar] [CrossRef]
  105. Ranglong, A.; Dutta Roy, A.; Das, S.; Deb, S. Estimating Aboveground Biomass and Biodiversity of a Protected Area in Moist Tropical Forest Ecosystem Using Remote Sensing Application. J. Nat. Conserv. 2025, 84, 126823. [Google Scholar] [CrossRef]
  106. Oberleitner, F.; Egger, C.; Oberdorfer, S.; Dullinger, S.; Wanek, W.; Hietz, P. Recovery of Aboveground Biomass, Species Richness and Composition in Tropical Secondary Forests in SW Costa Rica. For. Ecol. Manag. 2021, 479, 118580. [Google Scholar] [CrossRef]
  107. Poorter, L.; Craven, D.; Jakovac, C.C.; van der Sande, M.T.; Amissah, L.; Bongers, F.; Chazdon, R.L.; Farrior, C.E.; Kambach, S.; Meave, J.A.; et al. Multidimensional Tropical Forest Recovery. Science 2021, 374, 1370–1376. [Google Scholar] [CrossRef]
  108. Silva Junior, C.H.L.; Aragão, L.E.O.C.; Anderson, L.O.; Fonseca, M.G.; Shimabukuro, Y.E.; Vancutsem, C.; Achard, F.; Beuchle, R.; Numata, I.; Silva, C.A.; et al. Persistent Collapse of Biomass in Amazonian Forest Edges Following Deforestation Leads to Unaccounted Carbon Losses. Sci. Adv. 2020, 6, eaaz8360. [Google Scholar] [CrossRef]
  109. Fassnacht, F.E.; White, J.C.; Wulder, M.A.; Næsset, E. Remote Sensing in Forestry: Current Challenges, Considerations and Directions. For. Int. J. For. Res. 2024, 97, 11–37. [Google Scholar] [CrossRef]
  110. Frolking, S.; Palace, M.W.; Clark, D.B.; Chambers, J.Q.; Shugart, H.H.; Hurtt, G.C. Forest Disturbance and Recovery: A General Review in the Context of Spaceborne Remote Sensing of Impacts on Aboveground Biomass and Canopy Structure. J. Geophys. Res. Biogeosciences 2009, 114, G00E02. [Google Scholar] [CrossRef]
Figure 1. Study area. (a) Geographic location of Hainan Island within China, with national and prefecture-level boundaries indicated. (b) Administrative divisions of Hainan Province, with the boundary of Jianfengling National Park highlighted. (c) Digital Elevation Model (DEM) of Jianfengling, showing the topographic characteristics of the study area.
Forests 16 01611 g001
Figure 2. Research framework. (A) Data collection and preprocessing from multi-source datasets. (B) AGB modeling using feature selection and machine learning. (C) HII construction integrating socioeconomic and land-use factors. (D) Coupled analyses between AGB and HII, including spatiotemporal variation, spatial autocorrelation, and path-driven mechanisms. S1, Sentinel-1. S2, Sentinel-2.
Forests 16 01611 g002
Figure 3. Top 15 predictor variables identified through a voting-based selection across six models. For texture features, bands without suffixes correspond to a 3 × 3 window; suffix “1” indicates a 5 × 5 window; and suffix “2” indicates a 7 × 7 window.
Forests 16 01611 g003
Figure 4. Observed vs. predicted aboveground biomass (AGB) for six machine learning models: (a) Extreme Gradient Boosting (XGBoost), (b) Support Vector Machine (SVM), (c) Random Forest (RF), (d) k-Nearest Neighbors (KNN), (e) Gradient Boosting Machine (GBM), and (f) Decision Tree (DT). Model performance is evaluated using the coefficient of determination (R2), adjusted coefficient of determination (Adj. R2), root mean square error (RMSE), mean absolute error (MAE), and five-fold cross-validation (CV, reported as mean ± standard deviation). The solid grey line indicates the regression fit; the dashed line is the 1:1 reference. The color bar denotes the residuals (Residual), with darker colors representing larger prediction errors.
Forests 16 01611 g004
Figure 5. The AGB baseline of the JFLTLR from 2015 to 2023: higher along central ridges, lower in lowlands.
Forests 16 01611 g005
Figure 6. Biannual spatial variation in anthropogenic factors in the Jianfengling tropical lowland rainforest (JFLTLR) from 2015 to 2023.
Forests 16 01611 g006
Figure 7. (a) Weights of human-activity factors (2015–2023). HII maps: (b) 2015—higher in the south–southeast, lower in the north; (c) 2017—overall decline with contracted high-value belts; (d) 2019—continued decline with hotspots scattered along edges; (e) 2021—short-term rebound with corridor intensification and greater fragmentation; (f) 2023—declines again with residual edge hotspots.
Forests 16 01611 g007
Figure 8. The red line in third column in the Moran’s scatter plots represents the fitted regression line indicating the relationship between AGB and HII. (a) 2015: AGB and HII show a weak negative association, with High–High clusters (high AGB–high HII) concentrated in the central area and Low–Low clusters (low AGB–low HII) distributed mainly in the southwest margin. (b) 2017: The negative association strengthens, with Low–Low clusters expanding along the periphery and a reduction in High–High clusters. (c) 2019: The negative coupling peaks, with extensive Low–Low clusters dominating the southwest and western edges, indicating strong human disturbance. (d) 2021: The relationship weakens, with some High–High clusters reappearing in the central conservation zones, suggesting partial biomass recovery under protection policies. (e) 2023: Negative coupling re-emerges, with Low–Low clusters persisting along the outer edges though less pronounced than in 2019.
Forests 16 01611 g008
Figure 9. Threshold detection and validation of the ΔAGB–ΔHII relationship. (a) Piecewise fit of ΔAGB (mg·ha−1) against ΔHII using hexagonal binning density (color indicates log10 count). The vertical blue dashed line marks the estimated breakpoint (τ ≈ 0.1712; 95% CI shown in-panel). The orange line represents the fitted slope after the breakpoint, while the blue segment before the breakpoint indicates the lower-slope portion of the piecewise model. (b) Placebo (pre-only) test, where the red line denotes the fitted regression line showing no significant threshold pattern. ΔAGB = change in aboveground biomass (mg·ha−1); ΔHII = change in Human Influence Index; “post–pre” denotes the difference between post-disturbance and pre-disturbance periods; color scale represents point density.
Forests 16 01611 g009
Figure 10. Analysis of the driving path of human activities from 2015 to 2023 based on PLS-SEM.
Forests 16 01611 g010
Figure 11. Artificial forest dynamics in JFLTLR [57]. (a) The green legend represents the coverage area in 2023, while the red one shows the coverage area in 2015. (b) Ratio of artificial forests to total area.
Forests 16 01611 g011
Figure 12. Disturbance centroid ellipses: shift from the southern margin to the central belt, peaking around 2021; a slight back-shift in 2023 keeps the centroid within the central corridor.
Forests 16 01611 g012
Table 1. Global bivariate Moran’s I between AGB and spatially lagged HII (W·HII), 2015–2023.
YearBivariate Moran’s Ip ValueDirectionSignificant
2015−0.1411<0.0001NegativeTRUE
2017−0.2553<0.0001NegativeTRUE
2019−0.2976<0.0001NegativeTRUE
20210.1455<0.0001PositiveTRUE
2023−0.1488<0.0001NegativeTRUE
Positive I: like-with-like (HH/LL); negative I: dissimilar (HL/LH). Computed for AGB vs. spatially lagged HII (W·HII).
Disclaimer/Publisher’s Note: The statements, opinions and data contained in all publications are solely those of the individual author(s) and contributor(s) and not of MDPI and/or the editor(s). MDPI and/or the editor(s) disclaim responsibility for any injury to people or property resulting from any ideas, methods, instructions or products referred to in the content.