Article

Feasibility of a Low-Cost MEMS Accelerometer for Tree Dynamic Stability Analysis: A Comparative Study with Seismic Sensors

by
Ilaria Incollu
1,*,
Andrea Giachetti
2,
Yamuna Giambastiani
3,4,5,
Hervè Atsè Corti
3,
Francesca Giannetti
3,4,5,
Gianni Bartoli
2,
Irene Piredda
6 and
Filippo Giadrossich
1
1
Department of Agricultural Sciences, University of Sassari, 07100 Sassari, Italy
2
Department of Civil and Environmental Engineering, University of Florence, 50126 Florence, Italy
3
Bluebiloba Startup Innovativa SRL, 50126 Florence, Italy
4
Geolab Laboratory of Forest Geomatics, Department of Agriculture, Food, Environment and Forestry, University of Florence, 50145 Florence, Italy
5
ForTech Laboratorio Congiunto, University of Florence, 50145 Florence, Italy
6
Elighes SRL, 08100 Nuoro, Italy
*
Author to whom correspondence should be addressed.
Forests 2025, 16(10), 1572; https://doi.org/10.3390/f16101572 (registering DOI)
Submission received: 13 August 2025 / Revised: 22 September 2025 / Accepted: 28 September 2025 / Published: 11 October 2025
(This article belongs to the Section Forest Inventory, Modeling and Remote Sensing)

Abstract

Urban trees are subjected to stressful conditions caused by anthropogenic, biotic, and abiotic factors. These stressors can cause structural changes, increasing the risks of branch failure or even complete uprooting. To mitigate the risks to people’s safety, administrators must assess and evaluate the health and structural stability of trees. Risk analysis typically takes into account environmental vulnerability and tree characteristics, assessed at a specific point in time. However, although dynamic tests play a crucial role in risk assessment in urban environments, the high cost of the sensors significantly limits their widespread application across large tree populations. For this reason, the present study aims to evaluate the effectiveness of low-cost sensors in monitoring tree dynamics. A low-cost micro-electro-mechanical systems (MEMS) sensor is tested in the laboratory and the field using a pull-and-release test, and its performance is compared with that of seismic reference accelerometers. The collected data are analyzed and compared in terms of both the frequency and time domains. To obtain reliable measurements, the accelerations must be generated by substantial dynamic excitations, such as high wind events or abrupt changes in loading conditions. The results show that the MEMS sensor has lower accuracy and higher noise compared to the seismic sensor; however, the MEMS can still identify the main peaks in the frequency domain compared to the seismic sensor, provided that the input amplitude is sufficiently high.

1. Introduction

Urban forests and urban trees are a key components of the urban socio-ecological system, as highlighted by many policies, such as the European Union’s pledge to plant three billion additional Trees by 2030 [1]. They are considered a fundamental nature-based solution in urban planning, providing a wide range of ecosystem services, including air pollution removal [2], carbon sequestration [3], noise abatement [4], and microclimate regulation [5].
However, as noted by Portoghesi et al. [6] and in other studies [7,8,9,10], urban trees can also create problems, such as damage caused by falling trees or large branches during wind events [6,7,10]. These risks can be exacerbated by anthropogenic pressures and biotic or abiotic stress factors [11], including soil compaction, limited root volumes, and pruning, which often lead to structural alterations and reduced mechanical stability. Understanding how external factors influence tree stability is therefore crucial. However, due to the complex interactions between tree physiology, environmental conditions, and human-induced stressors, obtaining reliable and site-specific data remains a significant challenge  [11,12]. In addition to the crown and stem characteristics, the root system plays a fundamental role in controlling tree sway and overall stability. Importantly, damage to roots may require decades to recover, as shown by studies on post-disturbance root reinforcement dynamics  [13], underscoring the need to account for temporal changes in root anchorage when evaluating urban tree risk and designing long-term management strategies.
Tree health and structural integrity in urban areas require careful planning and continuous monitoring [14,15] to reduce hazards to citizens and infrastructure. For this purpose, urban administrators often rely on visual tree assessment [16] and one-time instrument measurements to evaluate stability. These assessments determine where interventions are needed, such as pruning, structural support (e.g., cabling or bracing), or, in severe cases, tree removal. Technicians also assign a stability class, defining the recommended interval for reassessment (e.g., 1, 2, or 5 years), depending on the risk level. Even in the best cases, such evaluations are typically annual and focus mainly on trees already identified as problematic. No data are collected between assessments, making it impossible to detect changes in health or structural stability over time [17].
To overcome this limitation, a recent study [18] has focused on developing techniques for dynamic stability monitoring, primarily targeting the root system [19]. Methodologies used to analyze tree–wind interactions and assess failure risk include controlled experiments such as static pulling tests simulating wind loading to evaluate root plate anchorage and wind tunnel tests [20,21]. For in situ monitoring, high-precision sensors such as inclinometers and accelerometers are increasingly employed to determine key dynamic parameters, including the natural frequency and damping ratio, which are considered vital in assessing tree stability [22,23].
In dynamic analysis, in addition to static forces, other components, such as inertial forces due to motion, damping forces, energy dissipation, displacements and phase differences, natural frequencies, and resulting changes, must be considered [24]. Among the measurable parameters, tree oscillations are particularly suitable for monitoring, as they provide valuable insights into biomechanical responses to dynamic loads like wind [25]. Damping forces indicate energy dissipation mechanisms, while root mean square (RMS) values in signal processing provide an overall measure of vibrational energy [26]. These parameters, measured under different conditions, natural wind, pull and release, or wind tunnel experiments, offer complementary insights into the mechanical behavior of trees [18]. The relatively high damping observed in trees is consistent with their multimodal vibration responses, where multiple oscillation modes contribute to energy dissipation [23,27,28]. Studies by Gardiner and Fournier [29,30] have shown that the size, shape, and internal properties of a tree’s wood result from the forces applied to it, and that these developmental responses enhance its ability to resist loads.
In recent years, the development of new sensors capable of continuously monitoring wind effects on trees has shown promise in establishing effective monitoring systems  [18,31]. However, despite advances in sensor technology, relatively few studies have investigated the relationships between these dynamic parameters and tree health or risk of failure [22,23]. For example, Mayer [32] used accelerometers to identify the first harmonic peak in the frequency spectrum, suggesting that it could be altered to reduce the risk of storm damage through pruning or structural reinforcement. Sellier [33] used tilt sensors to examine the influence of the canopy architecture on stability, while Van Emmerik [34] emphasized the importance of considering temporal dynamics in sway analysis. Schindler [35] employed biaxial clinometers to measure wind-induced vibrations in Scots pines, indirectly assessing displacements. Dynamic identification was performed by analyzing peaks in the mechanical transfer function, revealing the first natural frequencies below 1 Hz.
While previous studies have demonstrated the value of high-precision instruments for tree dynamic stability assessment, their high cost and logistical demands limit their suitability for large-scale urban monitoring. This underscores the need for affordable, scalable alternatives that can still capture key dynamic parameters with sufficient accuracy. In this study, we investigate the feasibility of a low-cost micro-electro-mechanical systems (MEMS) accelerometer as a tool for monitoring tree stability. Specifically, we compare the performance of the MEMS sensor with that of two high-accuracy seismic reference sensors through a three-phase experimental design encompassing laboratory validation, preliminary field feasibility testing, and operational field deployment under realistic urban conditions. Our objectives are to (i) evaluate the ability of the MEMS sensor to estimate critical dynamic parameters such as the dominant frequency and damping ratio; (ii) establish minimum operational requirements for reliable data acquisition, including sufficient excitation, signal energy (RMS), an acceptable signal-to-noise ratio, and mounting stability; and (iii) provide an initial framework for assessing the potential of low-cost sensing solutions to support the large-scale, continuous monitoring of urban tree stability.

2. Materials and Methods

2.1. Sensors

To evaluate the performance of the low-cost MEMS sensor, a direct comparison was conducted against two high-performance seismic accelerometers, which served as reference instruments. The sensors used in this study were: (i) the low-cost MEMS sensor, featured on the left side of Figure 1a; (ii) the PCB Piezotronics Model 393B12 (PCB Piezotronics, Inc., Depew, NY, USA) featured on the right side of Figure 1a; and (iii) the PCB Piezotronics Model 356B18, (PCB Piezotronics, Inc., Depew, NY, USA) featured in Figure 1b.
The PCB Piezotronics Model 393B12 is a uniaxial seismic accelerometer with a very high sensitivity of 1019.4 m V /( m / s 2 ) and a relatively limited measurement range of 4.9   m s 2 peak. Its high sensitivity allows it to detect very small vibrations, making it ideal for controlled conditions where signal amplitudes are low. For this reason, it was selected for the laboratory tests, where precise measurements of small-amplitude oscillations were required for a robust comparison with the MEMS sensor. Using a sensor with a wider range in this context could have resulted in a loss of resolution on finer signals.
The PCB Piezotronics Model 356B18 is a triaxial seismic accelerometer with a lower sensitivity of 102 m V /( m / s 2 ) (approximately 10 times less sensitive than the 393B12) but a significantly wider measurement range of 49 m s 2 peak. This wider range makes it suitable for managing higher accelerations without signal saturation (clipping). It was therefore chosen for the field tests, where forces induced by pulling tests can generate large-amplitude oscillations that would likely saturate the more sensitive 393B12 model. Although less sensitive, its signal amplitude was sufficient to provide a reliable reference for comparison with the MEMS sensor in outdoor environments.
The low-cost sensor is a wireless prototype instrument, featuring an STMicroelectronics MEMS triaxial chip. The device has a configurable full-scale acceleration range of ± 19.6   m s 2 . Data are transmitted wirelessly via a Wi-Fi network to a server. Its dual power capabilities, operating on either a battery for portability or continuous power for permanent installations, makes it highly versatile for different monitoring contexts. For the present research, the battery power option was selected for all phases of the study.

2.2. Experimental Design

Dynamic pulling tests followed established methodologies for assessing tree stability as described in the literature [16,36,37,38].
To compare accelerometer sensors, a three-phase evaluation was performed, including initial laboratory tests, preliminary field tests to assess the setup and feasibility, and operational field tests to evaluate performance under realistic urban environmental conditions. In detail, the experimental design was structured to progressively move from controlled to realistic urban tree conditions. Since this study represents the first phase of a research project based on MEMS technology for urban tree risk assessment, the sensors were tested in controlled environments (such as a university campus), where potential risks of damage could be minimized.
During the laboratory and preliminary tests, the sensor’s Z-axis was aligned with the pull direction, while, for the operational tests, the X-axis was used. This change in the axis of interest occurred because the MEMS sensor was fitted with a new protective case for the final field deployment. An examination of the case revealed that the sensor’s internal board had been mounted in a different orientation. Crucially, this modification did not compromise data comparability, as the analysis for all tests consistently utilized data from the sensor axis that was physically aligned with the direction of the applied force. The mounting height was selected to reflect realistic urban deployments and to minimize installation and maintenance costs; it allows operator access for periodic battery replacement and inspections without specialized lifting equipment, reduces exposure to casual tampering, and ensures a sufficient lever arm so that sway-induced accelerations at the sensor exceed the background noise floor, enabling robust dynamic identification.

2.2.1. Laboratory Tests

The controlled environment laboratory tests were performed in the “Materials and Structural Testing Laboratory” of the Civil and Environmental Department of the University of Florence.
The laboratory tests were conducted comparing the MEMS sensor with a cabled high-sensitivity PCB Piezotronics Model 393B12 seismic sensor, on a simple mechanical system, as shown in Figure 2a. The setup consisted of a steel cantilever beam, approximately 140 c m in length with a rectangular cross-section of 50 m m × 5 m m . To achieve a variable-free length, the beam was firmly fixed to a rigid and stable workbench at different points. Two accelerometers were mounted on the beam’s free end at the same distance from the fixed point (Figure 2b).
Two tests were performed: LAB-1, using just the beam, and LAB-2, adding a concentrated mass close to the sensors (Table 1). The tests were carried out by imposing an initial deflection and then releasing the beam, thereby measuring the damped free oscillations. The low-cost sensor was set to sample at 26 Hz , and the high-cost sensor at 4800 Hz .

2.2.2. Preliminary Field Tests

Preliminary field tests were carried out on black alders (Alnus glutinosa L.), which were part of an arboricultural planting stand near Lucardo, nestled in the eastern hills of Valdelsa within the municipality of Montespertoli, Tuscany, Italy (Figure 3).
The arboricultural planted stand, approximately 20 years old, has a mixed composition of trees, including black alders (Alnus glutinosa L.), walnut (Juglans regia L.), and wild cherry (Prunus avium L.), and it is more exposed to south winds.
The tree crowns are in contact with each other, and trees selected for the tests are in a codominant position, with a height of approximately 11.70   m and a diameter at breast height (DBH) of 20 c m .
A total of ten preliminary tests were performed on a single tree using various approaches, measuring the ambient vibration, mechanical impulses, and pull-and-release configurations with variations in force and direction (Table 1). These tests aimed to identify suitable excitation methods and sensor settings for subsequent field operational tests. The sensors were placed at a height of 220 c m , while the pulling height was 400 c m . The setup ensured synchronized acquisition between accelerometers and the load cell. In preliminary tests, the acquisition system was configured to start recording only when the measured acceleration exceeded a predefined threshold of 0.98   m s 2 . In most cases, the low-cost sensor failed to trigger activation due to an insufficient threshold or started recording after release, causing the loss of relevant data. However, this test provided useful information for the setup of the operational test, as the threshold was subsequently lowered. It is important to note that the initial tests were not designed to generate dynamic outcomes directly comparable with those of the operational phase. Instead, they functioned as a methodological step to validate the measurement protocol, optimize trigger thresholds, and verify sensor synchronization. This preparatory stage was therefore essential to ensure that subsequent operational field tests could be carried out under stable and reliable acquisition conditions.

2.2.3. Operational Field Tests

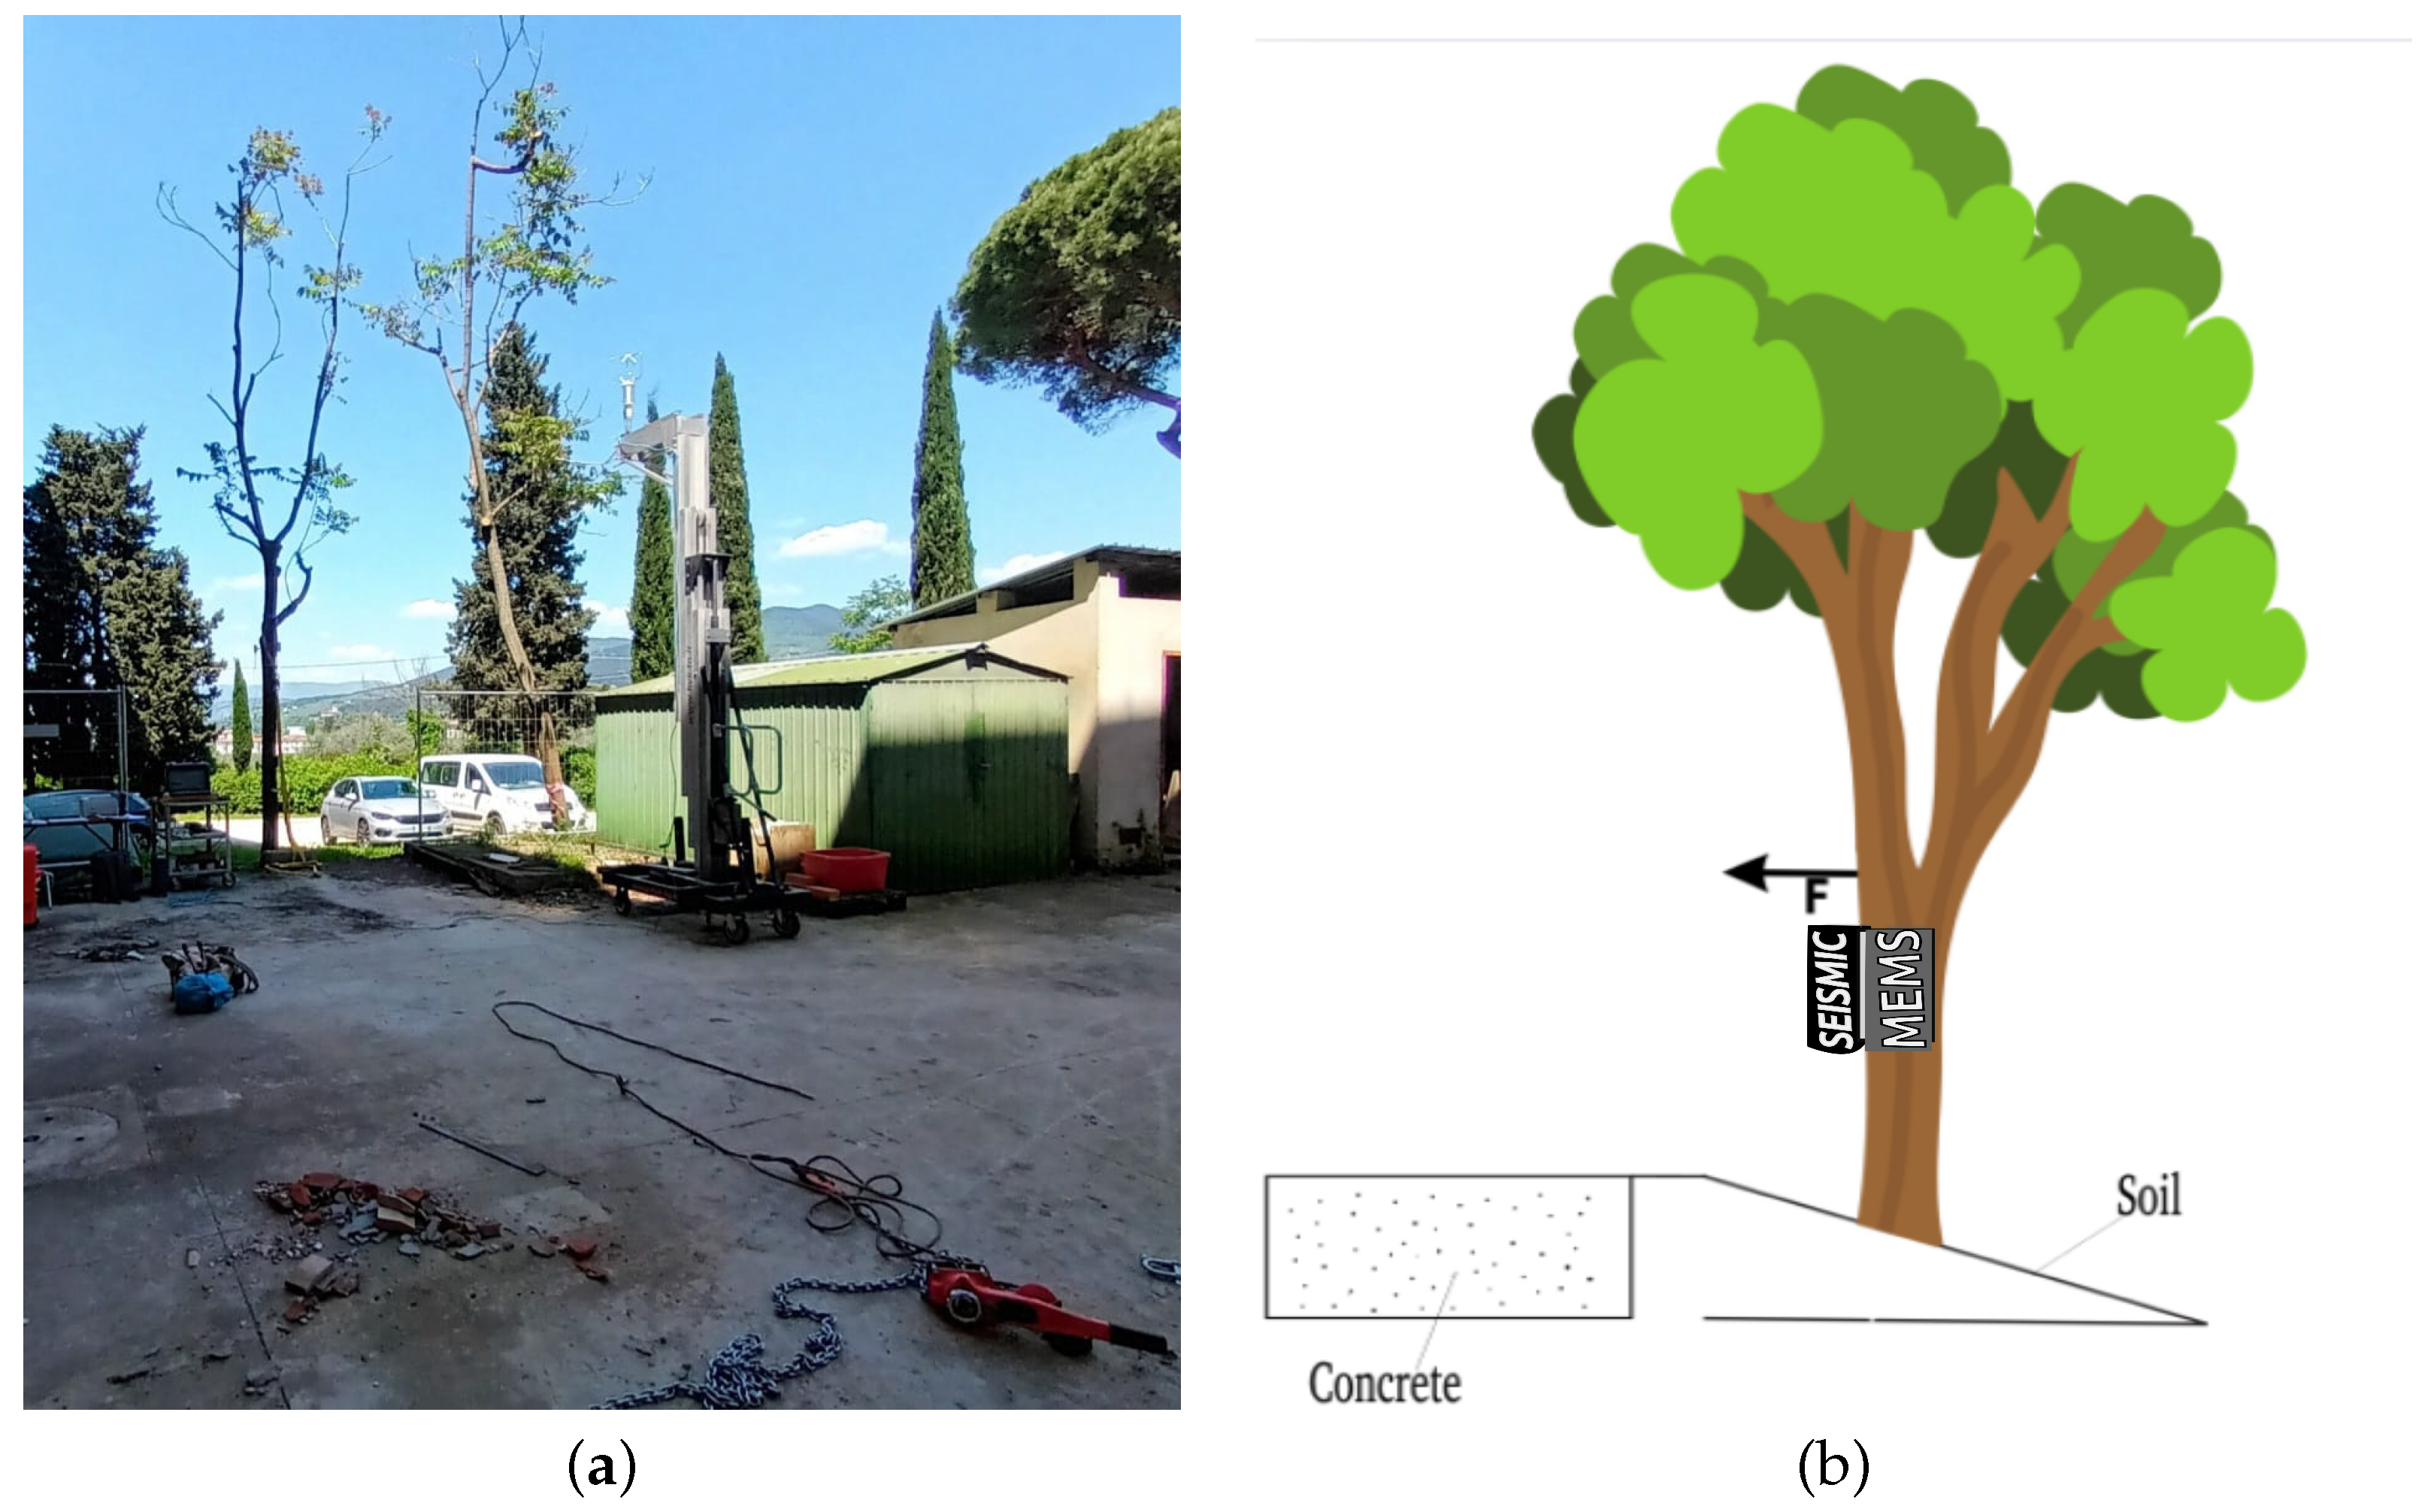
Operational tests were performed on a recently pruned urban tree of Ailanthus altissima Mill., commonly known as the Tree of Heaven, located in the Department of Civil and Environmental Engineering of the University of Florence. The experimental setup is shown in Figure 4. The tree had a diameter at breast height (DBH) of 17.5   c m , a total height of 11 m and a crown area of 5 m 2 , with the diameters measured using a caliper, the height with a Vertex hypsometer, and the crown area derived from manual delineation on an orthophoto. It was located on a slope with an average inclination of approximately 20%. The terrain conditions differed on either side of the tree: on the side opposite to the pulling direction, the root system was embedded in the soil, while, in the direction of the applied force, the tree faced a compacted industrial surface. These growing conditions are comparable to those found in urban environments, such as in trees planted along streets.
The low-cost MEMS sensors and the seismic accelerometer were mounted at the same height 270 c m , while the load cell was mounted at 300 c m . The tree was then subjected to dynamic pull tests, starting with a preliminary test (Test A) to verify sensor functionality, which was not included in the analysis. The subsequent operational tests (Tests B to G) were performed by progressively increasing the pulling force from 200 N to a maximum of 1200 N in increments of 200 N (Table 1). A load cell with a maximum capacity of 50 k N was mounted in line with the pulling cable to record the applied force.

2.3. Data Analysis

Data analysis was conducted following an internal protocol designed to ensure comparability across the laboratory experiments and field tests. The protocol followed established practices reported in previous studies (e.g., [25,38]), with some adjustments necessary to fit the specific experimental conditions. Despite minor discrepancies in data acquisition and processing procedures across the different configurations, a consistent analytical approach was maintained throughout the study.
The protocol included signal preprocessing and filtering procedures through the following steps.
  • A preliminary evaluation of the raw signals was performed in the time domain to detect potential anomalies or malfunctions.
  • The signals from both sensors were processed using customized bandpass filtering strategies, adapted to the specific context. The different filter ranges were tailored to the specific conditions of each environment: the frequencies of the controlled laboratory system (the steel beam) differed from those of the trees, which were measured in a more complex and uncontrolled context. However, given the moderate size of the trees analyzed, it was confirmed that the natural frequency was not filtered out. The same filtering methodology was applied identically to all sensors, ensuring fair, reproducible, and directly comparable results across laboratory and field tests.
  • Specifically, the filtering settings were as follows.
    The low-cost sensor was originally sampled at 26 Hz , and then resampled to 25 Hz to match the target bandwidth of 0 Hz to 12.5 Hz .
    In the laboratory tests, the bandpass filter targeted frequencies in the 0.1 Hz to 10 Hz range.
    In the preliminary field tests, the filter focused on the 0.1 Hz to 5 Hz range to reduce signal noise.
    In the operational field tests, the filter focused on the 0. Hz to 9 Hz range.
  • All signals were detrended to remove linear trends that could affect the subsequent spectral analysis. Following the initial tests and the reduction of the trigger threshold, the background noise floor was evaluated to be approximately 0.049   m s 2 . This value was used to guide data interpretation for all subsequent tests, especially for low-amplitude signals.
The Fast Fourier Transform (FFT) was applied to compare the signals, and the amplitudes were normalized to those of the low-cost sensor to enable direct comparison. However, during the operational tests, the signal duration and quality were insufficient to allow reliable frequency-domain analysis due to the rapid decay in motion and the presence of noise, especially in the MEMS signal. Consequently, the dynamic content was extracted from the time domain by identifying the first three significant peaks of each acceleration signal. The time intervals between these peaks were used to estimate the oscillation period and calculate the corresponding mean frequency. The mean amplitude and mean damping ratio were then determined for all tests; the damping ratio was estimated using the logarithmic decrement method from the free decay of the oscillations. This approach enabled the extraction of key dynamic parameters under transient and noisy signal conditions where the application of the FFT was not feasible. Concerning the results reported in the following, the root mean square (RMS) was calculated for the filtered signals. The signal-to-noise ratio (SNR) was calculated using data from the operational tests. Indeed, the reference value of the noise was estimated using a time window selected from the anemometer data corresponding to a period of calm wind conditions.
The wind speed (U) described in the Discussion section was estimated using an equation commonly adopted in tree biomechanic studies [12], with the rough assumption of a unit drag coefficient ( C d = 1 ):
U = 2 F ρ A C d
where F is the applied force, ρ = 1.225   k g   m 3 is the air density, and A = 5   m 2 is the crown area.

3. Results

3.1. Laboratory Tests

Figure 5 shows the acceleration signals in the time domain, recorded during free damped oscillations of the cantilever beam after release from a deflected position (test LAB-1). The signals exhibit initial oscillations with peak amplitudes within approximately −2 m s 2 to 2 m s 2 , followed by a gradual decay. As illustrated in Figure 6, the beam in question is lightly damped. The high number of oscillation cycles in the system also allows for an analysis of the results in the frequency domain.
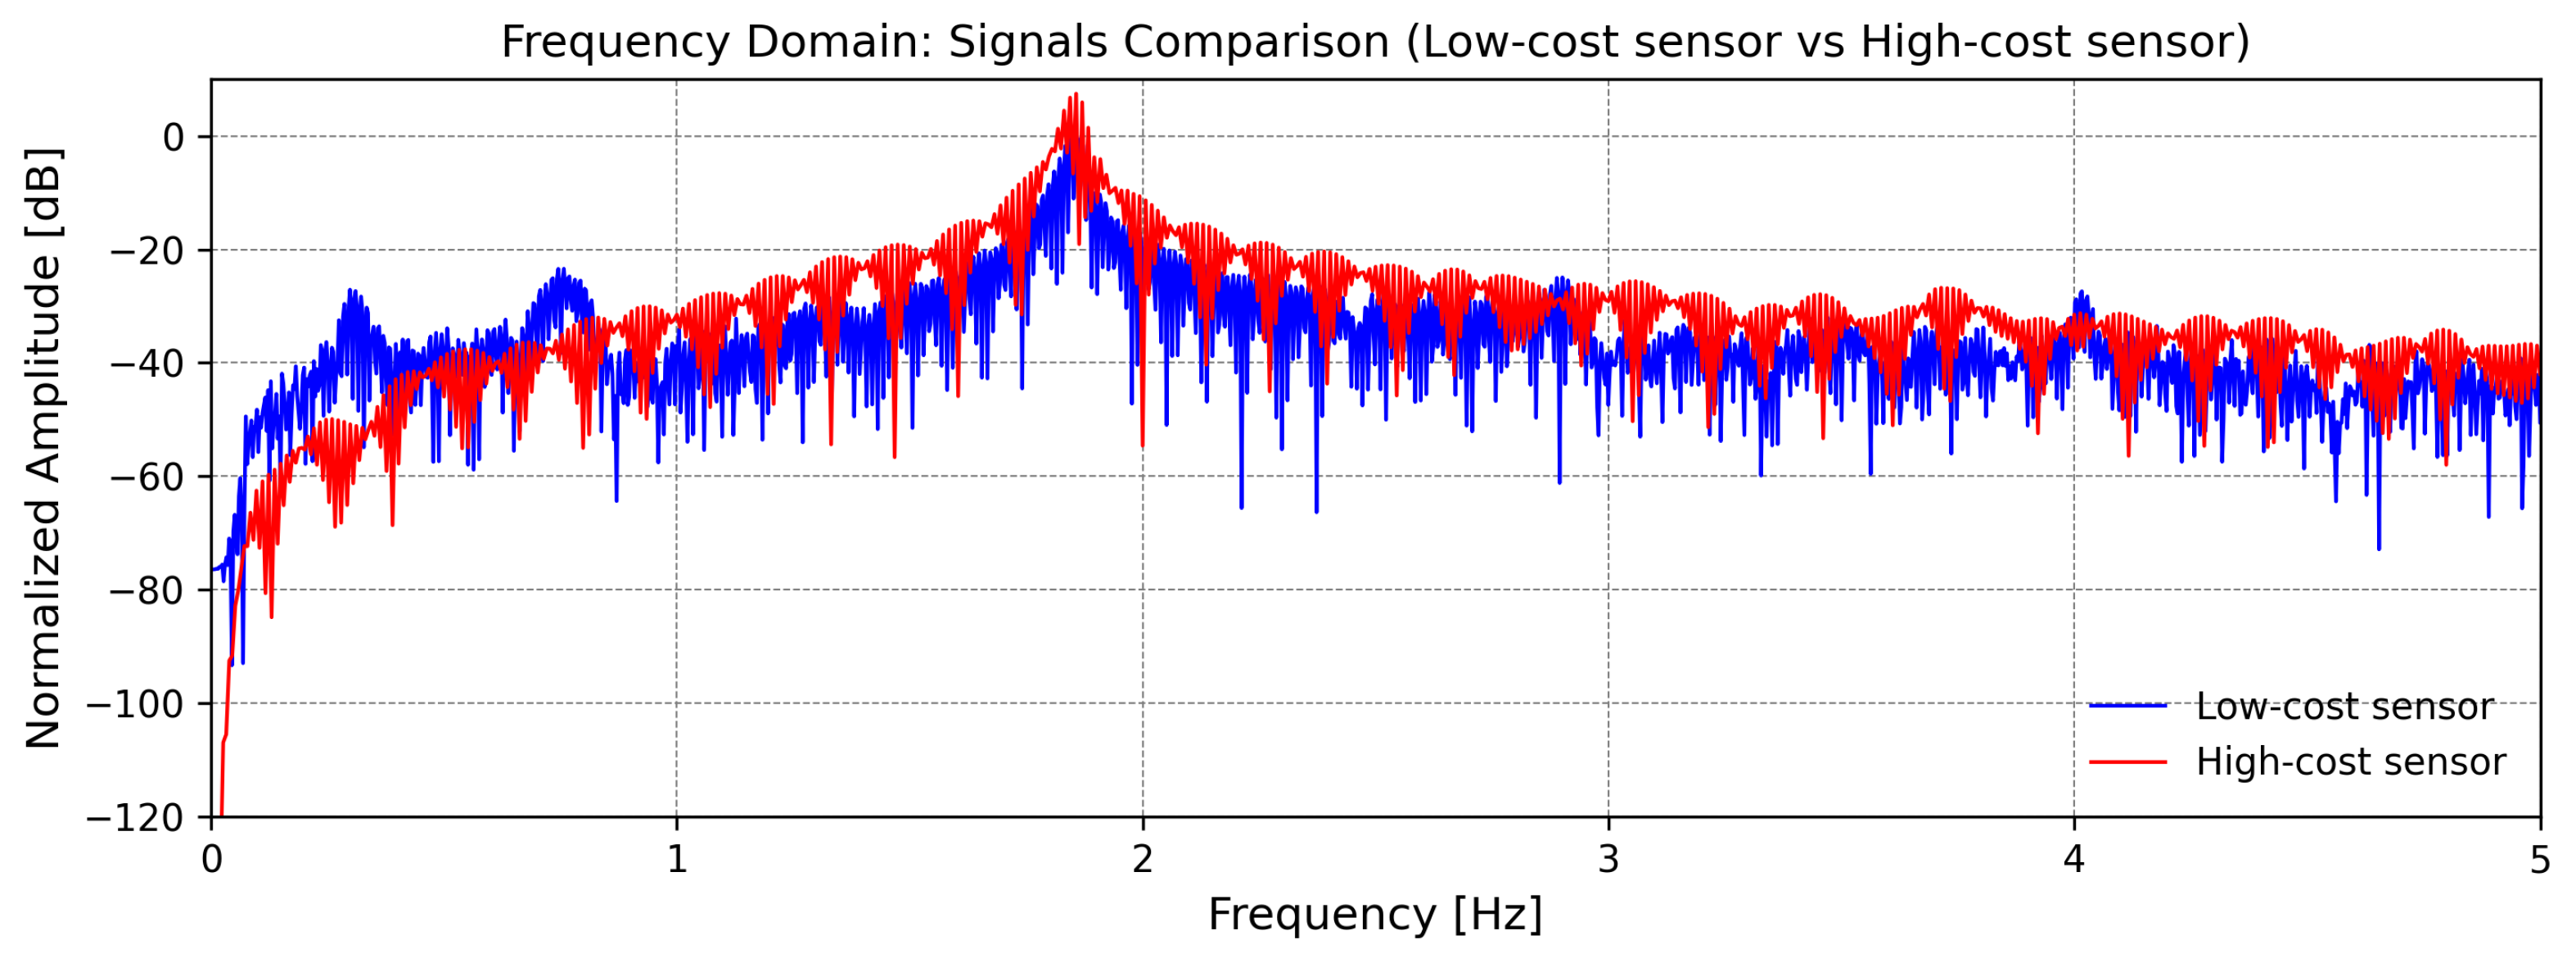
Figure 6 presents the frequency domain spectra of the same signals. A primary frequency peak, corresponding to the natural frequency of the beam, is visible in both spectra at approximately 1.7   Hz . In the low-cost sensor spectrum, additional peaks are visible in the lower frequency range (0–1 Hz) and around 4.0   Hz , which are not present in the high-cost reference sensor. These peaks are attributed to sensor noise and do not correspond to structural vibration modes.
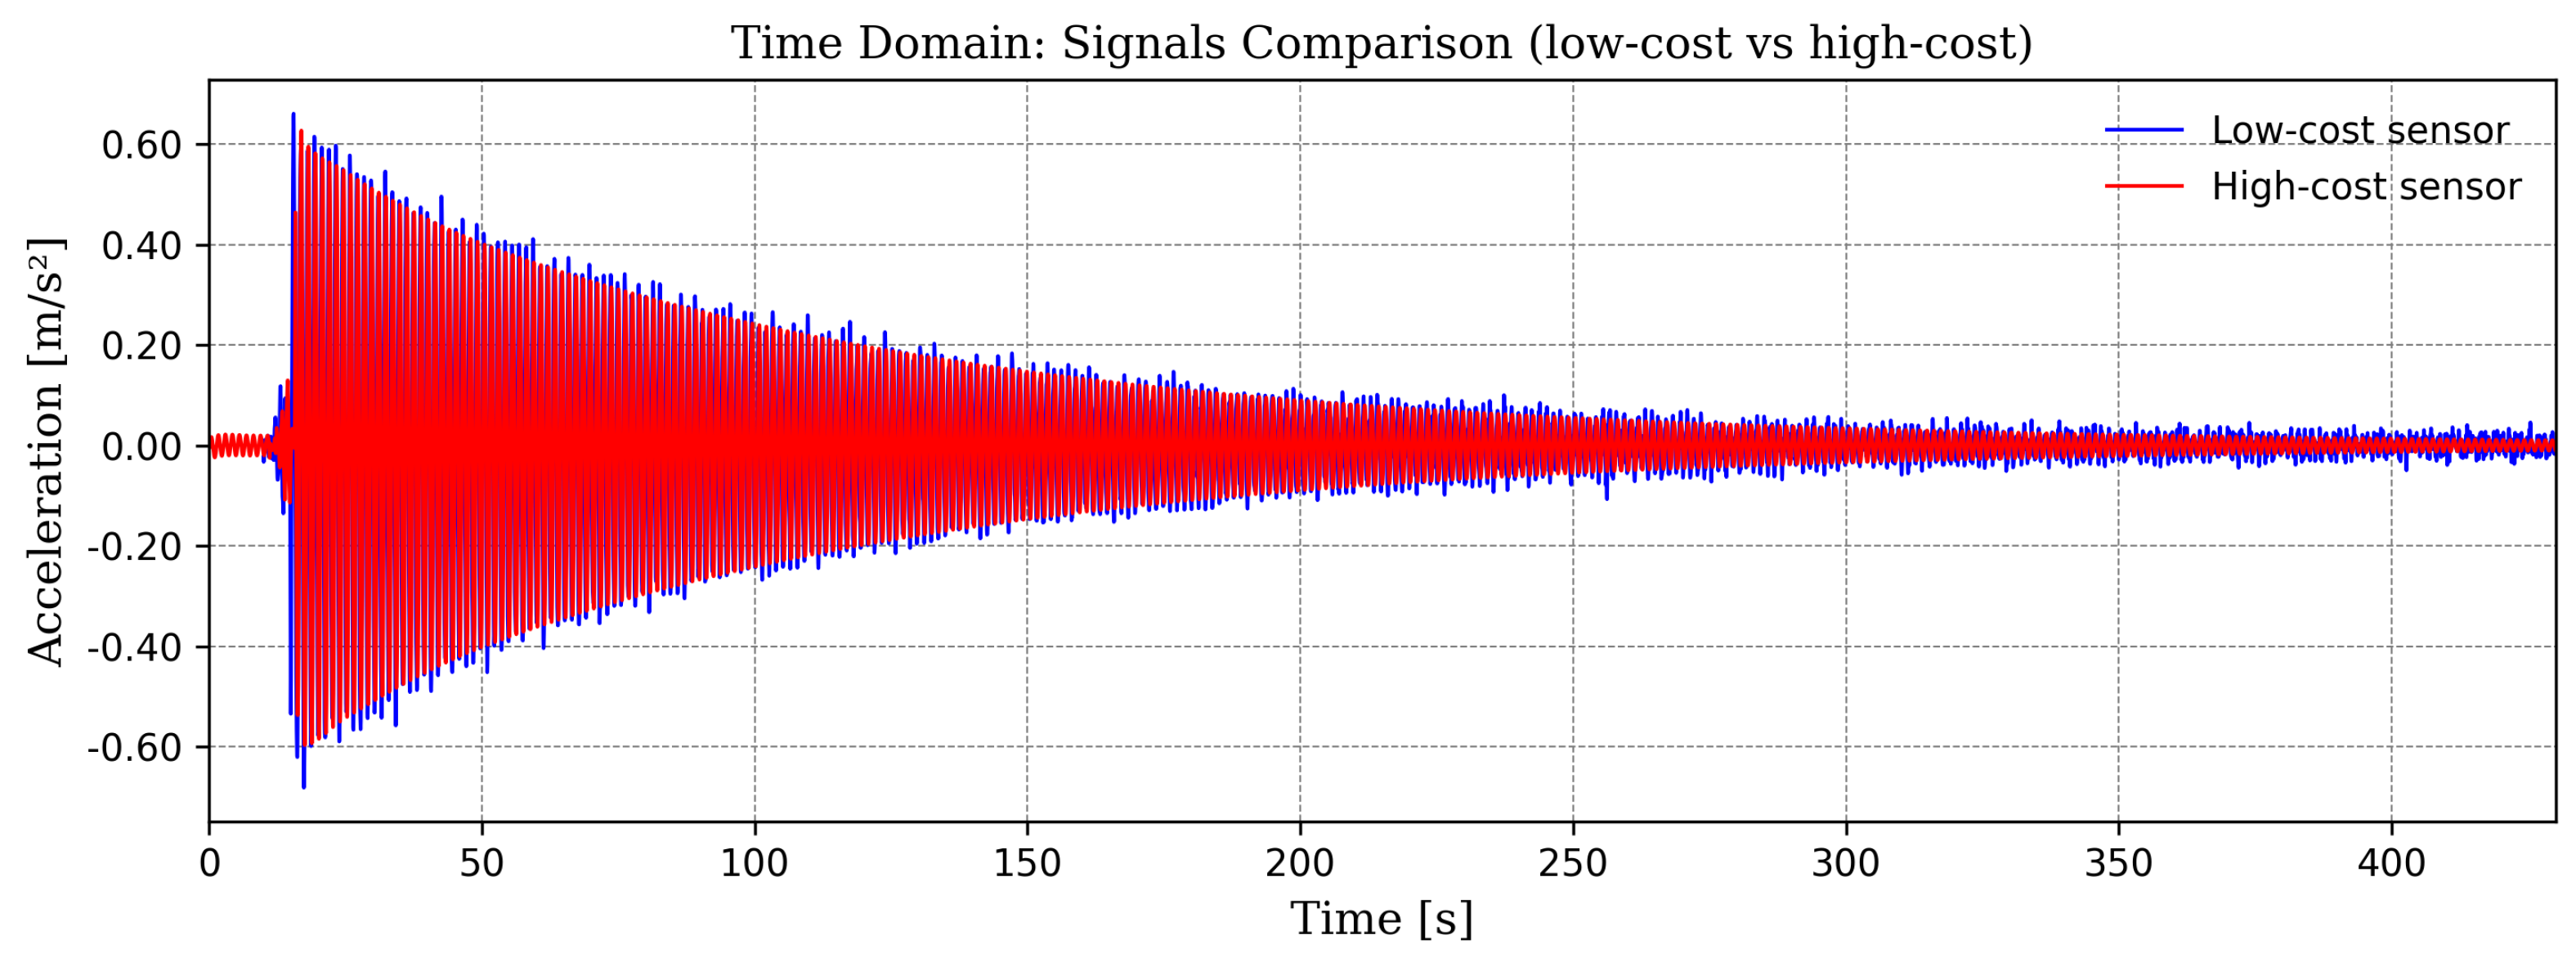
Figure 7 shows the acceleration signals recorded over approximately 400 s during free damped oscillations of the cantilever beam with an additional mass applied (test LAB-2). A series of tests were conducted within a laboratory setting, employing a cantilever beam configuration to assess the performance of the sensors within a frequency range that was compatible with tree dynamics. The system’s high number of oscillation cycles also allows for an analysis of the results in the frequency domain. As illustrated in Figure 5 and Figure 6, the sensors responded coherently to an excitation with a natural frequency near 1.7 Hz. For comparison, Figure 7 and Figure 8 show a representative case of a signal oscillating at a lower frequency, close to 0.74 Hz. In both cases, as expected in a damped system, the initial oscillatory response gradually decays to zero.

3.2. Field Tests

3.2.1. Introduction to Field Tests

In the laboratory test, a beam characterized by a very low damping ratio was used. This allowed for a clear dynamic response and made it easier to perform frequency-domain analyses using the Fast Fourier Transform (FFT). However, when setting up the tests in the field, the damping ratio of the tree system was significantly higher. As a result, the oscillations decayed rapidly, and the signal duration and quality were insufficient to reliably apply FFT-based analysis. Ambient vibrations were initially recorded in an attempt to extract dynamic information from environmental excitations such as wind. However, the background noise of the MEMS sensors, combined with the low amplitude of these natural excitations, made it impossible to identify meaningful dynamic features. Consequently, the pull-and-release method was identified as the only viable strategy to dynamically excite the system. Despite this approach, the high damping of the tree limited the number of observable oscillations, making the identification of natural frequencies more challenging. In addition, the post-release motion of the tree was not limited to the pulling direction but involved swaying in multiple directions, further complicating the interpretation of the response.

3.2.2. Preliminary Tests

During the preliminary tests, the presence of the trigger threshold led to limited success of the tests. The threshold value setting was too high in most cases. Difficulties were also encountered in the synchronization of the signals obtained with the low- and high-cost sensors. The results of the ambient vibration and pull-and-release tests were unusable. Unfortunately, the only usable signals were those obtained from tests performed by hitting the ground near the tree collar with an instrumented impact hammer. During these preliminary tests, wind speed was not recorded, but conditions were observed to be calm.

3.2.3. Operational Tests

Figure 9 shows acceleration time histories recorded by both sensors during operational tests. Pull-and-release tests were carried out by releasing the tree after the application of pulling forces ranging from 200 N to 1200 N (Tests B to G). Each subplot presents accelerations in m   s 2 as a function of time in seconds.
To estimate the dominant dynamic response parameters, the first three significant peaks of each acceleration signal were identified in the time domain. The time intervals between successive peaks were used to calculate the oscillation periods, and the corresponding values were converted into frequencies. The amplitude of each of the three selected peaks was also measured, and the average value was taken as the representative amplitude for the test. This procedure allowed consistent calculation of values reported in the Frequency [Hz] and Amplitude Mean [ m   s 2 ] of Table 2, particularly in cases where standard frequency domain analysis was compromised due to noise or transient signal conditions. In Figure 9, an anomalous increase in amplitude can be observed in the third peak of the low-cost sensor signal during some of the operational tests. The high-cost reference sensor did not mirror this behavior.
As shown in Table 2, the high-cost accelerometer recorded relatively stable values for the frequency [Hz], consistently around 4 Hz, regardless of the applied force. The low-cost accelerometer, on the other hand, exhibited greater variability in frequency [ Hz ], particularly under low excitation (e.g., Test B), where it showed an overestimated value compared to the reference high-cost sensor. This variability indicates a limited capacity to detect the actual dominant frequency under small displacements.
In terms of damping ζ [–], the high-cost sensor again showed consistent and moderate values across all tests, while the low-cost sensor presented higher and more scattered damping ratio estimates, as seen for example in Test D and Test F. These deviations may be attributed to the influence of background noise and lower resolution. In terms of the amplitude Mean [ m   s 2 ] column, the high-cost sensor showed relatively consistent values across all tests, while the low-cost sensor exhibited greater variability, particularly under low excitation (e.g., Test B). This reflects the limited accuracy of the low-cost sensor in capturing the true amplitude of tree oscillations under small displacements. Overall, the results for frequency and damping confirm that the high-cost reference sensor provided stable and reliable measurements, whereas the low-cost sensor displayed larger variability, particularly in low-stress scenarios. This observation is consistent with the RMS and SNR metrics reported in Table 3, which highlight the challenges of using MEMS sensors in detecting precise dynamic parameters under small-amplitude oscillations. As shown in Table 3, in terms of root mean square (RMS) of the acceleration, both sensors showed increasing values with the applied force, as expected. For example, in the pulling tests, RMS values for the low-cost sensor increased from 0.076   m s 2 (Test B) to 0.943   m s 2 (Test G), while those for the high-cost sensor ranged from 0.071   m s 2 to 0.621   m s 2 . The high-cost accelerometer consistently exhibited higher signal-to-noise ratio (SNR) values across all tests. In the pulling tests, the SNR ranged from 22.74 dB (Test B) to 41.59 dB (Test G), while the low-cost sensor showed significantly lower values, from 3.49 dB to 25.34 dB.
For the sake of completeness, Table 3 shows some results from the laboratory tests as well. In the laboratory tests, the high-cost sensor maintained high SNR values ( 38.12 dB and 28.68 dB for Lab Test 1 and Lab Test 2, respectively), whereas the low-cost sensor exhibited lower performance ( 17.18 dB and 9.87 dB). The RMS values in the lab remained comparable (e.g., 0.369   m s 2 vs. 0.411   m s 2 in Lab Test 1). As expected, even under controlled conditions, small discrepancies between low- and high-cost sensors occured.

4. Discussion

A cost-effective dynamic monitoring approach is essential to monitor the stability of trees in urban areas to reduce the risk of failure and damage to people and infrastructure  [31]. However, to set up a monitoring system over a large number of trees, it is important to reduce the cost of sensors. In this context, the application of low-cost MEMS-based accelerometers could represent a significant advancement toward the development of more cost-effective dynamic monitoring approaches. The results suggest that the sensor shows potential for long-term monitoring applications, particularly in capturing significant dynamic events that occur under moderate to strong wind conditions, rather than for high-resolution monitoring of low-amplitude oscillations [25,34].
The laboratory tests demonstrated that the MEMS sensor’s measurements were coherent with those of the reference sensor in detecting the dynamic response of a basic system under controlled conditions. Specifically, both sensors detected the natural frequencies of the system in all dynamic tests. This result confirms that MEMS sensors are able to detect significant changes in frequency and initial oscillatory behavior, consistent with previous studies that have used oscillation peaks for dynamic analysis [32,33], confirming the sensor’s ability to capture these key features for a direct performance comparison.
However, as the motion progressed, the performance of the MEMS sensor declined, as evidenced by the decrease in the amplitude of the oscillation. The noise floor exhibited a substantial increase, thereby compromising the sensor’s capacity to estimate the damping coefficient accurately. This finding aligns with previous observations that highlight the impact of sensor quality on the detection of low-amplitude signals [18,35].
Field tests further highlighted the limitations of low-cost sensors under real-world conditions. Only through artificially induced oscillations of sufficient magnitude, such as those from pull-and-release tests, could the low-cost sensor provide data comparable to the high-cost instrument. In these conditions, the MEMS sensor demonstrated the capacity to emulate the behavior of the seismic instrument, particularly under conditions of elevated mechanical stress. The low-cost device successfully detected dominant frequencies and accurately reproduced the general oscillation pattern, particularly in the initial cycles. However, as the decay progressed, the MEMS data gradually became noisier. Consequently, the frequency and damping estimates underwent a decline in accuracy, particularly at lower pulling forces. This high damping is an intrinsic characteristic of tree systems, which utilize multimodal vibrations to effectively dissipate energy and reduce wind-induced stress, as highlighted by [23].
As highlighted in Table 3, the RMS ( m   s 2 ) and SNR dB values underscored the difference in signal quality between the two sensors. The high-cost accelerometer consistently showed superior SNR performance, particularly in low-force scenarios. For instance, in Test B, the low-cost sensor recorded an SNR of just 3.49 dB, indicating a signal almost indistinguishable from background noise. This helps explain the observed overestimation of frequency and variability in damping values under minimal excitation.
From pulling forces of 600 N and above, however, the performance of the low-cost system improved significantly, as evident from both RMS and SNR metrics. This threshold aligns with the estimated peak wind speed of approximately 13.9   m s 1 derived in Equation (1), based on the measured crown area. However, Equation (1) assumes a distributed aerodynamic drag force acting on the entire crown. In contrast, in pulling tests, the load is applied locally through a cable attached to the trunk at approximately 3 m height. Consequently, the reported wind speed should not be regarded as the physical equivalence of the pulling force, but rather as an indicative reference.
A key practical challenge highlighted by this study relates to the sensor’s physical housing and mounting. The anomalous peak recorded by the MEMS sensor during high-force tests is likely attributable to minor mechanical movement of the internal sensor board within its protective case. The use of a protective case is, however, indispensable for any long-term field deployment to shield the electronics from environmental factors such as precipitation and wind. This necessity creates a practical trade-off: the component essential for the sensor’s survival in the field can, if not installed with maximum stability, become a source of data artifacts. This finding underscores that the overall reliability of the monitoring system depends not only on the sensor’s electronic specifications but critically on its robust mechanical integration. Future applications must therefore prioritize the development of rigorous installation protocols to ensure a stable and rigid fixation, thereby minimizing the risk of such artifacts when measuring impulsive loads.
Overall, the findings demonstrate the clear trade-off between cost and accuracy in the tree-motion monitoring. Advanced techniques such as radar and high-performance seismic instruments have proven effective but remain constrained in urban applications by prohibitive costs and operational complexity [39,40]. In contrast, the low-cost MEMS prototype used in this study exhibits reduced sensitivity to low-amplitude signals but offers decisive advantages in affordability, ease of deployment, and potential scalability. Its current cost—one to two orders of magnitude below that of professional seismic accelerometers or conventional pulling-test equipment—positions it as a viable, economical alternative for targeted applications, despite reduced precision under weak excitation, where noise and resolution dominate.
From a deployment perspective, scalability across urban contexts is feasible; however, practical implementation requires a full economic evaluation that incorporates labor, site access, mounting logistics, maintenance, and data management. The sensor’s value is clearest in capturing higher-amplitude responses, particularly during strong wind events. Reliable identification of dominant oscillation frequencies under such conditions supports its use in event-driven or short-term monitoring frameworks designed for risk assessment. Large-scale implementation remains possible but is contingent upon economic validation. As shown in prior work on tree–wind interactions and root stability [19,20], even partial dynamic insights can substantially inform assessments of mechanical behavior.

5. Conclusions

This paper evaluated the feasibility of a low-cost MEMS sensor system for dynamic tree stability analysis, benchmarking its performance against high-precision seismic accelerometers in both laboratory and field settings.
Results demonstrate that, under high excitation (forces above 600 N), the MEMS prototype yields frequency estimates comparable to professional instruments. Its consistent detection of dominant oscillation frequencies under such conditions highlights its potential for event-based monitoring. However, performance is constrained by noise and reduced sensitivity in low-excitation scenarios, limiting suitability for high-fidelity measurements. This cost–precision trade-off must therefore be weighed against application requirements.
Scalability to urban contexts is plausible but contingent upon a dedicated economic analysis addressing labor, site access, installation logistics, maintenance, and data management. Agreement with the reference instruments under tested conditions is encouraging, though limitations at low excitation remain. In future work, we will install the system in urban contexts on many more trees to assess operational scalability and to carry out the economic analysis.
Future work will address signal-to-noise improvements to enhance performance under ambient wind, evaluate optimal sensor placement along the trunk and crows, and expand IoT-enabled architectures with LiDAR integration. Large-scale trials across species, size classes, soil conditions, and urban environments are planned, with periodic benchmarking against high-precision seismic activity to refine operational thresholds and assess long-term viability.

Author Contributions

Conceptualization, Y.G., F.G. (Francesca Giannetti), A.G., G.B. and I.I.; methodology: I.I., Y.G., A.G. and H.A.C.; software: H.A.C. and I.I.; formal analysis: I.I., Y.G., A.G. and H.A.C.; resources: Y.G., F.G. (Francesca Giannetti), I.P., G.B. and F.G. (Filippo Giadrossich); data curation: I.I., Y.G., A.G. and H.A.C.; writing—original draft preparation: I.I., Y.G. and F.G. (Francesca Giannetti); writing—review and editing: I.I., Y.G., F.G. (Francesca Giannetti), I.P., G.B., A.G., H.A.C. and F.G. (Filippo Giadrossich); supervision: Y.G., I.P., F.G. (Francesca Giannetti) and F.G. (Filippo Giadrossich). All authors have read and agreed to the published version of the manuscript.

Funding

This publication was produced while attending the PhD course in Agricultural Sciences at the University of Sassari, XXXVIII cycle, with the support of a scholarship co-funded by Ministerial Decree no. 352 of 9 April 2022, from the PNRR—funded by the European Union— NextGenerationEU—Mission 4 “Education and Research”, Component 2 “From Research to Enterprise”, Investment 3.3, and by the enterprises Bluebiloba Startup Innovativa S.r.l. and Elighes S.r.l. The The work has also been supported through the project “RETURN” (PE3), funded by the National Recovery and Resilience Plan (PNRR) as part of Mission 4, Component 2, Investment 1.3. Additional support was provided by the project iArBox, funded within the framework of the research program of the National Biodiversity Future Center (NBFC), supported by the National Recovery and Resilience Plan (PNRR)—Mission 4, Component 2, Investment Line 1.4, funded by the European Union—NextGenerationEU. Project ID: NBFC_S8PMI_1021, CUP: B17H240028700004, approved by Provision Prot. No. 287244 of 8August 2024. For the authors Francesca Giannetti, Gianni Bartoli, Andrea Giachetti, and YamunaGiambastiani, this work was partly funded by the European Union under the Horizon Europe Programme– HORIZON-RIA (Research and Innovation Actions), Call “Disaster-Resilient Society 2024”(HORIZON-CL3-2024-DRS-01), through grant agreement No. 101225988, project TREESURE-Decision support Tool for Risk Evaluation, management and awarenEsS of tree FailURE Disasters.

Institutional Review Board Statement

Not applicable.

Informed Consent Statement

Not applicable.

Data Availability Statement

The data are not publicly available due to privacy or confidentiality restrictions.

Acknowledgments

The authors would like to thank Vincenzo Barillà for his valuable assistance in assembling and testing the prototype; without his contribution, this work could not have started.

Conflicts of Interest

This research is conducted within a joint research plan among the participating institutions and entails no conflicts of interest among the authors, including those employed by companies.

References

  1. European Union. Three Billion Additional Trees by 2030; Publications Office of the European Union: Luxembourg, 2022; pp. 1–2. [Google Scholar] [CrossRef]
  2. Bottalico, F.; Travaglini, D.; Chirici, G.; Garfì, V.; Giannetti, F.; Marco, A.D.; Fares, S.; Marchetti, M.; Nocentini, S.; Paoletti, E.; et al. A spatially-explicit method to assess the dry deposition of air pollution by urban forests in the city of Florence, Italy. Urban For. Urban Green. 2017, 27, 221–234. [Google Scholar] [CrossRef]
  3. Ariluoma, M.; Ottelin, J.; Hautamäki, R.; Tuhkanen, E.M.; Mänttäri, M. Carbon sequestration and storage potential of urban green in residential yards: A case study from Helsinki. Urban For. Urban Green. 2021, 57, 126939. [Google Scholar] [CrossRef]
  4. Fletcher, D.H.; Garrett, J.K.; Thomas, A.; Fitch, A.; Cryle, P.; Shilton, S.; Jones, L. Location, Location, Location: Modelling of Noise Mitigation by Urban Woodland Shows the Benefit of Targeted Tree Planting in Cities. Sustainability 2022, 14, 7079. [Google Scholar] [CrossRef]
  5. Meili, N.; Manoli, G.; Burlando, P.; Carmeliet, J.; Chow, W.T.; Coutts, A.M.; Roth, M.; Velasco, E.; Vivoni, E.R.; Fatichi, S. Tree effects on urban microclimate: Diurnal, seasonal, and climatic temperature differences explained by separating radiation, evapotranspiration, and roughness effects. Urban For. Urban Green. 2021, 58, 126970. [Google Scholar] [CrossRef]
  6. Portoghesi, L.; Masini, E.; Tomao, A.; Agrimi, M. Could climate change and urban growth make Europeans regard urban trees as an additional source of danger? Front. For. Glob. Change 2023, 6, 1155016. [Google Scholar] [CrossRef]
  7. Lyytimäki, J.; Sipilä, M. Hopping on one leg—The challenge of ecosystem disservices for urban green management. Urban For. Urban Green. 2009, 8, 309–315. [Google Scholar] [CrossRef]
  8. Döhren, P.V.; Haase, D. Ecosystem disservices research: A review of the state of the art with a focus on cities. Ecol. Indic. 2015, 52, 490–497. [Google Scholar] [CrossRef]
  9. Roman, L.A.; Conway, T.M.; Eisenman, T.S.; Koeser, A.K.; Barona, C.O.; Locke, D.H.; Jenerette, G.D.; Östberg, J.; Vogt, J. Beyond ‘trees are good’: Disservices, management costs, and tradeoffs in urban forestry. Ambio 2021, 50, 615–630. [Google Scholar] [CrossRef]
  10. Masini, E.; Tomao, A.; Corona, P.; Fattorini, L.; Giuliarelli, D.; Portoghesi, L.; Agrimi, M. The ecosystem disservices of trees on sidewalks: A study based on a municipality urban tree inventory in Central Italy. Urban For. Urban Green. 2023, 86, 128007. [Google Scholar] [CrossRef]
  11. Mullaney, J.; Lucke, T.; Trueman, S.J. A review of benefits and challenges in growing street trees in paved urban environments. Landsc. Urban Plan. 2015, 134, 157–166. [Google Scholar] [CrossRef]
  12. Peltola, H.; Kellomäki, S.; Hassinen, A.; Granander, M. Mechanical stability of Scots pine, Norway spruce and birch: An analysis of tree-pulling experiments in Finland. For. Ecol. Manag. 2000, 135, 143–153. [Google Scholar] [CrossRef]
  13. Flepp, G.; Robyr, R.; Scotti, R.; Giadrossich, F.; Conedera, M.; Vacchiano, G.; Fischer, C.; Ammann, P.; May, D.; Schwarz, M. Temporal dynamics of root reinforcement in European spruce forests. Forests 2021, 12, 815. [Google Scholar] [CrossRef]
  14. Lüttge, U.; Buckeridge, M. Trees: Structure and function and the challenges of urbanization. Trees Struct. Funct. 2023, 37, 9. [Google Scholar] [CrossRef]
  15. Egerer, M.; Schmack, J.M.; Vega, K.; Barona, C.O.; Raum, S. The challenges of urban street trees and how to overcome them. Front. Sustain. Cities 2024, 6, 1394056. [Google Scholar] [CrossRef]
  16. Mattheck, C.; Breloer, H. Field guide for visual tree assessment (Vta). Arboric. J. 1994, 18, 1–23. [Google Scholar] [CrossRef]
  17. Koeser, A.K.; Hauer, R.J.; Miesbauer, J.W.; Peterson, W. Municipal tree risk assessment in the United States: Findings from a comprehensive survey of urban forest management. Arboric. J. 2016, 38, 218–229. [Google Scholar] [CrossRef]
  18. Yang, Z.; Hui, K.W.; Abbas, S.; Zhu, R.; Kwok, C.Y.T.; Heo, J.; Ju, S.; Wong, M.S. A review of dynamic tree behaviors: Measurement methods on tree sway, tree tilt and root-plate movement. Forests 2021, 12, 379. [Google Scholar] [CrossRef]
  19. James, K.; Hallam, C.; Spencer, C. Measuring tilt of tree structural root zones under static and wind loading. Agric. For. Meteorol. 2013, 168, 160–167. [Google Scholar] [CrossRef]
  20. de Langre, E. Effects of wind on plants. Annu. Rev. Fluid Mech. 2008, 40, 141–168. [Google Scholar] [CrossRef]
  21. Moulia, B.; Coutand, C.; Julien, J.L. Mechanosensitive control of plant growth: Bearing the load, sensing, transducing, and responding. Front. Plant Sci. 2015, 6, 113466. [Google Scholar] [CrossRef] [PubMed]
  22. Moore, J.; Maguire, D. Dynamic properties of open-grown deciduous trees. Can. J. For. Res. 2008, 41, 321–330. [Google Scholar] [CrossRef]
  23. Rodriguez, M.; De Langre, E.; Moulia, B. A scaling law for the effects of architecture and allometry on tree vibration modes suggests a biological tuning to modal compartmentalization. Am. J. Bot. 2008, 95, 1523–1537. [Google Scholar] [CrossRef]
  24. Den Hartog, J.P. Mechanical Vibrations, 4th ed.; Dover Publications: New York, NY, USA, 1961. [Google Scholar]
  25. James, K.R.; Haritos, N.; Ades, P.K. Mechanical stability of trees under dynamic loads. Am. J. Bot. 2006, 93, 1522–1530. [Google Scholar] [CrossRef]
  26. Velilla, E.; Polajnar, J.; Virant-Doberlet, M.; Commandeur, D.; Simon, R.; Cornelissen, J.H.; Ellers, J.; Halfwerk, W. Variation in plant leaf traits affects transmission and detectability of herbivore vibrational cues. Ecol. Evol. 2020, 10, 12277. [Google Scholar] [CrossRef]
  27. Xuan, Y.; Xu, L.; Liu, G.; Zhou, J. The Potential Influence of Tree Crown Structure on the Ginkgo Harvest. Forests 2021, 12, 366. [Google Scholar] [CrossRef]
  28. Loong, C.N.; Dimitrakopoulos, E.G. Modal properties of fractal sympodial trees: Insights and analytical solutions using a group tree modeling approach. Appl. Math. Model. 2023, 114, 617–628. [Google Scholar] [CrossRef]
  29. Gardiner, B.; Berry, P.; Moulia, B. Review: Wind impacts on plant growth, mechanics and damage. Plant Sci. 2016, 245, 94–118. [Google Scholar] [CrossRef] [PubMed]
  30. Fournier, M.; Dlouhá, J.; Jaouen, G.; Almeras, T. Integrative biomechanics for tree ecology: Beyond wood density and strength. J. Exp. Bot. 2013, 64, 4793–4815. [Google Scholar] [CrossRef] [PubMed]
  31. Kolbe, S.; Schindler, D. TreeMMoSys: A low cost sensor network to measure wind-induced tree response. HardwareX 2021, 9, e00180. [Google Scholar] [CrossRef]
  32. Mayer, H. Wind-induced tree sways. Trees 1987, 1, 195–206. [Google Scholar] [CrossRef]
  33. Sellier, D.; Brunet, Y.; Fourcaud, T. A numerical model of tree aerodynamic response to a turbulent airflow. Forestry 2008, 81, 279–297. [Google Scholar] [CrossRef]
  34. Van Emmerik, T.; Steele-Dunne, S.; Hut, R.; Gentine, P.; Guerin, M.; Oliveira, R.S.; Wagner, J.; Selker, J.; Van De Giesen, N. Measuring tree properties and responses using low-cost accelerometers. Sensors 2017, 17, 1098. [Google Scholar] [CrossRef] [PubMed]
  35. Schindler, D. Responses of Scots pine trees to dynamic wind loading. Agric. For. Meteorol. 2008, 148, 1733–1742. [Google Scholar] [CrossRef]
  36. Wessolly, L. Stability of Trees: Explanation of the Tipping Process. Stadt Und Grun 1996, 4, 268–272. [Google Scholar]
  37. Moore, J.R.; Maguire, D.A. Natural sway frequencies and damping ratios of trees: Concepts, review and synthesis of previous studies. Trees Struct. Funct. 2004, 18, 195–203. [Google Scholar] [CrossRef]
  38. Giachetti, A.; Zini, G.; Giambastiani, Y.; Bartoli, G. Field Measurements of Tree Dynamics with Accelerometers. Forests 2022, 13, 1243. [Google Scholar] [CrossRef]
  39. Chau, W.Y.; Loong, C.N.; Wang, Y.H.; Chiu, S.W.; Tan, T.J.; Wu, J.; Leung, M.L.; Tan, P.S.; Ooi, G.L. Understanding the dynamic properties of trees using the motions constructed from multi-beam flash light detection and ranging measurements. J. R. Soc. Interface 2022, 19, 20220319. [Google Scholar] [CrossRef]
  40. Zanotto, F.; Marchi, L.; Grigolato, S. Wind-tree interaction: Technologies, measurement systems for tree motion studies and future trends. Biosyst. Eng. 2024, 237, 128–141. [Google Scholar] [CrossRef]
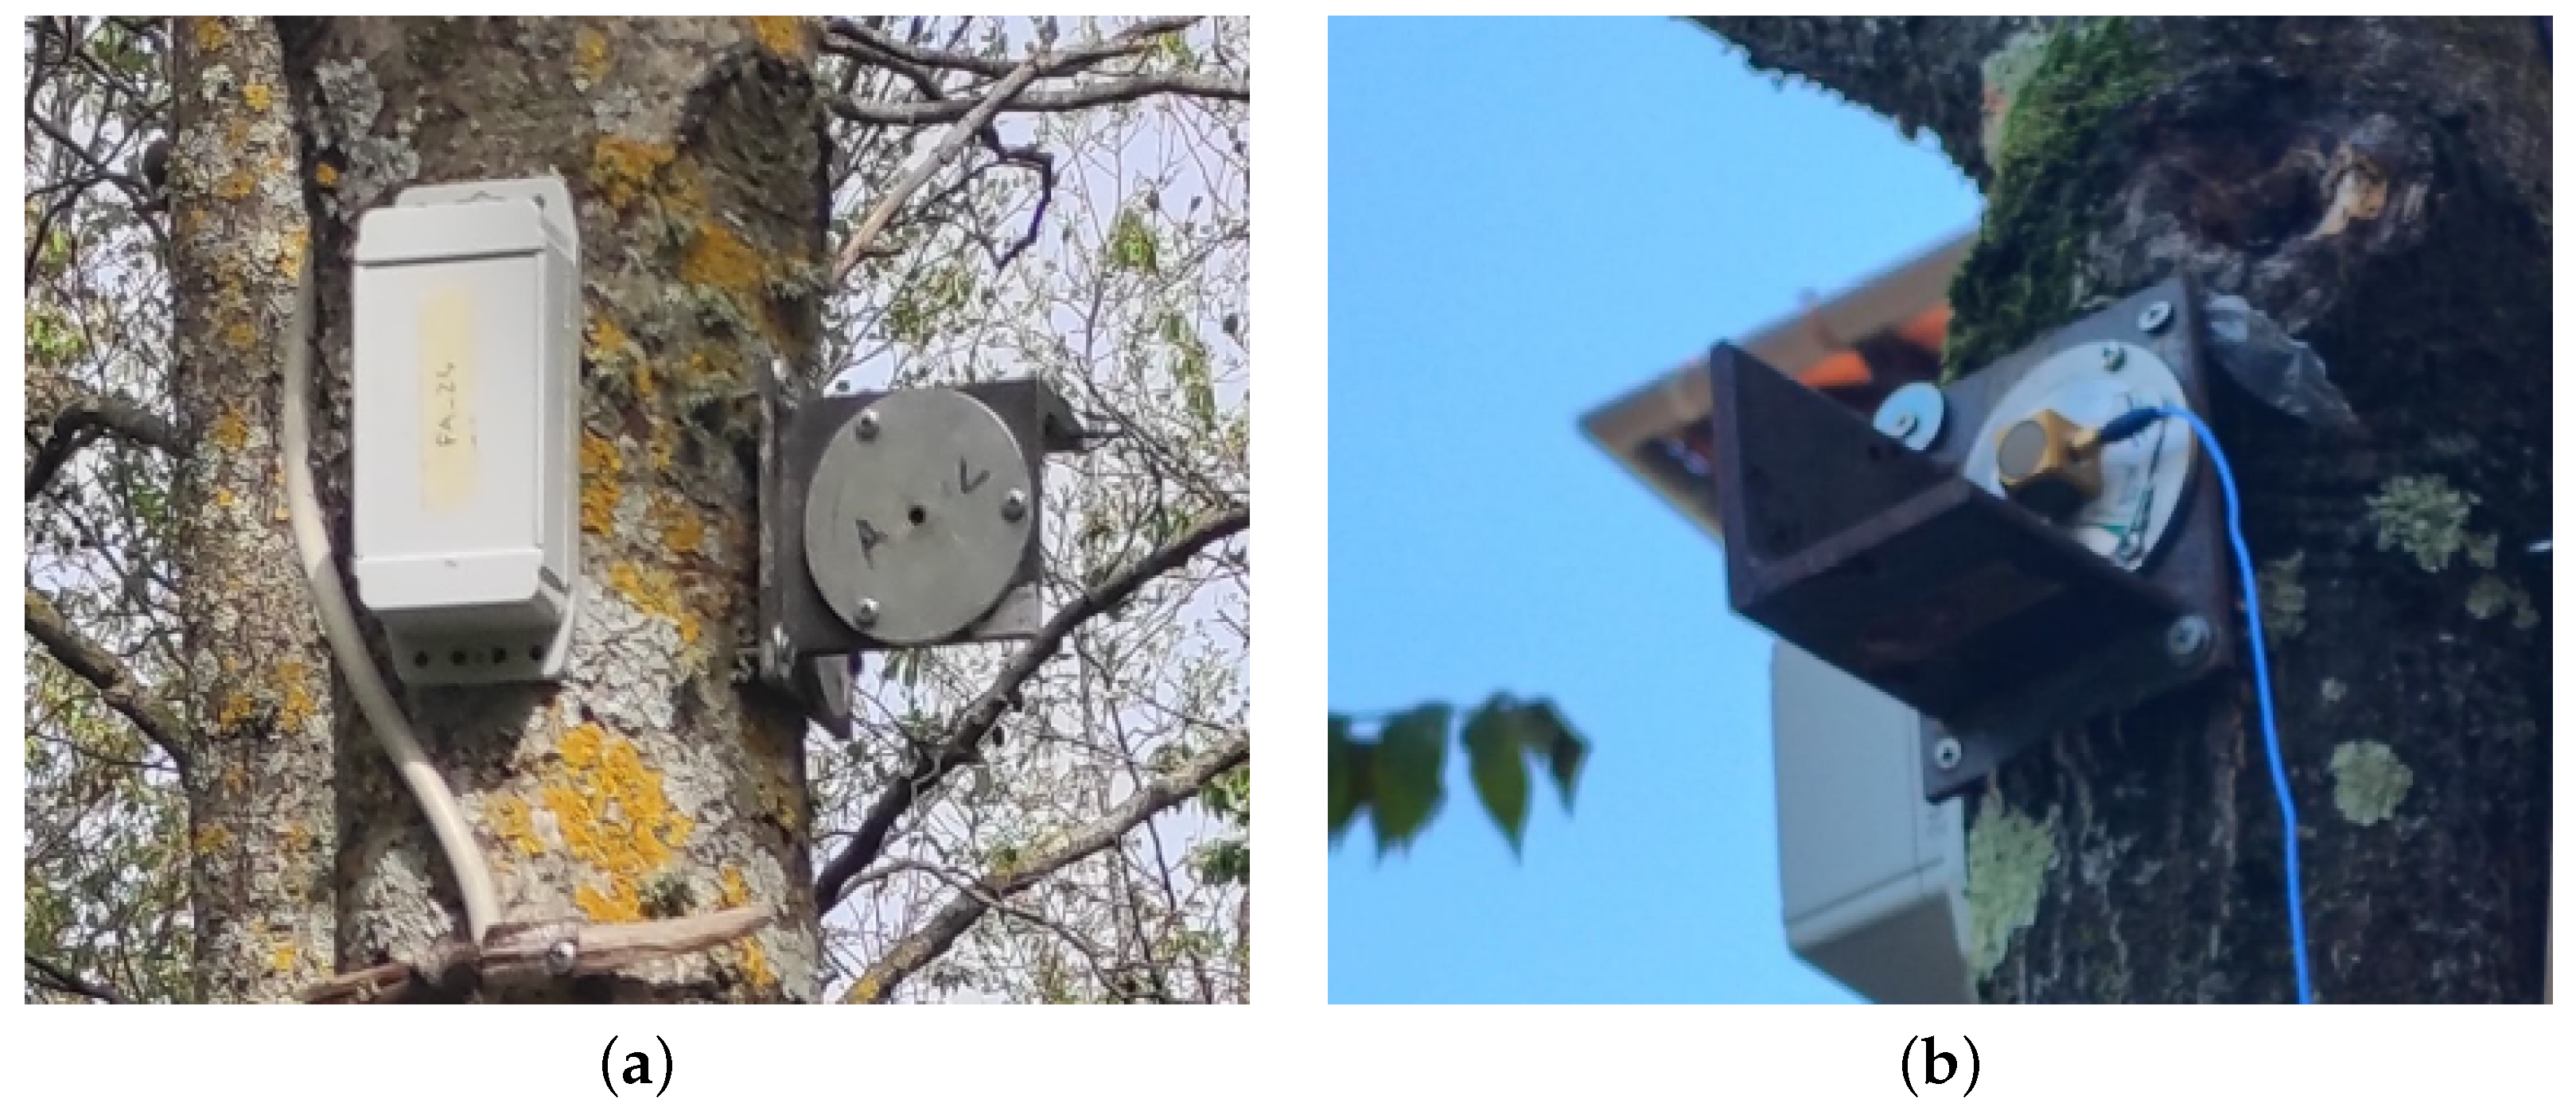
Figure 1. Sensors used in the study. (a) The low-cost MEMS sensor (left) and the reference uniaxial seismic sensor (PCB 393B12, right) used for laboratory tests. (b) The reference triaxial seismic sensor (PCB 356B18) was used for field tests.
Forests 16 01572 g001
Figure 2. Laboratory test setup. (a) Photograph of the experimental assembly during testing; (b) schematic representation highlighting the arrangement and connection of the sensors.
Forests 16 01572 g002
Figure 3. Study area of the preliminary field tests. (a) Location of Tuscany within Italy; (b) Location of the experimental site within Tuscany; (c) Aerial view of the black alder (Alnus glutinosa L.) planting stand in Lucardo. Base map/orthophoto: Regione Toscana—GEOscopio (Cartoteca), 2023 orthophoto.
Forests 16 01572 g003
Figure 4. Operational field test setup. (a) Photograph of the tree during testing; (b) schematic representation of the setup, highlighting the arrangement of the sensors and pulling equipment.
Forests 16 01572 g004
Figure 5. Acceleration signals recorded by low-cost and high-cost sensors during test LAB-1 (free damped oscillations in the laboratory).
Forests 16 01572 g005
Figure 6. Frequency spectra of the signals acquired during test LAB-1 (free damped oscillations in the laboratory).
Forests 16 01572 g006
Figure 7. Acceleration signals recorded by low-cost and high-cost sensors during test LAB-2 (laboratory free damped oscillations with an additional mass).
Forests 16 01572 g007
Figure 8. Frequency spectra of the signals recorded during test LAB-2 (laboratory tests with an additional mass).
Forests 16 01572 g008
Figure 9. Acceleration time histories recorded by low-cost and high-cost sensors during operational tests under increasing pulling forces (Tests B–G).
Forests 16 01572 g009
Table 1. Summary of the experimental tests performed, divided into laboratory, preliminary, and operational phases.
CategoryTest Name
Laboratory testsTest LAB-1: free vibration without added mass
Test LAB-2: free vibration with added mass
Preliminary testsPreliminary Test 1: ambient vibration—wind induced
Preliminary Test 2: mechanical impulse by manual impact
Preliminary Test 3: pull-and-release (pulling direction: North)
Preliminary Test 4: impulse excitation on ground-mounted plate with hammer
Preliminary Test 5: pull-and-release by manual action (pulling direction: North)
Preliminary Test 6: pull-and-release (pulling direction: North)
Preliminary Test 7: pull-and-release — 491 N mass (pulling direction: East)
Preliminary Test 8: pull-and-release—491 N mass (pulling direction: East)
Preliminary Test 9: pull-and-release—392 N mass (pulling direction: East)
Preliminary Test 10: pull-and-release—491 N mass (pulling direction: East)
Operational field testsTest B—pull-and-release—200 N
Test C—pull-and-release—400 N
Test D—pull-and-release—600 N
Test E—pull-and-release—800 N
Test F—pull-and-release—1000 N
Test G—pull-and-release—1200 N
Table 2. Comparison of mean frequency, damping ratio, and amplitude values between low-cost and high-cost accelerometers.
TestFrequency [Hz]Damping ζ [–]Amplitude Mean [m s−2]
Low-CostHigh-CostLow-CostHigh-CostLow-CostHigh-Cost
Test LAB-11.791.770.0740.0610.830.99
Test LAB-20.740.740.0680.0150.590.57
Test B—200 N4.914.570.1360.0880.280.50
Test C—400 N3.754.810.0470.0631.120.75
Test D—600 N3.654.010.1570.0682.151.45
Test E—800 N3.873.960.0680.0741.951.71
Test F—1000 N4.583.990.0940.0651.702.42
Test G—1200 N3.874.030.0250.0764.143.04
Table 3. Comparison of root mean square (RMS) acceleration and signal-to-noise ratio (SNR) between low-cost and high-cost accelerometers during laboratory and pulling tests. RMS is expressed in m   s 2 , SNR in dB. Lab Test 1: free vibration (no added mass); Lab Test 2: vibration with added mass.
Test TypeTestRMS (m s−2)SNR (dB)
Low-CostHigh-CostLow-CostHigh-Cost
LaboratoryTest LAB-10.3690.41117.1838.12
Test LAB-20.1590.1409.8728.68
Pulling testsTest B (200 N)0.0760.0713.4922.74
Test C (400 N)0.2540.12713.9427.80
Test D (600 N)0.3800.23917.4433.29
Test E (800 N)0.4720.34919.3336.58
Test F (1000 N)0.6330.49221.8739.57
Test G (1200 N)0.9430.62125.3441.59
Disclaimer/Publisher’s Note: The statements, opinions and data contained in all publications are solely those of the individual author(s) and contributor(s) and not of MDPI and/or the editor(s). MDPI and/or the editor(s) disclaim responsibility for any injury to people or property resulting from any ideas, methods, instructions or products referred to in the content.