Article

Transcriptome Analysis Reveals the Genetic Basis of Phenotypic Traits of Vaccinium uliginosum L. at Different Elevations in the Changbai Mountains

1
Forestry College, Beihua University, 3999 Binjiangdong Road, Jilin 132013, China
2
Key Laboratory of State Forestry Administration on Conservation and Efficient Utilization of Precious and Rare Forest Resource in Changbai Mountain, Forestry College, Beihua University, Jilin 132013, China
3
Engineering Research Centre of Forestry Biotechnology of Jilin Province, Jilin 132013, China
*
Authors to whom correspondence should be addressed.
Forests 2025, 16(10), 1571; https://doi.org/10.3390/f16101571
Submission received: 12 August 2025 / Revised: 7 October 2025 / Accepted: 8 October 2025 / Published: 11 October 2025
(This article belongs to the Section Genetics and Molecular Biology)

Abstract

The morphological traits of Vaccinium uliginosum L., including plant height, leaf area, and fruit weight, have changed significantly across an elevational gradient in the Changbai Mountains. To elucidate the molecular mechanisms underlying these morphological variations, RNA-Seq technology was employed to identify differentially expressed genes (DEGs), key metabolic pathways, and associated biological functions of V. uliginosum at seven elevations in the Changbai Mountains. A total of 1190 DEGs significantly associated with morphological variations were identified. These genes are mainly involved in lipid synthesis, carbohydrate metabolism, energy metabolism, and signal transduction. Redundancy analysis (RDA) revealed that fatty acyl-ACP thioesterase B (FATB) and ribulose-bisphosphate carboxylase small subunit (cbbS) exhibited a significant association with morphological variation. Integrated analysis indicated that high-altitude plants likely enhance lipid synthesis and cell wall stability while also inhibiting photosynthesis and carbohydrate metabolism. The regulatory mechanisms underlying hormone signal transduction may be relatively complex, as evidenced by the enhanced activity of gibberellin and reduced biological effects of auxin, abscisic acid, and ethylene. This study is the first to provide transcriptomic evidence elucidating the genetic basis of altitudinal morphological adaptation in V. uliginosum, integrating phenotypic traits with gene expression profiles across an elevational gradient.

1. Introduction

As an important ecological barrier in East Asia, the Changbai Mountains have unique geographical and climatic conditions [1]. The area’s ecosystem shows an obvious vertical distribution spectrum with altitude [2]. This vertical distribution band spectrum provides an ideal natural laboratory for studying the adaptation mechanism of plants to different environmental stresses [3]. Vaccinium uliginosum L. is one of the dominant types of vegetation in the tundra zone of the Changbai Mountains; it exhibits a population distribution that extends across a broad range of latitudes [4,5]. Due to the sensitivity of its morphology to latitudinal variations, V. uliginosum serves as a reliable indicator of changes in environmental conditions [6]. In high-altitude regions, V. uliginosum faces environmental challenges such as low temperature, increased ultraviolet radiation, and decreased atmospheric oxygen content [7]. These environmental stresses have led to notable alterations in the plant’s morphological characteristics. For instance, parameters such as plant growth, plant height, leaf length, and basal diameter have markedly declined [6,8].
In recent years, the application of transcriptome sequencing technology (RNA-Seq) has provided new perspectives on the study of the adaptability of alpine plants [9]. For example, a study about the flower bud tissue from Kingdonia uniflora at the gene expression level uncovered that the DEGs involved in the pathways of cutin, suberin, wax biosynthesis, and monoterpenoid biosynthesis responded to different altitudes [10]. Another study also revealed that the genes of pigment metabolism; photosynthesis; hormone signaling; and cutin, suberin, and wax biosynthesis responded to altitude [11]. RNA-Seq can directly reflect gene expression differences among various samples, making it a valuable tool for studying the mechanisms underlying morphological changes in plants across different altitude environments [12,13].
Currently, research on the morphological changes in V. uliginosum in response to different altitude environments primarily focuses on qualitative or quantitative analyses of morphological parameters, while limited studies report the molecular mechanisms underlying its morphological responses to the environment. For instance, studies indicate that intense ultraviolet radiation (UV-B) can reduce the photosynthetic capacity of V. uliginosum [14,15], and its response to low temperatures is associated with the expression of genes such as VuLhca4 or VuARI2 [16,17]. In this study, using leaves as samples, RNA-Seq technology was used to analyze the gene expression difference in V. uliginosum at seven elevations in the Changbai Mountain area. Subsequently, the genetic basis of ecological adaptability of V. uliginosum in different elevations was explored by identifying differentially expressed genes associated with morphological characteristics (height, leaves, and fruits) in different altitude regions. This study provides a scientific basis for the protection and utilization of V. uliginosum.

2. Materials and Methods

2.1. Plant Materials

The samples of V. uliginosum were collected at the Changbai Mountain area (Yanbian Korean Autonomous Prefecture, Jilin Province), which corresponded to seven different elevations (706 m, 939 m, 1226 m, 1384 m, 1985 m, 2190 m, and 2366 m), and their details are displayed in Table 1. To minimize the influence of factors other than elevation differences on the samples, the collection period was set at 10–12 a.m. in late July. Fresh mature leaves were quickly packed in cryopreservation tubes and stored in liquid nitrogen for triplicate transcriptome sequencing. In each of the elevation plots, 3 individual plants spaced at least 10 m apart were randomly chosen as RNA-Seq samples.

2.2. Morphological Traits of V. uliginosum at Different Elevations

In this study, we aimed to evaluate the morphological traits of V. uliginosum across different elevations to understand the mechanisms of adaptation to varying environmental conditions. Seven elevations were selected to collect samples, ensuring a thorough representation of the species’ natural ecological range. The morphological traits assessed included leaf morphology, weight per fruit, and plant height. The leaf area was measured using a portable LA-S Portable Leaf Area Meter (Wanshen Detection Technology Co., Ltd. Hangzhou, Zhejiang, China). Mature fruits were weighed on a precision scale. Plant height was measured from the base of the plant to the apex of its tallest stem. To mitigate the effects of individual variation within species, 20 leaves from each of the 3 plants in the 3 sample plots at 7 elevations were collected and measured, as well as the heights of 10 plants in each plot. Due to the limited number of ripe fruits per plant, especially at high altitudes (>1980 m), 140 to 200 mature fruits from each elevation were assessed. Individual plants used for the RNA-Seq analysis were also used to measure morphological traits. For leaf morphology and plant height, the plant was the sampling unit, while elevation was the statistical unit for the ANOVA of fruit weights.

2.3. RNA Extraction, cDNA Library Construction, and Sequencing

Total RNA was extracted from the leaf samples using the TruSeq™ RNA Sample Preparation Kit provided by Illumina Inc. (San Diego, CA, USA). The concentration and purity of the extracted RNA were assessed using a Nanodrop 2000 spectrophotometer (Thermo Fisher Scientific Inc., Wilmington, DE, USA), and the integrity of the RNA was confirmed by agarose gel electrophoresis. The RQN value was determined with an Agilent 5300 system (Agilent Technologies, Inc., Santa Clara, CA, USA). An amount of 1 μg of each RNA with a concentration of ≥30 ng/μL, an RQN value above 6.5, and an OD260/280 ratio between 1.8 and 2.2 was used to build a single library construction.
The high-throughput sequencing strategy was utilized on cDNA libraries from 21 samples collected at seven different elevations, with triplicate sequencing performed for each sample to elucidate transcriptome characteristics at different elevations. The mRNA was isolated from total RNA using magnetic beads conjugated with oligo (dT) probes, which hybridize to the poly(A) tails of mRNA via A-T base pairing. The enriched mRNA was then fragmented into approximately 300 base pair segments using an optimized fragmentation buffer.
The first-strand cDNA was synthesized with random primers and reverse transcriptase, using the mRNA as a template. The second strand was then synthesized, resulting in a stable double-stranded cDNA. The double-stranded cDNA with sticky ends was treated with an End Repair Mix to create blunt ends and the subsequent addition of an A base at the 3′ end, facilitating the ligation of adapter sequences using PCR amplification. Sequencing was performed on a NovaSeq X Plus platform by Shanghai Meiji Biotech Co., Ltd. (Shanghai, China), yielding raw reads in the fastq format that will be used for transcriptome analysis.

2.4. Transcriptomic Assembly and Functional Annotation of Genes

Initially, raw reads were filtered to remove low-quality sequences, adapter contamination, and poly-N stretches, resulting in clean data. High-quality clean reads were used for de novo transcriptome assembly using Trinity software (v2.8.5) (https://github.com/trinityrnaseq/trinityrnaseq/wiki (accessed on 7 August 2023)) [18]. Then, the Q20 and Q30 quality scores and the guanine–cytosine (GC) content were calculated. For de novo assembly evaluation, TransRate (http://hibberdlab.com/transrate/ (accessed on 9 August 2023)) was employed to score contigs on assembly errors [19], providing an overall quality measure for transcriptome assemblies. Additionally, CD-HIT (http://weizhongli-lab.org/cd-hit/ (accessed on 10 August 2023)) was utilized for sequence clustering [20], which effectively refined the dataset by reducing duplication. Finally, BUSCO (http://busco.ezlab.org/ (accessed on 11 August 2023)), which utilizes single-copy immediate homologous genes, was used to test transcriptome assembly integrity [21]. These QC techniques ensure that our sequencing data is robust and reliable for downstream analyses. The detected genes were then annotated against the following six databases using BLAST software (v2.9.0): EggNOG (http://eggnog5.embl.de/#/app/home (accessed on 14 August 2023)), Kyoto Encyclopedia of Genes and Genomes (KEGG, http://www.genome.jp/kegg (accessed on 15 August 2023)), Gene Ontology (GO, http://www.geneontology.org (accessed on 17 August 2023)), Nonredundant (NR, http://www.ncbi.nlm.nih.gov (accessed on 18 August 2023)), Swiss-Prot (http://www.expasy.ch/sprot (accessed on 18 August 2023)), and Pfam (http://pfam.xfam.org (accessed on 18 August 2023)).

2.5. Analysis of Differentially Expressed Genes (DEGs)

RSEM was used to estimate transcript abundances [22]. Raw read counts were used as input for DESeq2 to identify DEGs with |log2FC| ≥ 2 and Padjust < 0.001 [23]. Separate analysis groups were set up with low-elevation samples (706, 939, 1226, and 1384 m) as controls and high-elevation samples (1985, 2190 and 2366 m) as treatments. This grouping strategy was based on preliminary analyses, which revealed high transcriptomic similarity among high-altitude groups and significant morphological changes across high- and low-altitude groups. DEGs were clustered and analyzed with the R statistical tool. The GO enrichment analysis of gene sets was carried out using Goatools software (v0.6.5) and Fisher’s exact test [24]. GO functions were considered significantly enriched when the corrected P-value was less than 0.05. The KEGG pathway enrichment analysis was performed using the cluster Profiler package (v3.6.0) in R, employing the hypergeometric test. Pathways were considered significantly enriched when the adjusted p-value was less than 0.05.

2.6. Data Analysis

The data were provided as the mean ± standard error of the mean (SEM). Prior to the ANOVA, all morphological data were checked for normality (Shapiro–Wilk test) and homogeneity of variances (Levene’s test), and both assumptions were met. Statistical significance among different groups was assessed using a one-way analysis of variance (ANOVA) and post hoc analysis using Tukey’s Honestly Significant Difference (HSD) test for pairwise comparisons with a significance level of p < 0.05. GraphPad Prism version 8 was used to construct the graphical representations [25], and to explore the relationship between gene expression and morphological changes, Canoco 5 software was used to perform redundancy analysis (RDA).

2.7. Real-Time Quantitative PCR Validation

qRT-PCR was used to verify the dependability of the results from RNA-Seq. The total RNA was isolated from different V uliginosum samples, with five plants collected from each of the seven different elevations (an independent set of samples, distinct from the samples utilized in the RNA-Seq analysis), using the Fast Plant RNA Kit For Polysaccharides & Polyphenolics-Rich (Zoman Bio, Beijing, China). To conduct the qRT-PCR analysis, first-strand cDNA was generated using the MonScript RTIII All-in-One Mix with dsDNase (Monad, Suzhou, China). The sequencing data was used to design primers using the Beacon Designer 7 software, with EF1α serving as the internal reference gene [26]. The gene primer sequences are shown in Supplementary Table S1. Finally, qRT-PCR was carried out using Quant Studio 5 ((Thermo Fisher Scientific Inc., Wilmington, DE, USA)). The total reaction system includes 10 μL of Mon Amp TM Chemo HS qPCR Mix (Monad, Suzhou, China), 0.2 μL of Low Rox dye (100×) (Monad, Suzhou, China), 0.5 μL of each F and R primer (10 μmoL/L), 0.2 μL of cDNA, and 8.6 μL of ddH2O. Each selected gene was tested in quadruplicate by heating at 95 °C for 10 min, followed by 40 cycles of 95 °C for 10 s and then 60 °C for 30 s, and melting curves were used to monitor the specificity of the qRT-PCR experiments. The comparative CT method (2−ΔΔCT) was used to calculate the relative gene expression levels [27]. Using 10-fold serially diluted cDNA samples as templates, the amplification efficiency of primers was validated. Standard curves were made by measuring CT to the base-10 logarithm of the dilution factor. Finally, the slope of the standard curve was substituted into the below formula to calculate the amplification efficiency (E, 100%) of each primer [28]. The amplification efficiencies should be between 90% and 110%.
E = ( 10 ( 1 / s l o p e ) 1 ) × 100 %

3. Results

3.1. Evaluation of Effects of Elevation on Morphological Traits in Populations of V. uliginosum Individuals Sampled

Prior to transcriptome analysis, we evaluated weight per fruit, leaf area, and plant heights of V. uliginosum plants collected at seven elevations to assess variation in the morphological traits of the populations from which the individuals were selected for transcriptome analysis. Figure 1 confirms that the weight per fruit is smaller at higher elevations compared to lower elevations and that there are also strong differences in leaf area and plant height, especially between individuals from high- and low-altitude populations.

3.2. Overview of Transcriptome Data

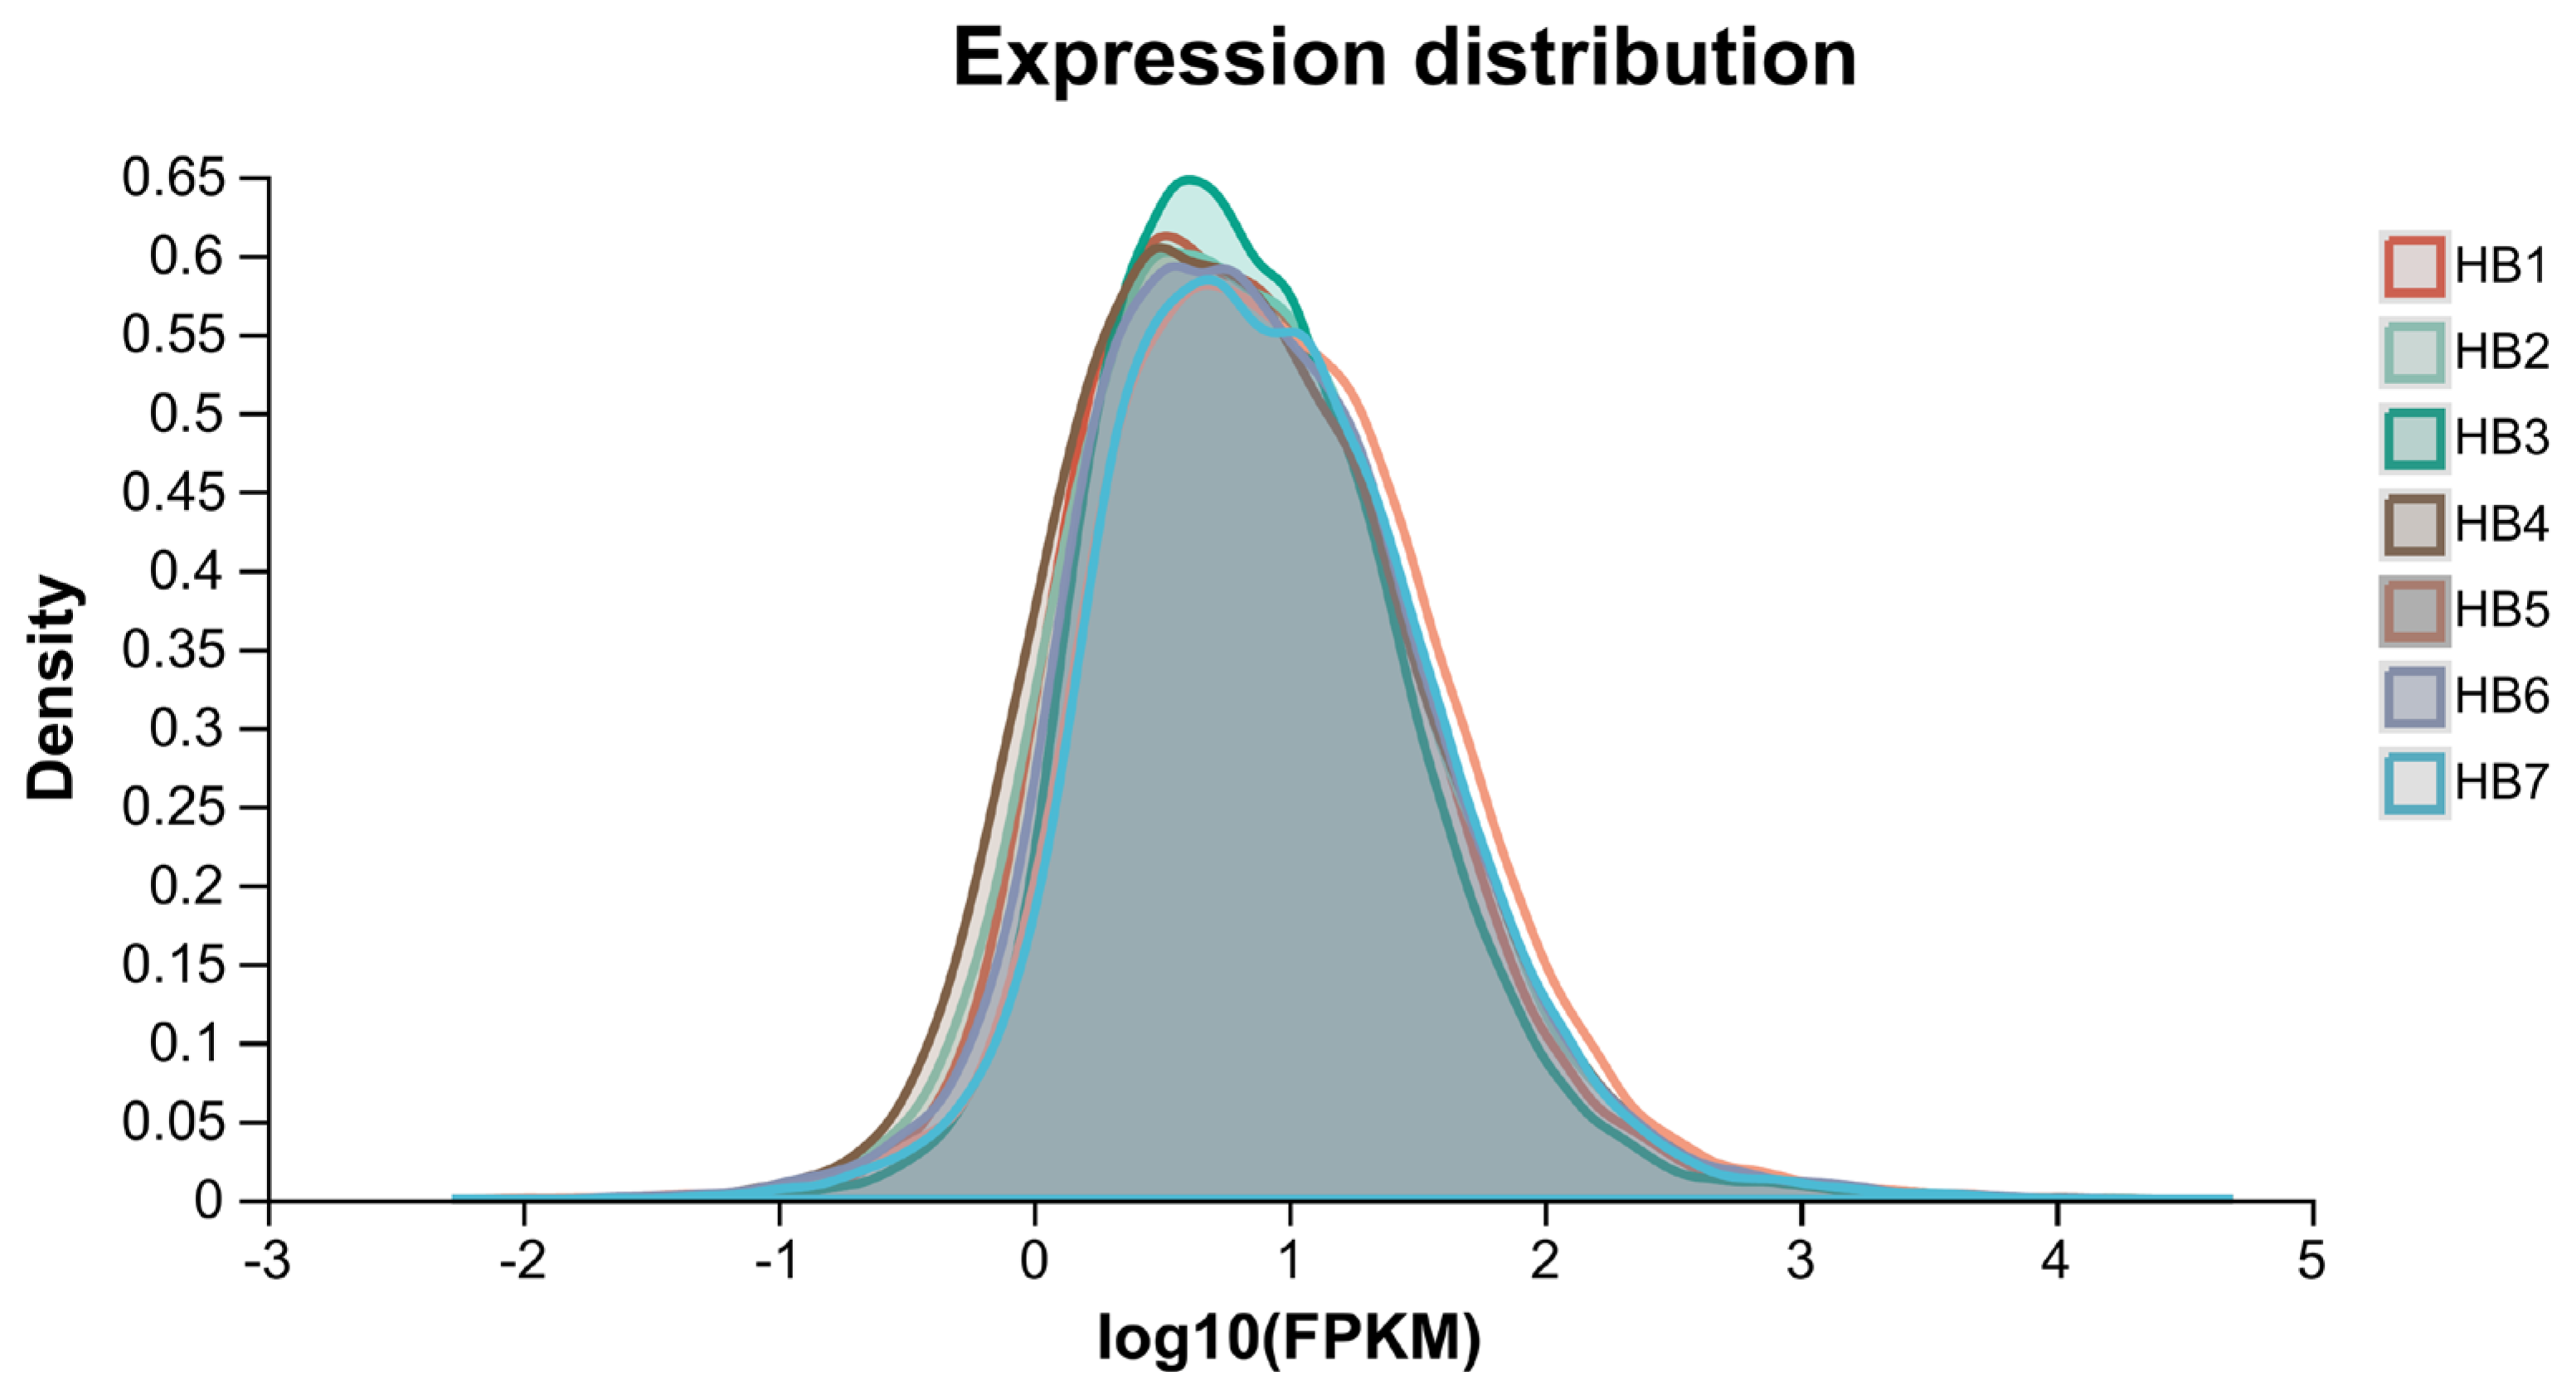
To investigate the molecular regulation of V. uliginosum at different elevations, we obtained the transcriptome of V. uliginosum leaves at seven elevations using RNA-Seq analysis. The clean reads of each sample were compared with the reference sequences obtained from the trinity assembly to obtain the mapping results for each sample. Three biological replicate samples were sequenced for each elevation group. RNA-Seq of sixty-three libraries (21 biological samples × 3 technical replicates) yielded 383.67 Gb of clean data, with each sample having 6.09 Gb of clean data, and Q30 > 92.95%. In total, 272,052 transcripts and 130,944 unigenes were obtained. Subsequently, the effect of elevation on global gene transcript abundance was assessed using the expression quantification software RSEM (v1.3.1). Gene transcript abundances are predominantly observed within a narrow range of expression levels, specifically between log10-transformed expression values of 0 and 2 (Figure 2). This distribution is typical for transcriptome data, indicating that most genes are expressed at low to medium levels.
To obtain comprehensive information on gene function, the assembled sequences were BLAST-searched against NR, GO, eggNOG, KEGG, Swiss-Prot, and Pfam. There were 74,220 unigenes in NR (56.68%), 55,584 in GO (42.45%), 48,474 in eggNOG (37.02%), 22,639 in KEGG (17.29%), 40,369 in Swiss-Prot (30.83%), and 33,237 in Pfam (25.38%). Gene expression distribution and PCA analysis of identified genes confirmed the sequencing data’s high quality (Figure S1).

3.3. Analysis of Differentially Expressed Genes (DEGs)

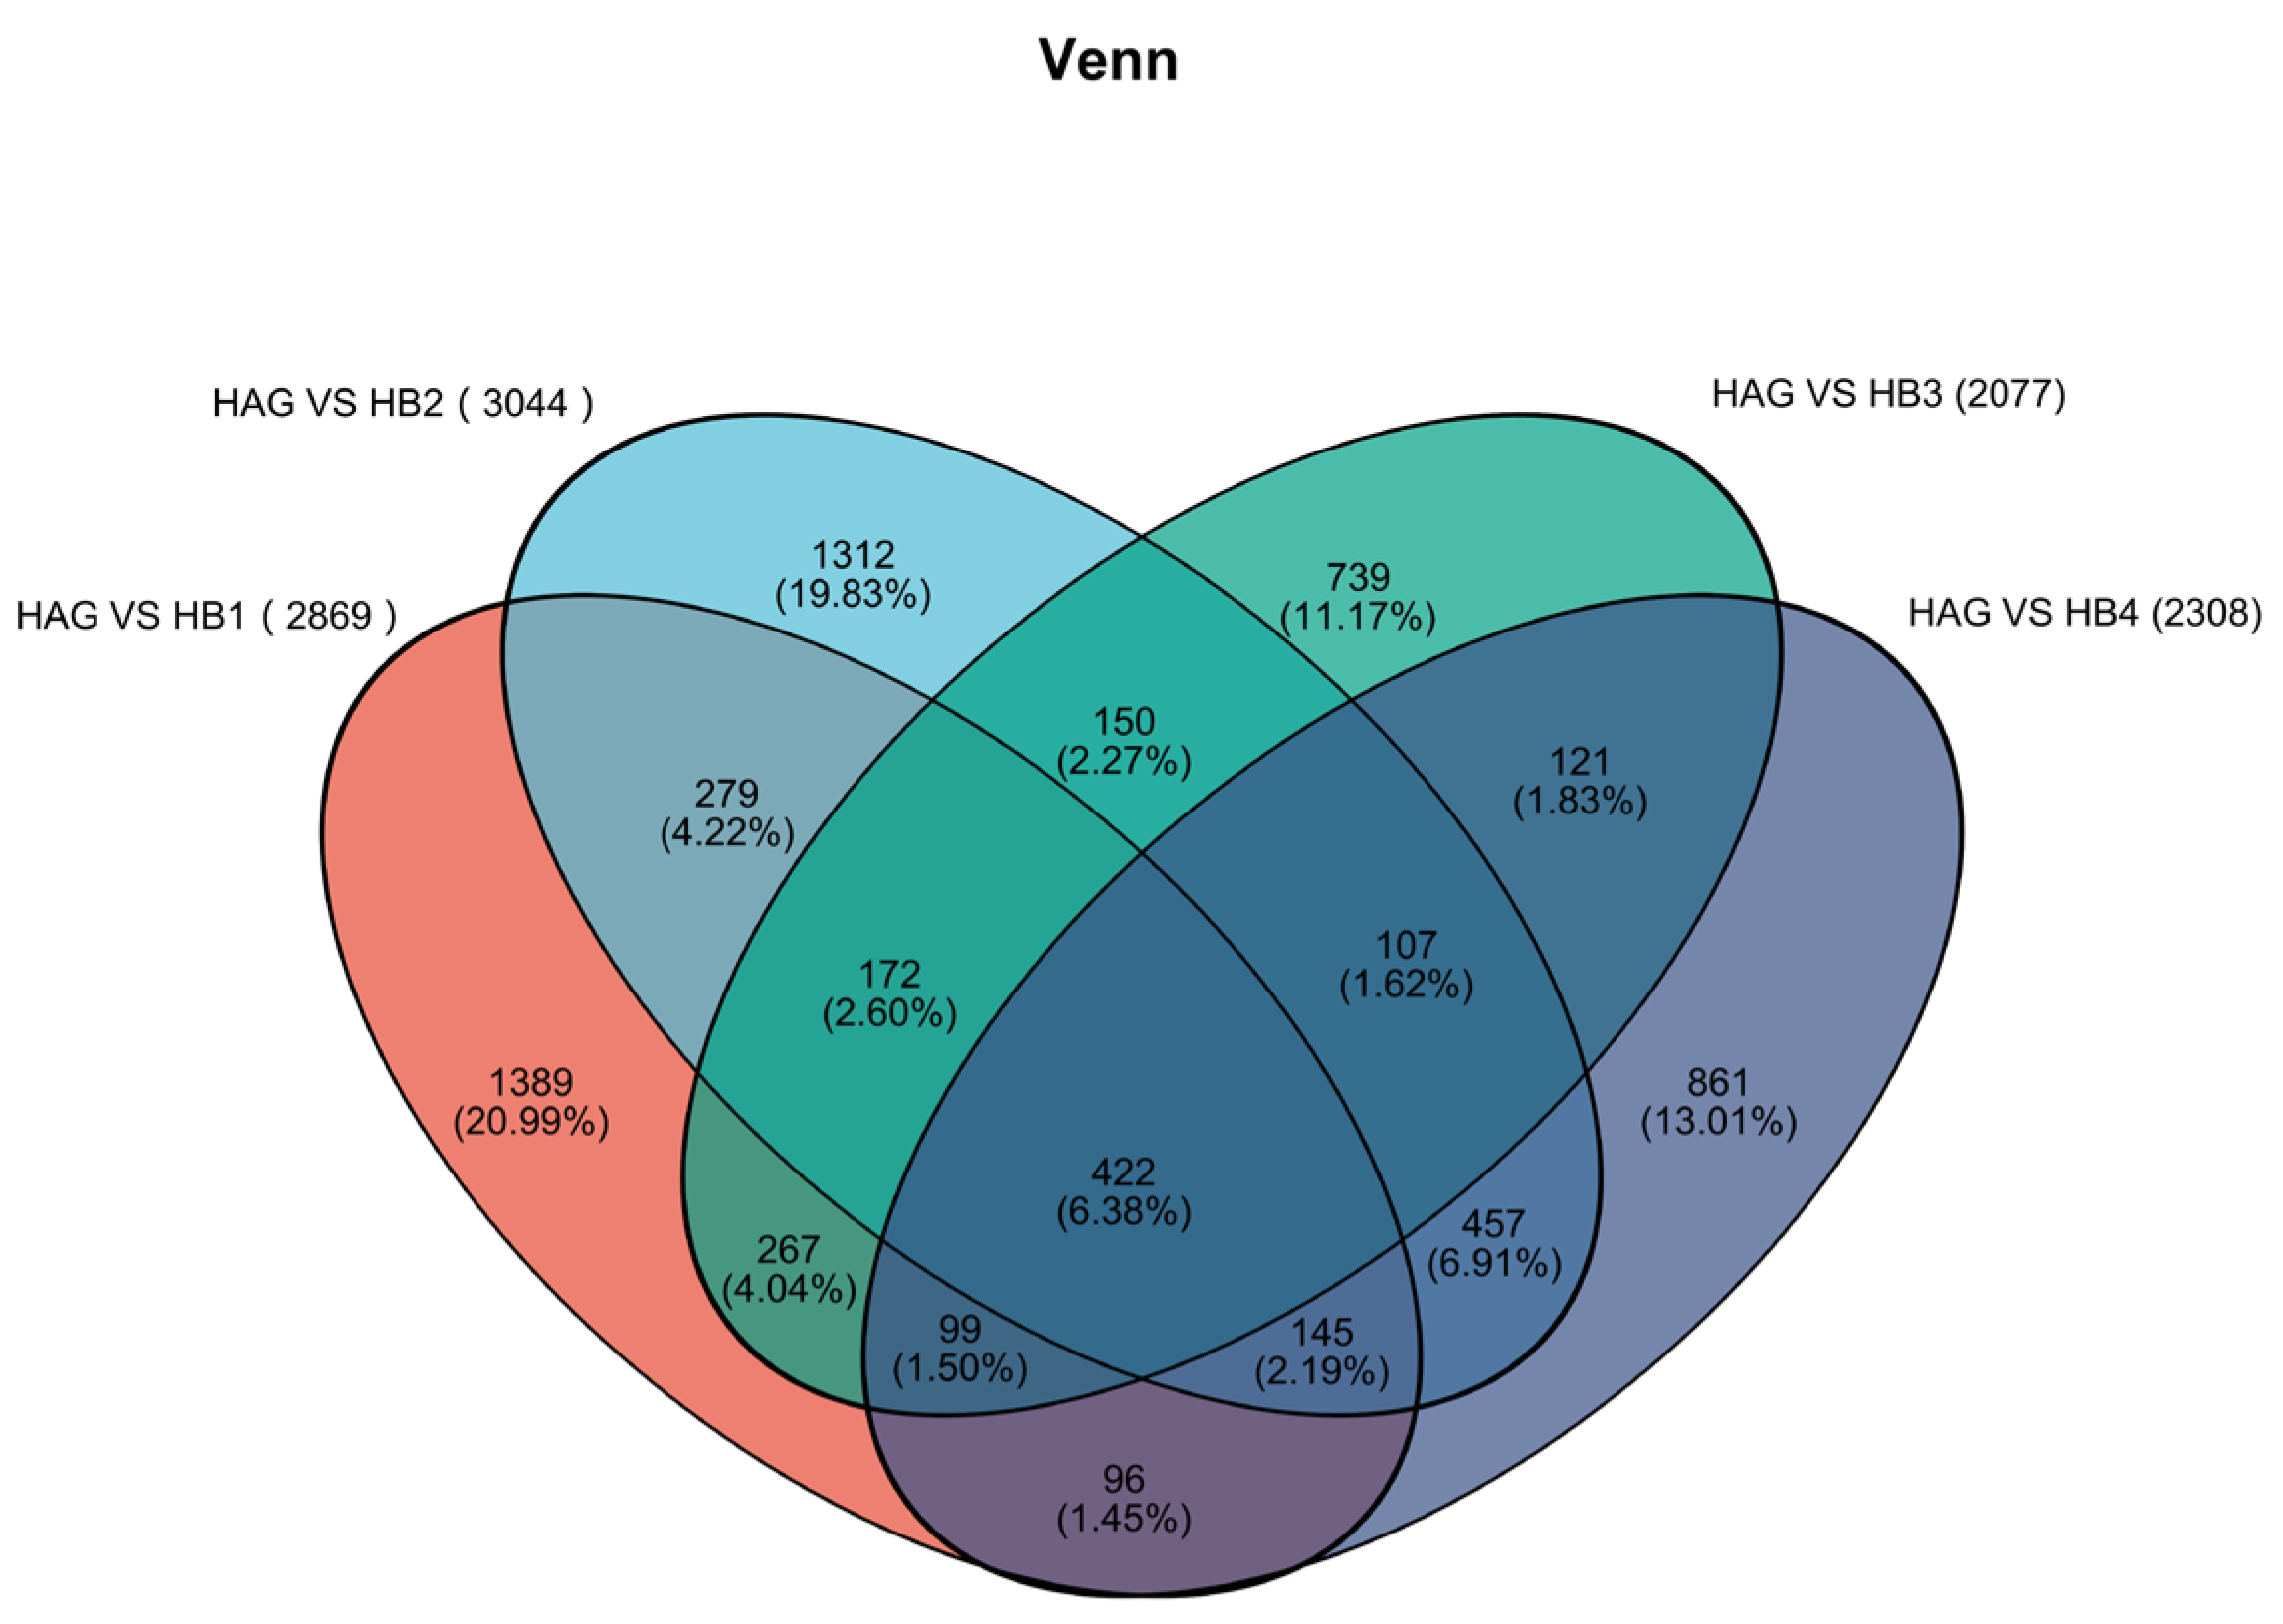
Subsequently, we individually compared the HAG to the other four low-elevation samples (LAG, which include HB1, HB2, HB3, and HB4). A total of 6616 DEGs were identified from these comparisons, with 2869, 3044, 2077, and 2308 genes found for each respective comparison (HAG vs. HB1~4) (Figure 3 and Table S2).
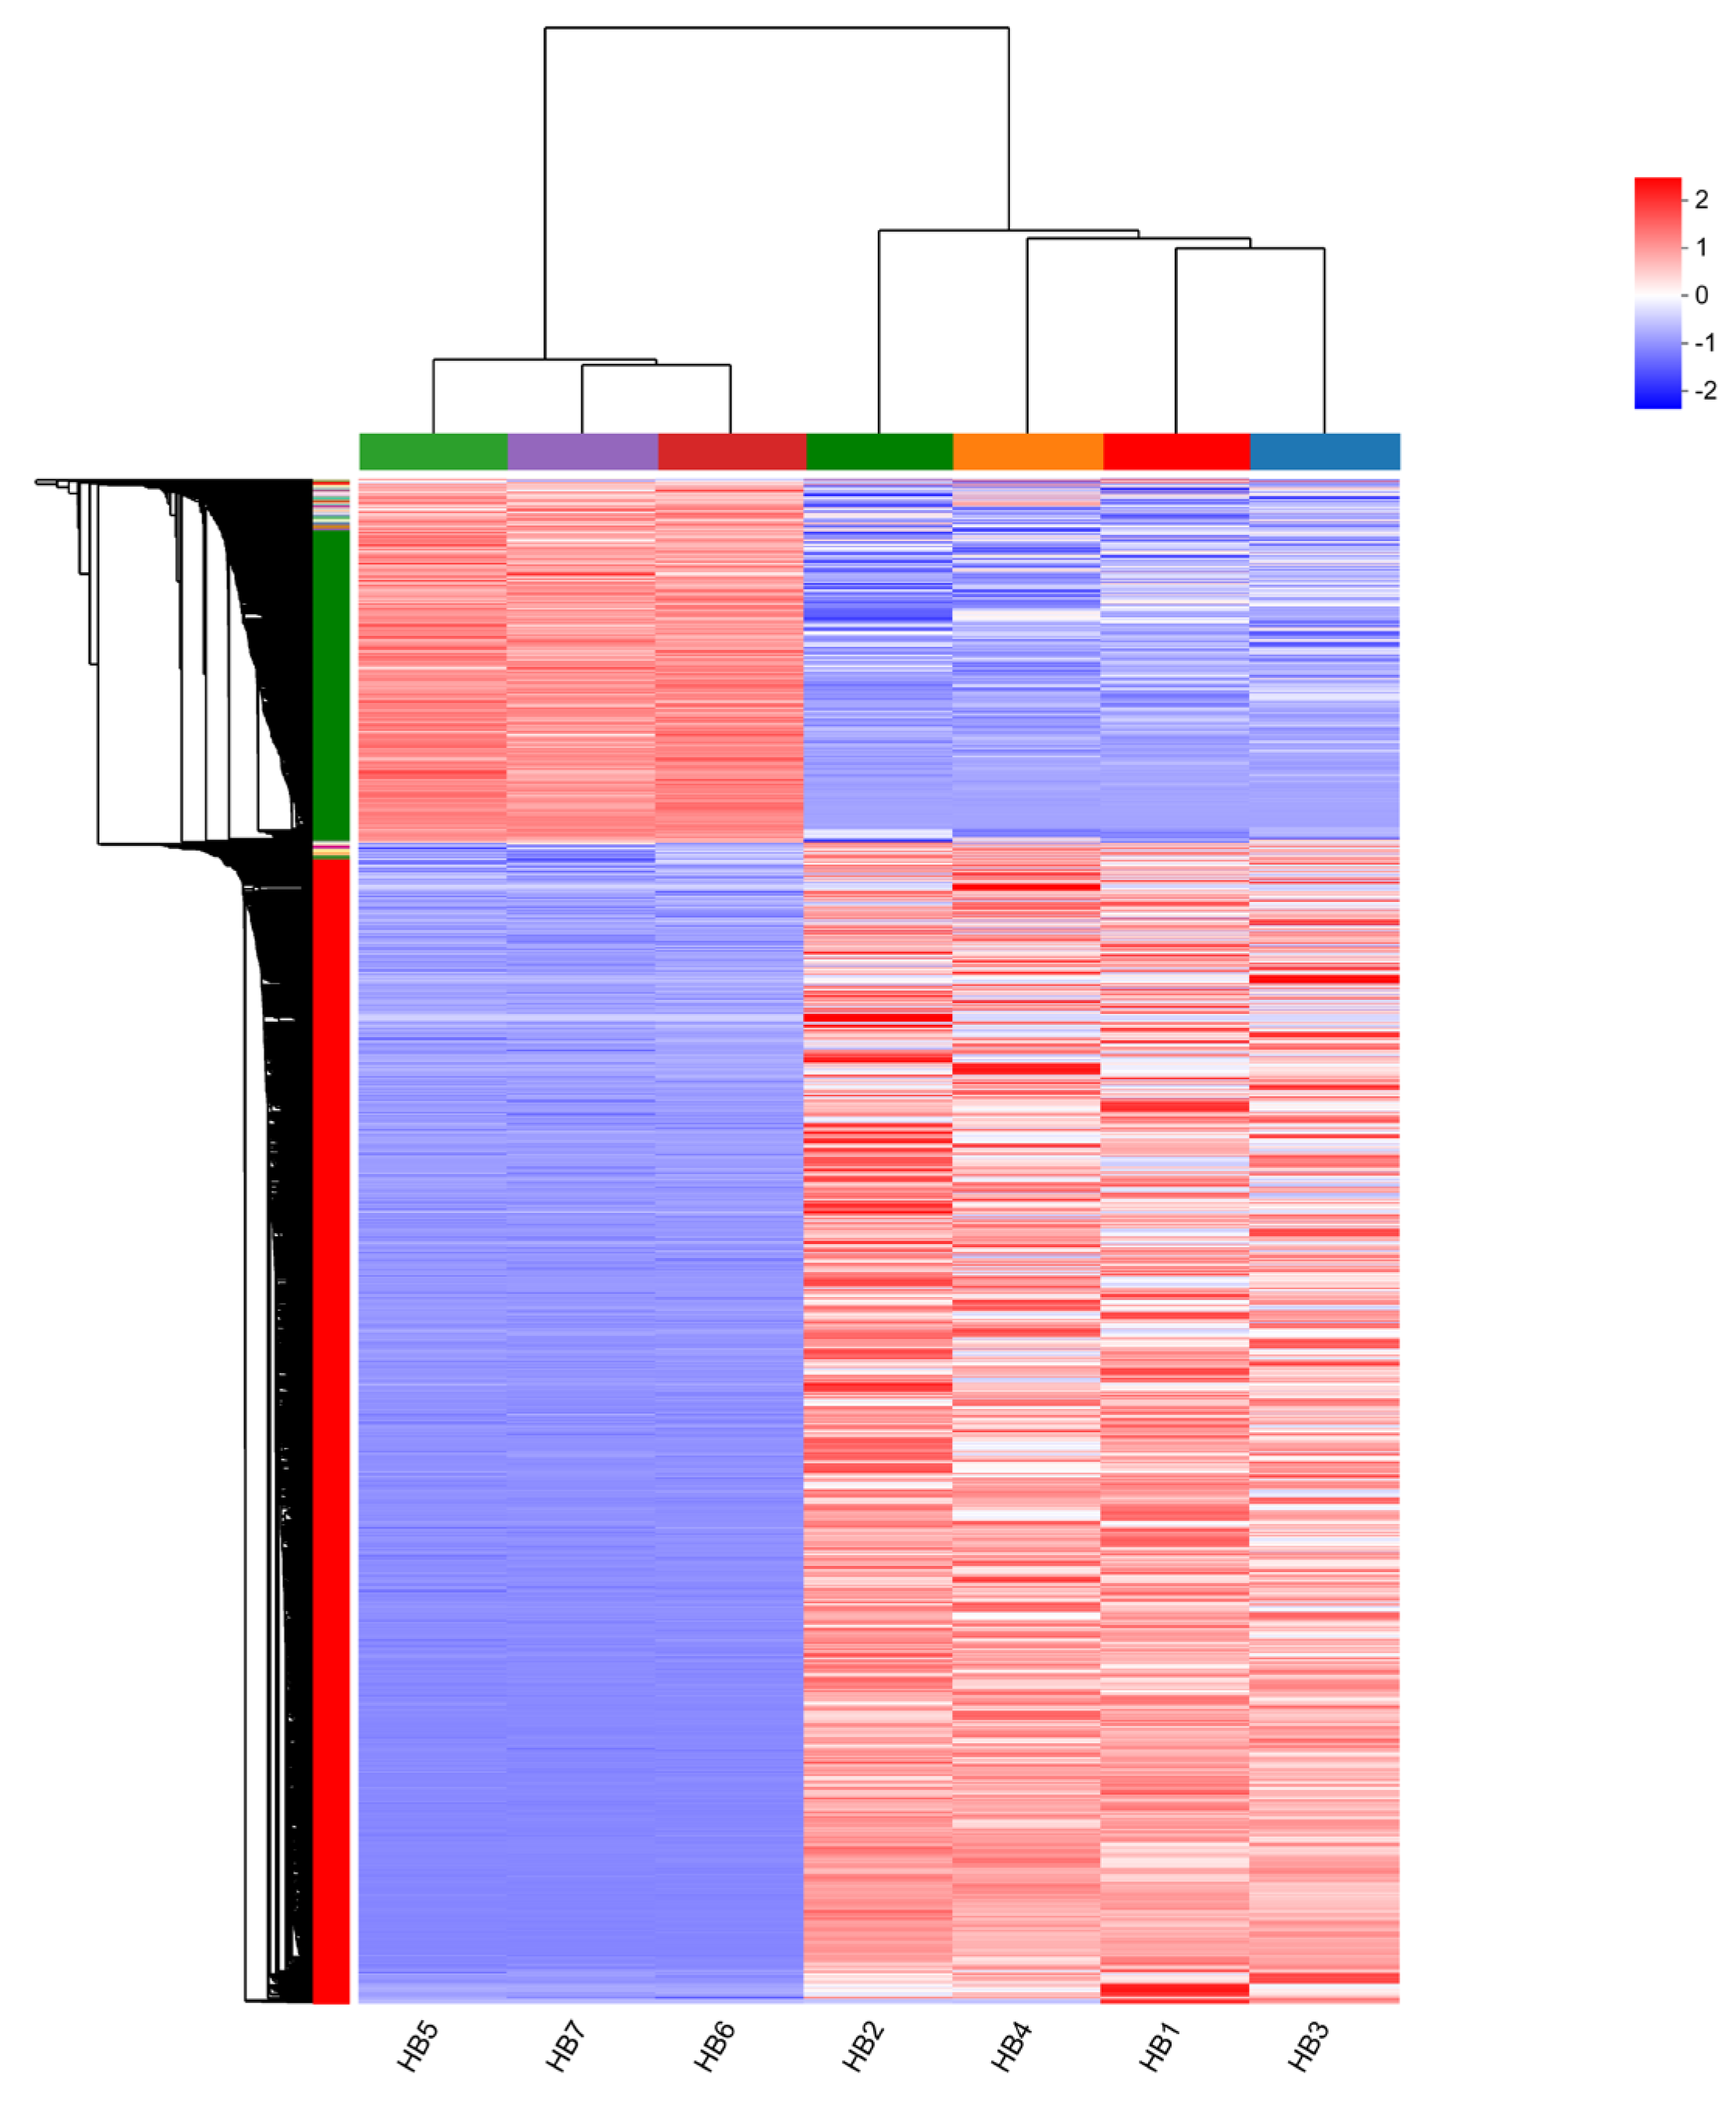
This comparative approach was meticulously designed to identify genes that demonstrate significant expression alterations in response to the increased elevation, effectively distinguishing the transcriptional shifts associated with the morphological adaptations observed in the HAG vs. the LAG. A cluster heat map analysis was performed to investigate the distribution of DEGs. Dendrograms indicate hierarchical clustering of both samples and genes based on the Euclidean distance and the ‘single’ linkage method. The results revealed that the gene expression profiles of V. uliginosum at higher elevations significantly differed from those at lower elevations (Figure 4).
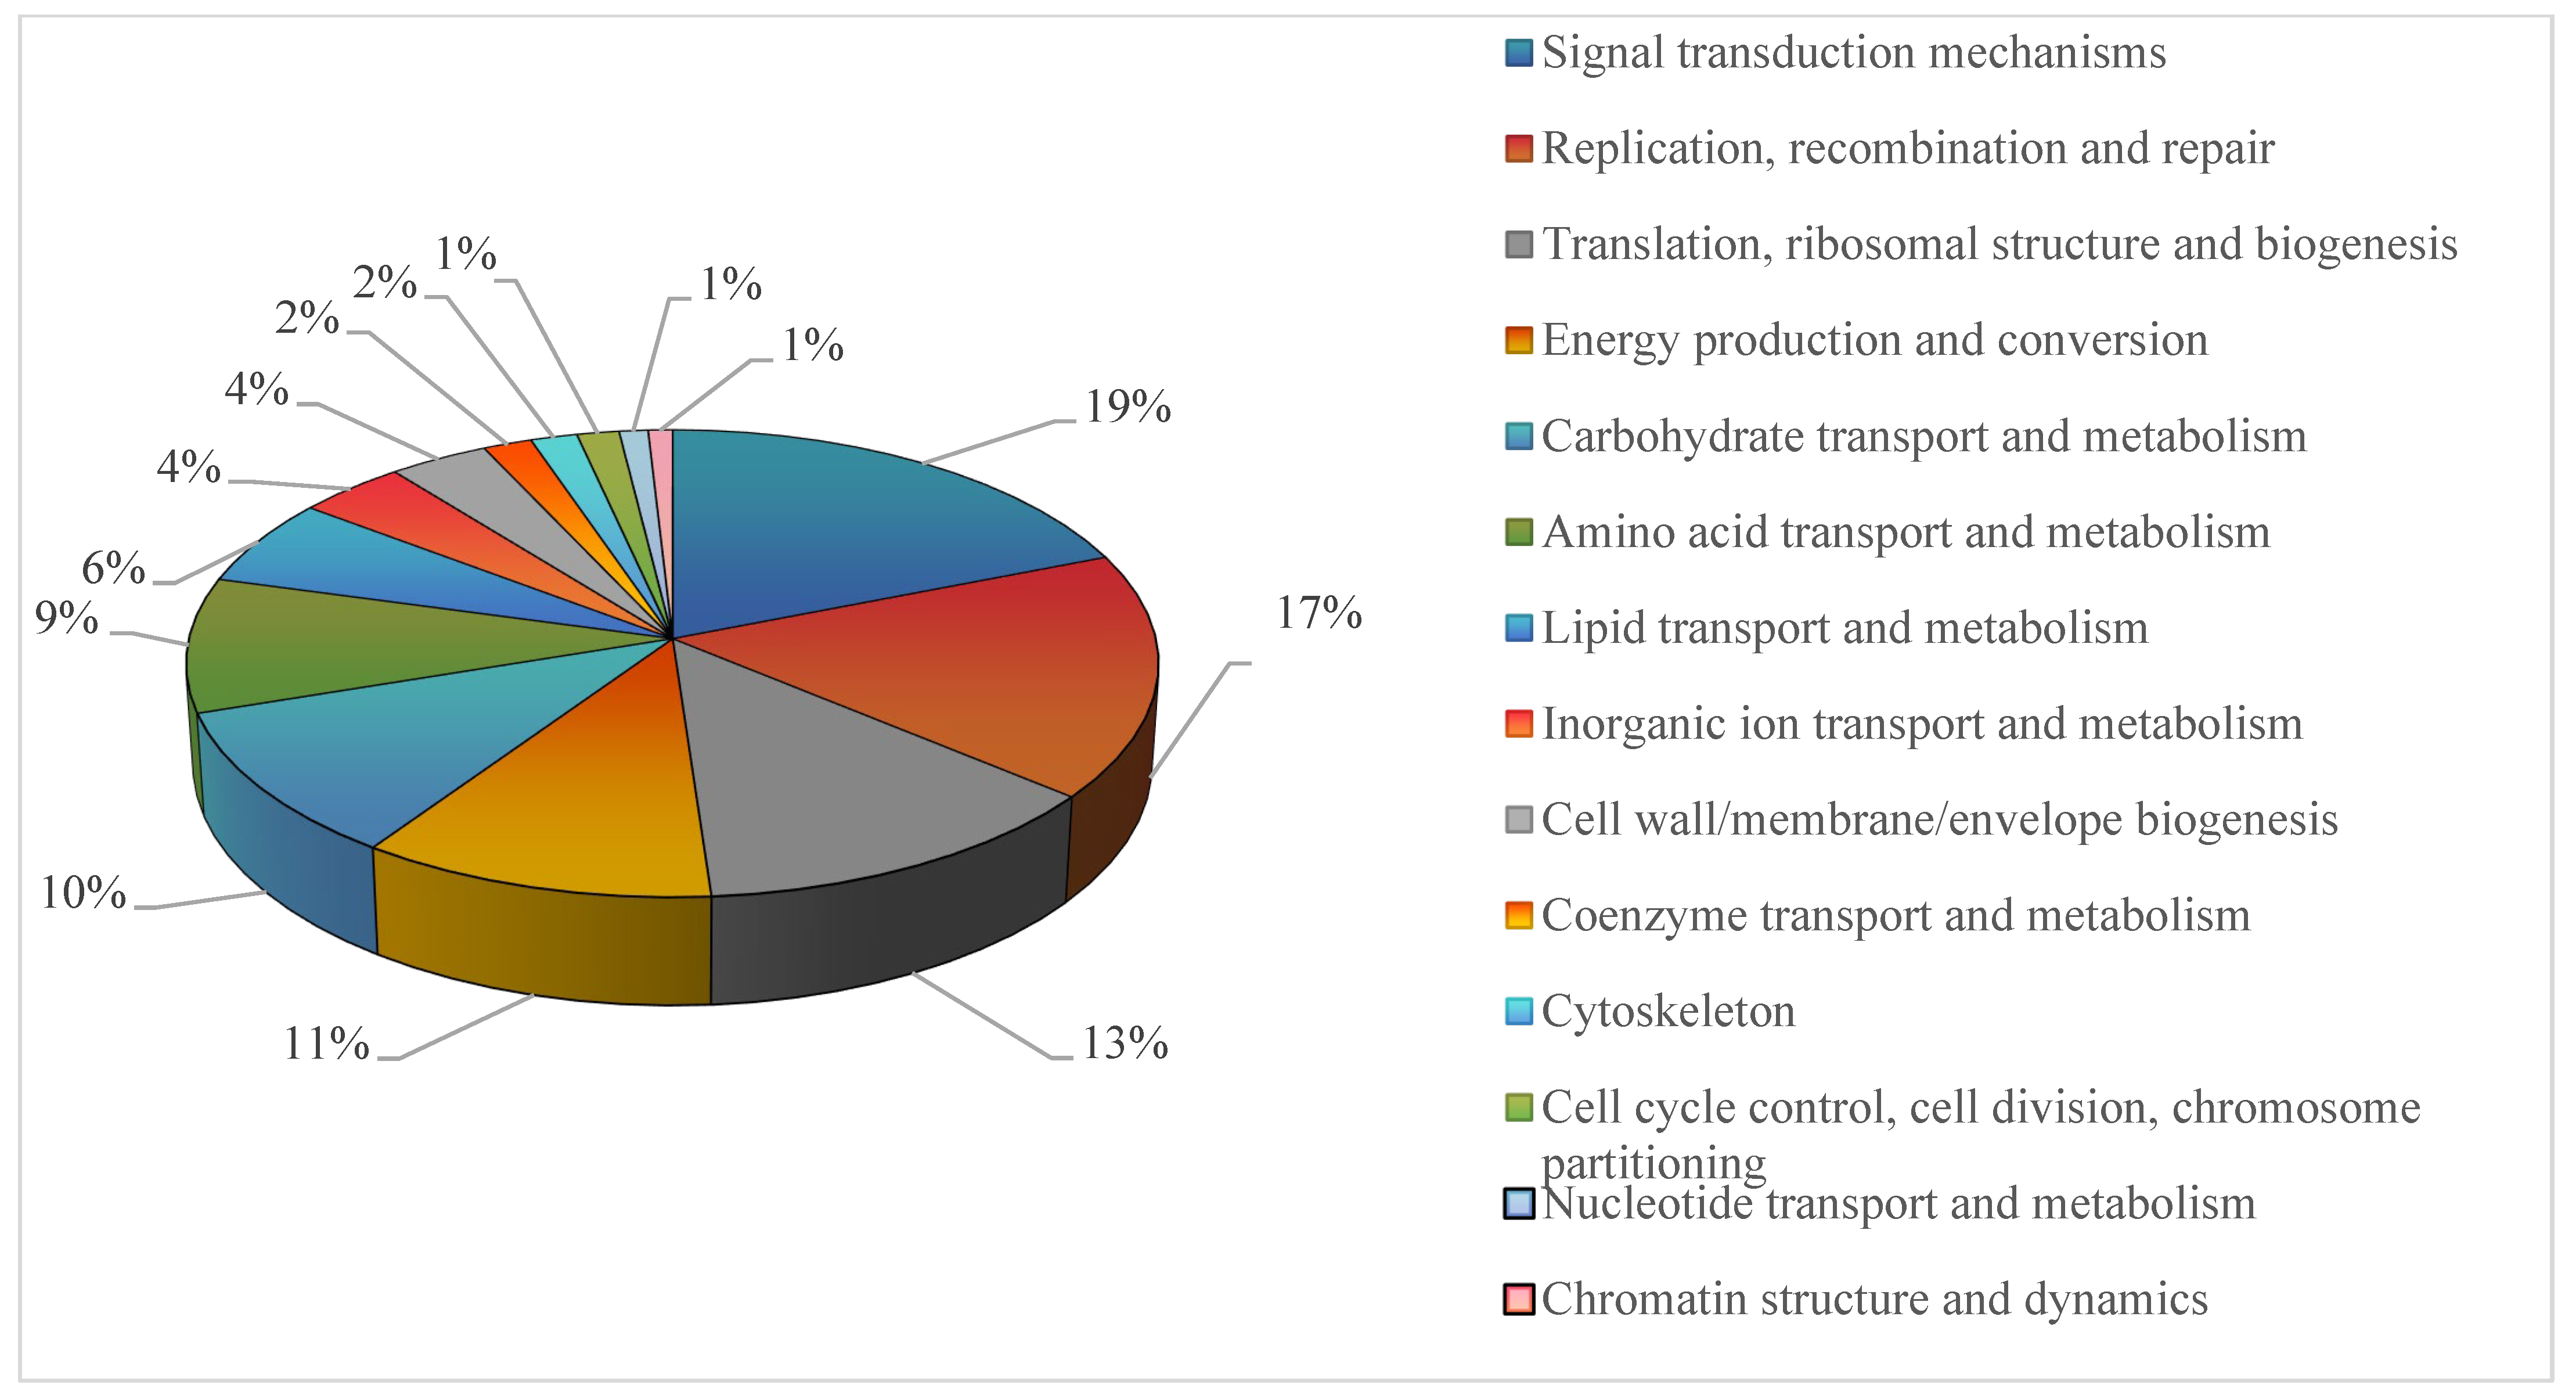
Using the EggNOG database, a functional classification study of DEGs was conducted to learn more about their biological functions. Among these DEGs, 1191 + identified as being closely related to morphological changes. These include key genes involved in signal transduction; energy metabolism; carbohydrate, amino acid, and lipid transport and metabolism; and cellular processes like replication, translation, cytoskeletal organization, and others (Figure 5 and Table S3).

3.4. GO and KEGG Enrichment Analysis of Differentially Expressed Genes (DEGs)

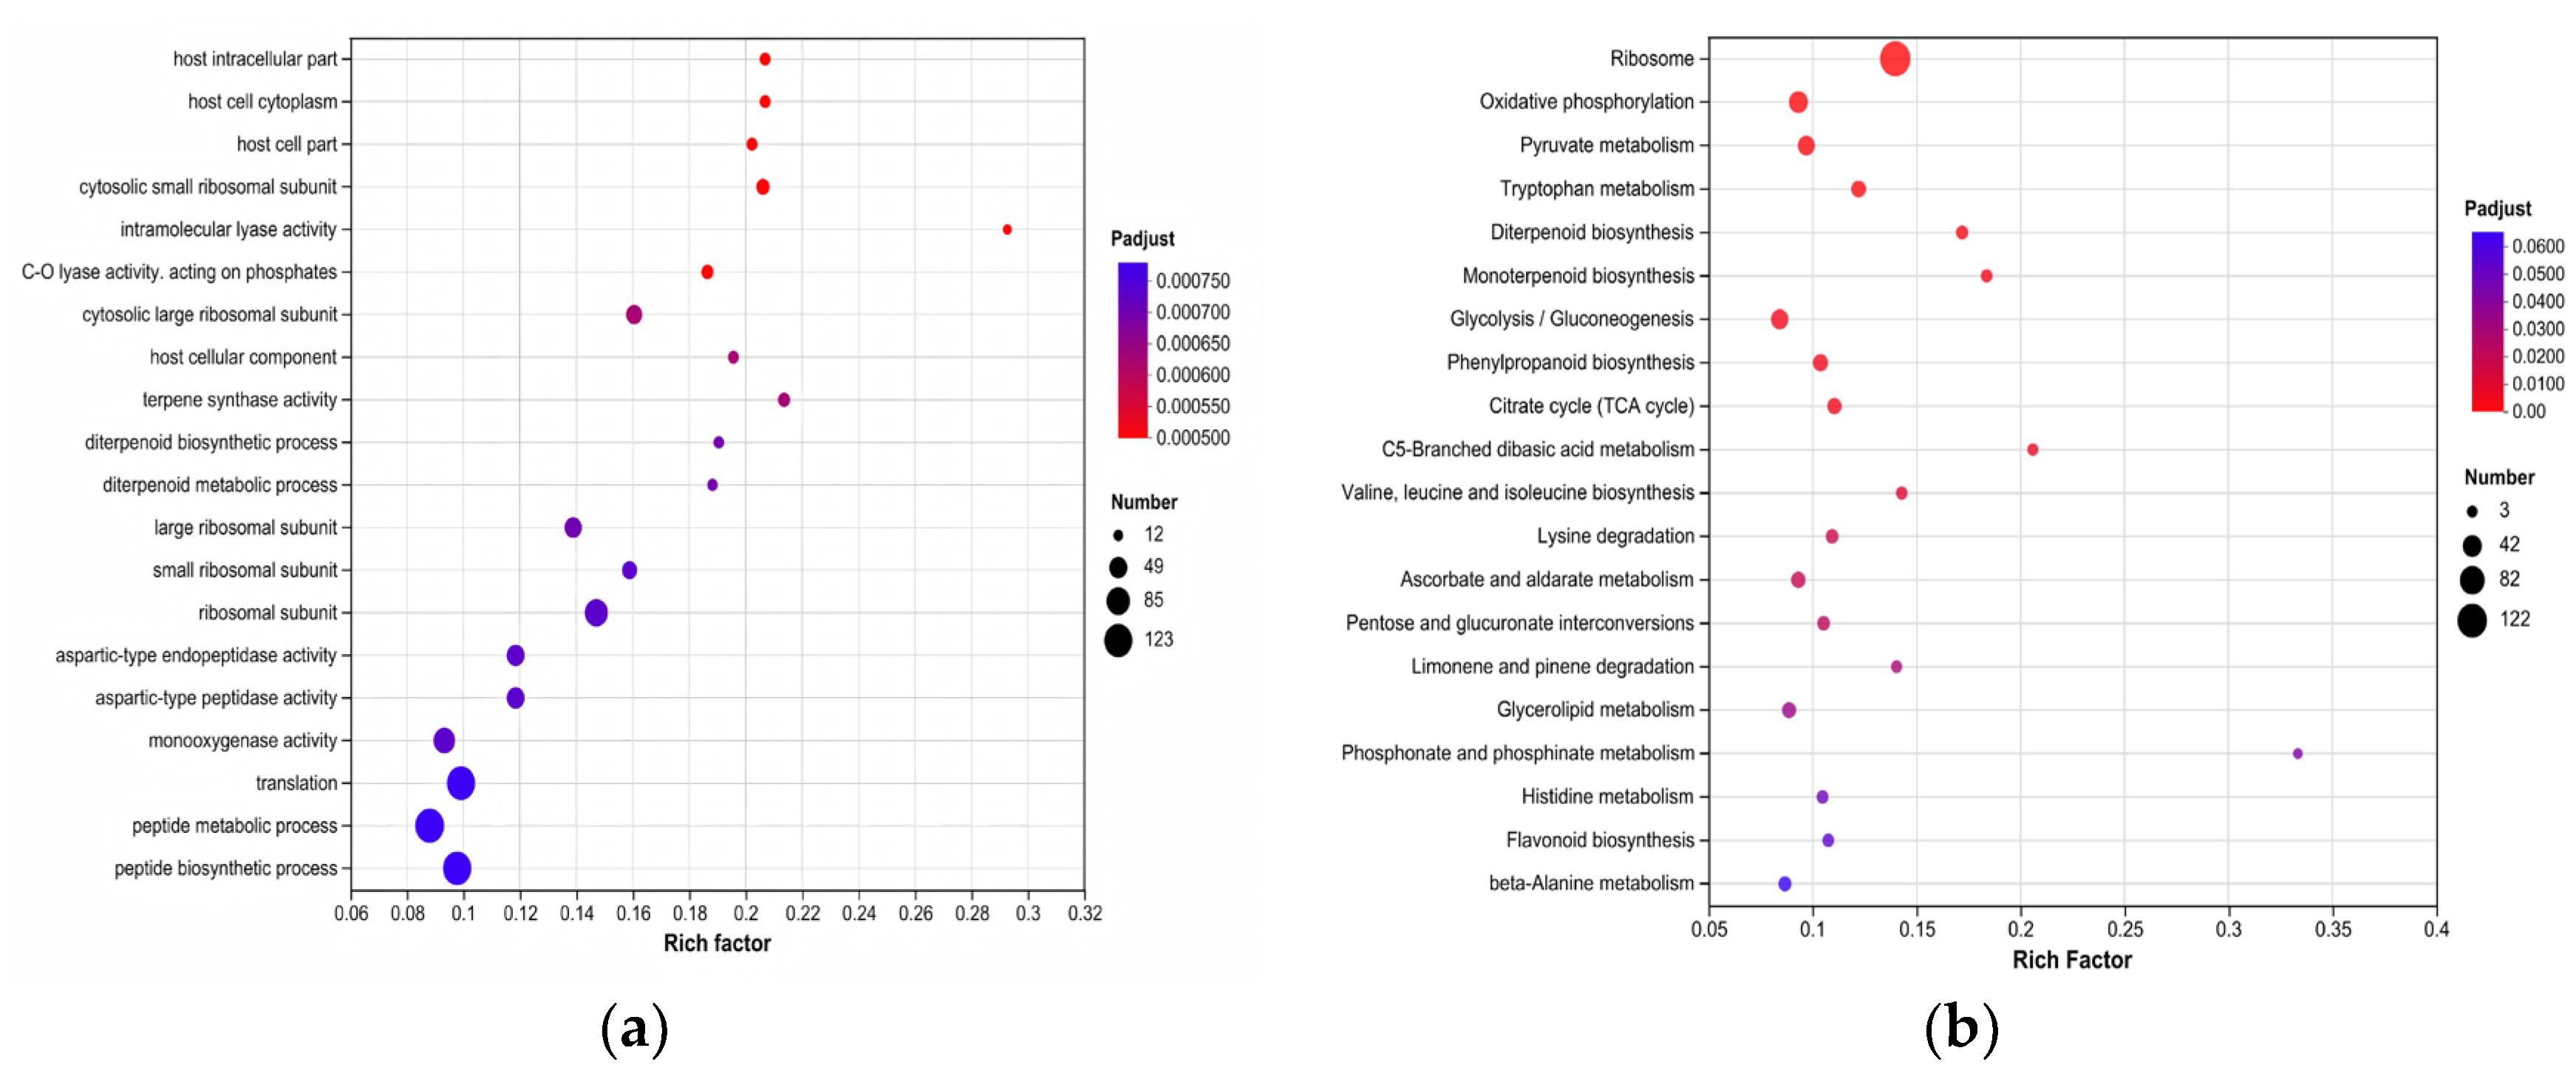
During the Gene Ontology (GO) enrichment analysis of DEGs, we identified a number of significantly enriched GO terms throughout the three main biological categories of cellular component, biological process, and molecular function. In the cellular component category, enriched GO terms include ribosomal subunits (both small and large). In the biological process category, enriched GO terms pertain to diterpenoid biosynthesis, diterpenoid metabolism, translation, and peptide metabolic processes. As for the molecular function category, enriched GO terms encompass intramolecular lyase activity, carbon–oxygen lyase activity acting on phosphates, terpene synthase activity, and aspartic-type endopeptidase activity (Figure 6a).
We identified 288 genes that passed the significance threshold (Padj < 0.05), and they were mapped onto 18 biological pathways using the Kyoto Encyclopedia of Genes and Genomes (KEGG) enrichment analysis. The ribosome, oxidative phosphorylation, pyruvate metabolism, tryptophan metabolism, diterpenoid biosynthesis, monoterpenoid biosynthesis, glycolysis/gluconeogenesis, phenylpropanoid biosynthesis, citrate cycle (TCA cycle), C5-branched dibasic acid metabolism, valine, leucine and isoleucine biosynthesis, lysine degradation, ascorbate and aldarate metabolism, pentose and glucuronate interconversions, limonene and pinene degradation, glycerolipid metabolism, phosphonate and phosphinate metabolism, and histidine metabolism are some of these pathways. This discovery revealed important hints regarding the possible functions of these genes in cellular metabolism and function (Figure 6b).

3.5. Screening of Differentially Expressed Genes (DEGs) Correlated with Morphological Features

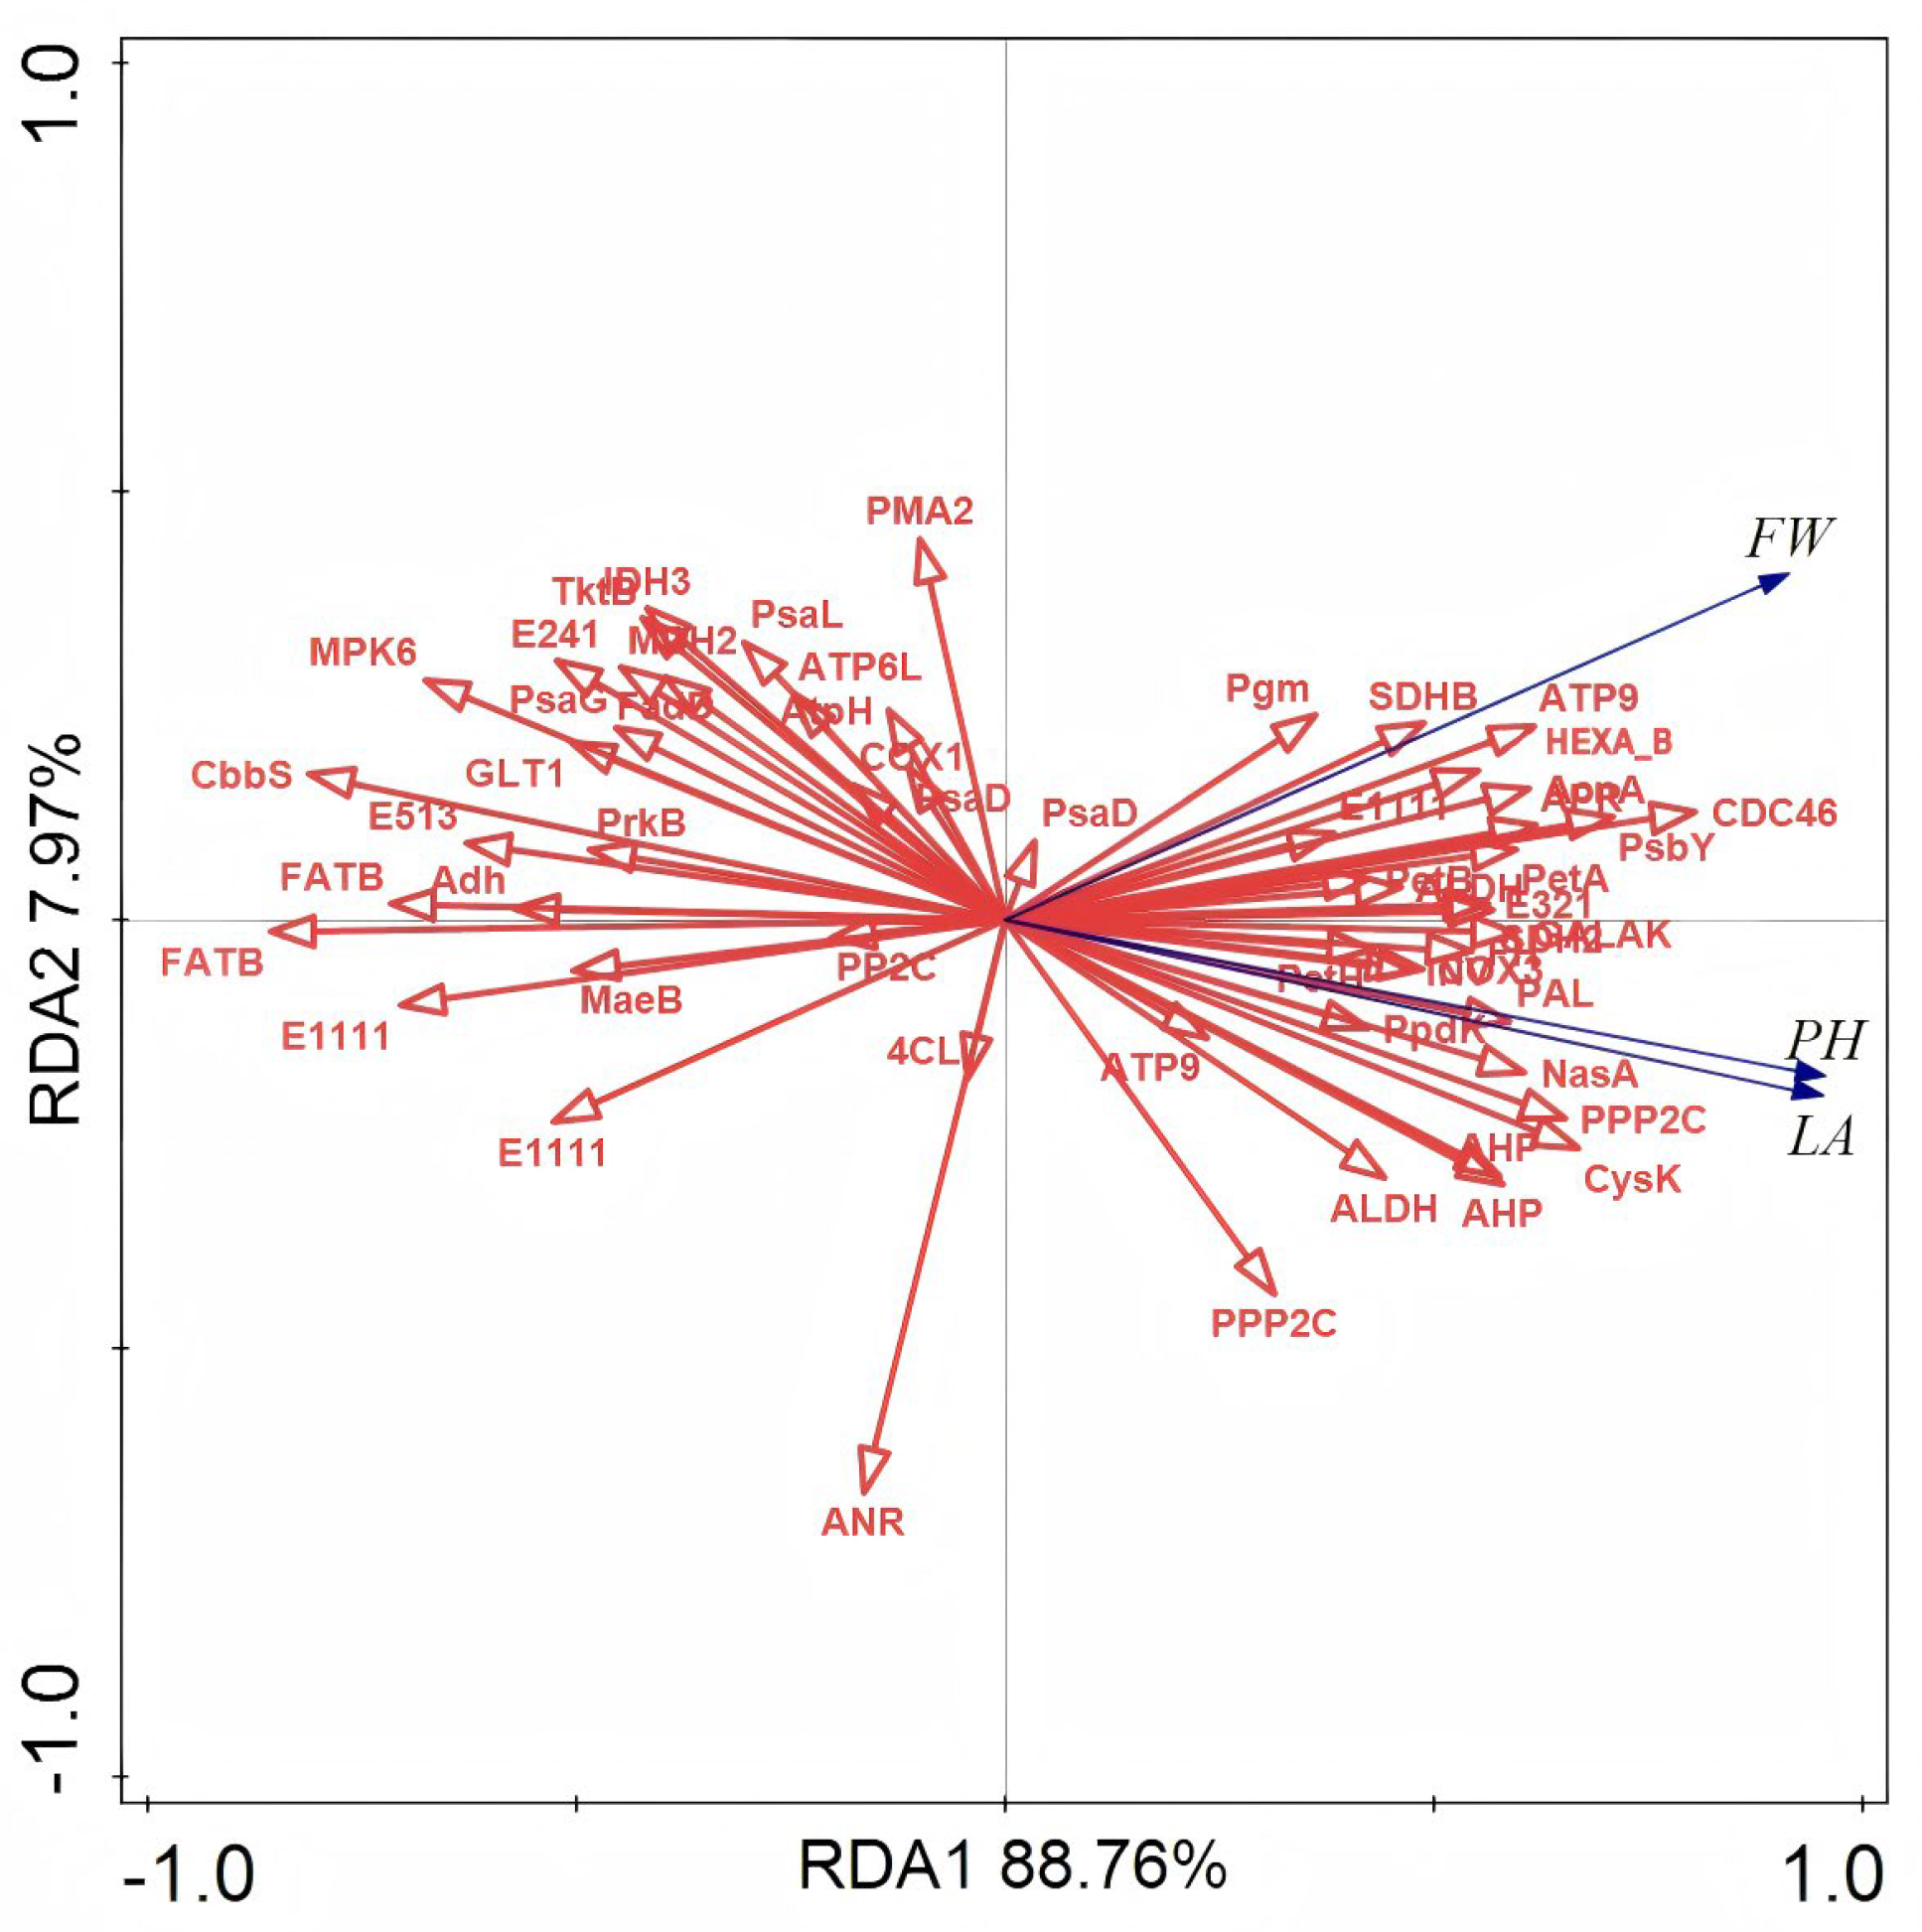
A total of 34 DEGs and key morphological traits, including weight per fruit (FW), leaf area (LA), and plant height (PH), showed significant correlations (p < 0.05) in the redundancy analysis (RDA) performed using Canoco 5 (Figure 7 and Table S4). Notably, with a p-value of 0.002, five genes demonstrated the most robust associations: fatty acyl-ACP thioesterase B (FATB), ribulose-bisphosphate carboxylase small subunit (cbbS shows high homology to bacterial orthologs and is functionally analogous to the plant RBCS gene), hexosaminidase (HEXA_B), anthocyanidin reductase (ANR), and the serine/threonine-protein phosphatase 2A catalytic subunit (PPP2C). This explains 65.2%, 10.7%, 5.2%, 3.4%, and 2.9% of the genetic variation associated with morphological traits.

3.6. Enrichment of DEGs Associated with Morphological Traits

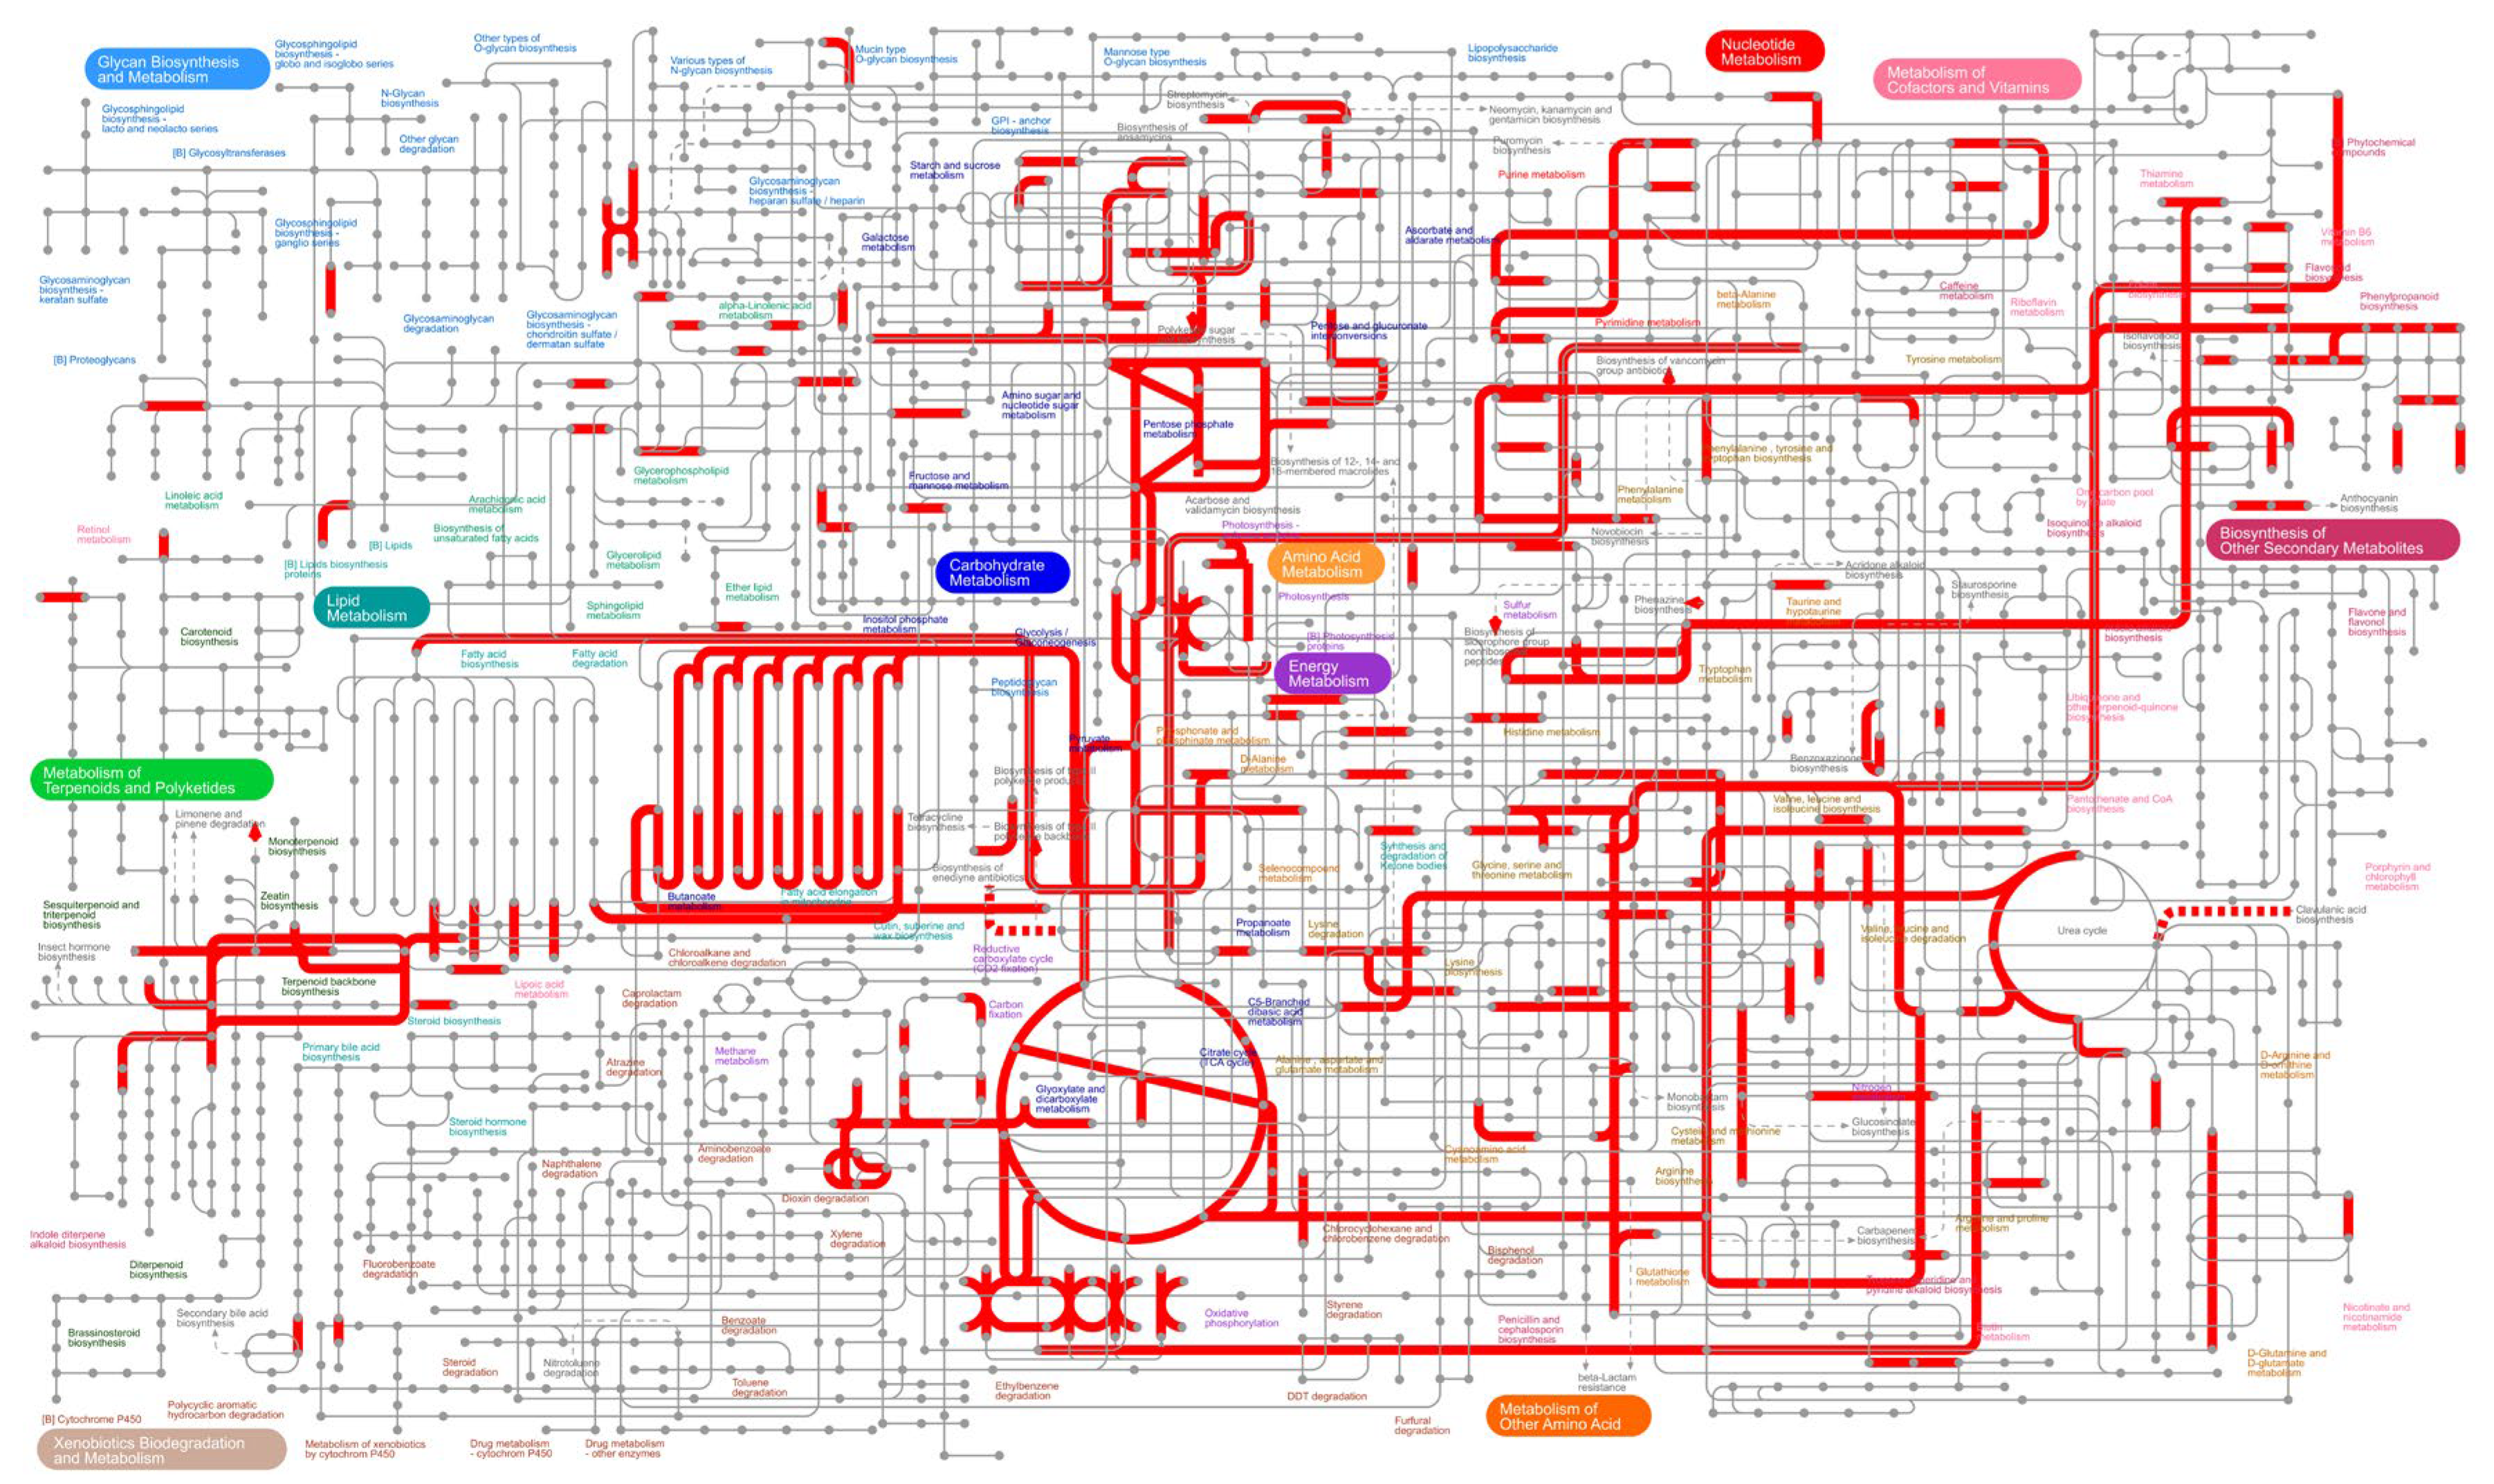
iPath 3.0 was used to analyze the global metabolic pathways of DEGs [29]. This analysis revealed that DEGs were primarily abundant in essential metabolic processes such as lipid metabolism, energy metabolism, carbohydrate metabolism, and amino acid metabolism (Figure 8).

3.7. Analysis of DEGs Associated with Photosynthesis

To further investigate the effects of different elevation stresses on DEGs in photosynthesis, we visualized the transcript abundance of seven DEGs involved in photosynthesis (Figure 9). Six photosynthesis-related DEGs were downregulated in HB5, HB6, and HB7 compared to the LAG: the psbS and psbY genes from photosystem II; the psaE, psaK, and psaH genes from photosystem I; and the petH gene from electron transport. Only the psaN gene in photosystem I was increased in the HAG.

3.8. Analysis of DEGs Associated with Carbohydrate Metabolism

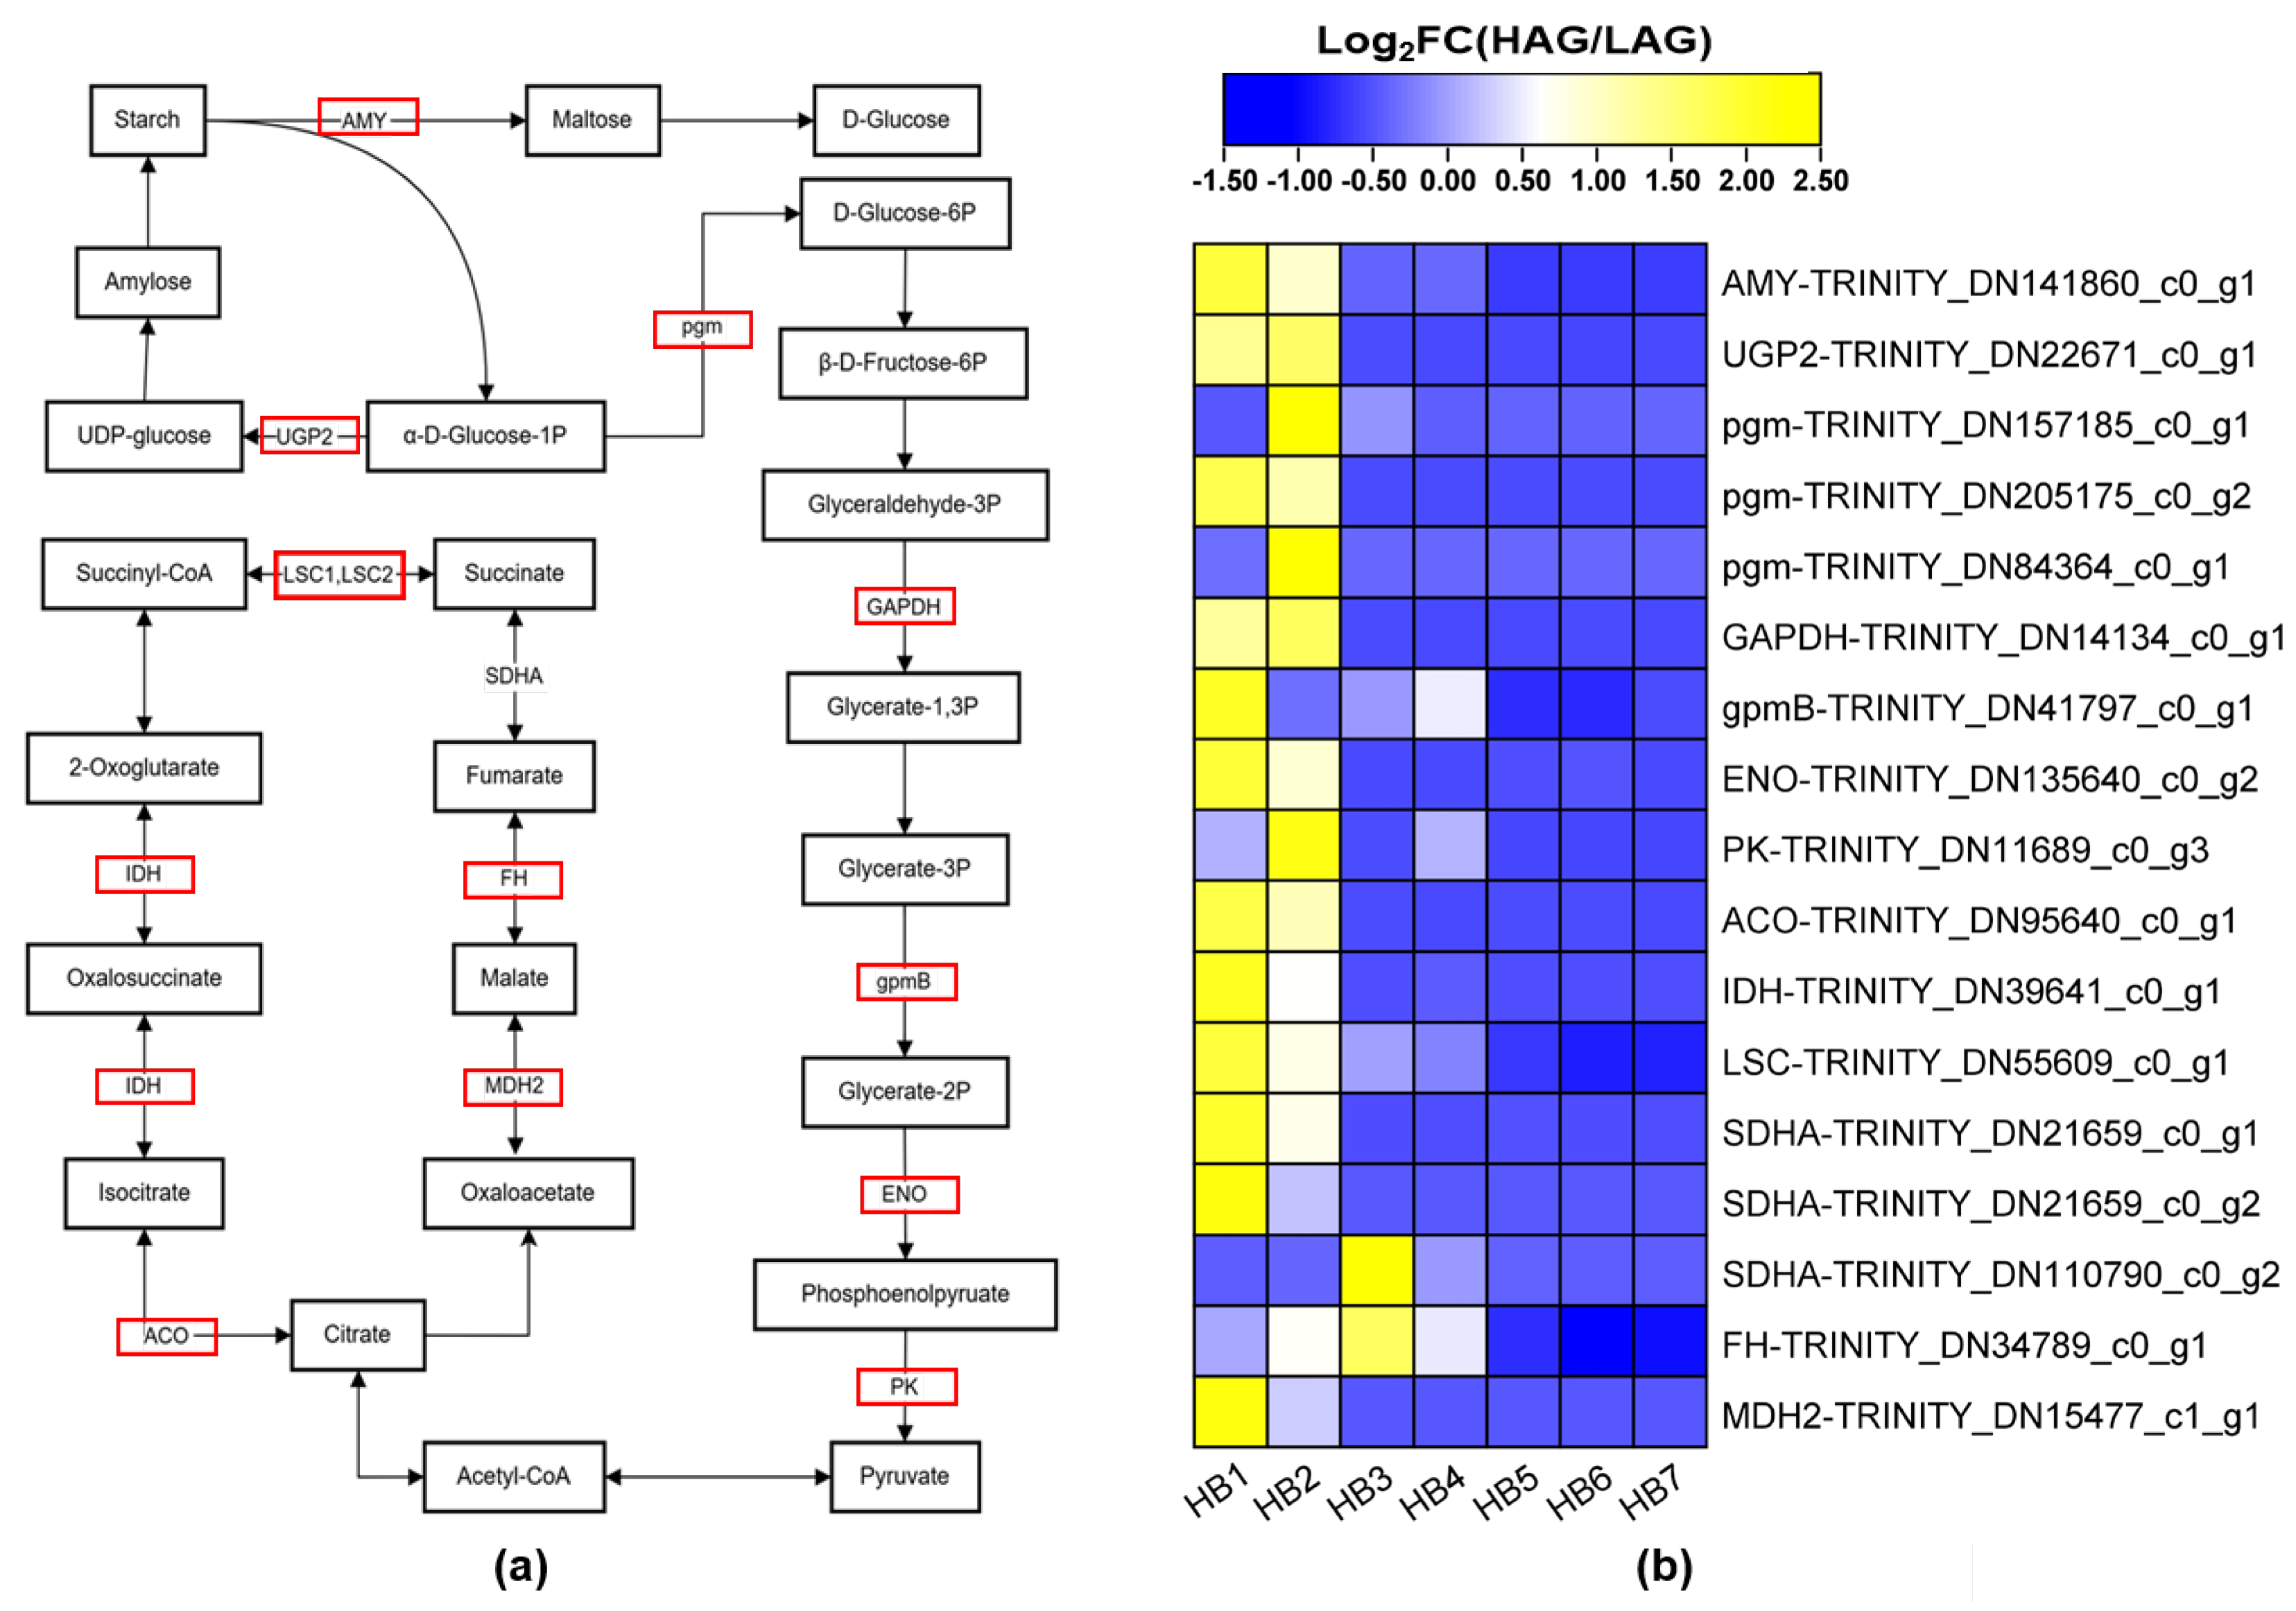
Using the DESeq2 method, we analyzed the expression profiles of key genes associated with carbohydrate metabolism in V. uliginosum. The heatmap shows how the expression levels of these genes change depending on elevation, with a general downregulation pattern being observed for the 17 DEGs as elevation increases (Figure 10). These genes include three succinate dehydrogenase (ubiquinone) flavoprotein subunit (SDHA) genes, three phosphoglucomutase (pgm) genes, one UTP-glucose-1-phosphate uridylyltransferase (UGP2) gene, one alpha-amylase (AMY) gene, one glyceraldehyde 3-phosphate dehydrogenase (GAPDH) gene, one 2,3-bisphosphoglycerate-dependent phosphoglycerate mutase (gpmB) gene, one fumarate hydratase (FH) gene, one malate dehydrogenase (MDH2) gene, one enolase 1/2/3 (ENO) gene, one pyruvate kinase (PK) gene, one aconitate hydratase (ACO) gene, one isocitrate dehydrogenase (IDH) gene, and one succinyl-CoA synthetase alpha subunit (LSC) gene.

3.9. Analysis of DEGs Associated with Lipid Metabolism

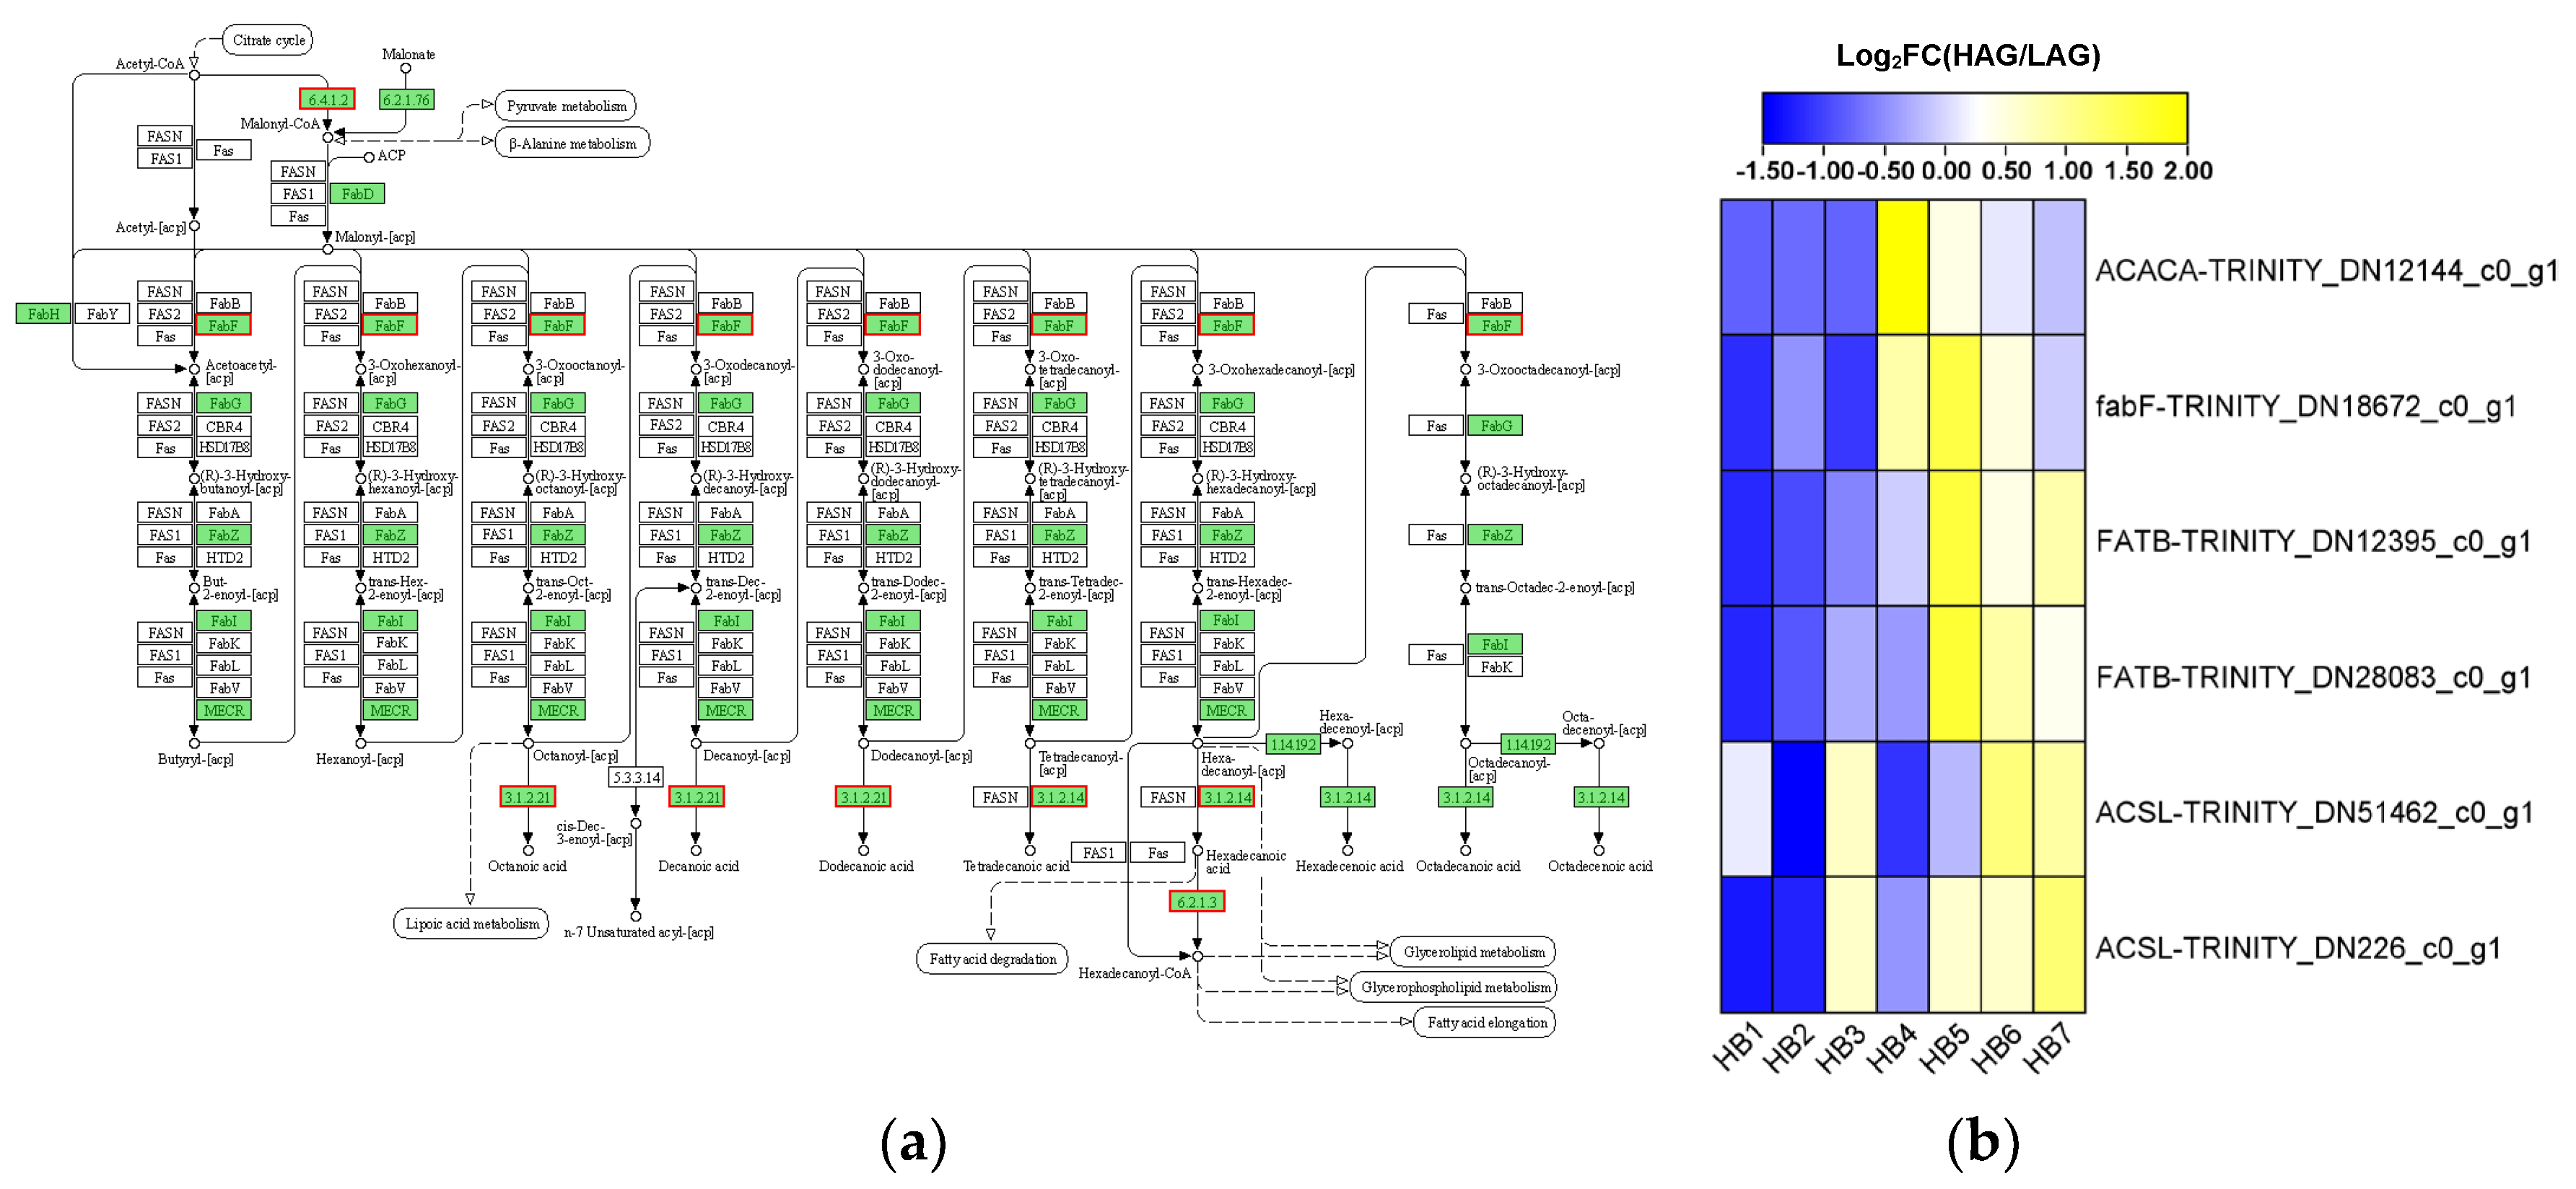
In the fatty acid synthesis and degradation pathway, a total of six structural DEGs were upregulated approximately in HAG, including two fatty acyl-ACP thioesterase B genes (FATB), two long-chain acyl-CoA synthetase (ACSL) genes, one 3-oxoacyl-[acyl-carrier-protein] (fabF) gene, and one acetyl-CoA carboxylase/biotin carboxylase 1 (ACACA) gene. This suggests an increasing trend in the expression of DEGs involved in lipid metabolism in V. uliginosum at high elevations (Figure 11).

3.10. Analysis of DEGs Related to Plant Hormone Signal Transduction

To further understand the mechanisms involved in phytohormone signaling in V. uliginosum at different elevations, phytohormone-related genes were identified, including the signaling pathways of auxin, gibberellin, abscisic acid, ethylene, and brassinosteroid (Figure 12). Furthermore, the expression levels of seven genes were significantly downregulated in HAG, including the two abscisic acid receptor PYL family (PYL) genes, two xyloglucosyl transferase (TCH4) genes, one brassinosteroid insensitive 1-associated receptor kinase 1(BAK1) gene, one ethylene-insensitive protein 3 (EIN3) gene, and one DELLA protein (DELLA) gene. Notably, the expression levels of genes encoding auxin-responsive protein (AUX/IAA) showed significant upregulation in the HAG.

3.11. Validation of RNA-Seq with qRT-PCR

Ten genes with a more pronounced trend of up or downregulation with elevation were selected from the DEGs. The amplification efficiency analysis, conducted using 10-fold-diluted cDNA as a template, revealed that the amplification efficiencies of 11 genes, including 1 reference gene, ranged from 90.2% to 108.6% (Table S1). Additionally, the melting curves of all primers exhibited a single peak, indicating specific amplification. It was revealed that the expression trends of the 10 genes were essentially consistent with the transcriptome data (Figure 13), suggesting that the RNA-Seq results were accurate and reliable.

4. Discussion

So far, studies on Changbai Mountain-based V. uliginosum have mainly focused on chemical composition, functional activity, population dynamics, and resource distribution [30,31], but this is the first time that RNA-Seq technology has been utilized to study the mechanism of morphological changes in V. uliginosum at different elevations.

4.1. Morphological Adaptations of Plants at High Elevations

Plants at high elevations frequently exhibit various morphological changes, such as smaller leaves, more compact plant structures, and more developed root systems, to cope with the environmental stressors of low oxygen, low temperature, and increased radiation [32,33,34]. We confirmed that the morphological variation pattern of V. uliginosum in the Changbai Mountain area aligns with that observed in plants from other high-altitude regions (Figure 1). As these morphological adjustments are likely to be adaptive responses to the distinct environmental forces encountered at different elevations, these populations are thus well-suited to analysis of differential gene expression for identification of genes and pathways involved.

4.2. The Gene Expression and Metabolic Processes in Plants Are Altered Under High-Altitude Conditions

Research has shown that plants regulate gene expression in response to different environmental circumstances. Morphological variations are a visible manifestation of a plant’s response to climatic conditions at high altitudes, when temperature and oxygen levels fluctuate. They are closely linked to specific gene expression patterns [12]. For example, adjustments to energy metabolism have a significant effect on leaf photosynthesis and growth, thereby influencing leaf area [35]. Carbohydrate metabolism changes alter the transportation and distribution of glucose in plants, which influence fruit size [36]. Changes in lipid metabolism, on the other hand, influence the stability and permeability of cell membranes [37]. In addition, phytohormones in signaling pathways have a direct impact on the form and function of leaves, fruits, and the whole plant [38]. In this study, using V. uliginosum leaves as materials, 1191 DEGs associated with morphological variations were determined by RNA-Seq technology. These genes might play key roles in signal transduction; energy metabolism; transport and metabolism of carbohydrates, amino acids, lipids, and inorganic ions; and the formation of cell walls, membranes, and envelopes (Figure 5). The GO and KEGG analyses revealed that the biosynthesis and metabolism of terpenoid compounds, especially diterpene, were obviously enriched (Figure 6). Diterpenoid compounds play an important role in plant resistance to environmental stress due to their structural diversity. For instance, momilactones have been found to be responsive compounds in plants that exhibit resistance to drought, salinity, chilling, and UV damage [39,40]. We also noticed that a plant hormone, gibberellic acid (GA) [40], belongs to diterpenoid compounds. Therefore, V. uliginosum may regulate the synthesis of gibberellin to affect morphological changes in the plant, allowing it to adapt to the adverse environment at high altitudes.

4.3. The Morphogenesis Mechanism of the Adaptation of V. uliginosum to High-Altitude Environments

By combining these results with those of the redundancy analysis of DEGs associated with morphological changes (Figure 7), we provided insights into the expression of DEGs in lipid metabolism, carbohydrate metabolism, photosynthesis, and phytohormone signaling pathways.

4.3.1. Lipid Metabolism Pathway

Lipids, as an important component of plant cell membrane structure, as well as signal molecules and energy storage substances, are crucial for the growth, development, and response to adversity in plants [41]. Lipid expression has a direct impact on plant physiological functions and morphological features [42]. As altitude rises, the morphology and anatomical structure of plant leaves change significantly, including stomatal density and the relative position of epidermal cells [43]. ZmGPAT1 and ZmDGK2 genes involved in the lipid metabolism pathway were considerably up-regulated under low-temperature stress, allowing plants to maintain cell membrane fluidity and minimize membrane lipid peroxidation, thereby protecting them from cold damage [44]. Furthermore, the accumulation of triacylglycerols in plants is critical for resistance to adversity, and an increase in lipids helps to adjust the intracellular lipid composition, improves plant tolerance to unfavorable environments, and may cause changes in plant morphology, such as wilting of leaves and young stems, decrease or even closing of stomatal openings, or increases in the thickness of the waxy layer on the leaves’ surfaces [45]. Our results show that all six DEGs related to lipid biosynthesis were up-regulated in high-altitude V. uliginosum samples (Figure 11). The functions of these genes are predominantly associated with the biosynthesis of fatty acids. For instance, the FATB gene promotes the release of fatty acids from acyl carrier proteins and increases the availability of free fatty acids, and the ACACA and ACSL genes are associated with the activation of long-chain fatty acids and the synthesis of acetyl coenzyme A, which is the initiator of fatty acid synthesis and is essential for fatty acid synthesis and storage [46]. The results reveal that under high-altitude conditions, the accumulation of lipids in V. uliginosum might be enhanced by increasing the fatty acid synthesis pathway, meaning the plant can defend itself in unfavorable environments. In this process, morphological changes may also occur simultaneously in V. uliginosum at different altitudes.

4.3.2. Carbohydrate Metabolism Pathway

Carbohydrates are the main products of plant photosynthesis. Carbohydrate metabolism changes in plants not only affect their physiological functioning but also cause changes in plant form [47]. Unfavorable environmental factors in high-altitude regions, such as chill and dryness, can affect plant glucose metabolism and storage, resulting in morphological changes [48]. For example, in low-temperature settings, Saussurea involucrata’s soluble sugars and total phenol content increase, causing it to exhibit adaptive features such as “greenhouse”-like bud structures and dense coverage with long wooly hair [49]. In drought conditions, the plant regulates the metabolic process of non-structural carbohydrates, promoting starch decomposition in the root system and increasing the content of soluble sugars, thus affecting the structure and growth direction of the root system and making it more adapted to the drought environment [50]. Under severe environmental conditions, the expression of carbohydrate-related genes and metabolic pathways in plants will change accordingly. For example, drought stress reduces the expression levels of the hexokinase (HXK) gene and starch biosynthesis-related genes in the corn ovary [51]. The results of this study reveal that at high altitudes, the expression of all 17 important genes associated with glucose metabolism is downregulated (Figure 10). These genes primarily contribute to energy production pathways, such as the glycolytic pathway (AMY, GAPDH, ENO, and PK) and the tricarboxylic acid cycle (ACO, IDH, LSC, FH, MDH2, and SDHA), and some of them are related to starch production (UGP2). These data suggest that V. uliginosum may employ strategies such as slowing carbohydrate catabolism and inhibiting energy expenditure and starch biosynthesis to promote soluble sugar storage in response to the detrimental impacts of high altitudes. Alterations in carbohydrate metabolism cause changes in plant morphology, which may be one of the reasons for the morphological differences among V. uliginosum at different elevations. Alterations in carbohydrate metabolism might cause morphological alterations, which may explain the observed variances in V. uliginosum morphology across elevations.

4.3.3. Photosynthesis Pathway

Photosynthesis is a key process in plants that converts energy and produces organic matter. High-altitude plants may adjust to differences in photosynthetic activity caused by changes in light intensity by modifying their morphology [52], such as by altering leaf angles and relocating chloroplasts to minimize excess light absorption [53]. Additionally, plants may demonstrate alterations in light-induced morphogenesis, including leaf expansion, chloroplast biogenesis, stem elongation inhibition, and enhancement of root growth and lateral root development [12]. Under high-light-intensity conditions, Photosystem II’s maximum photochemical efficiency and the rate of photosynthetic electron transport are significantly reduced. This downregulation may serve to decrease light absorption during photosynthesis in high-light situations, protecting photosynthetic tissues from potential high-light-induced damage and resulting in typical photoinhibition in plants [52,54]. In this study, we discovered that six photosynthesis-related DEGs were significantly downregulated in high-altitude areas, particularly the essential components of photosystems II and I, psbS and psaE (Figure 9). This indicates that V. uliginosum in high-altitude areas may provide plant protection by regulating the expression of specific photosynthesis-related genes and lowering photosynthesis under high-light conditions. Changes in the expression of these genes could be one of the causes of V. uliginosum’s morphological changes at different elevations.

4.3.4. The Modulation of Phytohormones in High-Altitude Environments

Alterations in plant hormone signal transduction pathways have a substantial impact on plant morphogenesis and stress responses [55]. Plant hormones such as auxin (AUX), cytokinin (CK), gibberellin (GA), abscisic acid (ABA), ethylene (ET), and brassinosteroids (BRs) regulate plant growth, development, and adaptation to environmental changes at high altitudes or in harsh environments via complicated signaling networks [56,57]. Abiotic stress typically increases the content of some hormones closely related to stress tolerance in plants, such as ABA, ET, and BRs [58,59,60], while decreasing the content of hormones that promote plant growth, such as IAA and GA [61]. As a fundamental mechanism in plant response to auxin signaling, the auxin signaling deterrent protein Aux/IAA blocks downstream cascades and inhibits the expression of auxin-responsive genes [62,63]. The findings of this study indicate that the expression of the AUX/IAA gene was significantly up-regulated at high altitudes. This suggests that V. uliginosum may mitigate the biological effects of auxin through increased expression of the AUX/IAA gene, thereby influencing plant growth, development, and phenological morphology and enhancing tolerance to high-altitude environments [64]. However, the expression of the other phytohormone-related DEGs showed a downward trend (Figure 12). For instance, DELLA proteins serve as crucial inhibitors of gibberellin signaling, and lowering their expression increases gibberellin activity, encouraging plant growth and development [65]. Nevertheless, the observed phenotypic changes in V. uliginosum, such as shorter plants and smaller leaves, are obviously different from the responses of gibberellin [55,66]. We speculate that the reason for this phenomenon may be the result of the synergistic action of gibberellin with other plant hormones. Interestingly, the metabolic process of diterpene compounds associated with gibberellin biosynthesis may be closely linked to the morphological adaptations of V. uliginosum at high altitudes (Figure 6). This implies that gibberellin may serve as a key phytohormone in the morphogenesis of V. uliginosum. In the ABA signaling pathway, PYL gene-encoded ABA receptor protein serves as a critical initiator of ABA signal transduction. The downregulation of PYL gene expression in V. uliginosum results in reduced levels of ABA receptors, consequently impairing ABA signal transmission. This finding indicates that V. uliginosum may possess a distinct ABA stress adaptation mechanism compared to other plant species [67]. Furthermore, in V. uliginosum, the downregulation of EIN3 gene expression reduces the plant’s ability to respond to ethylene signaling, impairing a variety of physiological activities [68]. Finally, in the BR signaling transduction pathway, the downregulated expression of Brassinosteroid-insensitive 1 (BRI1)-Associated Kinase 1 (BAK1), a co-receptor kinase of BRs, blocks downstream signaling cascades and inhibits the expression of brassinosteroid-responsive genes [69]. TCH4 is a pivotal downstream-responsive gene in the BR signaling pathway, encoding xyloglucan endotransglucosylase/hydrolase (XTH), which plays a crucial role in cell wall remodeling. Decreased expression of TCH4 would impair the capacity for cell wall modification and restructuring, thereby affecting cell elongation and division and ultimately leading to constrained plant growth [70]. In conclusion, the synergistic regulation of multiple phytohormone signaling pathways may shape the distinct growth and developmental patterns of V. uliginosum, as well as its ability to adapt to adverse conditions at high altitudes.
Based on the aforementioned research findings, we propose the following hypothesis regarding the multi-level regulatory model of morphogenesis in V. uliginosum on the Changbai Mountains: under high-altitude environmental conditions, the effector pathways of plant hormones, such as gibberellin and auxin, are primarily modulated to dynamically reconstruct the hormonal signaling framework. This is characterized by the downregulated expression of the gibberellin inhibitor DELLA protein, the enhanced antagonistic effect of the auxin transcriptional repressor AUX/IAA, the reduced expression of the ABA receptor PYL family, the ethylene response factor EIN3, and the BR response factor TCH4. The synergistic interactions among plant hormones further drive differential gene expression and metabolic shifts. For instance, the coordinated suppression of photosynthesis-related genes (e.g., cbbS and psbS) and glycolytic pathway genes (e.g., AMY and GAPDH) collectively constrains carbon assimilation efficiency; the downregulation of tricarboxylic acid (TCA) cycle-related genes (e.g., ACO and IDH) results in reduced energy expenditure, while the activation of lipid metabolism-related genes (e.g., FATB and ACACA) promotes lipid synthesis and energy storage. Ultimately, this hormone-mediated resource allocation strategy redirects carbon flux from carbohydrate metabolism toward lipid biosynthesis. This leads to adaptive simplification of morphological traits—such as reduced leaf area to minimize transpiration loss, decreased single fruit weight to lower reproductive investment, and reduced shrub height to enhance stress resistance—thereby contributing to the high-altitude adaptation phenotype of V. uliginosum.

5. Conclusions

In summary, during its long-term adaptation to environmental conditions, the morphology of V. uliginosum in the Changbai Mountain region has evolved toward simplification. These morphological changes may be associated with the differential expression of specific genes, such as FATB and cbbS. Our findings suggest that V. uliginosum may exhibit a distinct hormonal regulatory mechanism. For instance, the biological activity of gibberellins appears to be enhanced, whereas the effects of auxin, ABA, BRs, and ethylene are potentially suppressed. Under the coordinated regulation of multiple plant hormones, V. uliginosum may adapt to environmental changes by reducing photosynthetic activity, decreasing carbohydrate production, lowering energy consumption, and promoting lipid synthesis and storage. Furthermore, this metabolic shift influences the plant’s morphological characteristics. However, as RNA-Seq analysis primarily reflects variations in transcriptional products, biological processes and metabolites are inferred based on the functional annotations of associated genes. Consequently, this approach has inherent methodological limitations. Future studies could validate and expand upon these findings through the quantitative analysis of key metabolites and hormone levels. The findings of this study elucidated potential molecular mechanisms underlying the morphological variations observed in V. uliginosum at the transcriptomic level, thereby contributing valuable insights into plant adaptation to environmental conditions.

Supplementary Materials

The following supporting information can be downloaded at: https://www.mdpi.com/article/10.3390/f16101571/s1. Figure S1: PCA analysis of sample gene expression; Figure S2: Summary of functional annotation of unigene; Figure S3: Overview of expression difference statistics; Table S1: The primers of RT-qPCR; Table S2: Different expressed genes in V. uliginosum leaves at different elevations; Table S3: Differentially expressed genes closely associated with morphological changes; Table S4: Differentially expressed genes significantly associated with morphological changes.

Author Contributions

Writing, original draft preparation, and experimental analysis, Y.W.; experimental analysis, J.L., L.Z., and K.M.; project administration, R.W.; funding acquisition, Q.Z. All authors have read and agreed to the published version of the manuscript.

Funding

This research was funded by the National Natural Science Foundation of China (grant No.32171770).

Data Availability Statement

All RNA-Seq data used in our manuscript were submitted to the Genome Sequence Archive [71] in the National Genomics Data Center [72] (GSA submit number: subCRA035195) and are publicly accessible at https://ngdc.cncb.ac.cn/gsa (accessed on 31 December 2024).

Acknowledgments

We are grateful to Yutao Li at Baihe Forestry Co., Ltd., of the Jilin Changbaishan forest industry group for helping us collect samples and to the Changbaishan Nature Reserve Management Committee for approving the sampling.

Conflicts of Interest

The authors declare no conflicts of interest.

Abbreviations

The following abbreviations are used in this manuscript:
RNA-SeqTranscriptome sequencing technology
DEGsDifferentially expressed genes
GOGene Ontology
KEGGKyoto Encyclopedia of Genes and Genomes
log2FCLog2-fold change
FATBFatty acyl-ACP thioesterase B
cbbSRibulose-bisphosphate carboxylase small subunit
FPKMFragments per kilobase of transcript per million mapped reads
RDARedundancy analysis
LAGLow-elevation samples
HAGHigh-elevation samples
HEXA_BHexosaminidase gene
ANRAnthocyanidin reductase gene
PPP2CSerine/threonine-protein phosphatase 2A catalytic subunit
SDHASuccinate dehydrogenase (ubiquinone) flavoprotein subunit gene
UGP2UTP-glucose-1-phosphate uridylyltransferase gene
AMYAlpha-amylase gene
GAPDHGlyceraldehyde 3-phosphate dehydrogenase gene
gpmB2,3-Bisphosphoglycerate-dependent phosphoglycerate mutase gene
FHFumarate hydratase gene
ENOEnolase 1/2/3 gene
PKPyruvate kinase gene
ACOAconitate hydratase gene
LSCSuccinyl-CoA synthetase alpha subunit gene
ACSLLong-chain acyl-CoA synthetase gene
fabF3-Oxoacyl-[acyl-carrier-protein] gene
ACACAAcetyl-CoA carboxylase/biotin carboxylase 1 gene
AUX/IAAAuxin/Indole-3-Acetic Acid gene
GLSGlucosinolate
GAGibberellin
ABAAbscisic acid
BAK1Brassinosteroid-insensitive 1 (BRI1)-Associated Kinase 1
BRsBrassinosteroids
XTHXyloglucan endotransglucosylase/hydrolase

References

  1. Yang, X.; Xu, M. Biodiversity conservation in Changbai Mountain Biosphere Reserve, northeastern China: Status, problem, and strategy. Biodivers. Conserv. 2003, 12, 883–903. [Google Scholar] [CrossRef]
  2. He, H.S.; Hao, Z.; Mladenoff, D.J.; Shao, G.; Hu, Y.; Chang, Y. Simulating forest ecosystem response to climate warming incorporating spatial effects in north-eastern China. J. Biogeogr. 2005, 32, 2043–2056. [Google Scholar] [CrossRef]
  3. Abbott, R.J.; Brennan, A.C. Altitudinal gradients, plant hybrid zones and evolutionary novelty. Philos. Trans. R. Soc. B Biol. Sci. 2014, 369, 20130346. [Google Scholar] [CrossRef]
  4. Wei, J.; Wu, G.; Deng, H. Vegetation biomass distribution characteristics of alpine tundra ecosystem in Changbai Mountains. Ying Yong Sheng Tai Xue Bao 2004, 15, 1999–2004. [Google Scholar]
  5. Wang, L.; Wang, W.J.; Wu, Z.; Du, H.; Zong, S.; Ma, S. Potential distribution shifts of plant species under climate change in Changbai Mountains, China. Forests 2019, 10, 498. [Google Scholar] [CrossRef]
  6. Fan, C.; Guo, Z.; Zheng, J. Study on Morphological Traits of Natural Populations of Vaccinium uliginosum at Different Altitudinal Gradients on Changbai Mountain. Horticulturae 2024, 10, 224. [Google Scholar] [CrossRef]
  7. Zheng, D.; Liu, Q. Effects of environmental factors on forest community distribution in Changbai Mountain Nature Reserve of northeastern China. J. Beijing For. Univ. 2023, 45, 57–64. [Google Scholar] [CrossRef]
  8. Wheeler, J.A.; Hoch, G.; Cortes, A.J.; Sedlacek, J.; Wipf, S.; Rixen, C. Increased spring freezing vulnerability for alpine shrubs under early snowmelt. Oecologia 2014, 175, 219–229. [Google Scholar] [CrossRef]
  9. Rathore, N.; Kumar, P.; Mehta, N.; Swarnkar, M.K.; Shankar, R.; Chawla, A. Time-series RNA-Seq transcriptome profiling reveals novel insights about cold acclimation and de-acclimation processes in an evergreen shrub of high altitude. Sci. Rep. 2022, 12, 15553. [Google Scholar] [CrossRef]
  10. Nong, M.L.; Luo, X.H.; Zhu, L.X.; Zhang, Y.N.; Dun, X.Y.; Huang, L. Insights into the Adaptation to High Altitudes from Transcriptome Profiling: A Case Study of an Endangered Species, Kingdonia uniflora. Genes 2023, 14, 1291. [Google Scholar] [CrossRef]
  11. Jinqiu, Y.; Bing, L.; Tingting, S.; Jinglei, H.; Zelai, K.; Lu, L.; Wenhua, H.; Tao, H.; Xinyu, H.; Zengqing, L.; et al. Integrated Physiological and Transcriptomic Analyses Responses to Altitude Stress in Oat (Avena sativa L.). Front. Genet. 2021, 12, 638683. [Google Scholar] [CrossRef] [PubMed]
  12. Zhang, K.L.; Leng, Y.N.; Hao, R.R.; Zhang, W.Y.; Li, H.F.; Chen, M.X.; Zhu, F.Y. Adaptation of High-Altitude Plants to Harsh Environments: Application of Phenotypic-Variation-Related Methods and Multi-Omics Techniques. Int. J. Mol. Sci. 2024, 25, 12666. [Google Scholar] [CrossRef]
  13. Zhang, H.; Wang, Y.; Yang, J.; He, H.; Huangfu, S.; Wang, J.; Li, H.; Zhang, B.; Wang, X.; Zhang, X.; et al. Reprogramming of Metabolome and Transcriptome Shaped the Elevational Adaptation of Quercus variabilis by Regulating Leaf Functional Traits. Plant Cell Environ. 2025, 48, 6189–6208. [Google Scholar] [CrossRef]
  14. Albert, K.R.; Mikkelsen, T.N.; Ro-Poulsen, H. Ambient UV-B radiation decreases photosynthesis in high arctic Vaccinium uliginosum. Physiol. Plant 2008, 133, 199–210. [Google Scholar] [CrossRef]
  15. Boesgaard, K.S.; Albert, K.R.; Ro-Poulsen, H.; Michelsen, A.; Mikkelsen, T.N.; Schmidt, N.M. Long-term structural canopy changes sustain net photosynthesis per ground area in high arctic Vaccinium uliginosum exposed to changes in near-ambient UV-B levels. Physiol. Plant 2012, 145, 540–550. [Google Scholar] [CrossRef] [PubMed]
  16. Dai, Z.; Li, H.; Meng, J.; Zhnag, Y.; Zhang, B. Study on cloning of VuLhca4 gene from Vaccinium uliginosum L. and functional analysis under abiotic stress. J. Northeast Agric. Univ. 2023, 54, 34–44. [Google Scholar] [CrossRef]
  17. Zhang, R.; Wu, F. Cloning and functional analysis of bog bilberry E3 ligase VuARI2 gene in cold resistance. Acta Bot. Boreali-Occident. Sin. 2024, 44, 1420–1432. [Google Scholar] [CrossRef]
  18. Grabherr, M.G.; Haas, B.J.; Yassour, M.; Levin, J.Z.; Thompson, D.A.; Amit, I.; Adiconis, X.; Fan, L.; Raychowdhury, R.; Zeng, Q. Full-length transcriptome assembly from RNA-Seq data without a reference genome. Nat. Biotechnol. 2011, 29, 644–652. [Google Scholar] [CrossRef]
  19. Smith-Unna, R.; Boursnell, C.; Patro, R.; Hibberd, J.M.; Kelly, S. TransRate: Reference-free quality assessment of de novo transcriptome assemblies. Genome Res. 2016, 26, 1134–1144. [Google Scholar] [CrossRef]
  20. Li, W.; Godzik, A. Cd-hit: A fast program for clustering and comparing large sets of protein or nucleotide sequences. Bioinformatics 2006, 22, 1658–1659. [Google Scholar] [CrossRef] [PubMed]
  21. Simão, F.A.; Waterhouse, R.M.; Ioannidis, P.; Kriventseva, E.V.; Zdobnov, E.M. BUSCO: Assessing genome assembly and annotation completeness with single-copy orthologs. Bioinformatics 2015, 31, 3210–3212. [Google Scholar] [CrossRef]
  22. Li, B.; Dewey, C.N. RSEM: Accurate transcript quantification from RNA-Seq data with or without a reference genome. BMC Bioinform. 2011, 12, 323. [Google Scholar] [CrossRef]
  23. Love, M.I.; Huber, W.; Anders, S. Moderated estimation of fold change and dispersion for RNA-seq data with DESeq2. Genome Biol. 2014, 15, 550. [Google Scholar] [CrossRef] [PubMed]
  24. Klopfenstein, D.; Zhang, L.; Pedersen, B.S.; Ramírez, F.; Warwick Vesztrocy, A.; Naldi, A.; Mungall, C.J.; Yunes, J.M.; Botvinnik, O.; Weigel, M. GOATOOLS: A Python library for Gene Ontology analyses. Sci. Rep. 2018, 8, 10872. [Google Scholar] [CrossRef] [PubMed]
  25. Petrucelli, M.F.; Martins-Santana, L.; Sanches, P.R.; Oliveira, V.M.; Rossi, A.; Martinez-Rossi, N.M. The Transcription Factor StuA Regulates the Glyoxylate Cycle in the Dermatophyte Trichophyton rubrum under Carbon Starvation. Int. J. Mol. Sci. 2023, 25, 405. [Google Scholar] [CrossRef]
  26. Deng, Y.; Li, Y.; Sun, H. Selection of reference genes for RT-qPCR normalization in blueberry (Vaccinium corymbosum × angustifolium) under various abiotic stresses. FEBS Open Bio 2020, 10, 1418–1435. [Google Scholar] [CrossRef]
  27. Livak, K.J.; Schmittgen, T.D. Analysis of relative gene expression data using real-time quantitative PCR and the 2−ΔΔCT method. Methods 2001, 25, 402–408. [Google Scholar] [CrossRef] [PubMed]
  28. Li, Q.Q.; Skinner, J.; Bennett, J.E. Evaluation of reference genes for real-time quantitative PCR studies in Candida glabrata following azole treatment. BMC Mol. Biol. 2012, 13, 22. [Google Scholar] [CrossRef]
  29. Darzi, Y.; Letunic, I.; Bork, P.; Yamada, T. iPath3.0: Interactive pathways explorer v3. Nucleic Acids Res. 2018, 46, W510–W513. [Google Scholar] [CrossRef]
  30. Wang, Y.; Liu, X.; Chen, J.-Z.; Tian, X.; Zheng, Y.-H.; Hao, J.; Xue, Y.-J.; Ding, S.-Y.; Zong, C.-W. The variation of total flavonoids, anthocyanins and total phenols in Vaccinium uliginosum fruits in Changbai Mountain of China is closely related to spatial distribution. J. Berry Res. 2022, 12, 463–481. [Google Scholar] [CrossRef]
  31. Yang, H.; Chen, J.; Wang, Y.; Tian, X.; Zheng, Y.; Jin, Z.; Hao, J.; Xue, Y.; Ding, S.; Zong, C. Determination of the genetic diversity and population structure of Vaccinium uliginosum in Northeast China based on the chloroplast mat K gene and EST-SSRseq molecular markers. Genet. Resour. Crop Evol. 2024, 71, 1035–1052. [Google Scholar] [CrossRef]
  32. Gong, J.; Zhang, Z.; Zhang, C.; Zhang, J.; Ran, A. Ecophysiological responses of three tree species to a high-altitude environment in the southeastern tibetan plateau. Forests 2018, 9, 48. [Google Scholar] [CrossRef]
  33. Halbritter, A.H.; Fior, S.; Keller, I.; Billeter, R.; Edwards, P.J.; Holderegger, R.; Karrenberg, S.; Pluess, A.R.; Widmer, A.; Alexander, J.M. Trait differentiation and adaptation of plants along elevation gradients. J. Evol. Biol. 2018, 31, 784–800. [Google Scholar] [CrossRef]
  34. Zhang, X.; Kuang, T.; Dong, W.; Qian, Z.; Zhang, H.; Landis, J.B.; Feng, T.; Li, L.; Sun, Y.; Huang, J. Genomic convergence underlying high-altitude adaptation in alpine plants. J. Integr. Plant Biol. 2023, 65, 1620–1635. [Google Scholar] [CrossRef]
  35. Rosli, K.A.; Misran, A.; Yazan, L.S.; Wahab, P.E.M. Light-nutrient interaction orchestrates leaf dynamics, nitrogen assimilation, and cellular energetics in Agastache rugosa (Fisch. & CA Mey.) Kuntze. Environ. Exp. Bot. 2024, 229, 106044. [Google Scholar] [CrossRef]
  36. Kortstee, A.; Appeldoorn, N.; Oortwijn, M.; Visser, R. Differences in regulation of carbohydrate metabolism during early fruit development between domesticated tomato and two wild relatives. Planta 2007, 226, 929–939. [Google Scholar] [CrossRef]
  37. Zheng, Y.; Sun, J.; Luo, Z.; Li, Y.; Huang, Y. Emerging mechanisms of lipid peroxidation in regulated cell death and its physiological implications. Cell Death Dis. 2024, 15, 859. [Google Scholar] [CrossRef] [PubMed]
  38. Karamat, U.; Sun, X.; Li, N.; Zhao, J. Genetic regulators of leaf size in Brassica crops. Hortic. Res. 2021, 8, 91. [Google Scholar] [CrossRef]
  39. Xuan, T.D.; Minh, T.N.; Anh, L.H.; Khanh, T.D. Allelopathic momilactones A and B are implied in rice drought and salinity tolerance, not weed resistance. Agron. Sustain. Dev. 2016, 36, 52. [Google Scholar] [CrossRef]
  40. Anh, L.H.; Khanh, T.D.; Xuan, T.D. Biological roles of momilactones: Achievements, challenges, and promising approaches to exploit their beneficial properties. Front. Nat. Prod. 2023, 2, 1245869. [Google Scholar] [CrossRef]
  41. Henschel, J.M.; Andrade, A.N.d.; dos Santos, J.B.L.; da Silva, R.R.; da Mata, D.A.; Souza, T.; Batista, D.S. Lipidomics in Plants Under Abiotic Stress Conditions: An Overview. Agronomy 2024, 14, 1670. [Google Scholar] [CrossRef]
  42. Okazaki, Y.; Saito, K. Roles of lipids as signaling molecules and mitigators during stress response in plants. Plant J. 2014, 79, 584–596. [Google Scholar] [CrossRef]
  43. Liu, W.; Zheng, L.; Qi, D. Variation in leaf traits at different altitudes reflects the adaptive strategy of plants to environmental changes. Ecol. Evol. 2020, 10, 8166–8175. [Google Scholar] [CrossRef]
  44. Hu, J.; Li, S.; Zhang, Y.; Du, D.; Zhu, X. Potential Regulatory Effects of Arbuscular Mycorrhizal Fungi on Lipid Metabolism of Maize in Response to Low-Temperature Stress. J. Agric. Food Chem. 2024, 72, 22574–22587. [Google Scholar] [CrossRef] [PubMed]
  45. Lu, J.; Xu, Y.; Wang, J.; Singer, S.D.; Chen, G. The role of triacylglycerol in plant stress response. Plants 2020, 9, 472. [Google Scholar] [CrossRef]
  46. Mashek, D.G.; Li, L.O.; Coleman, R.A. Long-chain acyl-CoA synthetases and fatty acid channeling. Future Lipidol. 2007, 2, 465. [Google Scholar] [CrossRef]
  47. Martínez-Vilalta, J.; Sala, A.; Asensio, D.; Galiano, L.; Hoch, G.; Palacio, S.; Piper, F.I.; Lloret, F. Dynamics of non-structural carbohydrates in terrestrial plants: A global synthesis. Ecol. Monogr. 2016, 86, 495–516. [Google Scholar] [CrossRef]
  48. Liu, J.-F.; Deng, Y.-P.; Wang, X.-F.; Ni, Y.-Y.; Wang, Q.; Xiao, W.-F.; Lei, J.-P.; Jiang, Z.-P.; Li, M.-H. The concentration of non-structural carbohydrates, N, and P in Quercus variabilis does not decline toward its northernmost distribution range along a 1500 km transect in China. Front. Plant Sci. 2018, 9, 1444. [Google Scholar] [CrossRef] [PubMed]
  49. Atkin, O.; Millar, A.; Gardeström, P.; Day, D. Photosynthesis, carbohydrate metabolism and respiration in leaves of higher plants. Photosynth. Physiol. Metab. 2000, 9, 153–175. [Google Scholar] [CrossRef]
  50. Ma, W.; Wei, X.; Su, M.; Luo, Q.; Zhao, Y. Responses of non-structural carbohydrate metabolism of Medicago sativa seedlings to nitric oxide under drought stress. Acta Ecol. Sin. 2019, 39, 8068–8077. [Google Scholar] [CrossRef]
  51. Kumar, A.; Singh, H.P.; Batish, D.R.; Kaur, S.; Kohli, R.K. EMF radiations (1800 MHz)-inhibited early seedling growth of maize (Zea mays) involves alterations in starch and sucrose metabolism. Protoplasma 2016, 253, 1043–1049. [Google Scholar] [CrossRef] [PubMed]
  52. Zhai, B.; Hu, Z.; Sun, S.; Tang, Z.; Wang, G. Characteristics of photosynthetic rates in different vegetation types at high-altitude in mountainous regions. Sci. Total Environ. 2024, 907, 168071. [Google Scholar] [CrossRef] [PubMed]
  53. Liu, T.; JI, Y.; Liu, Y.; Wu, X.; Chen, F.; Liu, X. Study on the adaptive mechanisms of five plants to high-altitude light based on transcriptome sequencing in Maidica wetland of Tibet. Plant Sci. J. 2021, 39, 632–642. [Google Scholar] [CrossRef]
  54. Didaran, F.; Kordrostami, M.; Ghasemi-Soloklui, A.A.; Pashkovskiy, P.; Kreslavski, V.; Kuznetsov, V.; Allakhverdiev, S.I. The mechanisms of photoinhibition and repair in plants under high light conditions and interplay with abiotic stressors. J. Photochem. Photobiol. B Biol. 2024, 259, 113004. [Google Scholar] [CrossRef]
  55. Verma, V.; Ravindran, P.; Kumar, P.P. Plant hormone-mediated regulation of stress responses. BMC Plant Biol. 2016, 16, 86. [Google Scholar] [CrossRef] [PubMed]
  56. Divi, U.K.; Rahman, T.; Krishna, P. Brassinosteroid-mediated stress tolerance in Arabidopsis shows interactions with abscisic acid, ethylene and salicylic acid pathways. BMC Plant Biol. 2010, 10, 151. [Google Scholar] [CrossRef]
  57. Ghorbel, M.; Brini, F. Hormone mediated cell signaling in plants under changing environmental stress. Plant Gene 2021, 28, 100335. [Google Scholar] [CrossRef]
  58. Yu, Z.; Duan, X.; Luo, L.; Dai, S.; Ding, Z.; Xia, G. How plant hormones mediate salt stress responses. Trends Plant Sci. 2020, 25, 1117–1130. [Google Scholar] [CrossRef]
  59. Kazan, K. Diverse roles of jasmonates and ethylene in abiotic stress tolerance. Trends Plant Sci. 2015, 20, 219–229. [Google Scholar] [CrossRef]
  60. Krishna, P. Brassinosteroid-mediated stress responses. J. Plant Growth Regul. 2003, 22, 289–297. [Google Scholar] [CrossRef]
  61. Popko, J.; Hänsch, R.; Mendel, R.R.; Polle, A.; Teichmann, T. The role of abscisic acid and auxin in the response of poplar to abiotic stress. Plant Biol. 2010, 12, 242–258. [Google Scholar] [CrossRef] [PubMed]
  62. Tiwari, S.B.; Hagen, G.; Guilfoyle, T. The roles of auxin response factor domains in auxin-responsive transcription. Plant Cell 2003, 15, 533–543. [Google Scholar] [CrossRef] [PubMed]
  63. Wang, S.; Tiwari, S.B.; Hagen, G.; Guilfoyle, T.J. AUXIN RESPONSE FACTOR7 restores the expression of auxin-responsive genes in mutant Arabidopsis leaf mesophyll protoplasts. Plant Cell 2005, 17, 1979–1993. [Google Scholar] [CrossRef]
  64. Weijers, D.; Wagner, D. Transcriptional responses to the auxin hormone. Annu. Rev. Plant Biol. 2016, 67, 539–574. [Google Scholar] [CrossRef]
  65. Sun, T.-p.; Gubler, F. Molecular mechanism of gibberellin signaling in plants. Annu. Rev. Plant Biol. 2004, 55, 197–223. [Google Scholar] [CrossRef]
  66. Du, R.; Niu, S.; Liu, Y.; Sun, X.; Porth, I.; El-Kassaby, Y.A.; Li, W. The gibberellin GID1-DELLA signalling module exists in evolutionarily ancient conifers. Sci. Rep. 2017, 7, 16637. [Google Scholar] [CrossRef] [PubMed]
  67. Wang, G.; Qi, K.; Gao, X.; Guo, L.; Cao, P.; Li, Q.; Qiao, X.; Gu, C.; Zhang, S. Genome-wide identification and comparative analysis of the PYL gene family in eight Rosaceae species and expression analysis of seeds germination in pear. BMC Genom. 2022, 23, 233. [Google Scholar] [CrossRef]
  68. Zhu, Z.; An, F.; Feng, Y.; Li, P.; Xue, L.; Jiang, Z.; Kim, J.-M.; To, T.K.; Li, W.; Zhang, X. Derepression of ethylene-stabilized transcription factors (EIN3/EIL1) mediates jasmonate and ethylene signaling synergy in Arabidopsis. Proc. Natl. Acad. Sci. USA 2011, 108, 12539–12544. [Google Scholar] [CrossRef]
  69. Li, J.; Wen, J.; Lease, K.A.; Doke, J.T.; Tax, F.E.; Walker, J.C. BAK1, an Arabidopsis LRR receptor-like protein kinase, interacts with BRI1 and modulates brassinosteroid signaling. Cell 2002, 110, 213–222. [Google Scholar] [CrossRef]
  70. Zhang, C.; He, M.; Jiang, Z.; Liu, L.; Pu, J.; Zhang, W.; Wang, S.; Xu, F. The xyloglucan endotransglucosylase/hydrolase gene XTH22/TCH4 regulates plant growth by disrupting the cell wall homeostasis in Arabidopsis under boron deficiency. Int. J. Mol. Sci. 2022, 23, 1250. [Google Scholar] [CrossRef]
  71. Chen, T.; Chen, X.; Zhang, S.; Zhu, J.; Tang, B.; Wang, A.; Dong, L.; Zhang, Z.; Yu, C.; Sun, Y.; et al. The Genome Sequence Archive Family: Toward Explosive Data Growth and Diverse Data Types. Genom. Proteom. Bioinform. 2021, 19, 578–583. [Google Scholar] [CrossRef] [PubMed]
  72. Nucleic Acids Research. Database Resources of the National Genomics Data Center, China National Center for Bioinformation in 2024. Nucleic Acids Res. 2024, 52, D18–D32. [Google Scholar] [CrossRef] [PubMed]
Figure 1. Morphological parameters of V. uliginosum at different elevations. Different lowercase letters (a, b, c, d, e) above bars indicate significant differences (p < 0.05) among elevations. (A) Weight per fruit: the average mass of individual berries, reflecting fruit size and developmental status. (B) Leaf area: the measured surface area of leaves, which is indicative of photosynthetic capacity. (C) Plant height: the vertical extent from the base to the tallest point of the plant, representing overall plant growth.
Forests 16 01571 g001
Figure 2. Density plot of global gene expression in V. uliginosum leaves at different elevations.
Forests 16 01571 g002
Figure 3. Venn diagram of differentially expressed genes (DEGs) in V. uliginosum leaves at different elevations.
Forests 16 01571 g003
Figure 4. Heatmap of DEG cluster analysis. Each row represents a gene, and each column represents a sample from different elevations. Red indicates high expression, and blue indicates low expression. The colored bands in the left margin represent distinct gene clusters identified by hierarchical clustering, with each color corresponding to one cluster.
Forests 16 01571 g004
Figure 5. Functional classification of DEGs associated with morphological traits in V. uliginosum leaves at different elevations.
Forests 16 01571 g005
Figure 6. Bubble diagrams of the top 20 Gene Ontology (GO) terms (a) and Kyoto Encyclopedia of Genes and Genomes (KEGG) pathways (b). The color and size of each bubble represent the enrichment significance and the number of genes enriched in the pathway, respectively.
Forests 16 01571 g006
Figure 7. Redundancy analysis (RDA) illustrating the correlation between morphological traits and their associated genes.
Forests 16 01571 g007
Figure 8. Overview of the metabolic pathways of DEGs in V. uliginosum leaves at different elevations. Key enriched pathways are highlighted with red lines and include lipid metabolism, energy metabolism, carbohydrate metabolism, and amino acid metabolism.
Forests 16 01571 g008
Figure 9. DEGs involved in photosynthesis in V. uliginosum leaves at different elevations. (a) The pathway adapted from KEGG, where green boxes indicate the background genes of the V. uliginosum plant transcriptome, and red lines indicate the annotated DEGs. (b) The heatmap was generated from the mean log2-fold change (log2FC) values calculated from three replicates of the RNA-Seq data.
Forests 16 01571 g009
Figure 10. DEGs involved in carbohydrate metabolism at different elevations in V. uliginosum leaves. (a) The red line indicates annotated DEGs. (b) The heatmap was generated from the mean log2-fold change (log2FC) values calculated from three replicates of the RNA-Seq data.
Forests 16 01571 g010
Figure 11. DEGs involved in fatty acid biosynthesis at different elevations in the pathway adapted from KEGG. (a) The green boxes represent the set of background genes of V. uliginosum plant transcriptome, and the red lines show the annotated DEGs. (b) The heatmap was constructed based on the mean log2-fold change (log2FC) values derived from three biological replicates of RNA-Seq data.
Forests 16 01571 g011
Figure 12. DEGs involved in plant hormone signal transduction at different elevations in V. uliginosum in the pathway adapted from KEGG. (a) The green boxes represent the set of the background genes of the V. uliginosum plant transcriptome, and the red lines show the annotated DEGs. (b) The heatmap was constructed based on the mean log2-fold change (log2FC) values derived from three biological replicates of RNA-Seq data.
Forests 16 01571 g012
Figure 13. Validation analysis of the expression profiles for 10 selected DEGs at different elevations, with a heatmap displaying the relative expression levels from both qRT-PCR (a) and RNA-Seq (b) data.
Forests 16 01571 g013
Table 1. Basic details of sample plots on the northern slope of the Changbai Mountains.
LocalityElevation (m)LongitudeLatitude
Xinglong Forest Farm, Block 24, Subplot 13706128°18′39.19″42°25′5.35″
Xinglong Forest Farm, Block 91, Subplot 9939128°21′8.06″42°18′0.56″
Dongfanghong Forest Farm, Block 80, Subplot 111226128°23′12.11″42°6′59.27″
Dongfanghong Forest Farm, Block 112, Subplot 151384128°17′34.67″42°3′24.39″
Changbai Mountain Nature Reserve1985128°4′3.69″42°3′27.06″
Changbai Mountain Nature Reserve2190128°3′59.72″42°2′44.66″
Changbai Mountain Nature Reserve2366128°4′3.05″42°2′14.72″
Disclaimer/Publisher’s Note: The statements, opinions and data contained in all publications are solely those of the individual author(s) and contributor(s) and not of MDPI and/or the editor(s). MDPI and/or the editor(s) disclaim responsibility for any injury to people or property resulting from any ideas, methods, instructions or products referred to in the content.