Abstract
In the context of sustainable forest resource development, balancing ecological conservation with rational utilization is essential to achieving forest multifunctionality. Longyuwan National Forest Park, located in Luanchuan County, Henan Province, serves as a transitional zone between rural mountainous ecosystems and nearby urban settlements. Increasingly, this area faces urbanization pressures such as tourism expansion, infrastructure development, and intensified land use, which may threaten ecological stability. This study aims to evaluate the ecological sensitivity of the park and optimize its spatial functional zoning. Using the Analytic Hierarchy Process (AHP), we followed four key steps: constructing the hierarchical model, generating the pairwise judgment matrices, computing the weights and conducting the consistency check, and determining the final weights. A hierarchical evaluation framework was constructed using the AHP, incorporating twelve ecological indicators across geomorphological, hydrological, atmospheric, biological, and anthropogenic dimensions. Spatial analysis tools in ArcGIS 10.2, including reclassification and weighted overlay, were employed for single-factor and integrated sensitivity assessments. The results indicated that land-use type, elevation, and water-body distribution were the most influential indicators. Ecological sensitivity across the park was categorized into five levels: extremely high (0.02%), high (11.99%), moderate (73.53%), low (14.19%), and extremely low (0.28%). Based on these findings, four functional zones were delineated: ecological conservation (50.99%), core landscape (22.86%), general recreation (23.94%), and management and service (2.21%). This research provides spatially explicit insights into forest management under anthropogenic stress, offering theoretical support for the sustainable governance of forest–urban interface landscapes.
1. Introduction
As an essential component of emerging forestry industries, forest parks serve as important platforms for promoting the transformation and upgrading of the forestry sector [1]. Leveraging abundant forest resources, forest parks play an irreplaceable role in maintaining ecological balance and advancing sustainable development. Their rich natural resources, distinctive landscapes, diverse forest types, and lush vegetation contribute significantly to ecological culture dissemination and the enhancement of public environmental awareness [2]. However, the rapid development of forest parks has also brought multiple challenges. These challenges extend beyond environmental protection and ecosystem restoration to include tourism development, industrial innovation, governance mechanisms, and regulatory systems. According to the Blue Book of Ecological Forestry: Report on Ecological Civilization and Forestry Development with Chinese Characteristics (2020–2021), China’s forestry development currently faces critical issues such as the imbalance between forest resource harvesting and cultivation, delays in the application of forestry technologies, talent shortages, and insufficient industrial strength, which collectively constrain the sustainability of the forestry sector [3]. The concept of ecological sensitivity originates from the “eco-tone” idea introduced in 1989 [4]. Initially used to describe the complexity of biological communities, it has since evolved to encompass applications in ecology, environmental science, and geography, primarily for assessing ecosystem integrity and environmental vulnerability. Ecological sensitivity is generally defined as the degree to which ecosystems respond to natural factors and anthropogenic disturbances, reflecting the probability and severity of ecological degradation or environmental problems under external stressors. While China faces challenges in balancing ecological conservation with forestry development, similar limitations in implementing sustainable forest management are observed in EU countries, where economic priorities and technological gaps often hinder the adoption of holistic practices [5].
International research on ecological sensitivity can be traced back to the 1970s. In Design with Nature (1971), Ian McHarg articulated the interdependence between humans and nature and the vulnerability of natural ecosystems under human disturbance, advocating the establishment of integrated ecological monitoring systems and framing urban planning and nature conservation from the standpoint of ecological sustainability [6]. In the early phase of this research, most studies abroad approached ecological sensitivity from the perspective of large-scale ecosystems but tended to focus on single environmental issues (e.g., flora and fauna, soils, crops). For example, Shermon A analyzed the magnitude of impacts from human activities and timber harvesting in Australia [7]; Ignacio et al. assessed ecological sensitivity along the U.S. Atlantic coast from an atmospheric perspective [8]; and Roman Biek et al., from a biodiversity viewpoint, examined how changes in amphibian abundances affected ecological sensitivity [9]. In 2010, Nouri J. and colleagues evaluated integrated ecological sensitivity in the northern Persian Gulf using ArcGIS, and in the same year applied this approach to Bushehr Province in the same region [10]. Pierfrancesca Rossi et al. combined the ideal-vector (ideal-point) method with human activity factors to analyze ecological value and ecological sensitivity in Italy’s Apennines [11]. As the field has evolved, most studies have selected specific driving factors to quantify their effects on ecological environments, and—alongside advances in technology—an increasing number of evaluations have employed 3S technologies (RS, GIS, and GPS). In recent years, international research on ecological sensitivity has advanced through model construction, the application of 3S (RS, GIS, GPS) technologies, and the development of ecological evaluation systems. The research scope has expanded to include dimensions such as tourism development, social activity, and industrial expansion, aiming to explore the coupling mechanisms between human activity and ecosystems. For instance, Hale Brack W utilized geo-tagged photo data to assess the ecological sensitivity of Iceland’s environment in relation to tourism development, revealing the impacts of tourism intensity on ecosystem stability [12]. Raj Alok et al. constructed an E-PSR model using geostatistical methods and evaluated the ecological sensitivity of the Aravalli hills using 17 environmental indicators across five thematic categories, offering corresponding management recommendations [13]. From the perspective of landscape ecology, Sobhani Parvaneh developed a sensitivity model to evaluate the sustainability of tourism development, providing a scientific basis for eco-friendly tourism practices [14]. Bibliometric and visualization analyses indicate that ecological sensitivity has become a research hotspot in environmental sciences, widely applied in fields such as environmental resource management, biodiversity conservation, agroecology, urban–rural planning, and construction engineering. It is increasingly integrated with topics such as tourism development, macroeconomics, and sustainability, demonstrating strong practical relevance.
In China, ecological sensitivity research began relatively early, initially focusing on ecological conservation and functional zoning. Since the late 1990s, research has deepened gradually. In 1996, Liu Yanhua highlighted the spatial characteristics of ecologically fragile zones in China and categorized them into seven types [15]. In 2000, Ouyang Zhiyun first introduced the concept of “ecological sensitivity” into Chinese academia and analyzed its influencing factors [16]. Zhang Jun employed ILWIS software to conduct an ecological sensitivity evaluation in the Hankou area of Wuhan and carried out regional zoning based on sensitivity classifications [17]. Song Xiaolong, taking the Yellow River Delta Nature Reserve as a case, proposed the concept of “comprehensive habitat suitability” and constructed a habitat status model based on GIS. By incorporating human disturbance factors, a wetland habitat sensitivity assessment was conducted [18].
With the continuous refinement of theoretical frameworks and methodological tools, domestic studies have increasingly focused on spatiotemporal patterns and their driving mechanisms. Consequently, research priorities have shifted toward ecological restoration and systematic conservation. For example, Zhang Bei, using the Xue Feng Mountain National Forest Park as a study area, constructed a four-tier evaluation system from the perspective of ecological protection and rational utilization and proposed corresponding conservation strategies [19]. Wang Jiayan developed a minimum-resistance model to identify ecologically sensitive areas and delineated 18 ecological corridors and 13 ecological nodes, offering theoretical support for constructing regional ecological security networks [20].
In recent years, the accelerating process of urbanization has expanded ecological pressures into adjacent natural and semi-natural landscapes, particularly within the transitional zones between cities and mountainous forested areas. These ecotones often host high ecological sensitivity due to their complex land-use mosaics and fragmented habitats [21]. Through the interpretation and analysis of remote sensing imagery in the study area, an assessment utilizing landscape pattern indices revealed that the patch density in the eastern and southwestern marginal zones of the park is significantly higher than that in the core area. This indicates a greater degree of habitat fragmentation in these regions, further corroborating their sensitivity characteristics as ecological transition zones. National forest parks located near urban boundaries, such as Longyuwan, are increasingly recognized as buffers that provide crucial ecological functions including air purification, water regulation, and biodiversity conservation. However, such areas are also vulnerable to land-use change, infrastructure encroachment, and tourism overload. Evaluating their ecological sensitivity using remote sensing and spatial modeling thus becomes essential for proactive forest planning and sustainable urban–rural ecological governance. Ecological sensitivity assessments in mountain forest parks must integrate recreational carrying capacity, which reflects habitat resilience to tourism pressure while accounting for critical factors like slope gradient. This metric serves as a vital management tool to balance conservation and public access in protected areas [22].
By reviewing the research progress on ecological sensitivity at home and abroad, it can be found that the existing studies mostly focus on the ecological sensitivity evaluation at the scale of cities, nature reserves or river basins [23]. The research methods mainly include the index system method and GIS spatial analysis, and a relatively mature evaluation framework has been formed [24]. However, there are still the following research gaps and deficiencies: Limited research areas: Most studies focus on cities or large nature reserves, and there is a lack of research on the ecological sensitivity of forest parks, especially small and medium-sized national forest parks with high forest coverage and high ecological value. The evaluation factors are single: Existing research mostly focuses on natural factors (such as topography, vegetation, and hydrology), and the comprehensive integrated analysis of factors such as atmospheric quality (such as negative oxygen ions and PM2.5) and human activity buffer zones (such as roads and tourism facilities) is insufficient. Insufficient dynamics and practicality: Most studies remain at the static evaluation level, lacking close integration with specific protection and utilization countermeasures, and have limited practical guidance. Methodological convergence: Although the combination of the Analytic Hierarchy Process (AHP) and GIS is mature, the determination of weights is highly subjective, and there is a lack of multi-source data verification and model optimization. This study takes Longyuwan National Forest Park in Henan Province as the research object and innovatively constructs an ecological sensitivity evaluation system that includes five major system layers: topography and geomorphology, hydrology, atmosphere, flora and fauna, and human activities, as well as 12 index factors. Factors such as air negative ions, inhalable particulate matter, and road buffer zones are particularly introduced. More comprehensively reflect the ecological characteristics of forest parks and their responses to human disturbances. This study adopts the AHP combined with Yaahp 10.1 (Meta Decision Software Technology Co., Ltd., Corp., Shanxi, China) software to determine the weights, and realizes spatial visualization through GIS weighted superposition analysis. The method is mature and highly operable, and is suitable for the sensitivity evaluation of small and medium-scale ecological units. Although AHP has a certain degree of subjectivity, through multiple rounds of expert consultation and consistency verification, the scientificity and credibility of weight setting have been effectively enhanced. This study not only completed the ecological sensitivity assessment, but also further carried out ecological function zoning based on the assessment results, and proposed operational countermeasures for the protection and utilization of forest resources, which has strong practical application value. The research results can provide a scientific basis for the ecological planning, resource management and sustainable development of similar forest parks, especially for the central and western regions that are promoting ecological civilization construction and the rural revitalization strategy.
The research objective is to assess the ecological sensitivity of Longyuwan National Forest Park in Luanchuan County, Henan Province, and optimize its spatial functional zoning to achieve a balance between sustainable forest resource development and ecological conservation with rational utilization. Construct an Ecological Sensitivity Evaluation System: Utilize the AHP to establish a multi-level evaluation framework incorporating 12 ecological indicators across five dimensions: geomorphology, hydrology, atmosphere, biology, and anthropogenic activities. Single-Factor and Comprehensive Sensitivity Assessment: Employ spatial analysis tools in ArcGIS 10.2 (Environmental Systems Research Institute, Inc., Redlands, CA, USA) to conduct single-factor sensitivity analyses for each ecological indicator and generate a comprehensive ecological sensitivity distribution map through weighted overlay. Identify Key Influencing Factors: Determine the most impactful indicators on ecological sensitivity and analyze their spatial distribution characteristics. Ecological Sensitivity Grading and Functional Zoning: Based on the evaluation results, classify the park’s ecological sensitivity into five levels and delineate four functional zones to provide a scientific basis for sustainable park management. Theoretical and Practical Support: Offer theoretical and practical guidance for landscape governance in forest-urban interface areas to address potential threats to ecosystem stability from urbanization pressures.
2. Materials and Methods
2.1. Study Area Overview
The study was conducted in Longyuwan National Forest Park, located in Miaozi Town, southeastern Luanchuan County, Luoyang City, Henan Province, China. The Park is situated on the northern slope of the Funiu Mountains, part of the eastern section of the Qinling Mountain range (Figure 1). It is approximately 13.7 km in straight-line distance from the county seat. The geographic coordinates of the area span from 111°40′ to 111°49′ E and 33°39′ to 33°46′ N, with a total area of approximately 1840 hectares (ha) [25]. This region is characterized by a temperate continental climate, with a mean annual temperature of 12.4 °C. Winters are cold and dry, while summers are cool and humid with concentrated precipitation. The average annual precipitation ranges from 700 to 900 mm, annual evaporation reaches 1514.7 mm, and the mean annual relative humidity is approximately 68% [26]. The region exhibits pronounced water deficits driven by the strong annual evaporative demand associated with its temperate continental monsoon climate. Mid-montane and subalpine terrain further amplifies surface evapotranspiration, while precipitation is concentrated in July–September and remains scarce during other months, leaving atmospheric evaporative demand persistently unmet. In such water-limited settings, forest ecosystems—especially vegetation at high elevations and on steep slopes—recover and undergo succession more slowly once disturbed. Consequently, the ecological functions of water bodies are both especially important and markedly vulnerable.
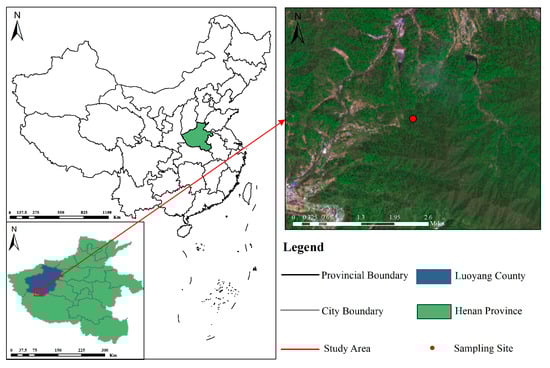
Figure 1.
Location of Longyuwan National Forest Park.
The hydrological system belongs to the Yiluo River, a sub-basin of the Yellow River, featuring relatively abundant water resources. The dominant soil types are brown soil and cinnamon soil, typically with sandy loam or light loam textures, offering favorable conditions for water permeability and aeration. The Park supports a rich array of biological resources, encompassing a wide diversity of plant and animal species [27]. Due to its significant value for biodiversity conservation, it is often referred to as a “gene bank for northern tree species” and a “natural exhibition hall for wildlife.”
2.2. Data Sources and Processing
Raster data were obtained from the Geospatial Data Cloud (available at www.gscloud.cn, accessed on 2 January 2024). Digital elevation model (DEM) data with a 30 m resolution were derived from the ASTER GDEM dataset, specifically the tile covering the study area: ASTGTMV003_N33E111_dem.tif. Normalized Difference Vegetation Index (NDVI) data for the years 2000–2022 were sourced from the National Ecosystem Science Data Center of China, based on the annual maximum NDVI product at 30 m resolution [28]. The dataset was generated using the Annual Maximum Value Composite (AMVC) method, in which the maximum NDVI value is selected for each pixel from all available images within a given year. This approach effectively mitigates cloud contamination, represents the true vegetation potential, and minimizes seasonal disturbances, and it is widely recognized as a standard method in remote sensing studies. Vegetation type data were retrieved from the 30 m Global Land Cover Fine Classification Product (2020) developed by the Aerospace Information Research Institute, Chinese Academy of Sciences [29]. To standardize spatial resolution, the 500 m MODIS NDVI product was resampled to 30 m to enable pixel-level comparison with higher-resolution datasets. Nearest-neighbor assignment was used for resampling. MODIS data were resampled onto a common grid and then subjected to spatial consistency verification against a 30 m NDVI product processed with identical cloud masking and annual maximum value compositing. This workflow ensures comparisons between two cloud-free datasets that both represent the annual peak vegetation signal, thereby maximizing data reliability and scientific rigor.
Vector data were extracted from the contour maps provided in the Master Plan of the Henan Funiu Mountains National Nature Reserve (2013–2020).
Expert questionnaire data acquisition. To determine factor weights in the ecological sensitivity evaluation system, we employed the Delphi method and administered the expert survey titled “Importance Assessment of Indicators for the Longyuwan Ecological Sensitivity Evaluation.” Invitees included scholars in forestry, ecology, and geography; university faculty; and managers of Longyuwan National Forest Park. Using the AHP with the standard 1–9 Saaty scale, experts performed pairwise comparisons of factors at both the criterion and indicator levels. In total, 12 questionnaires were collected. After screening and consistency checks, 2 were discarded (1 for excessive divergence, 1 for overly absolute responses), leaving 10 valid questionnaires. These validated expert scores were used for subsequent weight computation and served as the primary data source for determining the weights of the evaluation factors.
2.3. Methods
2.3.1. Ecological Sensitivity Evaluation
In accordance with the Technical Specification for Ecological Function Zoning, ecological sensitivity assessment must fully consider natural environmental elements, socioeconomic conditions, and human activities [30]. Based on the delineated study area, we compiled baseline information for the forest park and, drawing on both the collected materials and field surveys, selected appropriate evaluation indicators and classified them. We then established a three-tier evaluation framework comprising a target layer, a subsystem (criterion) layer, and an indicator layer. To ensure scientific rigor and practical applicability, we combined quantitative and qualitative approaches to evaluate the importance of each factor, determine indicator weights, and design the “Importance Assessment of Indicators for the Longyuwan Ecological Sensitivity Evaluation” questionnaire. To ensure the objectivity and robustness of the weighting scheme, we adopted the Delphi method in conjunction with the AHP, inviting 12 experts and ultimately obtaining 10 valid responses after screening. This effective sample size conforms to conventional AHP methodological requirements and is sufficient to stabilize the construction of the judgment matrices and the subsequent weight calculations. The expert panel comprised six scholars from universities and research institutes with long-term experience in forestry, ecology, environmental science, and GIS, and four technical experts from local forestry bureaus and nature reserves with more than 15 years of management experience. This composition balances theoretical depth and practical expertise, ensuring professional weight judgments and credible results. Indicator weights were computed using Yaahp 10.1 software to quantify indicator importance.
The ecological sensitivity evaluation was conducted based on a comprehensive review of the Technical Specification for the Delineation of Ecological Function Zones, Ambient Air Quality Standards, Continuous Forest Inventory Technical Regulations, and Assessment Criteria for the Scenic Quality of Forest Parks in China. Combined with the ecological and geographic characteristics of Longyuwan National Forest Park, individual evaluation indicators were categorized into sensitivity levels. These standards all identify ecologically sensitive areas through quantitative indicators (such as functional zone classifications, pollutant limits, vegetation indices, and landscape ratings), providing technical support for spatial planning, pollution control, and ecological conservation.
Sensitivity values were assigned in ascending order of ecological vulnerability using a five-level scale: 1 (very low), 3 (low), 5 (moderate), 7 (high), and 9 (very high). Each factor was analyzed individually to determine its ecological sensitivity. Building on prior studies, we established an evaluation system based on the 1–3–5–7–9 (Saaty) scale, classifying factors such as elevation, slope, water bodies, land-use type, and road accessibility into five grades and assigning each a distinct weight (Figure 2). This approach integrates expert judgment with quantitative indicators, accounting for the relative importance of different factors while avoiding the limitations of any single method. Subsequently, a weighted-sum method was applied: the standardized values of each evaluation factor were multiplied by their respective weights and then aggregated to derive a composite ecological sensitivity index for each spatial unit. This procedure synthesizes multiple indicators into a single metric that expresses the degree of ecological sensitivity, facilitating comparison and analysis across regions [31].
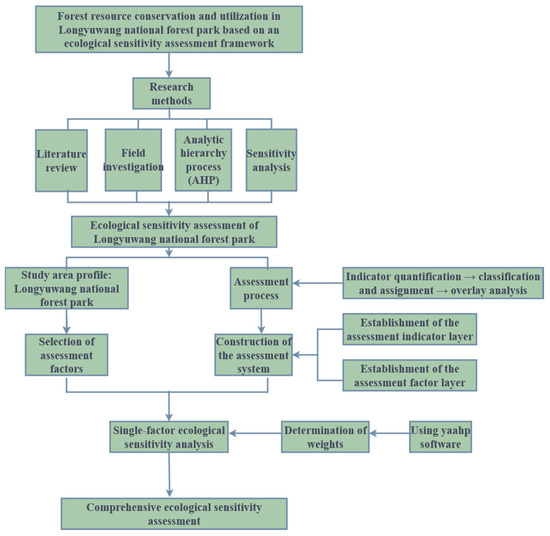
Figure 2.
Technical Flowchart of Ecological Sensitivity Evaluation and Functional Zoning in Longyuwan National Forest Park.
Following the single-factor assessment, the integrated ecological sensitivity of the study area was evaluated by applying weighted overlay analysis in ArcGIS 10.2. The weights were derived from quantified indicator importance, and the final sensitivity map was generated by overlaying all factor layers using the weighted sum method.
2.3.2. Application of ArcGIS 10.2 Software
Buffer Analysis
Buffer analysis is a spatial analysis method in ArcGIS 10.2 that involves generating buffer zones around point, line, or polygon features, which serve as the basic analytical units [32]. These buffer zones are represented as polygon layers that extend a defined distance from the target features. Once created, the buffer layer is overlaid with other thematic layers to perform spatial intersection and extract relevant analytical results. The general formula for defining a buffer zone around a reference feature is as follows:
- Bi: Represents the buffer zone generated for the i-th reference object Oi.
- x: Represents any spatial point location within the study area.
- d(x, Oi): Is a distance function, representing the shortest Euclidean distance from spatial point x to the reference object Oi.
- Oi: Represents the i-th reference object, which is the target around which the buffer analysis is conducted.
- R: Is the pre-defined buffer radius, representing the distance threshold of the influence range. In this study.
In this study, rivers and roads were selected as target features and converted into line features, which served as the core reference objects for buffer analysis. Based on the influence distances of water bodies and roads, multiple sets of buffer zones with varying radii were generated. These buffer zones were used to evaluate the degree to which water bodies and roads affect ecological sensitivity within the forest park.
The Multiple Ring Buffer tool in ArcGIS 10.2 was employed to construct buffer zones at different distance intervals. These buffer zones were subsequently merged and spatially analyzed to assess their ecological impact. By comparing buffer distances and corresponding buffer area extents, this method allowed for a quantitative differentiation of ecological sensitivity levels across different landscape patches [33]. The waterbody buffer (0–100 m) is defined on the basis that human impacts on aquatic systems are most pronounced within 100 m of the shoreline and attenuate sharply with distance. The road buffer (0–200 m) follows the ecological consensus on the spatial footprints of road-related noise, pollution, and habitat disturbance. This classification scheme also reflects the study area’s narrow river channels and concentrated human activities.
Overlay Analysis
Overlay analysis refers to the process of performing a series of set operations on two or more spatial datasets within a common spatial reference system to generate new data outputs [34]. This technique enables the integration of multiple spatial targets or feature datasets through specific computational methods, facilitating comprehensive spatial synthesis within a defined geographical scope.
In this study, the overlay analysis was applied to integrate the single-factor ecological sensitivity evaluations within the established ecological sensitivity assessment model. The Weighted Overlay function in ArcGIS 10.2 was used to perform the overlay processing of raster layers [35]. Each single-factor ecological sensitivity raster, which had been reclassified in ArcGIS 10.2 based on sensitivity levels, was assigned a distinct numeric value corresponding to its sensitivity category. These raster layers were then imported into the software and subjected to the Weighted Overlay Analysis tool.
During the analysis, each input raster cell value was multiplied by its corresponding weight factor—representing the relative importance of each ecological factor. The resulting weighted values were summed across all layers to generate a composite ecological sensitivity raster. This output was subsequently used to conduct further comprehensive ecological sensitivity assessments across the study area.
As a prerequisite for software-based analysis and ecological sensitivity assessment, this study first conducted a weight determination process for the selected evaluation indicators. Based on the Delphi method, expert opinions were solicited from professionals and academic faculty members in relevant fields to define the scope and significance of each indicator. A structured expert questionnaire titled Expert Survey on the Importance of Ecological Sensitivity Evaluation Indicators for Longyuwan National Forest Park was designed and distributed.
To ensure the scientific rigor and accuracy of the results, only valid and completed questionnaires were included in the subsequent statistical analysis. Data were collected using a specialized online survey platform. Based on pairwise comparisons of indicators made by experts, a judgment matrix was constructed. The evaluation scores provided by individual experts were normalized using the geometric mean method to derive preliminary weight values for each indicator.
A hierarchical structure model was then established in Yaahp V10.1 software, and the normalized values were input into the judgment matrix. The software automatically calculated the weights of each indicator at different hierarchical levels.
2.4. Research Methods
2.4.1. Literature Analysis
We conducted a systematic review and synthesis of the relevant literature, using academic databases and indexing platforms such as China National Knowledge Infrastructure (CNKI) and Web of Science (WOS). The search focused on topics related to forest resources, national forest parks, and ecological sensitivity. Retrieved studies were read, classified, and organized to inform indicator selection and methodological design.
2.4.2. Field Investigation
Preliminary reconnaissance and site visits were carried out in Longyuwan National Forest Park to define the number of surveys and the focus of each campaign. We performed coordinate registration and a baseline appraisal of geographic, socio-cultural, atmospheric, hydrological, and biotic conditions. On-site assessments covered the status of natural resources, human activities, vegetation cover, and forest conservation measures. Consultations were held with park managers regarding management practices, ecological restoration, and resource protection. Within the study area, we conducted in situ measurements and sampling to acquire data for the selected indicators. A negative air ion monitoring system was used to measure forest negative air ions and inhalable particulate matter (PM10 and PM2.5). All data were subsequently cleaned, organized, and categorized.
2.4.3. Analytic Hierarchy Process (AHP)
An AHP-based hierarchical structure model of ecological sensitivity was constructed through qualitative analysis. Influencing factors were grouped by category and used as higher-level criteria. After two levels of factor aggregation, pairwise comparison judgment matrices were built for the selected indicators to establish the evaluation system. The Delphi method was combined with AHP, and Yaahp 10.1 software was used to calculate weights for the indicator layer and single-factor weights for the factor layer [36]. Weight matrices passed consistency checks prior to analysis. The application of MCDA technology in the spatial allocation of ecosystem services is becoming increasingly mature. For instance, in the research on forest management in Turkey, Bahler, Kent and Balci successfully integrated the AHP, the Delphi method, and innovatively incorporated the concepts of scientific suitability, preferences of multiple stakeholders, and multi-dimensional sustainability such as ecology, economy, and society into a unified decision-making framework. It provides a quantifiable model for prioritizing the allocation of ecosystem services in small forest classes. This method provides an important reference for conducting multi-objective trade-offs in complex human–land systems similar to the urban-rural ecotone [37].
2.4.4. Ecological Sensitivity Analysis
Using ArcGIS 10.2, we established single-factor evaluation layers through image preprocessing and raster-based spatial analysis. A GIS-based weighted overlay was then applied to derive a composite ecological sensitivity map and to quantify the relative influence of each indicator on the park’s ecological environment. The comprehensive evaluation integrates qualitative and quantitative components: qualitatively, by defining the indicator system and grading standards for ecological sensitivity; quantitatively, by (i) administering expert questionnaires to comparatively score factor importance for Longyuwan National Forest Park and (ii) applying AHP to derive indicator weights. The integration of qualitative and quantitative methods was operationalized via ArcGIS 10.2 spatial analysis, reclassification, and weighted overlay to compute ecological sensitivity across the entire park. Indicator selection adhered to the principles of scientific soundness, systematic completeness, representativeness, and applicability.
3. Results
3.1. Construction of Ecological Sensitivity Evaluation System
3.1.1. Construction of the Indicator System
Based on a comprehensive review of relevant literature and in consideration of the natural characteristics and ecological conditions of Longyuwan National Forest Park, representative and critical ecological factors were identified and categorized. Ultimately, twelve factors, including elevation and slope, were selected as the evaluation indicators. Referring to the Provisional Technical Specification for Ecological Function Zoning, the indicator system was constructed using Yaahp 10.1 software. The system adopts a three-tier hierarchical structure, consisting of a target layer, a system layer, and an indicator layer [38].
Target Layer (A): Ecological sensitivity evaluation of Longyuwan National Forest Park; System Layer (B): Comprising five subsystems—topography and geomorphology, hydrology, atmosphere, flora and fauna, and human activities; Indicator Layer (C): Consisting of 12 specific evaluation factors, including elevation, slope, aspect, and others (Figure 3).
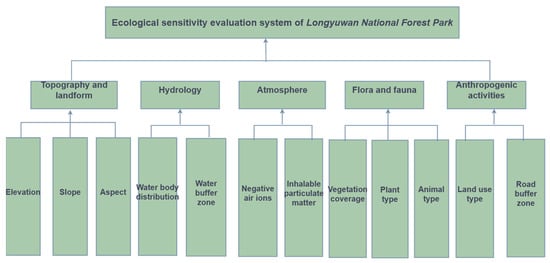
Figure 3.
The hierarchical structure model of forest park evaluation system.
3.1.2. Selection of Evaluation Factors
The selected evaluation factors include the following: elevation, slope, aspect, waterbody distribution, waterbody buffer zone, air negative ion concentration, inhalable particulate matter (PM), vegetation coverage, plant types, animal types, land-use types, and road buffer zone. These factors comprehensively reflect the physical, ecological, and anthropogenic characteristics relevant to the ecological sensitivity of the study area. Principles for selecting evaluation factors. Indicator selection followed these principles: (i) scientific validity—each indicator has a clear theoretical basis, is representative, and meaningfully captures the study area’s ecological functions; (ii) objectivity—data are reliable and accurate, minimizing subjective bias; (iii) operability—indicators are readily obtainable and measurable, with redundancy avoided; (iv) representativeness and coverage—key drivers with strong influence on ecological sensitivity are prioritized while striving for comprehensive coverage of ecological elements; and (v) context relevance—the final set reflects the study area’s specific conditions. In constructing the AHP hierarchy, experts performed pairwise comparisons of the relative importance of ecological factors to derive the final weights, thereby ensuring scientific rigor and rationality of the assessment results [19].
3.1.3. Classification of Evaluation Factor Levels
The single-factor ecological sensitivity classification standards for Longyuwan National Forest Park (Table 1) form the fundamental evaluation framework of this study. It establishes a standardized system that quantifies ten ecological factors into five sensitivity levels with assigned values of 1, 3, 5, 7, and 9. Drawing upon relevant research findings, the classification covers multiple dimensions including topography, hydrological environment, ecological characteristics, and anthropogenic disturbances. The criteria demonstrate varied sensitivity patterns according to factor characteristics: for natural constraint factors like slope, sensitivity increases with gradient steepness; for ecological value factors such as vegetation types, sensitivity shows positive correlation with conservation value (e.g., broad-leaved forests being classified as highly sensitive); while for distance attenuation factors like road buffer zones, sensitivity decreases with increasing distance. This classification system provides a unified quantitative basis for subsequent GIS-based single-factor assessment and weighted overlay analysis, forming the scientific foundation for identifying key ecological conservation areas and developing differentiated management strategies.

Table 1.
Classification Standards for Single-Factor Ecological Sensitivity in Longyuwan National Forest Park.
3.1.4. Determination of Indicator Weights
We invited 12 experts to complete the questionnaire and obtained 10 valid responses. The expert panel comprised six scholars from universities and research institutes with long-term experience in ecology, environmental science, and GIS, and four technical specialists from local forestry bureaus and nature reserves, each with more than 15 years of management experience.
The consistency ratio (CR) of the matrix was calculated to be 0.0675, which satisfies the requirement of CR < 0.1, indicating good logical consistency in expert judgments. Therefore, the computed weights are considered reliable and valid for subsequent ecological sensitivity assessments and provide meaningful reference value.
The final weight assignment system for the ecological sensitivity evaluation indicators is presented in Table 2.
Table 2.
The weight value of the ecological sensitivity evaluation system in Longyuwan National Forest Park.
In the ecological sensitivity evaluation system of Longyuwan National Forest Park, the hierarchy consists of three levels: the target layer (A), the system layer (B), and the indicator layer (C). The total weight of the target layer is normalized to 1. Analysis of the system layer weights shows that topography and geomorphology accounts for the largest Percentage (0.3061), indicating that variations in elevation and terrain slope are the primary drivers of ecological change in the park. Human activities follow with a weight of 0.2688, highlighting the substantial impact of anthropogenic disturbance on the forest ecosystem. The remaining subsystems—flora and fauna, hydrology, and atmosphere—exert comparatively lesser influence.
At the indicator level, land-use type holds the highest weight (0.215), suggesting that the ecosystem within the park is highly responsive to changes caused by human land-use practices. This also implies that increased land development can significantly compromise ecological integrity, underscoring the strong influence of human activities. Other indicators with relatively high weights include elevation (0.1684) and waterbody distribution (0.1298). In contrast, indicators such as animal habitat suitability (0.0256), waterbody buffer zone (0.0325), and negative air ion concentration (0.0332) contribute less to habitat variation in the region.
3.2. Ecological Sensitivity Evaluation
3.2.1. Single-Factor Ecological Sensitivity Analysis
Topographic Factors
- (1)
- Elevation Factor
According to the analysis of the spatial data, the total area of Longyuwan National Forest Park is approximately 1840 ha. From the perspective of elevation, ecological sensitivity exhibits a spatial pattern that gradually increases from the northwest toward the central and southern parts of the park, followed by a gradual decrease toward the northeast. The main peak, Jijiaojian, located in the southeastern part of the park, represents the area with the highest ecological sensitivity. Regarding sensitivity classification, the extremely high sensitivity zone and high sensitivity zone account for 7.73% and 14.65% of the total park area, respectively. In contrast, the moderate and low sensitivity zones together comprise 70.50% of the area (Figure 4 and Table 3). Overall, the northeastern and northwestern regions of the park exhibit relatively low elevation-related ecological sensitivity, while the southern region demonstrates higher sensitivity levels.
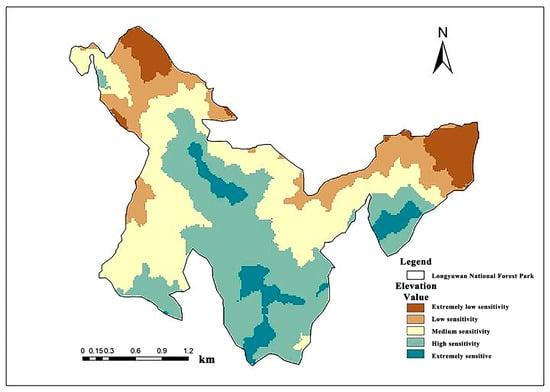
Figure 4.
Ecological sensitivity classification map of elevation factor.
Table 3.
Ecological sensitivity analysis of elevation factor.
- (2)
- Slope Factor
According to the spatial analysis results, areas with steeper slopes are primarily concentrated in the northwestern and northeastern parts of the forest park. As the park is located in a mountainous region, the overall terrain is relatively steep, with a large Percentage classified as steep slope zones. In terms of sensitivity classification, moderately sensitive and low-sensitive areas account for 30.31% and 52.04% of the total area, respectively. Considering the current tourism development within the park, most recreational facilities are situated in these moderately and low-sensitive zones, whereas highly sensitive and extremely sensitive areas are designated as conservation zones (Table 4 and Figure 5).
Table 4.
Ecological sensitivity analysis of slope factor.
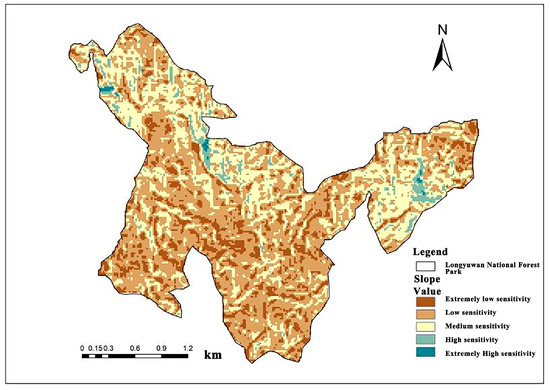
Figure 5.
Ecological sensitivity classification map of slope factor.
- (3)
- Aspect Factor
According to the analysis, the ecological sensitivity of Longyuwan National Forest Park with respect to aspect is relatively high. The areas classified as having moderate and high sensitivity account for 25.21% and 34.61% of the total park area, respectively (Table 5 and Figure 6). These Percentages are relatively large, suggesting that the suitability of slope aspect for biological habitats is generally suboptimal in these regions.
Table 5.
Ecological sensitivity analysis of slope aspect factor.
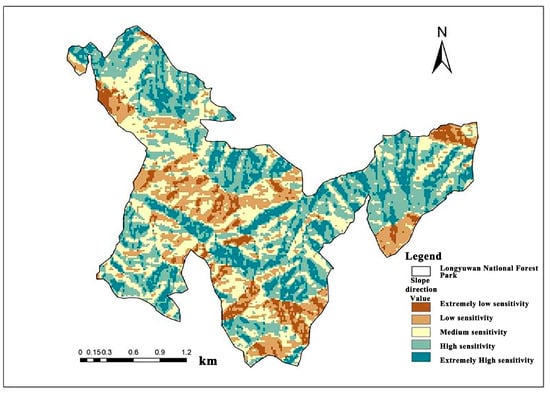
Figure 6.
Ecological sensitivity classification map of slope aspect factor.
Hydrological Factors
- (1)
- Water-Body Distribution Factor
According to the analysis, Longyuwan National Forest Park is characterized by a dense river network, with water bodies covering approximately 16.52% of the park’s total area (Table 6 and Figure 7). Most water bodies fall within the moderate to low ecological sensitivity categories. This indicates that, on the one hand, the spatial distribution of water bodies exerts relatively limited influence on the overall ecological sensitivity; on the other hand, it underscores the importance of rational utilization and effective protection of water resources within the park.
Table 6.
Ecological sensitivity analysis of water distribution factor.
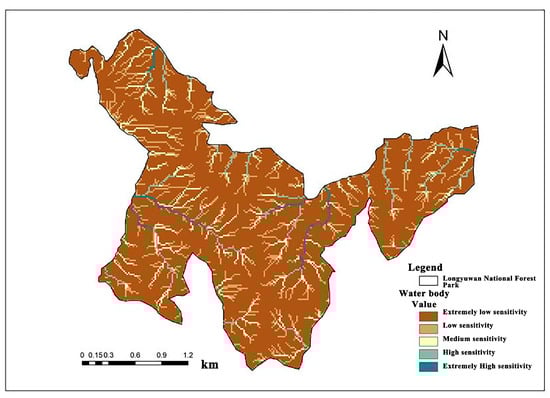
Figure 7.
Ecological sensitivity classification map of water distribution factor.
- (2)
- Water Buffer Zone Factor
According to the analysis results, although the river discharge within the park is relatively low, the river network is dense, with extensive coverage of mountain streams and a well-developed hydrological system. Consequently, the water buffer zone factor exerts a significant overall influence on the park’s ecological sensitivity. The analysis shows that areas of extremely high sensitivity account for 17.84% of the total area, representing a considerable Percentage, while areas of extremely low sensitivity comprise only 6.56% (Figure 8 and Table 7). Overall, the ecological sensitivity of the water buffer zone in Longyuwan National Forest Park is moderately high. Given the strong fluidity of the streams and the fact that some water systems are located within tourist areas, anthropogenic disturbances can further exacerbate water quality fluctuations. Therefore, it is essential to strengthen the protection and management of water bodies in the park.
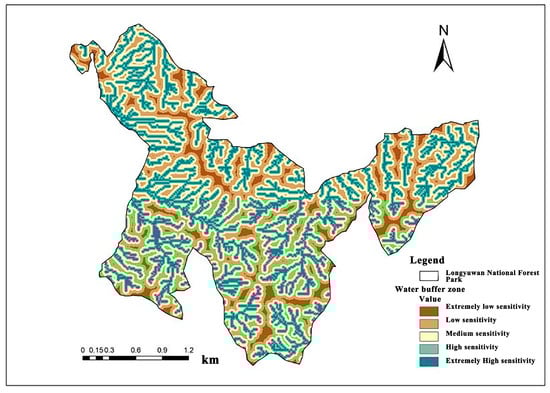
Figure 8.
Ecological sensitivity classification map of water buffer factor.
Table 7.
Ecological sensitivity analysis of water buffer factor.
Atmospheric Factors
- (1)
- Negative Air Ion Factor
Longyuwan National Forest Park is among the first national wellness bases designated with a management-oriented operational model. During peak tourist seasons, the concentration of negative air ions at major scenic spots can reach up to 50,000 ions/cm3. Within the “Forest Oxygen Bar” area of the park—characterized by dense stands of Betula platyphylla Sukaczev, Larix kaempferi (Lamb.) Carrière, and Tropaeolum majus L.—a high concentration of negative oxygen ions is observed, reflecting exceptional air quality and natural scenery.
Based on field surveys conducted by the authors, 18 reference sites were selected for in situ measurement of negative oxygen ion concentration across the park. According to the Standards for Negative Air Ion (NAI) Concentration Levels, a region is considered to have high negative oxygen ion concentration and fresh air if N ≥ 1200 ions/cm3. The measured average values from all 18 sampling points significantly exceed the defined threshold, thus designating the entire park as an extremely high sensitivity zone with respect to this factor (Table 8).
Table 8.
Air quality monitoring of Longyuwan National Forest Park.
- (2)
- Inhalable Particulate Matter Factor
Longyuwan National Forest Park possesses abundant forest resources, which contribute to the relatively low concentrations of inhalable particulate matter (PM). Based on the National Ambient Air Quality Standards of China, PM2.5 was selected as the indicator for rating inhalable particulate matter. According to the classification of functional zones for ambient air quality, the park is designated as a Class I zone, where the standard limits are an annual mean concentration of <15 μg/m3 and a 24 h average concentration of <35 μg/m3.
Field sampling was conducted at 18 reference sites across the park to assess PM2.5 concentrations. The data were analyzed in accordance with the Ambient Air Quality Standards and the Technical Regulation on Ambient Air Quality Index (AQI). Results indicated that all measured PM2.5 values in the study area complied with the limits for Class I air quality. The findings demonstrate excellent air quality, highly favorable for the dilution, dispersion, and removal of airborne pollutants, with no evidence of air pollution. Therefore, the entire park was classified as an extremely high sensitivity zone with respect to this ecological factor.
In this study, ecological sensitivity for atmospheric indicators—negative air ions (NAI) and PM2.5—was defined with respect to an ecosystem’s naturalness, fragility, and responsiveness to human disturbance. “Very high sensitivity” does not imply “poor current condition”; rather, it denotes areas in excellent condition that are therefore highly fragile, easily degraded, and difficult to restore. Classifying optimal NAI and PM2.5 conditions as “very highly sensitive” is intended to alert managers that these atmospheric environments are valuable ecological assets requiring the highest level of protection and that any development must be undertaken with extreme caution. Classification thresholds adopt the Class I concentration limits specified in the Standard for Concentration Levels of Negative (Oxygen) Air Ions (QX/T 380-2017) and the Ambient Air Quality Standard (GB 3095-2012), ensuring objective and authoritative delineation [39,40].
Flora and Fauna Factors
- (1)
- Vegetation Coverage Factor
Normalized Difference Vegetation Index (NDVI) data from 2000 to 2022 were obtained from the National Ecological Science Data Center (30 m resolution), and MODIS-based synthetic products (MODND1D, 500 m resolution) were sourced from the Geospatial Data Cloud. These datasets were imported into ArcGIS 10.2, and NDVI values for Longyuwan National Forest Park were extracted after spatial consistency verification, thereby generating the park-wide NDVI dataset. The study area is recognized as one of the best-preserved transitional forest ecosystems in central China, with an overall forest coverage rate of 98.6%. Representative forest vegetation includes large tracts of Larix gmelinii (Rupr.) Kuzen. forests and the Platycladus orientalis (L.) Franco garden, forming unique forest landscapes. Based on the vegetation cover characteristics of the park, the NDVI data were classified into ecological sensitivity levels and assigned sensitivity values.
According to the analysis (see Figure 9 and Table 9), ecological sensitivity based on vegetation coverage was predominantly in the extremely high category. The extremely high sensitivity area totaled 1779.57 ha, accounting for 96.72% of the park, while other sensitivity levels collectively represented only 3.28% of the area. Regions with relatively low vegetation coverage were primarily located in the northwestern and northeastern parts of the park and were characterized by shrub communities. From the perspective of forest resource conservation, it is imperative to strengthen protection efforts to maintain the high forest coverage and ensure ecological stability in the park.
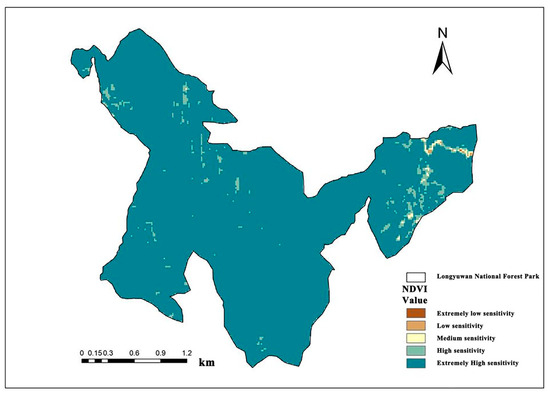
Figure 9.
Ecological sensitivity classification map of NDVI factor.
Table 9.
Ecological sensitivity analysis of NDVI factor.
- (2)
- Vegetation Type Factor
According to the analysis results, the ecological sensitivity of the forest park from the perspective of vegetation types is relatively high. Among all vegetation types, mixed forests account for the largest Percentage, comprising 73.03% of the total area, with a total area of 1344.11 ha (Figure 10 and Table 10). Considering that the forestland within the park is primarily composed of natural secondary vegetation, the ecological sensitivity of forest vegetation in the area is generally at a high level.
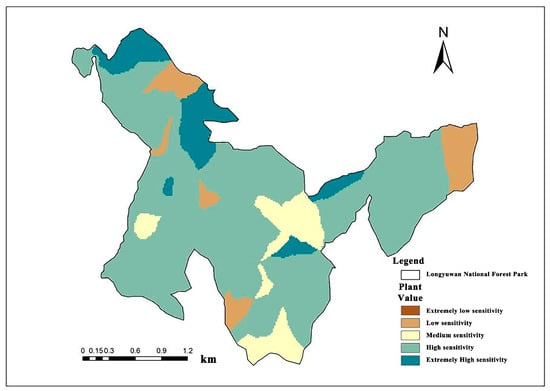
Figure 10.
Ecological sensitivity classification map of plant type factor.
Table 10.
Ecological sensitivity analysis of plant type factor.
From the perspective of forest resource conservation, the recovery of vegetation after disturbance is difficult. Therefore, it is crucial to strengthen the protection of vegetation types, plant species, and key protected flora to prevent damage from trampling and ensure the stability of forest ecosystems.
- (3)
- Animal Type Factor
As shown in the table, the ecological sensitivity of animal types in the national forest park is classified as high sensitivity, with high-sensitivity areas accounting for approximately 82.82% of the park’s total area. From the perspective of wildlife conservation, it is essential to make reasonable use of the favorable habitat conditions within the park, strengthen habitat protection, and strictly prohibit the destruction of food plants and shelter vegetation that are vital for the survival of wild animals (Figure 11 and Table 11).
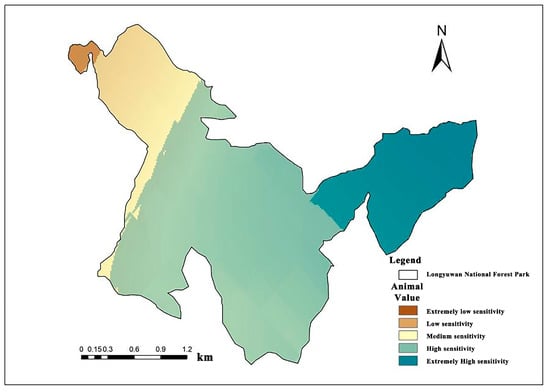
Figure 11.
Ecological sensitivity classification map of animal factor.
Table 11.
Ecological sensitivity analysis of animal’s type factor.
Anthropogenic Factors
- (1)
- Land-Use Type Factor
The forest coverage rate of the park exceeds 90%. According to canopy density, forest land is classified into closed forest land and sparse forest land, with areas of 1572.04 ha and 261.31 ha, respectively. The total forest area amounts to 1833.55 ha. Cultivated land occupies a relatively small area, only 7.29 ha. In terms of land-use type, the forest park is densely vegetated, with nearly all land-use categories dominated by forest land (Figure 12 and Table 12).
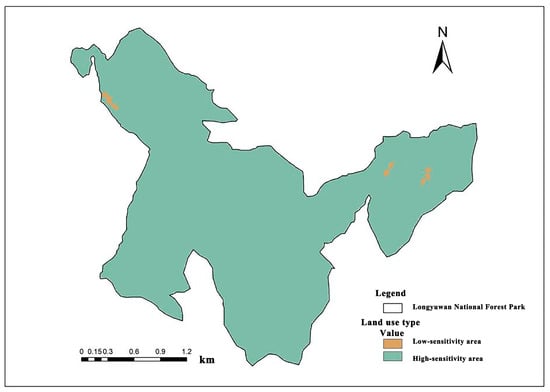
Figure 12.
Ecological sensitivity classification map of land-use type factor.
Table 12.
Ecological sensitivity analysis of land-use type factor.
- (2)
- Road Buffer Factor
The national forest park is predominantly situated within forested areas. Areas located more than 200 m away from roads were classified as regions of extremely high ecological sensitivity. The analysis revealed that these areas accounted for approximately 53.96% of the total park area. These highly sensitive zones are mainly concentrated in the northern, western, and eastern conservation zones, as well as in the eastern section of the Jijiaojian scenic area in the southern part of the park (Figure 13 and Table 13).
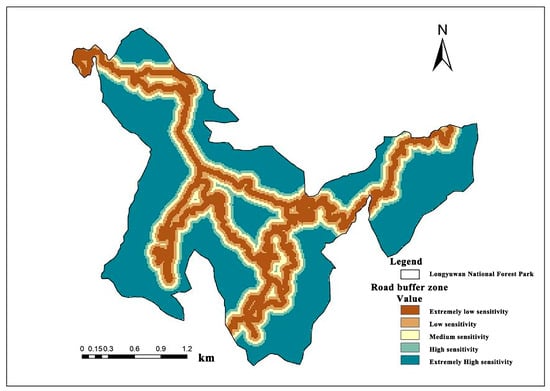
Figure 13.
Ecological sensitivity classification map of road buffer factor.
Table 13.
Ecological sensitivity analysis of land road buffer factor.
From the perspective of forest resource conservation, the increasing use of major roads and walking trails for ecotourism, coupled with the growing number of tourists and vehicles, may exert considerable pressure on the forest ecosystem and native wildlife resources. Therefore, effective management and protective measures are essential to minimize anthropogenic disturbances in these ecologically sensitive areas.
3.2.2. Comprehensive Analysis of Ecological Sensitivity
Based on the classification and evaluation of individual ecological sensitivity factors in Longyuwan National Forest Park, a comprehensive ecological sensitivity assessment was conducted using GIS-based visual mapping. Two major characteristics were observed among the various evaluation factors (Figure 14).
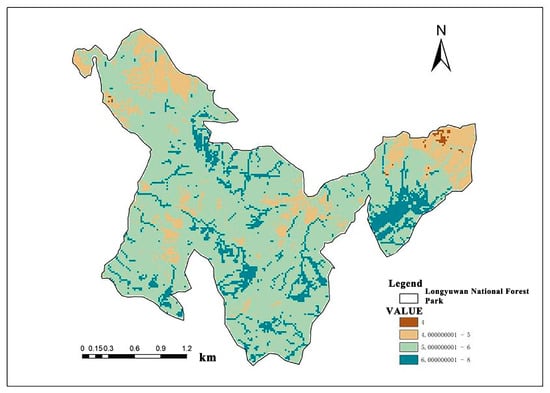
Figure 14.
Ecological sensitivity value map of Longyuwan National Forest Park.
Firstly, interrelationships exist among different factors. For example, analysis of the hydrological network and its classification revealed a spatial overlap with the road buffer zones. This is primarily attributed to the park’s infrastructure design, in which many tourist roads and footpaths were constructed along water bodies. This not only enhances the landscape aesthetics and improves the visitor experience but also facilitates access to water resources for human activities within the park.
Secondly, certain factors in the study area exhibit particularly high sensitivity. In terms of atmospheric conditions, both the negative air ion concentration and particulate matter (PM2.5) indicators fell within the extremely high sensitivity zone. This is mainly due to the high forest coverage and dense water network in the park. Although the area is classified as a tourism zone, it experiences relatively low levels of human disturbance, contributing to favorable measurements for both atmospheric indicators.
After assigning the weights to each evaluation factor, the reclassified and scored layers were imported into ArcGIS 10.2 software. A weighted overlay analysis was then performed, integrating all reclassified single-factor layers to generate a comprehensive ecological sensitivity assessment map for Longyuwan National Forest Park. Based on this composite map, the natural breaks (Jenks) method was applied to further categorize the results into five sensitivity levels: extremely high sensitivity, high sensitivity, moderate sensitivity, low sensitivity, and extremely low sensitivity. This process produced a raster-based comprehensive ecological sensitivity evaluation map of the park. Subsequently, the raster data were converted into vector polygons, and spatial statistics were used to calculate the area of each sensitivity zone. The spatial distribution and corresponding area Percentages of the different sensitivity levels are presented in the following Figure 15 and Table 14.
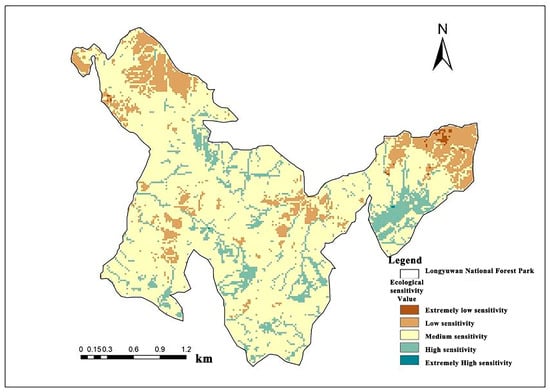
Figure 15.
Ecological sensitivity classification map of Longyuwan National Forest Park.
Table 14.
Comprehensive evaluation of ecological sensitivity in Longyuwan National Forest Park.
According to the comprehensive ecological sensitivity evaluation map, the overall ecological sensitivity of Longyuwan National Forest Park exhibits a spatial pattern of being higher in the south and lower in the north. The areas with relatively high ecological sensitivity are primarily located in the southern forest zone, while regions in the northwest and northeast show lower sensitivity. Highly sensitive areas are concentrated in the central forest zone, the eastern forest zone, and the southern mountainous forest area, among which the central zone includes three relatively contiguous subregions of high sensitivity.
As shown in the statistical chart, both the extremely high and extremely low sensitivity zones account for less than 1% of the total park area. The high sensitivity zone covers an area of 220.64 ha, representing 11.99% of the park; the moderate sensitivity zone is the most extensive, with an area of 1352.87 ha, accounting for 73.53% of the total; the low sensitivity zone covers 261.08 ha, accounting for 14.19% of the total area.
In terms of overall spatial distribution, topography and elevation have significant effects on ecological sensitivity. Areas at lower elevations tend to exhibit lower sensitivity, while the southern region, which is generally at a higher elevation than the north, demonstrates an increasing trend in sensitivity levels. Additionally, from a spatial perspective, the park entrances, forest management offices, administrative villages, and tourism service zones are mostly situated in lower elevation areas. Increased intensity of human activities in these areas may lead to vegetation degradation and water pollution, thereby adversely affecting the forest and ecological environments.
In summary, the ecological sensitivity assessment indicates that the overall region of Longyuwan National Forest Park falls within a relatively high sensitivity category. From the perspective of sensitivity rating, the park benefits from a favorable natural environment, and despite tourism development, its overall ecological condition remains sound. The park holds high ecological value, abundant and high-quality forest resources, and a well-preserved ecosystem. Human activities have, so far, had a limited negative impact on the park’s ecological environment.
3.3. Research on Forest Resource Protection and Utilization Strategies Based on Ecological Sensitivity Assessment
3.3.1. Ecological Functional Zoning
Based on the comprehensive ecological sensitivity assessment, the Longyuwan National Forest Park was zoned into functional areas according to the degree of ecological sensitivity. As the sensitivity levels presented in the form of spatial patches following classification by the natural break’s method, the resulting zones were scattered and lacked spatial continuity (Figure 16 and Table 15). Therefore, in order to improve spatial coherence, the sensitive areas were reorganized and integrated based on the ecological sensitivity classification map. The forest park was ultimately divided into four functional zones: Ecological Conservation Zone, Core Scenic Zone, General Recreation Zone, and Management and Service Zone [41].
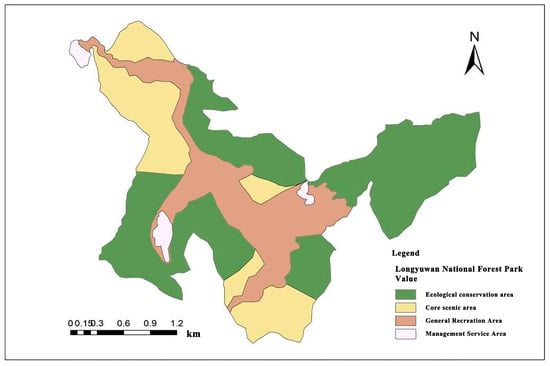
Figure 16.
Functional zoning map of Longyuwan National Forest Park.
Table 15.
Functional zoning map of Longyuwan National Forest Park.
3.3.2. Forest Resource Conservation
Longyuwan National Forest Park implements systematic conservation measures to maintain forest resources and ecological balance, with a focus on biodiversity protection and management mechanism optimization. First, the park emphasizes the conservation of biodiversity and the quality of plant resources by relying on the high coverage of secondary forests to enhance ecosystem stability. It actively promotes native plant protection and the prevention of invasive species. Second, efforts are made to improve management systems by establishing an integrated vertical management model tailored to the current status and future needs of the protected area [42]. A multi-departmental collaborative prevention and control mechanism is to be established to strengthen inter-departmental coordination and foster a long-term cooperative framework under the supervision of relevant governmental authorities, ensuring efficient division of responsibilities and synergistic operations.
3.3.3. Ecological Quality Improvement and Restoration
To support the sustainable development of Longyuwan National Forest Park and enhance eco logical security and habitat quality, a strategy of natural ecological restoration is proposed. Based on field investigations and an assessment of tourism development, tailored restoration approaches should be applied to different functional zones. This involves integrating natural and artificial interventions to optimize biodiversity and promote a stable forest vegetation community. As a national 4A-level tourist destination and one of the first designated national forest-based wellness bases, Longyuwan’s recreation, healthcare, and educational activities heavily rely on its forest resources. However, the intensification of human activities could exert pressure on the ecological environment. Through ecological landscape restoration, the park aims not only to enhance ecological quality but also to achieve positive socio-economic benefits, which in turn will provide stronger material support for long-term ecological improvement.
3.3.4. Rational Utilization of Forest Resources
Following the principle of “protection first, rational utilization,” Longyuwan National Forest Park seeks to build a sustainable forest resource utilization system. First, early warnings for irrational exploitation should be implemented by enhancing public awareness of ecological civilization and reinforcing the concept that “lucid waters and lush mountains are invaluable assets.” It is essential to enforce environmental laws and regulations related to ecological tourism, including the Forest Law, Environmental Protection Law, Wildlife Protection Law, and the Regulations on the Administration of Nature Reserves [43,44]. Illegal logging, poaching, and other violations must be strictly prohibited. Second, the park should develop forest wellness initiatives and promote community co-construction. As an integration of the healthcare and tourism industries, forest-based wellness services can meet the growing demand for health recovery and leisure travel [45]. Third, the ecological tourism model should be optimized by incorporating local cultural traditions, social characteristics, red (revolutionary) heritage, and historical contexts into tourism development [46]. Fourth, the park should pursue the scientific development of under-forest economies. While ensuring the ecological protection of forest environments, forest land space can be reasonably utilized to develop under-forest industries, innovate forestry development models, and ultimately achieve a win–win outcome for ecological, economic, and social benefits [47].
4. Discussion
Forest parks serve as essential carriers for maximizing forest functions, especially the ecosystem services provided by forest ecosystems. They also represent the most critical platform for the development of forest-based tourism [48]. In the process of advancing ecological civilization, a relatively scientific and complete evaluation system for ecological sensitivity in forest parks has gradually been established. In this study, AHP and spatial analysis methods were employed to evaluate the ecological sensitivity of the forest park. However, with the deepening of research, the interdisciplinary nature of the subject has become increasingly evident, requiring integrated knowledge from ecology, forestry, economics, and geography to support comprehensive evaluations [49]. Although Longyuwan National Forest Park is not located within a highly urbanized core, its proximity to rural settlements and its designation as a national tourist destination make it an important part of the broader urban–rural ecological network. The findings of this study highlight how landscape sensitivity varies across elevation and human disturbance gradients. This approach can be extended to other ecotonal forest regions that are subject to urban sprawl, helping to preemptively identify areas at risk and inform zoning regulations. Future management strategies should incorporate urban ecological planning principles to ensure that conservation efforts remain adaptive to expanding urban footprints and increasing anthropogenic pressures. Considering limitations in individual capacity, time constraints, and data availability, several shortcomings and areas for improvement in this study are identified:
This study selected 12 evaluation indicators based on the characteristics of Longyuwan National Forest Park to conduct a comprehensive ecological sensitivity analysis. Although the selected indicators aimed to be representative, research on aspects such as forest carbon sequestration, forest-based health and wellness, and ecosystem services remains insufficient. Future research should aim to expand and refine the indicator system to include these important ecological functions.
The selection of indicators was based on a review of existing literature and field investigations, while AHP was used to determine indicator weights. Although every effort was made to ensure objectivity and scientific rigor, the process still involved subjective judgment. Future research should explore more objective and scientifically robust evaluation methods to enhance the overall reliability of results.
Functional zoning of the park was carried out based on the comprehensive ecological sensitivity assessment, and strategies for forest resource protection and development were proposed. However, due to limited resources and capacity, only general suggestions were provided. The implementation and practical application of specific measures need to be further explored and refined.
As the study area is located in Luanchuan County, Luoyang City, Henan Province, which is rich in forest resources, future research could aim to improve the regional ecological sensitivity evaluation system and establish a comprehensive database. This would facilitate ecological interaction and collaborative management among regions.
Sensitivity analysis of weight assignments was not conducted, which constitutes a limitation of this study. Future work will vary the weights of key factors to simulate changes in ecological sensitivity patterns under alternative weighting schemes, thereby testing the robustness of the model and identifying the most influential drivers. Introducing a weight-sensitivity analysis to evaluate the robustness of the weighting configuration will be a priority for subsequent research.
Forest parks are multi-functional landscapes that integrate ecological protection, scientific research, leisure and cultural services. In this study, we applied the AHP and spatial analysis based on Geographic Information System to assess ecological sensitivity and delineate the functional areas of Longyuwan National Forest Park. Our research findings indicate that highly sensitive and highly sensitive areas require strict protection, while low-sensitivity areas can accommodate moderate entertainment and infrastructure construction.
Compared with similar studies, the methodological framework adopted in this study is consistent with the international ecological sensitivity assessment. For instance, similar methods combining multi-criteria Decision Analysis (MCDA) and geographic information system (GIS) technology have been adopted in Mediterranean Forest parks, protected areas in Turkey, and urban ecological parks in China, all of which have confirmed the robustness of spatial-clear sensitivity assessment in guiding land-use planning. Compared with these studies, our research emphasizes the integration of natural indicators and socio-economic indicators, not only highlighting ecological vulnerability but also the pressure on tourism development—a dimension that was less emphasized in earlier international studies [50].
These results support our initial hypothesis that ecological sensitivity in forest parks is spatially heterogeneous and closely related to topography, vegetation coverage and human disturbances. The highly sensitive area of Longyuwan National Forest Park mainly coincides with steep slopes, high vegetation coverage and key biodiversity habitats, which is consistent with the results of Xuefeng Mountain National Forest Park and other case studies of mountainous areas in China. On the contrary, low-sensitivity areas are located in relatively flat regions with stable secondary forests, which confirms the hypothesis that these areas can sustain greater human activities without endangering ecological stability.
The broader impact of this research lies in its contribution to balancing ecological protection and sustainable utilization in forest parks. By providing an explicit spatial framework, this study offers practical guidance for zoning, biodiversity conservation and tourism planning. In addition, the combination of ecological sensitivity assessment and functional zoning helps to implement China’s ecological civilization strategy and resonates with global discussions on the trade-offs of ecosystem services within protected areas [37].
However, this study has some limitations. Firstly, although efforts are made to reduce bias through expert scoring and AHP, the screening and weighting of evaluation indicators still involve a certain degree of subjectivity. Secondly, the assessment is based on static datasets, while ecological sensitivity is dynamic and is influenced by climate change, policy changes, and the evolution of human activities. Future research should integrate time monitoring, scenario simulation and participatory stakeholder participation to enhance the robustness and applicability of sensitivity assessment.
5. Conclusions
This study evaluated the ecological sensitivity of Longyuwan National Forest Park and proposed functional zoning strategies to support the balance between ecological conservation and sustainable utilization. By constructing a hierarchical evaluation system with five subsystems and twelve indicators, the results highlighted land-use type, elevation, and water-body distribution as the most influential factors affecting ecological sensitivity. The spatial analysis revealed a clear gradient pattern, with the southern mountainous zones showing higher sensitivity than the northern areas. Overall, the park is dominated by moderate sensitivity (73.53%), with high and extremely high sensitivity zones concentrated in ecologically fragile areas.
Based on the comprehensive sensitivity assessment, the park was divided into four functional zones: ecological conservation, core landscape, general recreation, and management and service. The ecological conservation zone, covering more than half of the park’s total area, was identified as the most critical for biodiversity protection and ecological stability. The core landscape and general recreation zones were delineated to balance scenic value and public use, while the management and service zone was limited to areas of low ecological sensitivity to minimize ecological disturbance.
The functional zoning provides a scientific basis for management strategies that emphasize biodiversity conservation, ecosystem restoration, and rational utilization of forest resources. Strengthening ecological monitoring, optimizing management mechanisms, and promoting sustainable tourism are essential to maintaining the ecological integrity of the park. These findings demonstrate the applicability of integrating ecological sensitivity assessment with spatial planning for forest–urban interface regions, offering valuable insights for similar forest parks under increasing urbanization pressures.
Author Contributions
Conceptualization, J.H. and Y.Z.; methodology, J.H., Y.Z., W.Z. and Q.Y.; validation, R.Z., J.L. and S.Y.; formal analysis, Y.Z., W.Z. and Q.Y.; investigation, J.H., R.Z. and J.L.; resources, T.Z. and Z.L.; data curation, S.Y., W.Z. and Q.Y.; writing—original draft preparation, J.H. and Y.Z.; writing—review and editing, all authors; visualization, R.Z., W.Z. and S.Y.; supervision, T.Z. and Z.L.; project administration, Z.L.; funding acquisition, T.Z. All authors have read and agreed to the published version of the manuscript.
Funding
This research was funded by the Postgraduate Education Reform and Quality Improvement Project of Henan Province (YJS2024AL062/YJS2025AL63); the Henan Agricultural University’s “Millions of Sciences and Education Service Action” Fund Project (2024SFBQW30); Zhejiang Shuren University Basic Scientific Research Special Funds (2025XZ034); Key Specialty Project of Ordinary Colleges and Universities in Shaoxing City, Zhejiang Province, “Landscape Architecture” (SXSZY202412).
Data Availability Statement
The datasets generated during and/or analyzed during the current study are available from the corresponding author upon reasonable request.
Acknowledgments
We thank all our laboratory members for their help with this experiment. Our gratitude extends to our lab team members, who assisted with this endeavor.
Conflicts of Interest
The authors declare no conflicts of interest.
References
- Guo, E.; Liang, J.; Yuan, Y.; Xie, P.; Hou, H.; Yang, X.; Dong, X. Spatiotemporal Evolution and Driving Mechanisms of Forest Tourism in Henan, Central China. Forests 2025, 16, 483. [Google Scholar] [CrossRef]
- An, R.; Chen, Q.; Huang, X.J. China Forest Resources Tourism Utilization Efficiency Research: An example of forest parks in 30 provinces. For. Econ. 2023, 45, 45–61. [Google Scholar]
- Ning, Y.L.; Li, Y.; Ma, Y.B. Challenges and countermeasures for the development of China’s forestry industry. World For. Res. 2021, 34, 67–71. [Google Scholar]
- Tian, M. Research on the Space Structure of Tourism Eco-Sensitiveness in Shandong Province. J. Southwest Norm. Univ. (Nat. Sci. Ed.) 2020, 45, 100–106. [Google Scholar]
- Dudek, T.; Zięba, W. Wybrane aspekty zrównoważonego użytkowania lasu w nawiązaniu do programu zrównoważonego rozwoju—Przykład Polski. Sylwan 2018, 162, 469–478. [Google Scholar]
- McHarg, I.L. Design with Nature; John Wiley & Sons Inc.: Hoboken, NJ, USA, 1995. [Google Scholar]
- Kosovac, A.; Shermon, A.; O’Donnell, E.; Horne, A.; Mesikämmen, E. Water courses and discourses: A media content analysis of environmental water reporting in Australia. Environ. Sci. Policy 2024, 154, 103703. [Google Scholar] [CrossRef]
- Lozano, I. Storminess and environmentally sensitive Atlantic coastal areas of the European Union. Elsevier Oceanogr. Ser. 2002, 43, 781–791. [Google Scholar]
- Biek, R.; Funk, C.W.; Maxell, A.B.; Mills, L.S. What is Missing in Amphibian Decline Research: Insights from Ecological Sensitivity Analysis. Conserv. Biol. 2002, 16, 728–734. [Google Scholar] [CrossRef]
- Nouri, J.; Danehkar, A.; Sharifipour, R. Ecological sensitivity of the Persian Gulf coastal region (Case study: Bushehr province). J. Appl. Sci. Environ. Manag. 2010, 11, 55139. [Google Scholar] [CrossRef][Green Version]
- Rossi, P.; Pecci, A.; Amadio, V.; Rossi, O.; Soliani, L. Coupling indicators of ecological value and ecological sensitivity with indicators of demographic pressure in the demarcation of new areas to be protected: The case of the Oltrepò Pavese and the Ligurian-Emilian Apennine area (Italy). Landsc. Urban Plan. 2007, 85, 12–26. [Google Scholar] [CrossRef]
- Hale, B.W. Mapping potential environmental impacts from tourists using data from social media: A case study in the Westfjords of Iceland. Environ. Manag. 2018, 62, 446–457. [Google Scholar] [CrossRef] [PubMed]
- Raj, A.; Sharma, L.K. Spatial E-PSR modelling for ecological sensitivity assessment for arid rangeland resilience and management. Ecol. Model. 2023, 478, 110283. [Google Scholar] [CrossRef]
- Sobhani, P.; Esmaeilzadeh, H.; Wolf, I.D.; Deljouei, A.; Marcu, M.V.; Sadeghi, S.M.M. Evaluating the ecological security of ecotourism in protected area based on the DPSIR model. Ecol. Indic. 2023, 155, 110957. [Google Scholar] [CrossRef]
- Zijp, M.C.; Huijbregts, M.A.; Schipper, A.M.; Mulder, C.; Posthuma, L. Identification and ranking of environmental threats with ecosystem vulnerability distributions. Sci. Rep. 2017, 7, 9298. [Google Scholar] [CrossRef]
- Ouyang, Z.Y.; Wang, X.K.; Miao, H. Ecological environmental sensitivity in China and its regional differentiation patterns. Acta Ecol. Sin. 2000, 20, 9–12. [Google Scholar]
- Corominas, L.; Neumann, B.M. Ecosystem-based management of a Mediterranean urban wastewater system: A sensitivity analysis of the operational degrees of freedom. J. Environ. Manag. 2014, 143, 80–87. [Google Scholar] [CrossRef] [PubMed]
- Liang, C.; Li, X. Luxate Ecological Sensitivity Evaluation in Yellow River Delta National Natural Reserve. CLEAN—Soil Air Water 2012, 40, 1197–1207. [Google Scholar] [CrossRef]
- Zhang, B. Research on Ecological Conservation and Utilization of Xue Feng Mountain National Forest Park Based on Ecological Sensitivity Assessment. Master’s Dissertation, Central South University of Forestry Science and Technology, Changsha, China, 2021. [Google Scholar] [CrossRef]
- Wang, J.Y. The ecological security pattern of Zhadan County based on ecological sensitivity. Henan Sci. Technol. 2023, 42, 105–109. [Google Scholar]
- Kark, S.; van Rensburg, B.J. Ecotones: Marginal or central areas of transition? Isr. J. Ecol. Evol. 2006, 52, 29–53. [Google Scholar] [CrossRef]
- Dudek, T. Recreational potential as an indicator of accessibility control in protected mountain forest areas. J. Mt. Sci. 2017, 14, 1419–1427. [Google Scholar] [CrossRef]
- Cui, S.; Li, F.; Huang, J.; Yu, Y. Review of sensitivity research on the context of global change. Adv. Earth Sci. 2009, 24, 1033–1041. [Google Scholar]
- An, Y.; Xu, X.B.; Li, J.Y.; Yang, Z.Z.; Ren, C. A review of research progress in ecological sensitivity assessment. Environ. Ecol. 2024, 6, 38–44+65. [Google Scholar]
- Li, L.; Chen, X.; Yang, J. Diversity and Conservation of Amphibians in Longyuwan National Forest Park. J. Henan Norm. Univ. (Nat. Sci. Ed.) 2009, 37, 120–122. [Google Scholar]
- Wang, S. Study on the Planning of Forest Trails Based on the Concept of Forest Wellness. Master’s Dissertation, Fujian Agriculture and Forestry University, Fuzhou, China, 2020. [Google Scholar]
- Lin, X. Introduction to Longyuwan National Forest Park. Henan For. 1999, 1, 36. [Google Scholar]
- Yu, Y.; Song, F.; Zhang, S. Quantitative Analysis of Spatiotemporal Changes of NDVI and Its Driving Factors in Henan Province from 2000 to 2020. Ecol. Environ. Sci. 2022, 31, 1939–1950. [Google Scholar]
- Yin, D.-H. Research on Raster Data Management Based on the Ingres Relational Database. Ph.D. Dissertation, National University of Defense Technology, Changsha, China, 2008. [Google Scholar]
- GB/T 18005-1999; Quality Grading for Scenic Resources of Forest Parks. Standards Press of China: Beijing, China, 1999.
- Wang, H.; Wang, L.; Wei, B. Ecological sensitivity of characteristic towns based on GIS: A case study of Yingqiu Town, Shandong. J. Ocean. Univ. China (Nat. Sci. Ed.) 2019, 49, 100–107. [Google Scholar]
- Wang, H. Larm. Application of Buffer Analysis Method for Accident Multi-Emergence Point Identification. Highw. Eng. 2016, 41, 103–107. [Google Scholar]
- Liu, Q. Study on Forest Park Planning Based on GIS Spatial Analysis. Ph.D. Dissertation, Central South University of Forestry and Technology, Changsha, China, 2020. [Google Scholar]
- Yan, J.; Zhang, Z.H.; Zhou, Q. Based on the planning and construction suitability study of GIS superposition analysis—Taking the Baiyun Mountain Health and Pension Community as an example. For. Sci. Technol. Dev. 2014, 28, 131–135. [Google Scholar]
- Lu, Z. Research on Ecological Restoration Planning of Villages and Lands and Spaces Based on Ecological Sensitivity. Master’s Dissertation, University of Guangzhou, Guangzhou, China, 2020. [Google Scholar] [CrossRef]
- Shi, Y.J. Analysis of Landscape Pattern and Ecological Planning of Baiyangdian Wetland in Xiong’an. Master’s Dissertation, Hebei Agricultural University, Baoding, China, 2020. [Google Scholar]
- Başkent, E.Z.; Balci, H. A Priory Allocation of Ecosystem Services to Forest Stands in a Forest Management Context Considering Scientific Suitability, Stakeholder Engagement and Sustainability Concept with Multi-Criteria Decision Analysis (MCDA) Technique: A Case Study in Turkey. J. Environ. Manag. 2024, 369, 122230. [Google Scholar] [CrossRef] [PubMed]
- Zhang, X.L.; Yu, W.B.; Cai, H.S. Review of the study of regional ecological vulnerability assessment methodologies. Ecol. News 2018, 38, 5970–5981. [Google Scholar]
- QX/T 380-2017; Classification Standard of Negative Air Ion Concentration. China Meteorological Press: Beijing, China, 2017.
- GB 3095-2012; Ambient Air Quality Standards. China Environmental Science Press: Beijing, China, 2012.
- LY/T 2005-2012; National Forest Park Master Plan Specification. China Standard Press: Beijing, China, 2012.
- Xiong, X.Y.; Li, X.M.; He, J. Research on the Protection and Utilization of Forest Tourism Resources in Henan Province. Heilongjiang Agric. Sci. 2021, 4, 119–124. [Google Scholar]
- Yu, Y.H.; Li, J.Y. The ecological picture of the Chinese-style modernization road in harmony between man and nature. Contemp. World Soc. 2022, 5, 42–48. [Google Scholar]
- Fan, B.M.; Li, X.H.; Du, J. 100 Years of Forest Policy Review and Prospects of the Chinese Communist Party. For. Econ. 2021, 43, 5–23. [Google Scholar]
- Wu, H.J.; Dan, Q.X.; Liu, S.H. Forest health: Concept connotation, product type and development path. J. Ecol. 2018, 37, 2159–2169. [Google Scholar]
- Liu, Z.Y. The Integration and Development of Cultural Tourism: Theory, Practice and Future Direction. People’s Forum. Acad. Front. 2019, 16, 92–97. [Google Scholar]
- Wu, J.; Chen, J.C. High-quality development of the economy and agriculture under the forest: The logic of coupling and the path of realization. J. Northwest Univ. Agric. For. (Soc. Sci. Ed.) 2022, 22, 153–160. [Google Scholar] [CrossRef]
- Wen, W.; Xie, P.; Cao, W. Research on Ecological Construction Technology Measures for Forest Park Boardwalks. Forum Res. Innov. Manag. 2025, 3, 5. [Google Scholar]
- Hu, H.J.; Xie, G.Y.; Zhang, L.S. Based on the evaluation of ecological sensitivity of the forest park functional zoning study-Jiangxi Poyang hukou National Forest Park as an example. Green Tech. 2023, 25, 39–45. [Google Scholar]
- Christou, E.D.; Dailianis, T.; Chatzinikolaou, E.; Karachle, P.K.; Damalas, D.; Tsagarakis, K.; Strogyloudi, E.; Karris, G.; Zervoudaki, S.; Giannakourou, A.; et al. Climate change in the “vulnerable” Eastern Mediterranean and adjacent areas: A literature review of ecological impacts and threats. Mar. Environ. Res. 2025, 211, 107390. [Google Scholar] [CrossRef]
Disclaimer/Publisher’s Note: The statements, opinions and data contained in all publications are solely those of the individual author(s) and contributor(s) and not of MDPI and/or the editor(s). MDPI and/or the editor(s) disclaim responsibility for any injury to people or property resulting from any ideas, methods, instructions or products referred to in the content. |
© 2025 by the authors. Licensee MDPI, Basel, Switzerland. This article is an open access article distributed under the terms and conditions of the Creative Commons Attribution (CC BY) license (https://creativecommons.org/licenses/by/4.0/).