1. Introduction
The climate crisis, driven by massive greenhouse gas emissions, is widely recognized as the most menacing global environmental challenge [
1]. Among these emissions, carbon dioxide (CO
2) stands as the primary driver of global warming. Extensive studies indicate that urban areas contribute more than 70% of global carbon emissions [
2], highlighting cities as the predominant source of CO
2 emissions. Consequently, curbing urban carbon emissions while enhancing carbon sinks within urban areas has emerged as a critical strategy to alleviate the impacts of climate change [
3].
Urban blue–green spaces denote the composite of green and blue areas preserved or newly created throughout urban development. Drawing on previous studies on the ecological benefits of blue–green spaces, at the macro scale, these spaces encompass expansive ecological zones, including aquatic environments and vegetated areas such as forests, coastal zones, farmlands, parks, and gardens. At the micro scale, they refer to vegetated open spaces ranging from urban parks and courtyards to urban forests and farms [
4,
5,
6,
7]. As the ecological backbone of cities, urban blue–green spaces deliver essential ecological service functions [
8].
Current research on the ecological functions of blue–green spaces primarily focuses on aspects such as stormwater management [
9], carbon reduction and sequestration [
10], cooling effects [
11], and biodiversity enhancement [
12]. Most studies begin by analyzing the spatial arrangement of blue–green spaces, exploring their impact mechanisms and synergistic effects, and then proposing corresponding planning strategies [
13]. However, the research progress and depth differ significantly across various dimensions of ecological benefits. Notably, while the cool island effect and stormwater management have been extensively studied, carbon sequestration from a system-integrated blue–green perspective remains underexplored.
Thus, enhancing the carbon sink efficiency of blue–green spaces in high-density urban environments has emerged as a critical research agenda. Previous studies have predominantly explored carbon sequestration in blue and green spaces in isolation. Urban green spaces are widely recognized as key contributors to carbon sinks [
4], with sequestration capacity influenced by factors such as spatial extent, vegetation density, and species composition [
14]. Studies focusing on plant community morphology and spatial configuration [
15] have employed climate simulation models and field measurements to demonstrate that indicators such as average diameter at breast height (DBH) and canopy width significantly affect carbon sequestration. Owing to their role as primary carbon sequestration agents, studies on urban green spaces have reached a relatively advanced stage of maturity. In contrast, research on carbon sequestration in blue spaces has been largely confined to large-scale ecological systems such as river basins, coastal zones, and wetlands [
16,
17,
18,
19,
20], with most investigations centered on carbon storage dynamics [
21,
22].
As complex ecosystems, urban blue–green spaces demonstrate synergistic effects in delivering ecological benefits through interactions between water bodies and green spaces, outperforming single-function blue or green spaces [
23]. Studies have revealed that coupling blue and green spaces—both in scale and spatial distribution—generates notable synergistic benefits. For instance, scholars have identified that green spaces and water bodies mutually reinforce their cooling and humidifying effects on the urban microclimate, with their combined influence on ambient temperature reduction and humidity increase being significantly greater than the sum of their individual contributions. For example, Kim et al. analyzed the cooling efficacy of green space configuration patterns while accounting for the interactive effects between waterbody greening and urban building density [
24].
Additionally, the synergistic functions of blue–green spaces effectively address urban flood and water scarcity challenges by optimizing rainwater management through retention, infiltration, evaporation, and recycling mechanisms. Techniques such as rainwater harvesting, green roofs, permeable pavements, and rain gardens are applied to regulate urban surface runoff [
25]. Furthermore, blue–green spaces serve as critical habitats for enhancing urban biodiversity [
26]. Guo et al. documented avian preferences for forest, shrub, grassland, and aquatic ecosystems in relation to the structural characteristics of urban blue–green spaces [
27].
In the domain of carbon sequestration, the overall efficiency of blue–green spaces and the synergistic interactions between water and green elements have also garnered growing attention [
28]. Existing research in this area primarily falls into two categories: one type involves identifying the spatial patterns of blue–green spaces at the urban scale to explore their correlations with carbon sequestration benefits, followed by optimizing the configuration of water–green spaces to enhance the carbon sequestration efficiency of blue–green systems [
29,
30]. The other type focuses on medium and small-scale urban contexts, combining field measurements and simulations to assess how spatial attributes and vegetation structures influence sequestration capacity [
31]. However, existing studies still have certain limitations. At the urban scale, most research employs landscape metrics (e.g., shape index, SHAPE; contagion index, CONTAG) to describe the relationship between the morphological complexity of blue–green spaces and carbon sequestration efficiency. Yet, the specific ways in which water–green spatial forms affect sequestration benefits are often only qualitatively assessed, making it difficult to uncover their synergistic mechanisms. At the medium and small scales, research has mainly focused on vegetation community characteristics, such as planting density and mean diameter at breast height (DBH), in relation to carbon sequestration efficiency, while the spatial coupling between green areas and water bodies has received relatively little attention.
As a common and typical form of urban blue–green spaces, waterfront green spaces represent areas with pronounced water–green synergistic effects [
32]. Specifically, water bodies possess high specific heat capacity, low thermal conductivity, and strong water evaporation capabilities, enabling them to store more heat, reduce sensible heat exchange, and enhance latent heat exchange. Moreover, temperature gradients between water bodies and landmasses generate lake–land breeze circulations, increasing average wind speeds in waterfront areas [
33]. These hydrometeorological features can improve the thermal and moisture conditions of adjacent environments, promote plant vitality [
34,
35], and thereby enhance the photosynthetic activity and carbon sequestration performance of nearby green spaces. Existing research has identified that geometric indicators such as water–green area ratios [
36] and spatial distances [
37] influence water–green synergistic effects, yet the mechanisms underlying how water–green spatial relationships drive synergistic carbon sequestration remain underexplored.
Therefore, to clarify the synergistic mechanisms of water–green spaces at medium and small scales and to investigate how their spatial relationships influence the carbon sequestration performance of urban green areas, this paper takes the Qinhuai New River in Nanjing as a case study, selecting green spaces within 120 m on both sides of the river. The research aims to (1) assess whether proximity to water bodies enhances the carbon sequestration efficiency of green spaces by comparing waterfront and non-waterfront zones; (2) identify key spatial factors influencing this relationship; and (3) propose design strategies for optimizing waterfront green space configurations to strengthen urban carbon sinks. This study aims to provide data support and optimization pathways for the renewal of urban waterfront green spaces and planning and design targeting high carbon sinks.
2. Materials and Methods
2.1. Research Framework
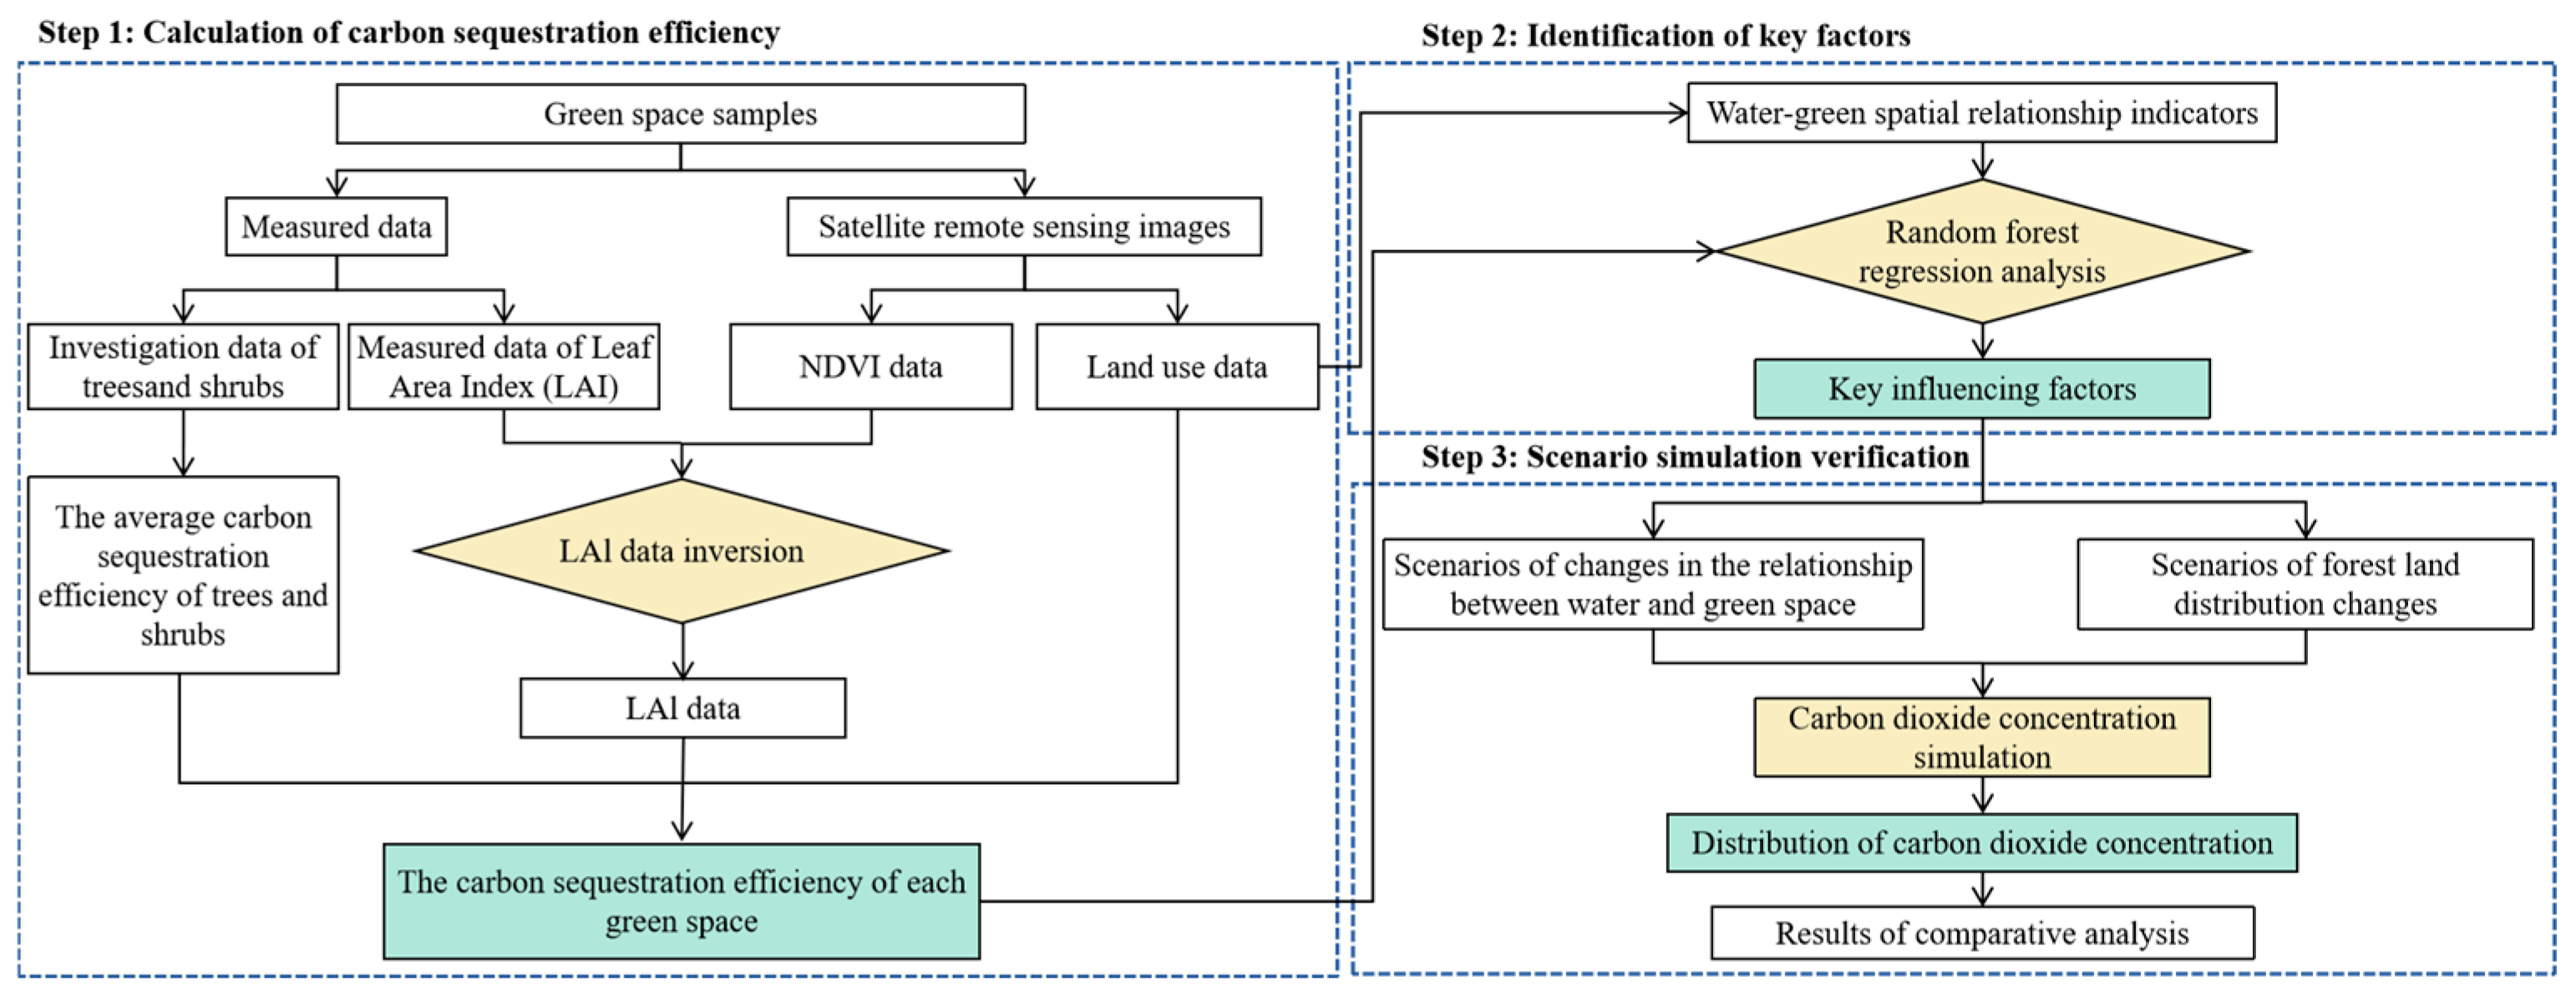
The research methodology primarily consists of three components: carbon sequestration efficiency calculation, key factor identification, and scenario simulation validation. First, the carbon sequestration efficiency of green spaces is estimated by combining Leaf Area Index (LAI) data with the mean carbon sequestration rate per unit leaf area for typical tree and shrub species. Second, a random forest regression model is employed to identify the key variables influencing the carbon sequestration efficiency of waterfront green spaces. Finally, multiple scenario models are constructed to simulate the CO
2 concentration reduction effects of green spaces, thereby validating the roles of the identified influencing factors (
Figure 1).
2.2. Study Area
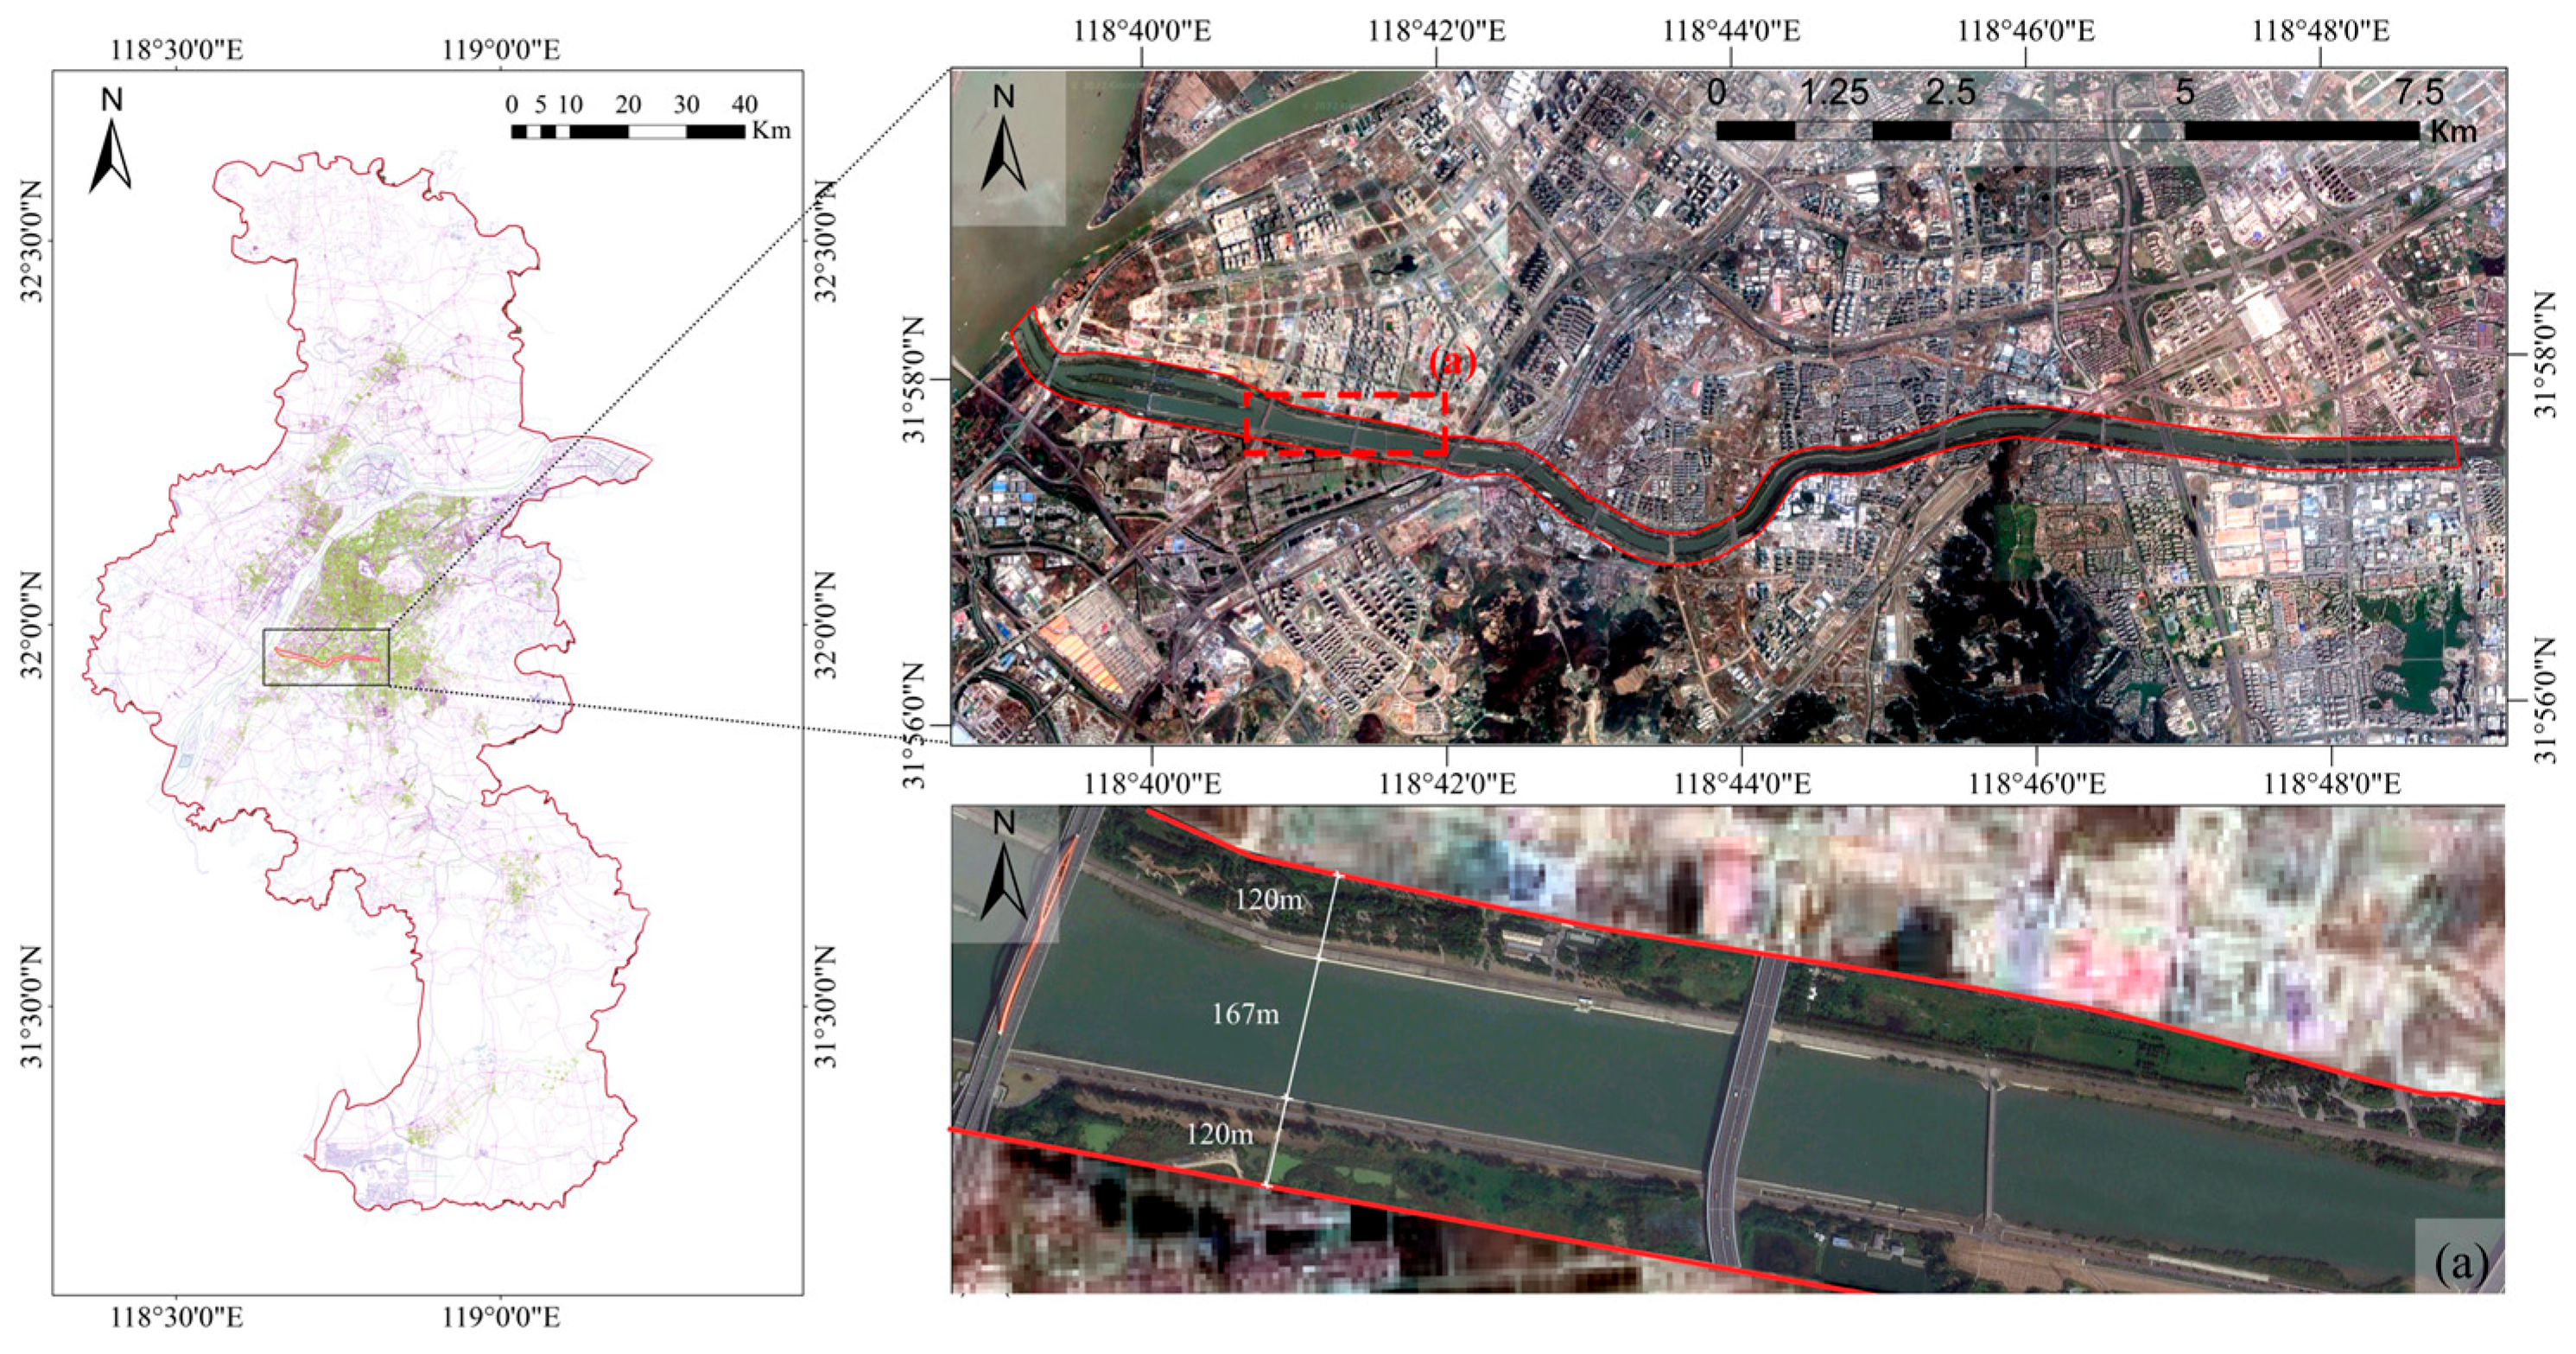
Nanjing is situated in eastern China, within the central region of the lower Yangtze River. Its geographical coordinates range from 31°14′–32°37′ N to 118°22′–119°14′ E, and it experiences a humid subtropical climate characterized by distinct seasonal variation and abundant precipitation. The average annual precipitation is 1106.5 mm, and the mean annual temperature is 15.4 °C. Water bodies account for over 11% of Nanjing’s total land area, encompassing 120 rivers and lakes of varying scales, including the Qinhuai River and Jinchuan River. The Qinhuai New River, an artificial channel excavated in 1980, flows through Jiangning District and Yuhuatai District. It stretches 16.88 km, originating from Heding Bridge in Jiangning District and discharging into the Yangtze River at Dashengguan. The river serves multifunctional purposes, including flood control, irrigation, and navigation, across the two districts. The main reason for selecting this area as the research object is that this river section was once planned and designed as a waterfront greenway, with relatively well-preserved waterfront green spaces on both sides and minimal hard paving near the riverbank, providing favorable conditions for studying the spatial morphology of waterfront green spaces. This study employs the Qinhuai New River as a case study, focusing on the segment spanning from Heding Bridge to Tianhou Bridge, with a total length of 16,458.43 m, as well as the areas within 120 m of both riverbanks (
Figure 2). Green space boundaries within the study area were delineated using roads as demarcation lines. Considering that research on small- and medium-scale green spaces (with an area below 10 hm
2) is less influenced by scale and yields more consistent results [
38], a total of 184 green space plots were selected. These green spaces were classified into two categories—waterfront and non-waterfront—based on whether they directly adjoined the water body, resulting in 39 waterfront and 145 non-waterfront plots.
2.3. Data Collection and Processing
The data employed in this study consist of two parts: remote sensing and field measurements. The remote sensing data are Jilin satellite images with a spatial resolution of 0.75 m acquired on 13 October 2023, from the Jiangsu Provincial Satellite Remote Sensing Comprehensive Service Platform for Natural Resources “
http://wxzx.jsgs.com.cn:8081/web/home (accessed on 20 October 2023)”. After processing, these data yielded Normalized Difference Vegetation Index (NDVI) and land-use data. The NDVI is calculated using the following formula:
In Equation (1), and correspond to the near-infrared and red spectral channels, respectively.
The field measurement component involves Leaf Area Index (LAI) data and survey data of trees and shrubs. Given that the annual carbon sink contribution of low vegetation such as grasslands is relatively minimal [
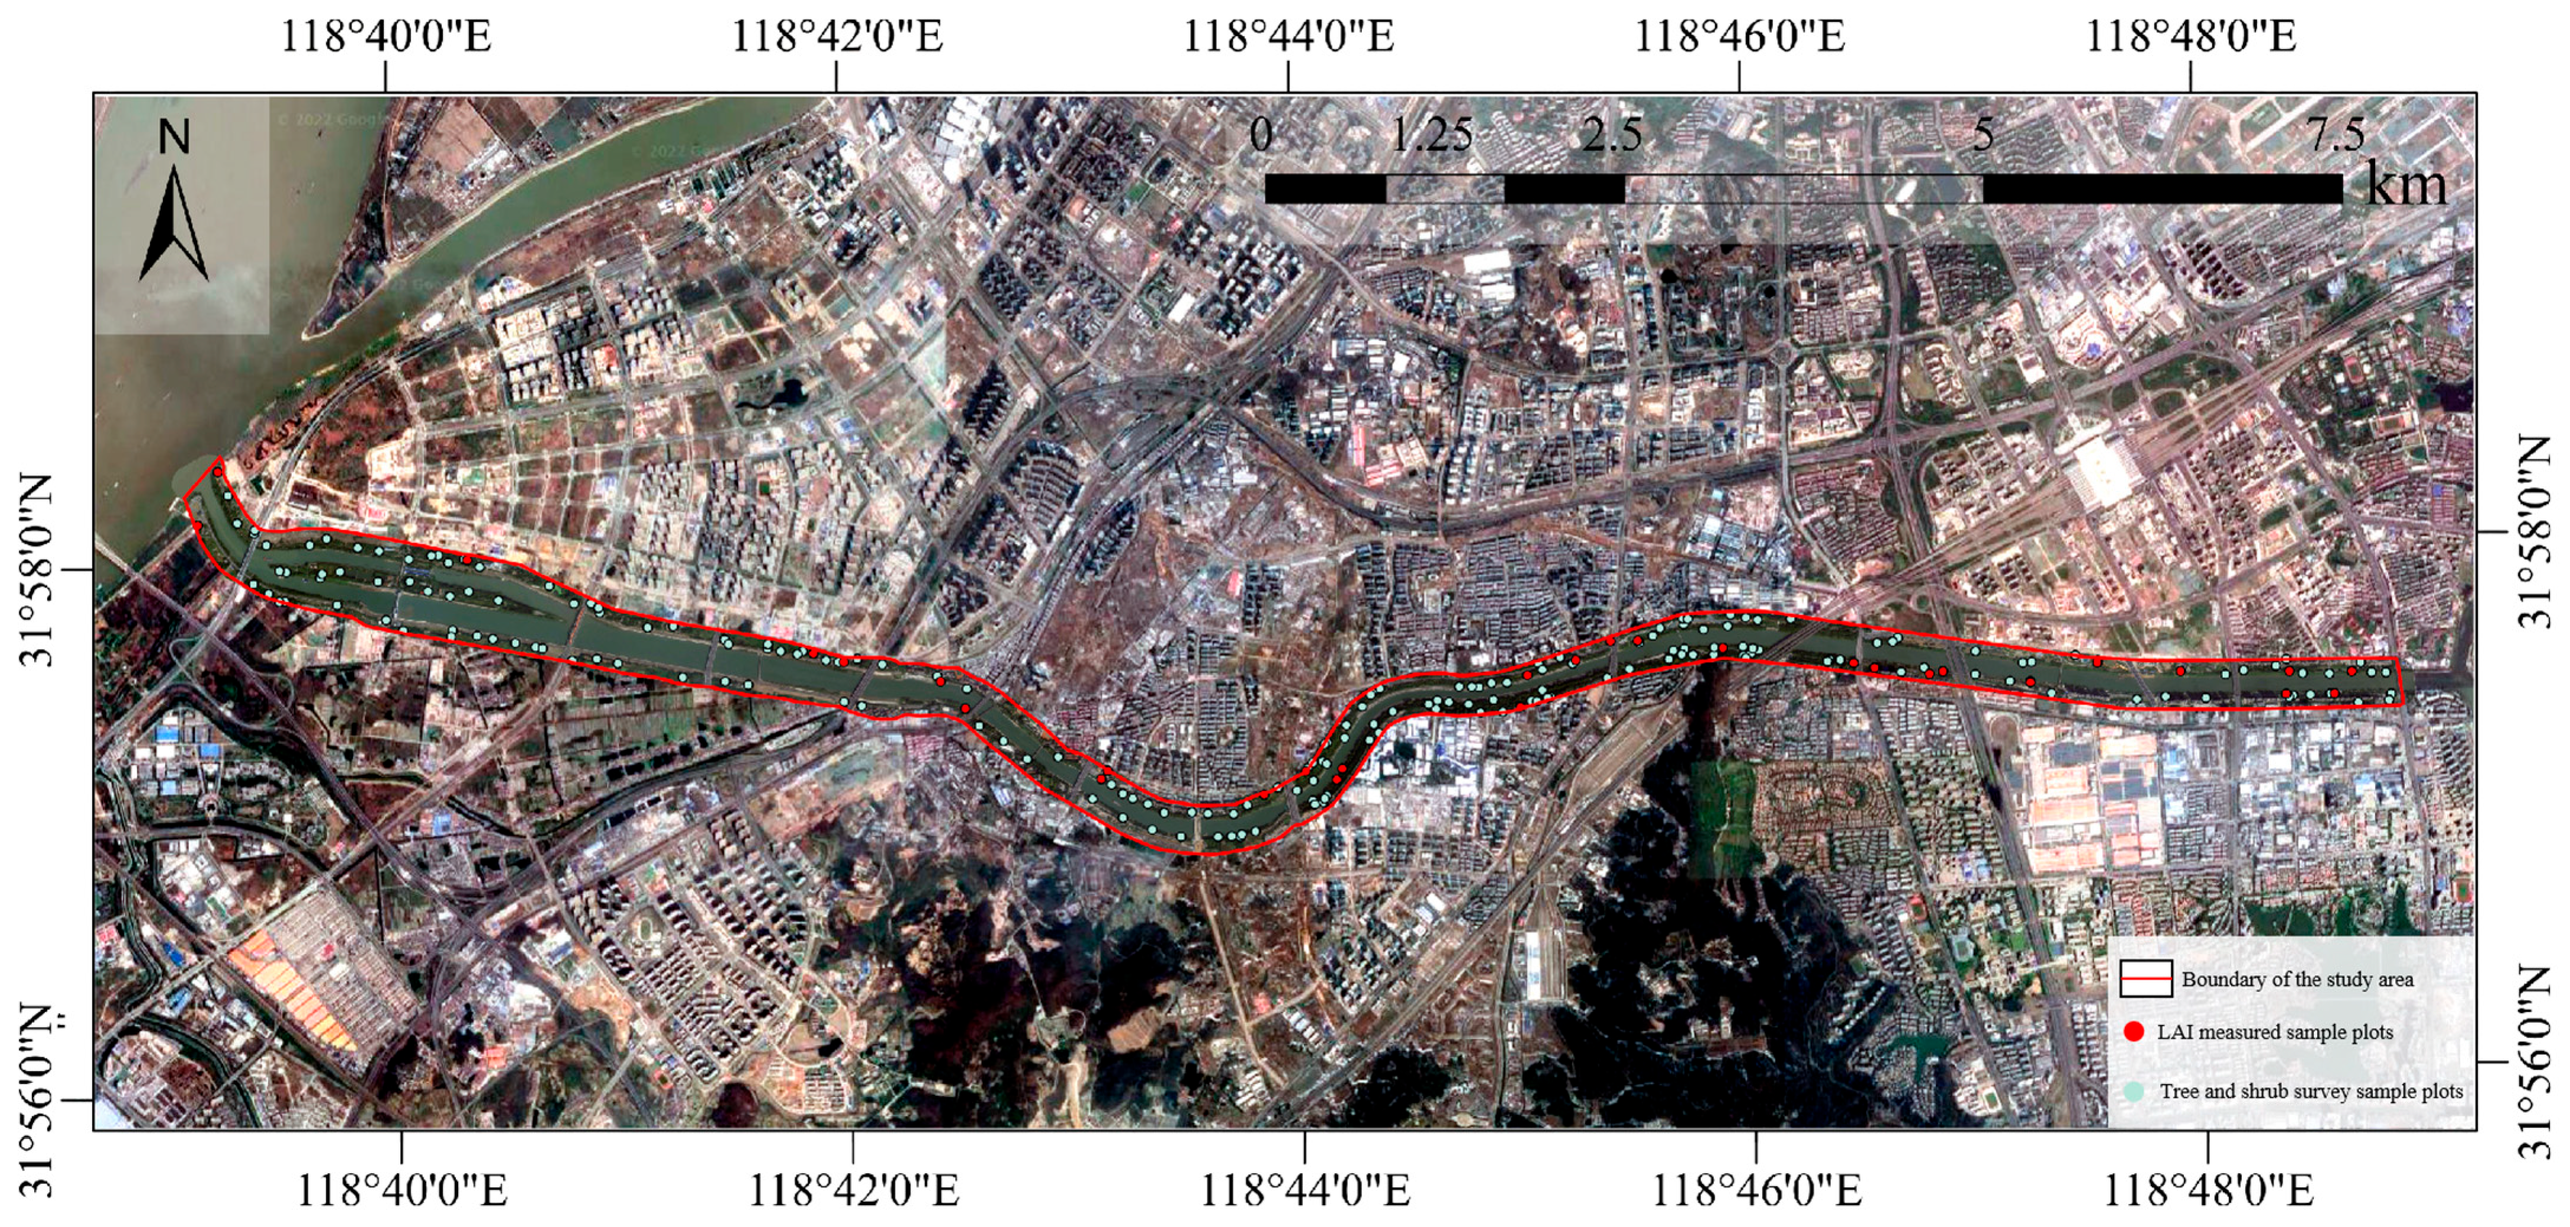
39], this study focuses primarily on calculating carbon sequestration by trees and shrubs. First, the forested areas within green spaces were determined based on land-use data, and random points were selected as sampling sites for LAI measurement and tree and shrub surveys (
Figure 3). Each sampling point was used as the geometric center of a 10 m × 10 m quadrat. A total of 30 quadrats were set for LAI measurement [
40], while tree/shrub surveys followed a standard of 100 m
2 quadrats per hectare of forest land [
41], resulting in 200 quadrats in total.
Both field campaigns were conducted in September and October 2023. For LAI measurement, a plant canopy analyzer (WinSCANOPY, Version 2016a, Regent Instruments Inc., Quebec City, QC, Canada) was used to take four measurements per quadrat, with the average value taken as the quadrat’s LAI. In the tree and shrub surveys, species and counts of all individuals within each quadrat were recorded.
2.4. Calculation of Carbon Sequestration Efficiency
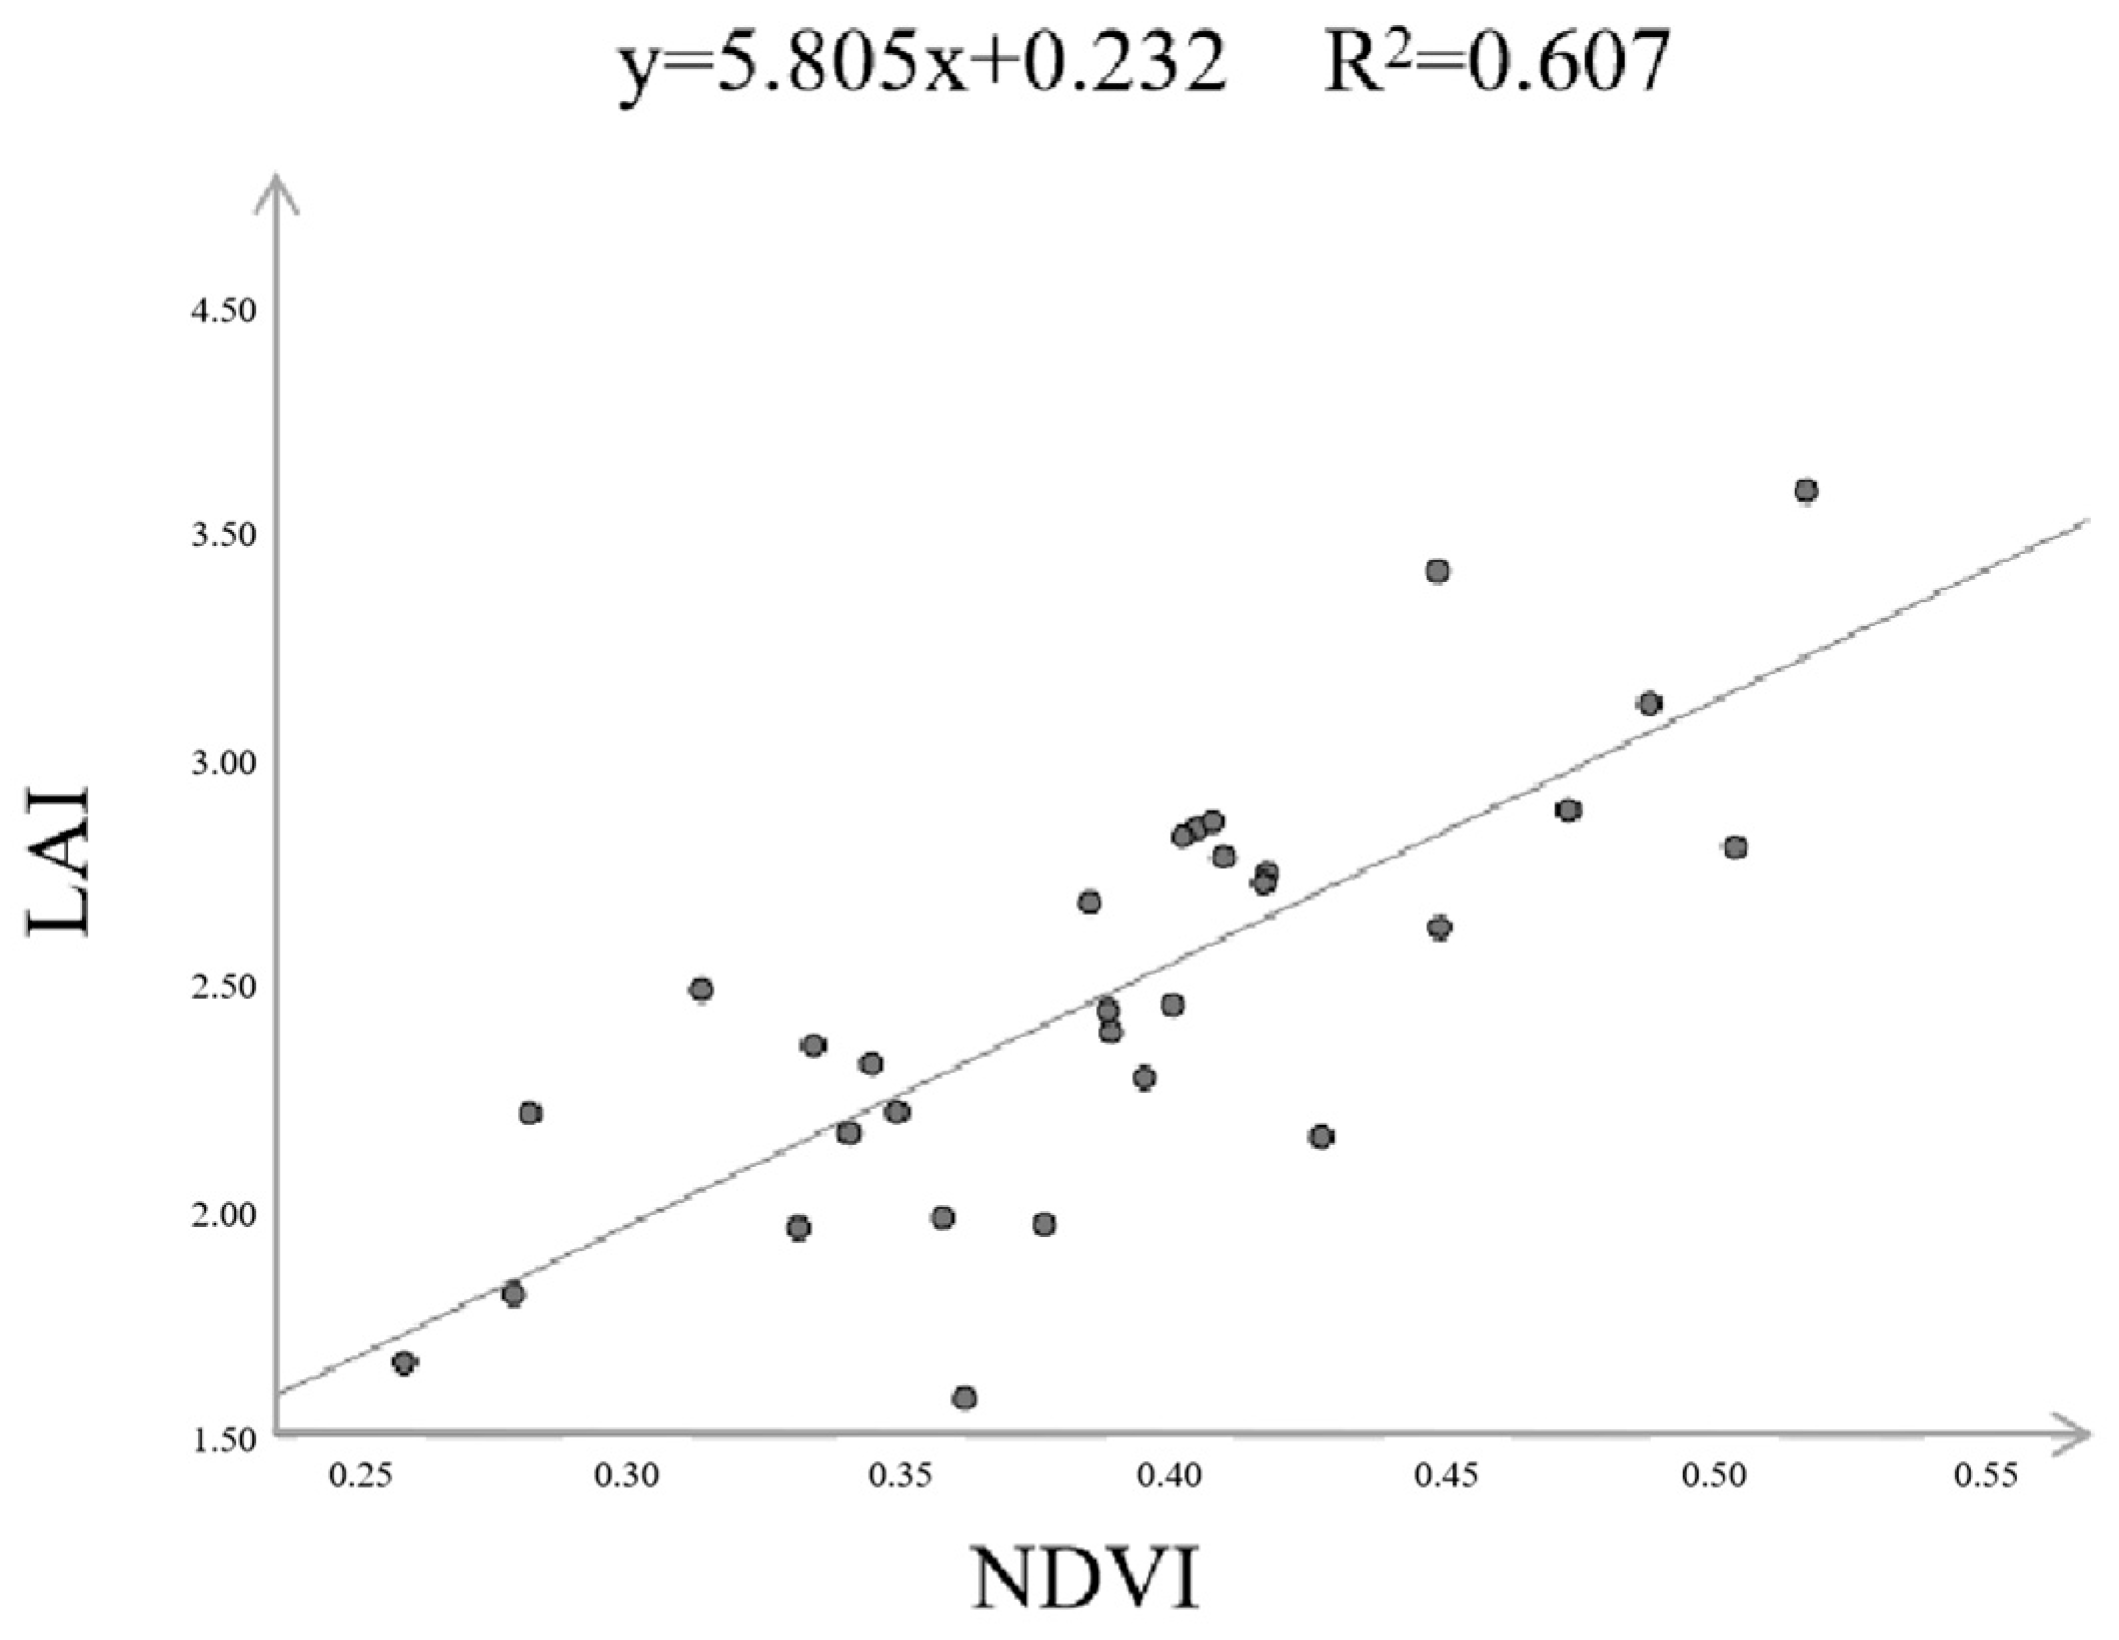
Using field measurements combined with remote sensing imagery, the carbon sequestration efficiency of green spaces in the study area was calculated. A Pearson correlation analysis was performed in SPSS 23.0 to establish a regression equation between LAI values obtained from field surveys and NDVI values derived from remote sensing imagery, as shown in
Figure 4 [
42,
43]. The model was statistically significant (F = 43.177,
p < 0.001), with a root mean square error (RMSE) of 0.304. After retrieving the LAI data for the study area, LAI values were extracted for each green space according to spatial boundaries. Based on the tree and shrub survey data, species with a frequency greater than 6.2% were identified as common types [
44]. The carbon sequestration parameters applied in this study were derived from empirical studies conducted in regions with climatic conditions similar to those of the study area [
45], in which reported plant carbon assimilation was conceptually closer to gross primary productivity (GPP). Accordingly, the average carbon sequestration per unit leaf area of these common plant types was used to represent their overall carbon sequestration potential, rather than the exact net amount. The calculated average carbon sequestration efficiency per unit leaf area was 9.848 g·m
−2·d
−1 for trees and 13.675 g·m
−2·d
−1 for shrubs.
The carbon sequestration efficiency of green spaces (g·m
−2·d
−1) is calculated using the following formula [
46]:
In Equation (2), C represents the carbon sequestration efficiency of the green space (g·m−2·d−1); denotes the LAI value of trees or shrubs in the i-th green space; c refers to the average carbon sequestration efficiency per unit leaf area of common tree or shrub species (g·m−2·d−1); indicates the area of trees or shrubs within the i-th green space; and i represents different green spaces.
2.5. Key Factor Identification
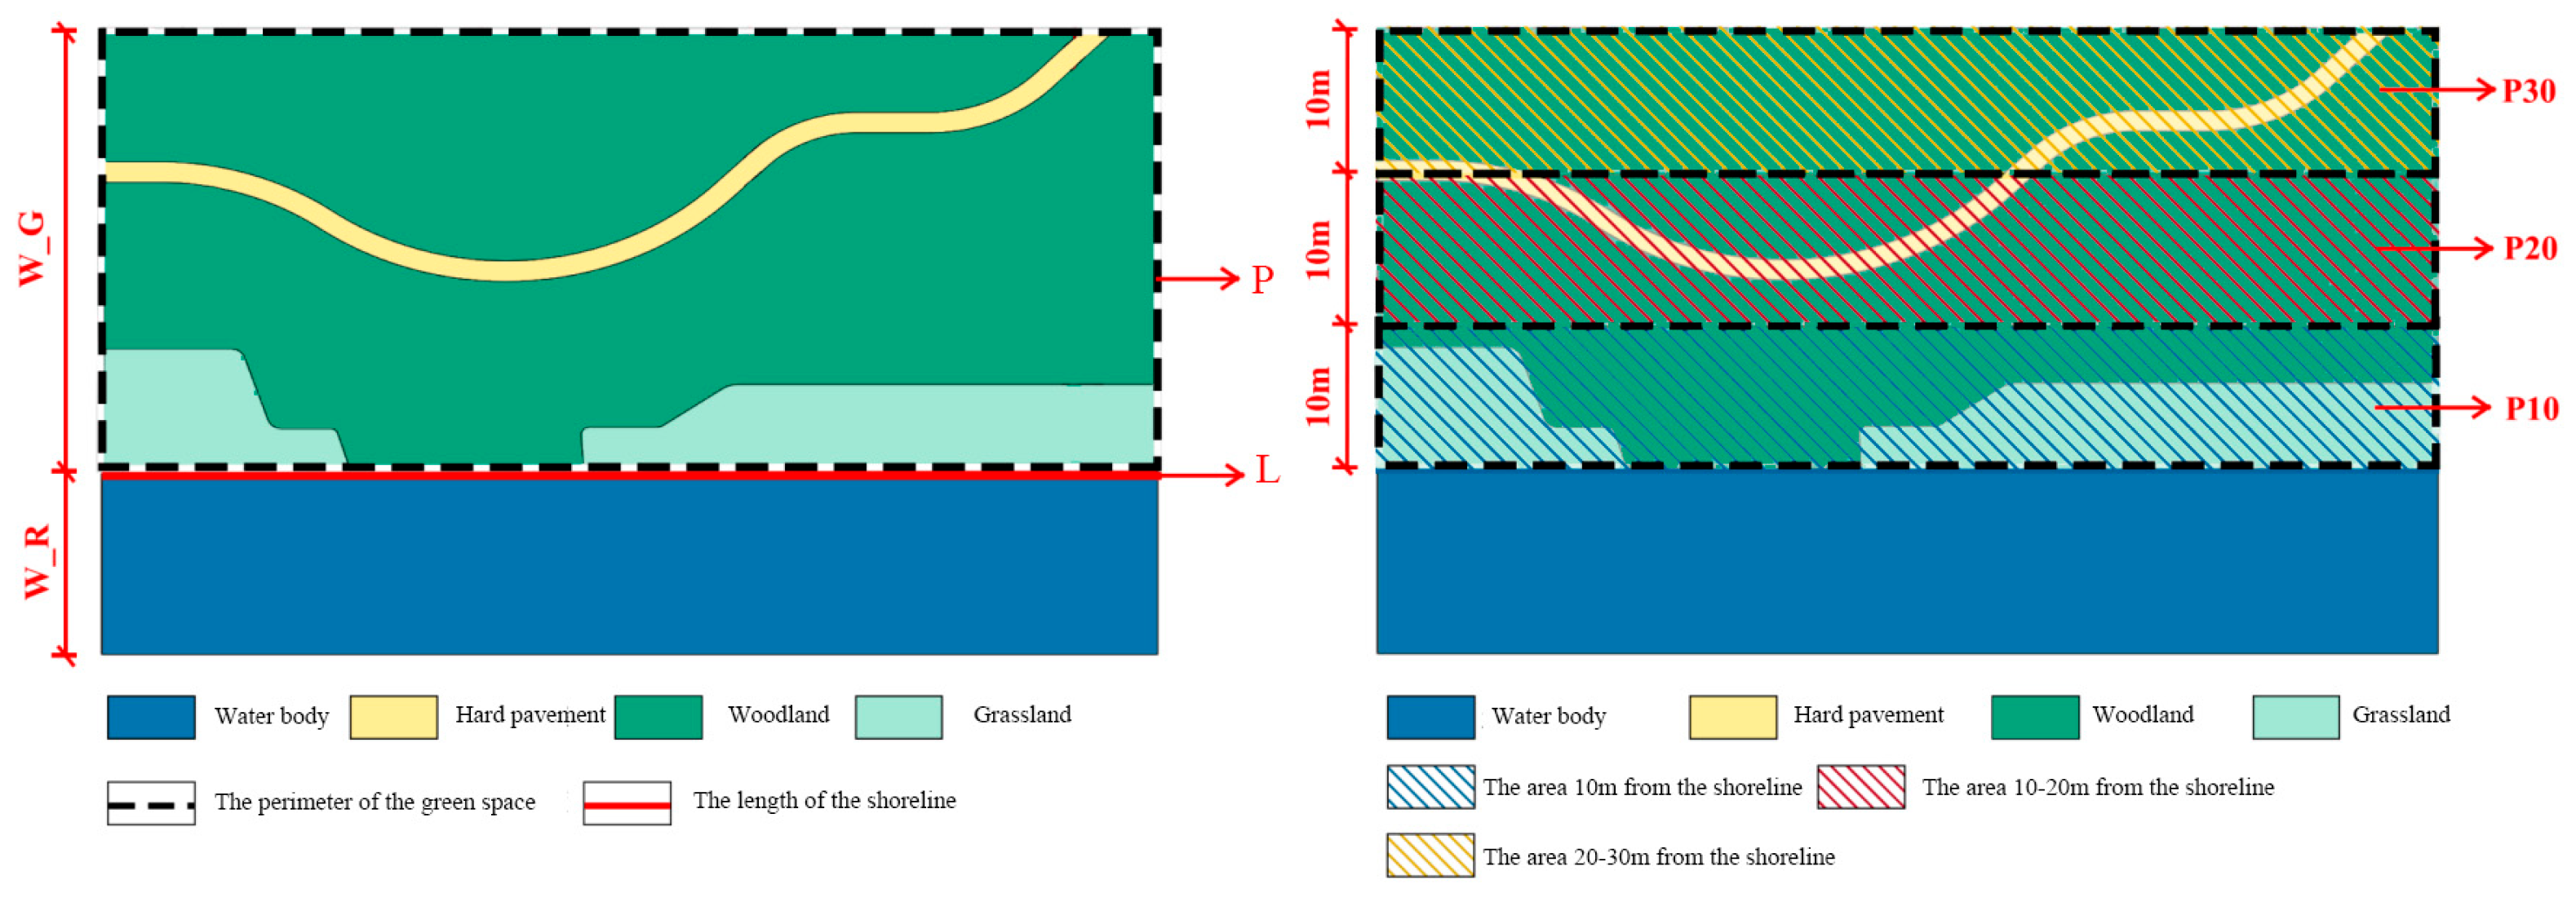
Five indicators of water–green spatial relationships were constructed to select factors influencing the carbon sequestration efficiency of green spaces (
Table 1). Among them, two indicators—the Degree of Water–Green Contact (R) and the Water–Green Width Ratio (W)—represent the morphological relationship between green spaces and adjacent water bodies. The remaining three indicators describe the spatial distribution of forested areas within green spaces in relation to their proximity to the water’s edge: proportion of forest area within 10 m (P10), between 10 and 20 m (P20), and between 20 and 30 m (P30) (
Figure 5).
A random forest (RF) regression model [
47] was employed to analyze factors influencing carbon sequestration efficiency in green spaces, aiming to identify key driving factors. In the dataset, the carbon sequestration efficiency of each waterfront green space was treated as the dependent variable, while the selected indicators served as feature variables. During RF model fitting, the number of decision trees and tree depth significantly affected performance; therefore, a particle swarm optimization (PSO) algorithm was applied to optimize these two hyperparameters. The PSO settings were population size = 5, maximum iterations = 80, individual learning factor c1 = 1.4495, social learning factor c2 = 1.4494, and inertia weight w = 0.9. The search range for the number of decision trees was 200–800. In each iteration, the fitness of each particle was evaluated using mean squared error (MSE) to determine the optimal parameter combination. Five-fold cross-validation was incorporated to prevent overfitting. Model accuracy was assessed using R
2 and mean absolute error (MAE), with R
2 > 0.7 considered a necessary criterion for model validation. The calculation formulas are as follows:
In Equation (3), k represents the number of folds in cross-validation, which refers to the number of times the dataset is split into training and testing sets. The partition ratio for the response model was set at 0.8, with k = 5. Here, denotes the predicted value of the dependent variable in the i-th calculation, represents the actual value of the dependent variable in the i-th calculation, is the mean value of the dependent variable, and n indicates the sample size.
Additionally, the mean absolute error (MAE) reflects the deviation between predicted and actual values. Compared to R
2, MAE provides a more intuitive representation of model accuracy.
In Equation (4), k represents the number of folds in cross-validation, denotes the predicted value of the dependent variable, represents the actual value of the dependent variable, and n indicates the sample size.
2.6. Statistical Analysis
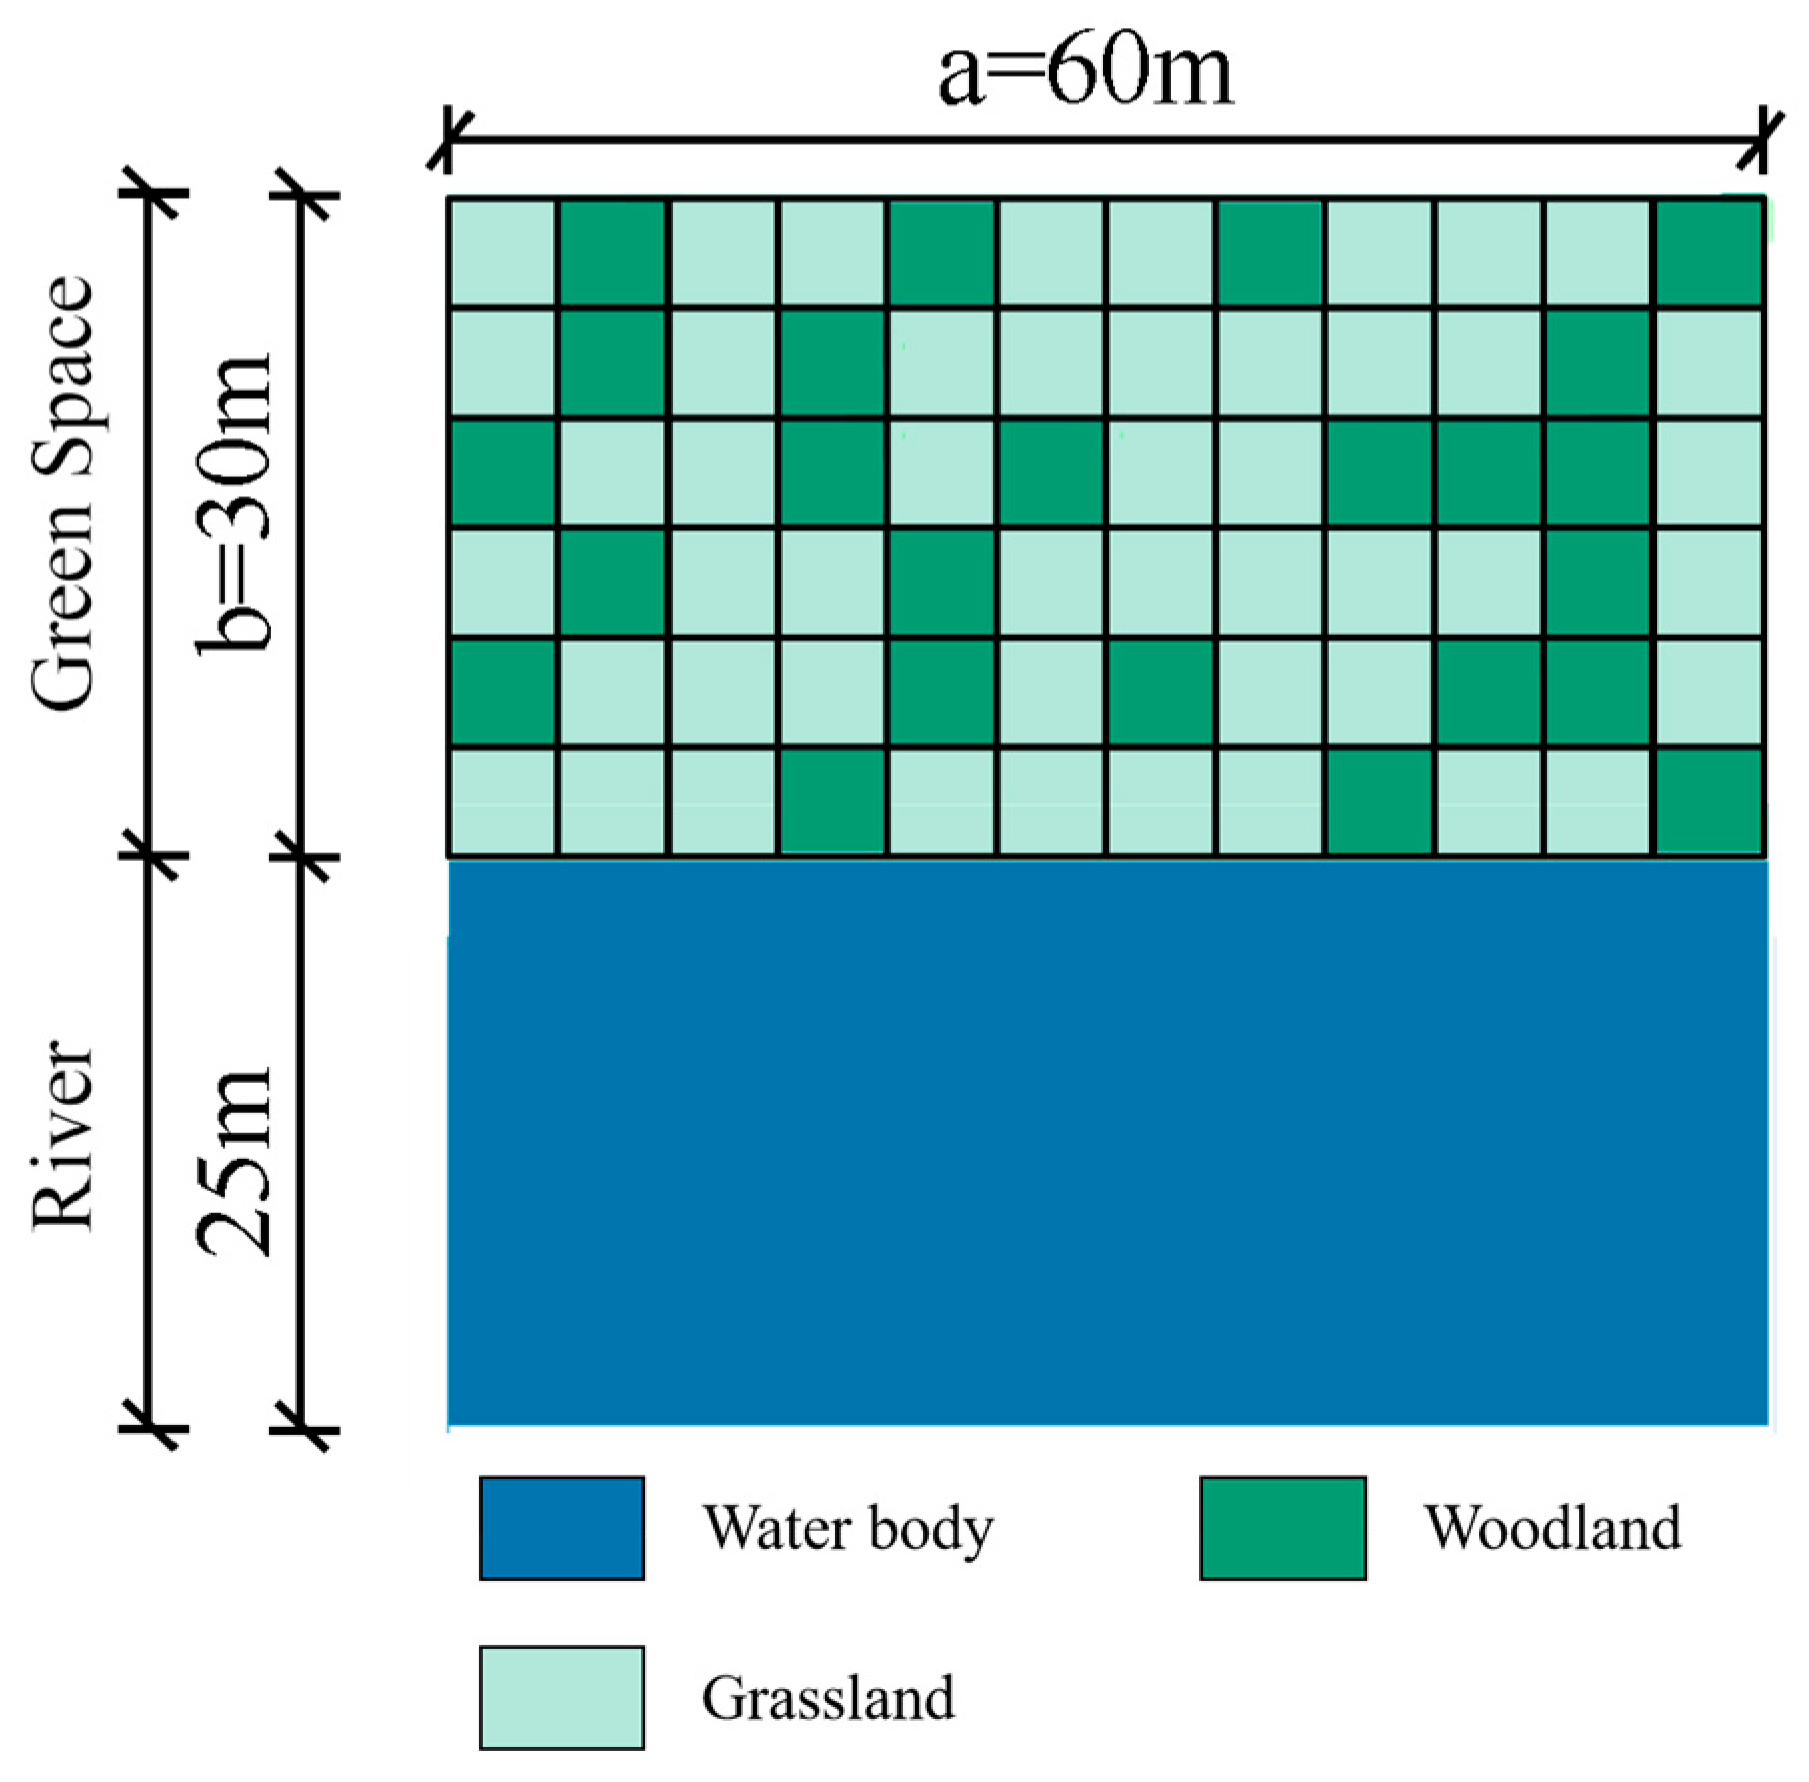
Previous studies have rarely examined the relationship between water–green spatial characteristics in waterfront green spaces and carbon sequestration efficiency. In this study, a set of indicators was established based on the spatial features of the study area. Furthermore, as a methodological exploration, scenario simulations were conducted to investigate potential applications. A total of 16 scenarios were constructed using a control variable approach to explore the possible influence of key factors. Grasshopper was integrated with ENVI-met (version 5.7.2) via the Morpho plugin to simulate reductions in CO
2 concentration, which were used as a reference for carbon sequestration efficiency. The study area was divided into 5 m × 5 m grids, with tree height set at 7 m, crown width at 5 m, and forested area accounting for 33% of the total green space. CO
2 concentrations were simulated over 10 consecutive days between 10:00 and 11:00, corresponding to the peak carbon sequestration period [
42]. Meteorological data were obtained from the European Centre for Medium-Range Weather Forecasts “
https://cds.climate.copernicus.eu/datasets (accessed on 20 October 2023)”, and the initial CO
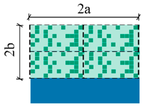
2 concentration for each day was set at 400 ppm. By varying the number and arrangement of generalized model units (
Figure 6), a total of 16 scenarios were set up: six scenarios addressed the morphological relationships of water–green spaces (as shown in
Table 2), while ten scenarios explored the potential effects of different woodland distributions (as shown in
Table 3).
3. Results
3.1. Comparison of Carbon Sequestration Efficiency Between Waterfront Green Spaces and Non-Waterfront Green Spaces
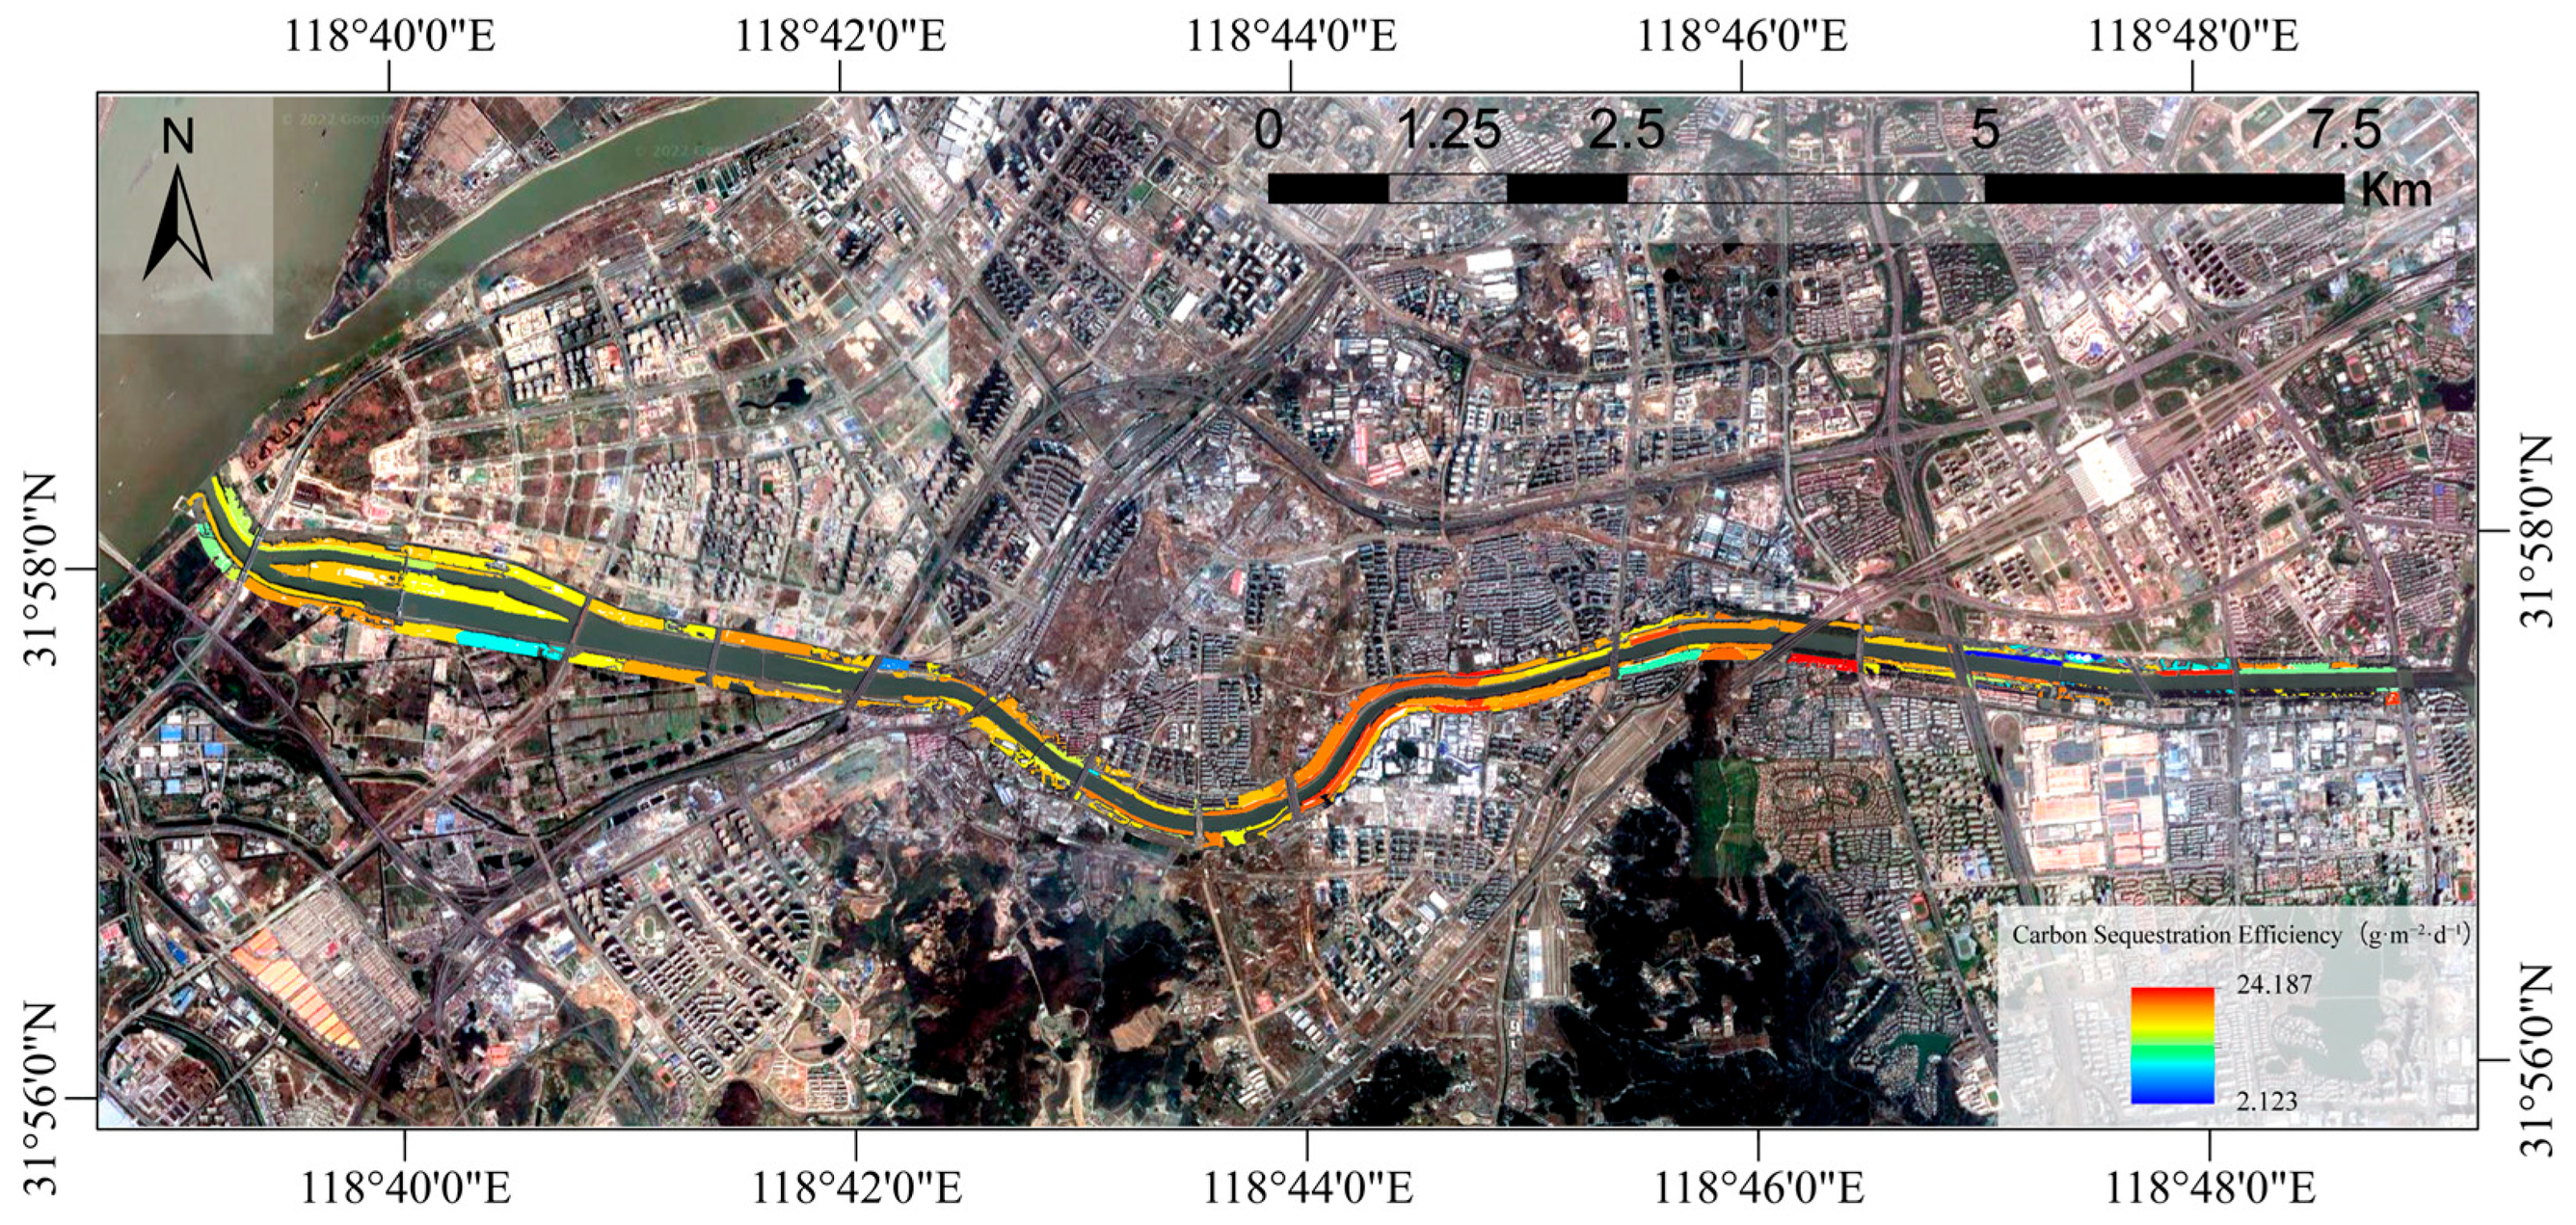
The calculated carbon sequestration efficiency of waterfront and non-waterfront green spaces in the study area is shown in
Figure 7. The mean carbon sequestration efficiency of waterfront green spaces was slightly higher than that of non-waterfront green spaces. Among the 39 waterfront green spaces, the maximum efficiency was 24.187 g·m
−2·d
−1, the minimum was 5.051 g·m
−2·d
−1, and the mean was 17.04 g·m
−2·d
−1. Among the 145 non-waterfront green spaces, the maximum was 23.941 g·m
−2·d
−1, the minimum was 2.123 g·m
−2·d
−1, and the mean was 16.15 g·m
−2·d
−1. The standard deviations were 3.61 for waterfront green spaces and 5.37 for non-waterfront green spaces. Welch’s
t-test showed t = 1.65,
p = 0.104, indicating no statistically significant difference (
p > 0.05), with an effect size of Cohen’s d = 0.29.
To further explore spatial distribution patterns, a global spatial autocorrelation analysis was conducted. The global Moran’s I index was 0.181 (p = 0.089), suggesting a weak positive spatial autocorrelation at the 90% confidence level; that is, higher-efficiency green spaces tended to be near other high-efficiency areas, and lower-efficiency areas tended to cluster. However, this trend did not reach significance at the 95% confidence level and should be interpreted cautiously.
Overall, waterfront green spaces showed slightly higher average carbon sequestration efficiency, a smaller range of extreme values, and lower variability, indicating relatively more stable performance. Non-waterfront green spaces had a slightly lower mean and greater dispersion. Although the t-test did not indicate a significant difference, the effect size suggests a possible trend of difference between waterfront and non-waterfront areas. The weak positive spatial autocorrelation indicated by Moran’s I aligns with the marginal result of the t-test. These findings suggest that further studies at larger spatial scales or with expanded sample sizes could help clarify the potential role of waterfront environments in influencing carbon sequestration efficiency.
3.2. Analysis of Key Influencing Factors Affecting Carbon Sequestration Efficiency of Waterfront Green Space
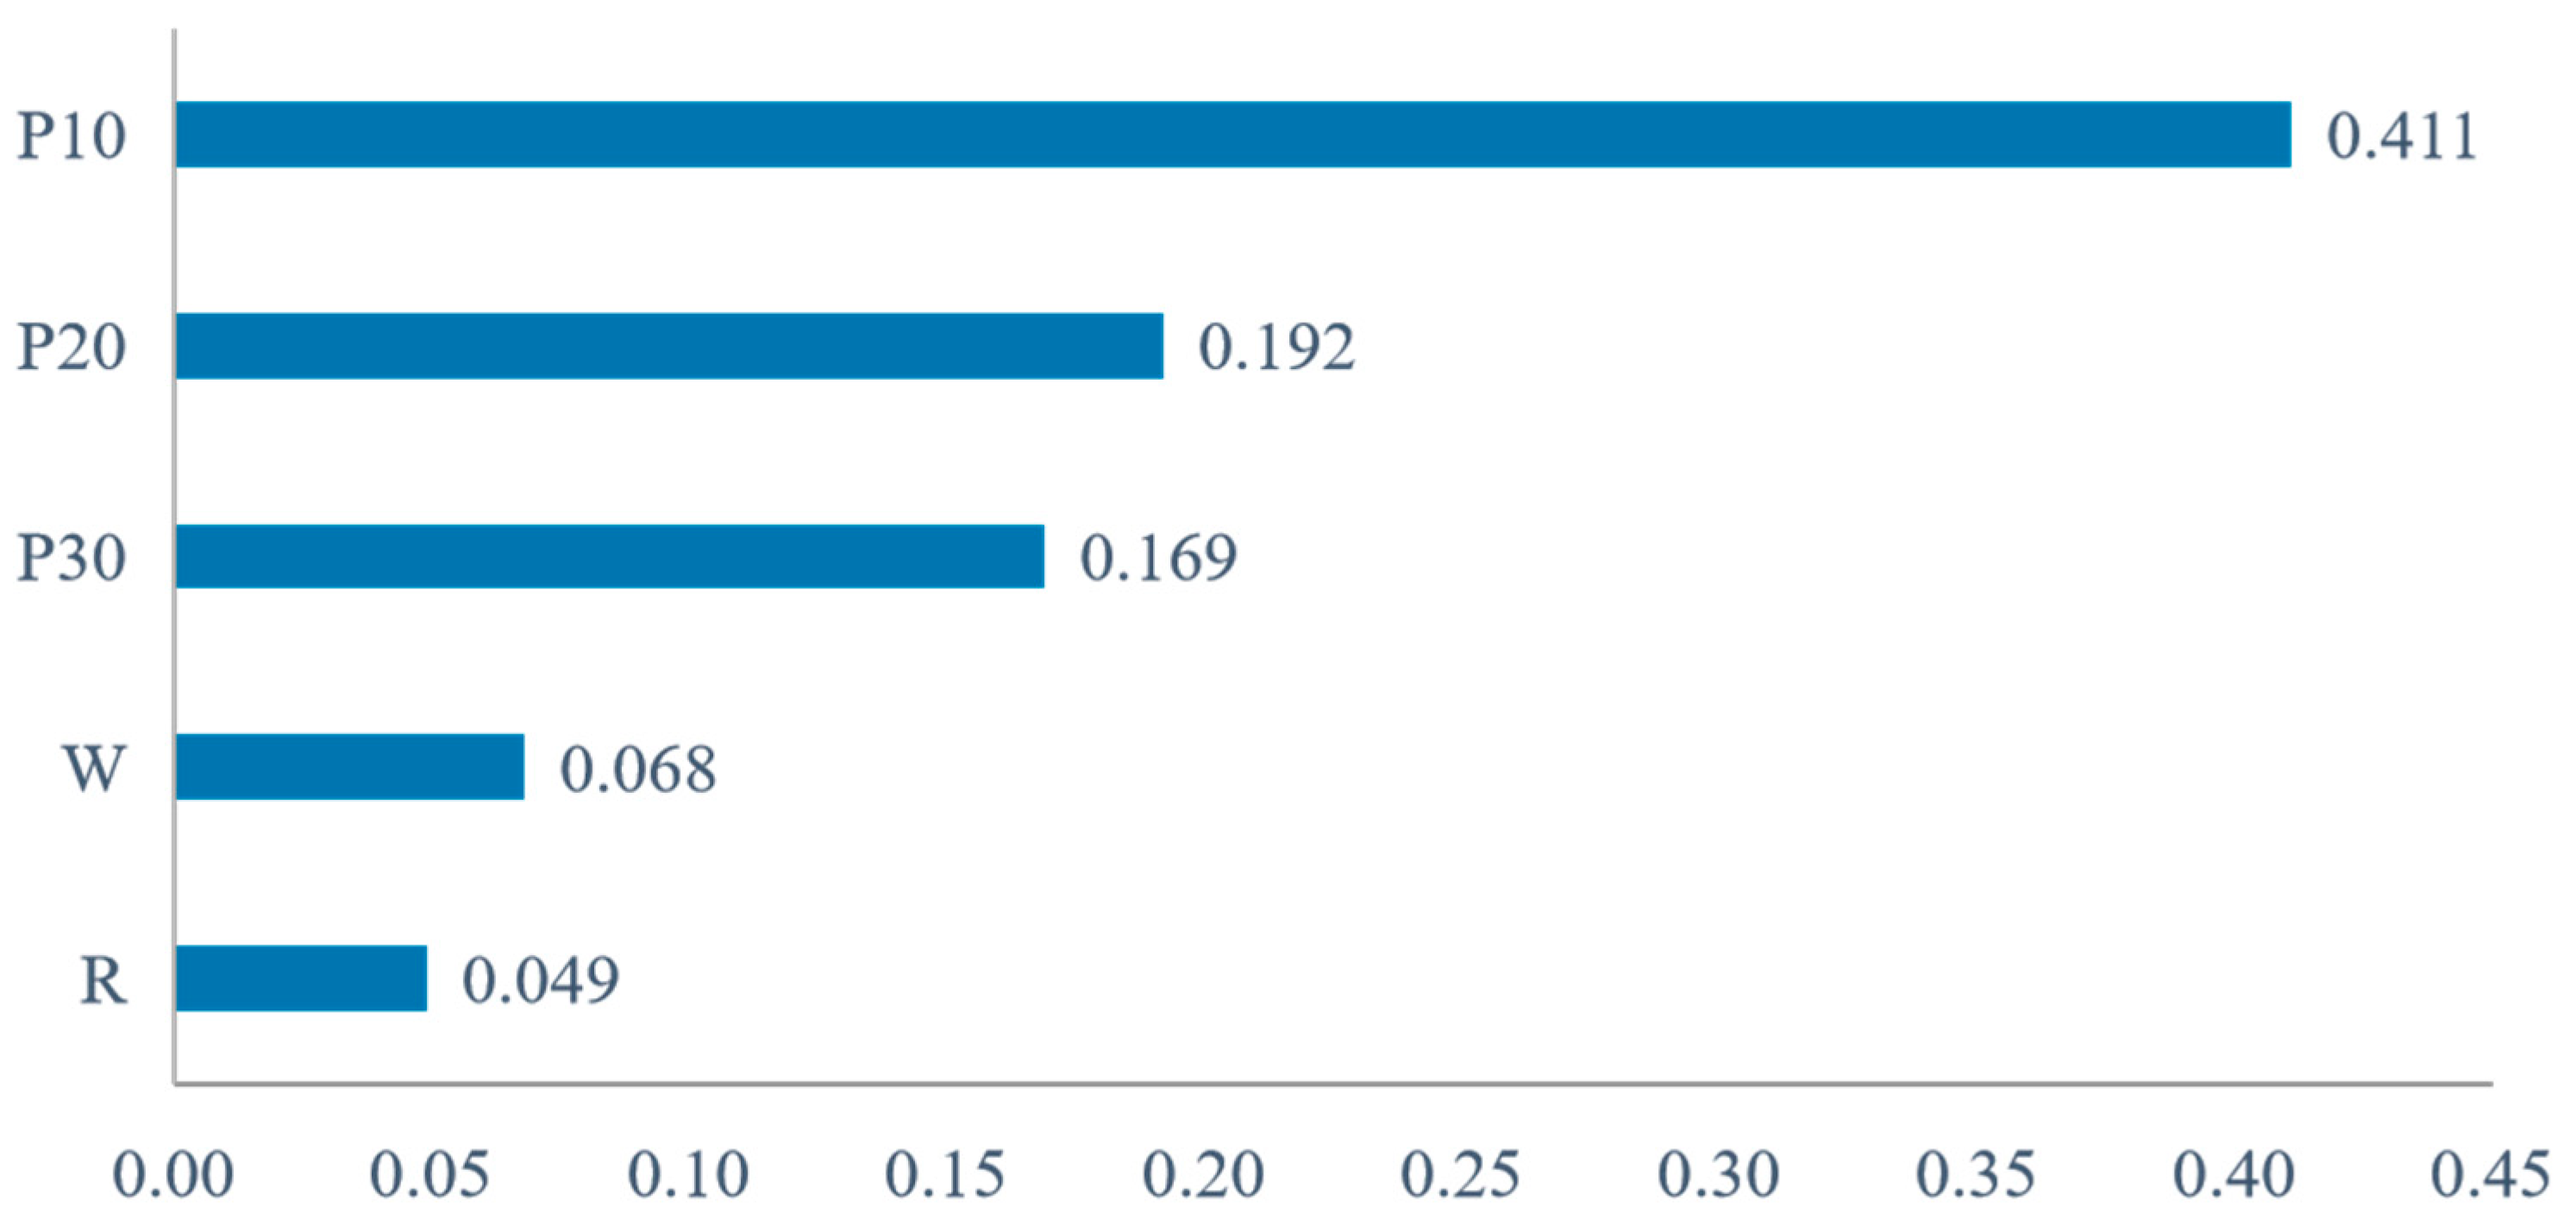
Based on the carbon sequestration efficiency of waterfront green spaces and the calculated water–green spatial relationship indicators, an importance analysis was performed using a random forest regression model (
Figure 8). The model fitting yielded an R-squared value of 0.765 and a mean absolute error (MAE) of 1.26. The importance ranking of each indicator is presented in
Figure 8. According to the random forest results, P10, P20, and P30 were the top three most influential indicators, with P10 identified as the most critical factor, markedly surpassing the others. In contrast, W and R exhibited lower importance, with a substantial gap relative to the top three indicators. This suggests that, compared with water–green morphological relationship indicators, the spatial distribution of forested areas at varying distances from the water edge has a greater impact on carbon sequestration efficiency in waterfront green spaces. Specifically, the proportion of forest land within 10 m of the water edge (P10) is the key factor affecting carbon sequestration efficiency.
Further autocorrelation analysis (
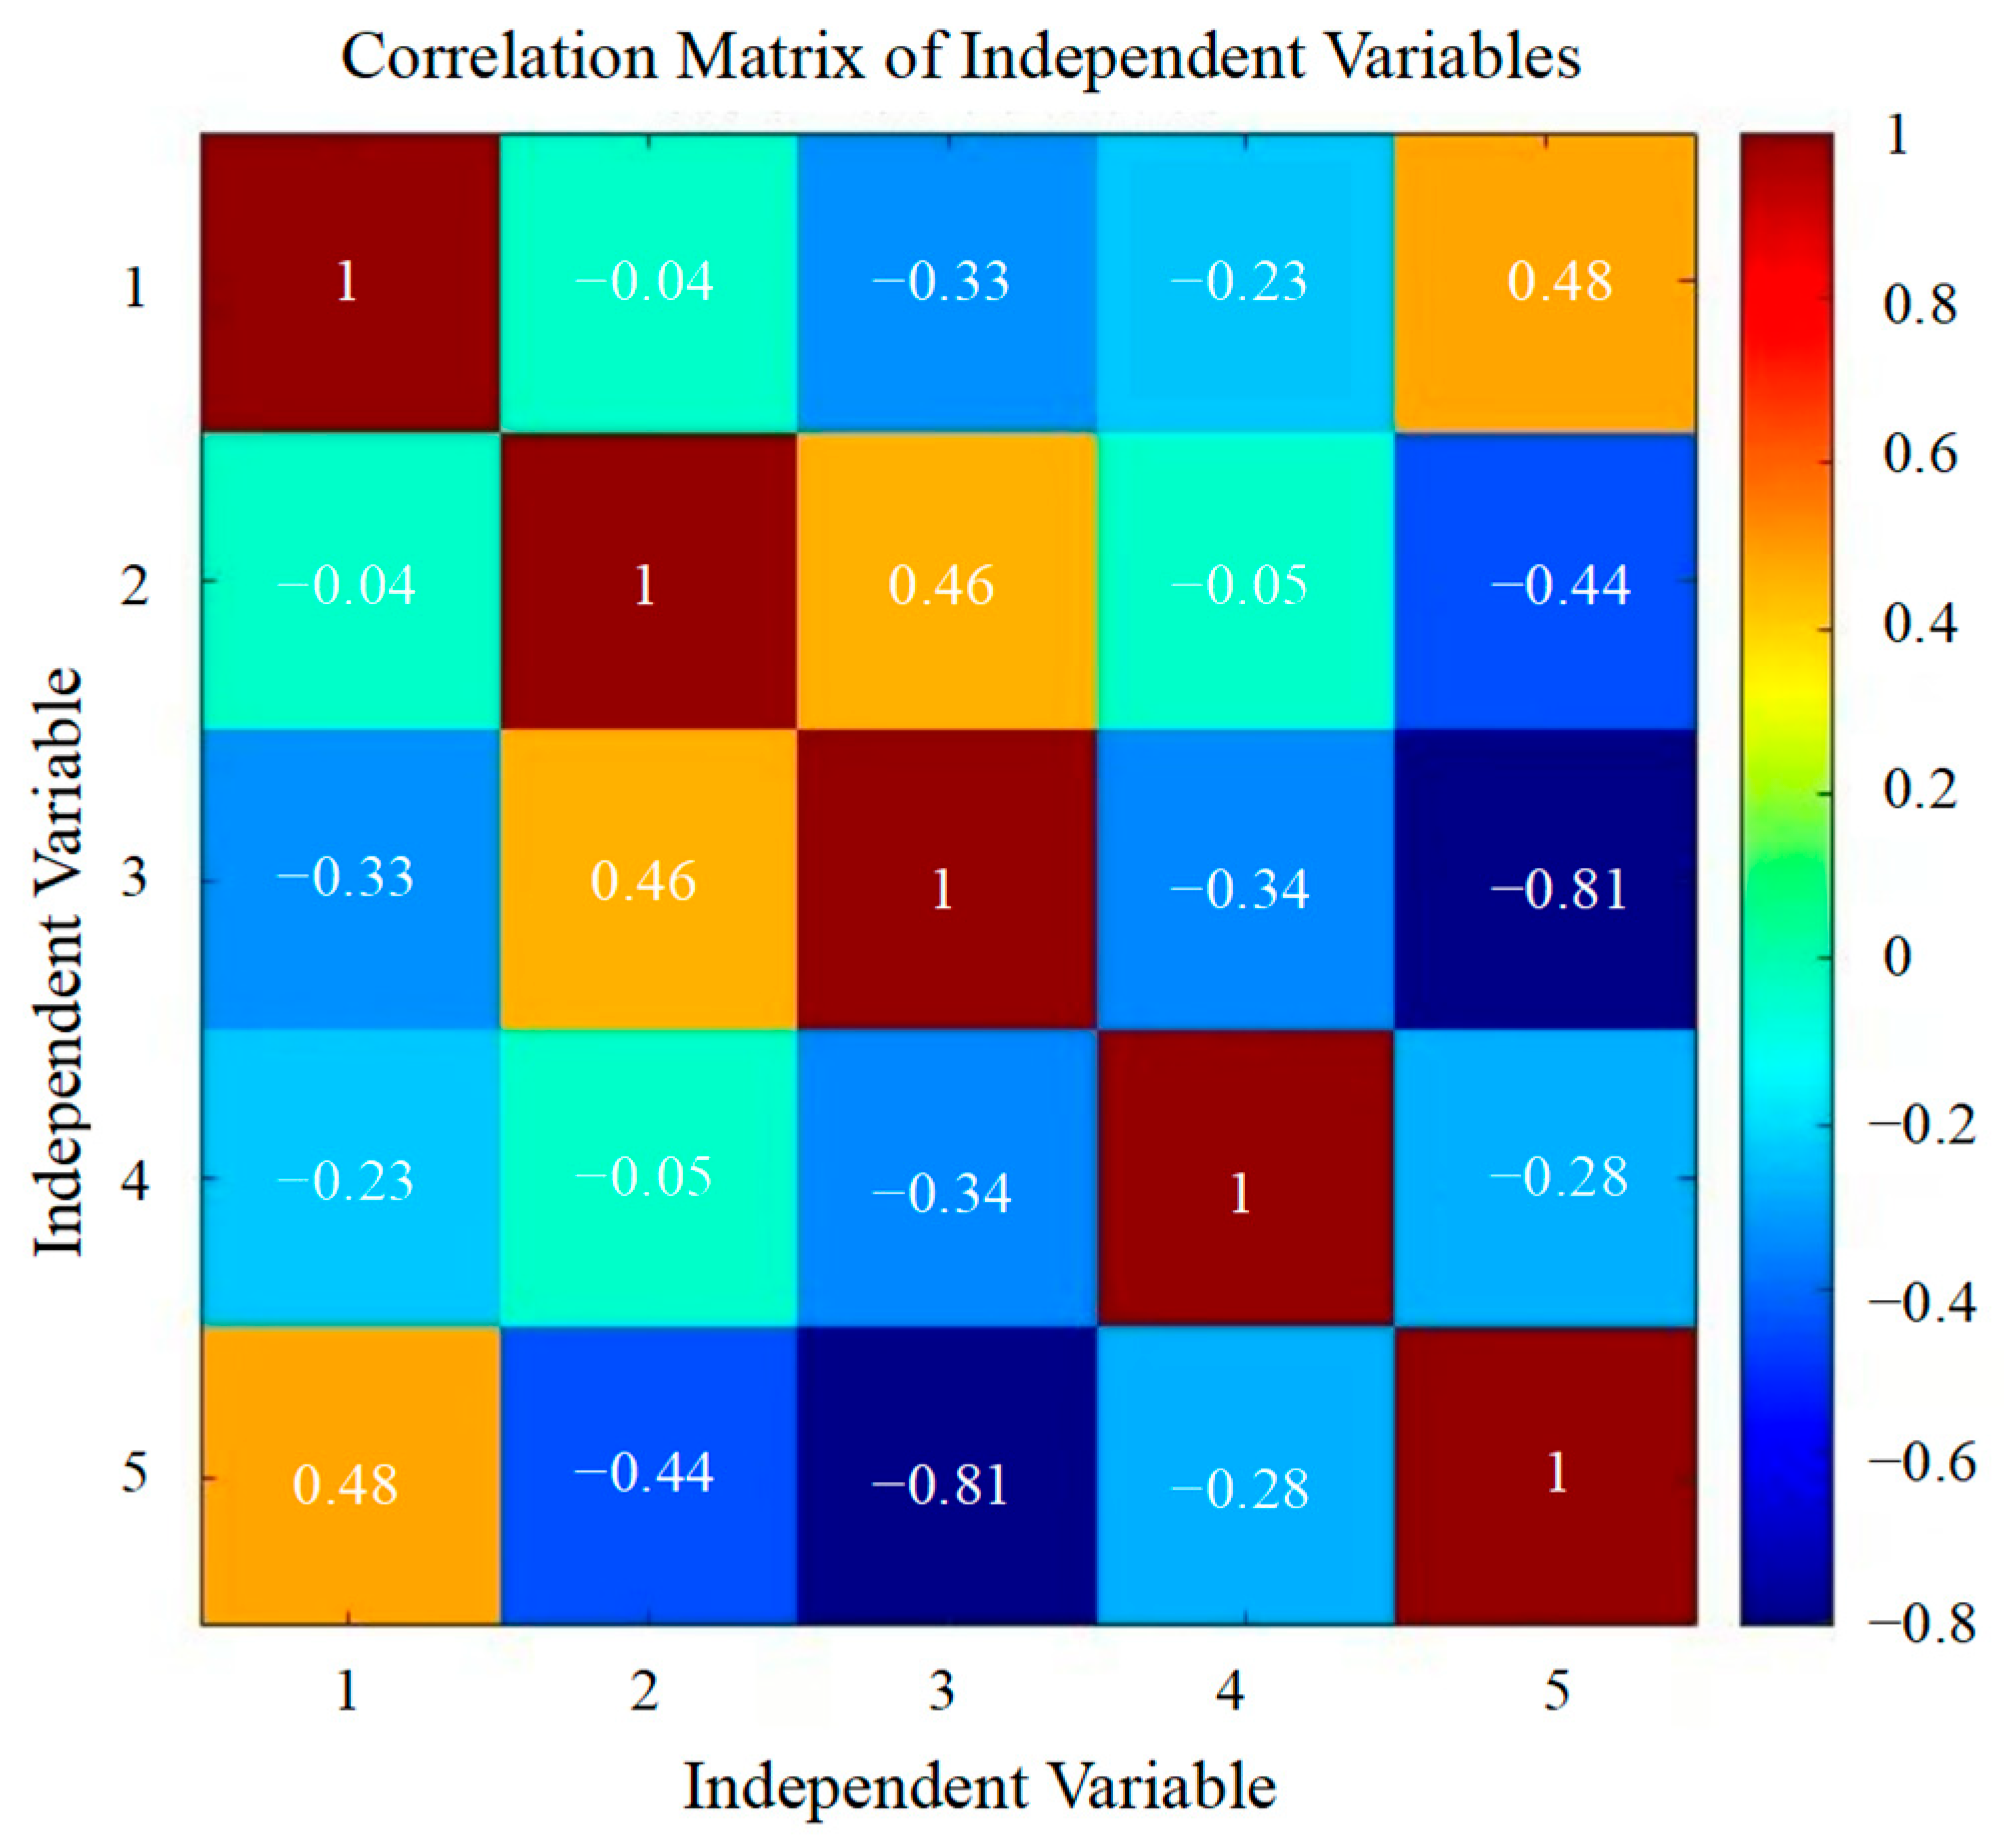
Figure 9) showed that P10 and P30 have a strong negative correlation (r = −0.81), while R and P10 exhibit a moderate positive correlation (r = 0.46). These results indicate that although P10, P20, and P30 are somewhat interrelated, P10 still makes the most significant independent contribution to carbon sequestration efficiency. The moderate positive correlation between R and P10 suggests that the degree of water–green contact is partially associated with the proportion of near-water forest land, but its influence is relatively limited.
3.3. Validation of Key Influencing Factors Based on Scenario Simulation
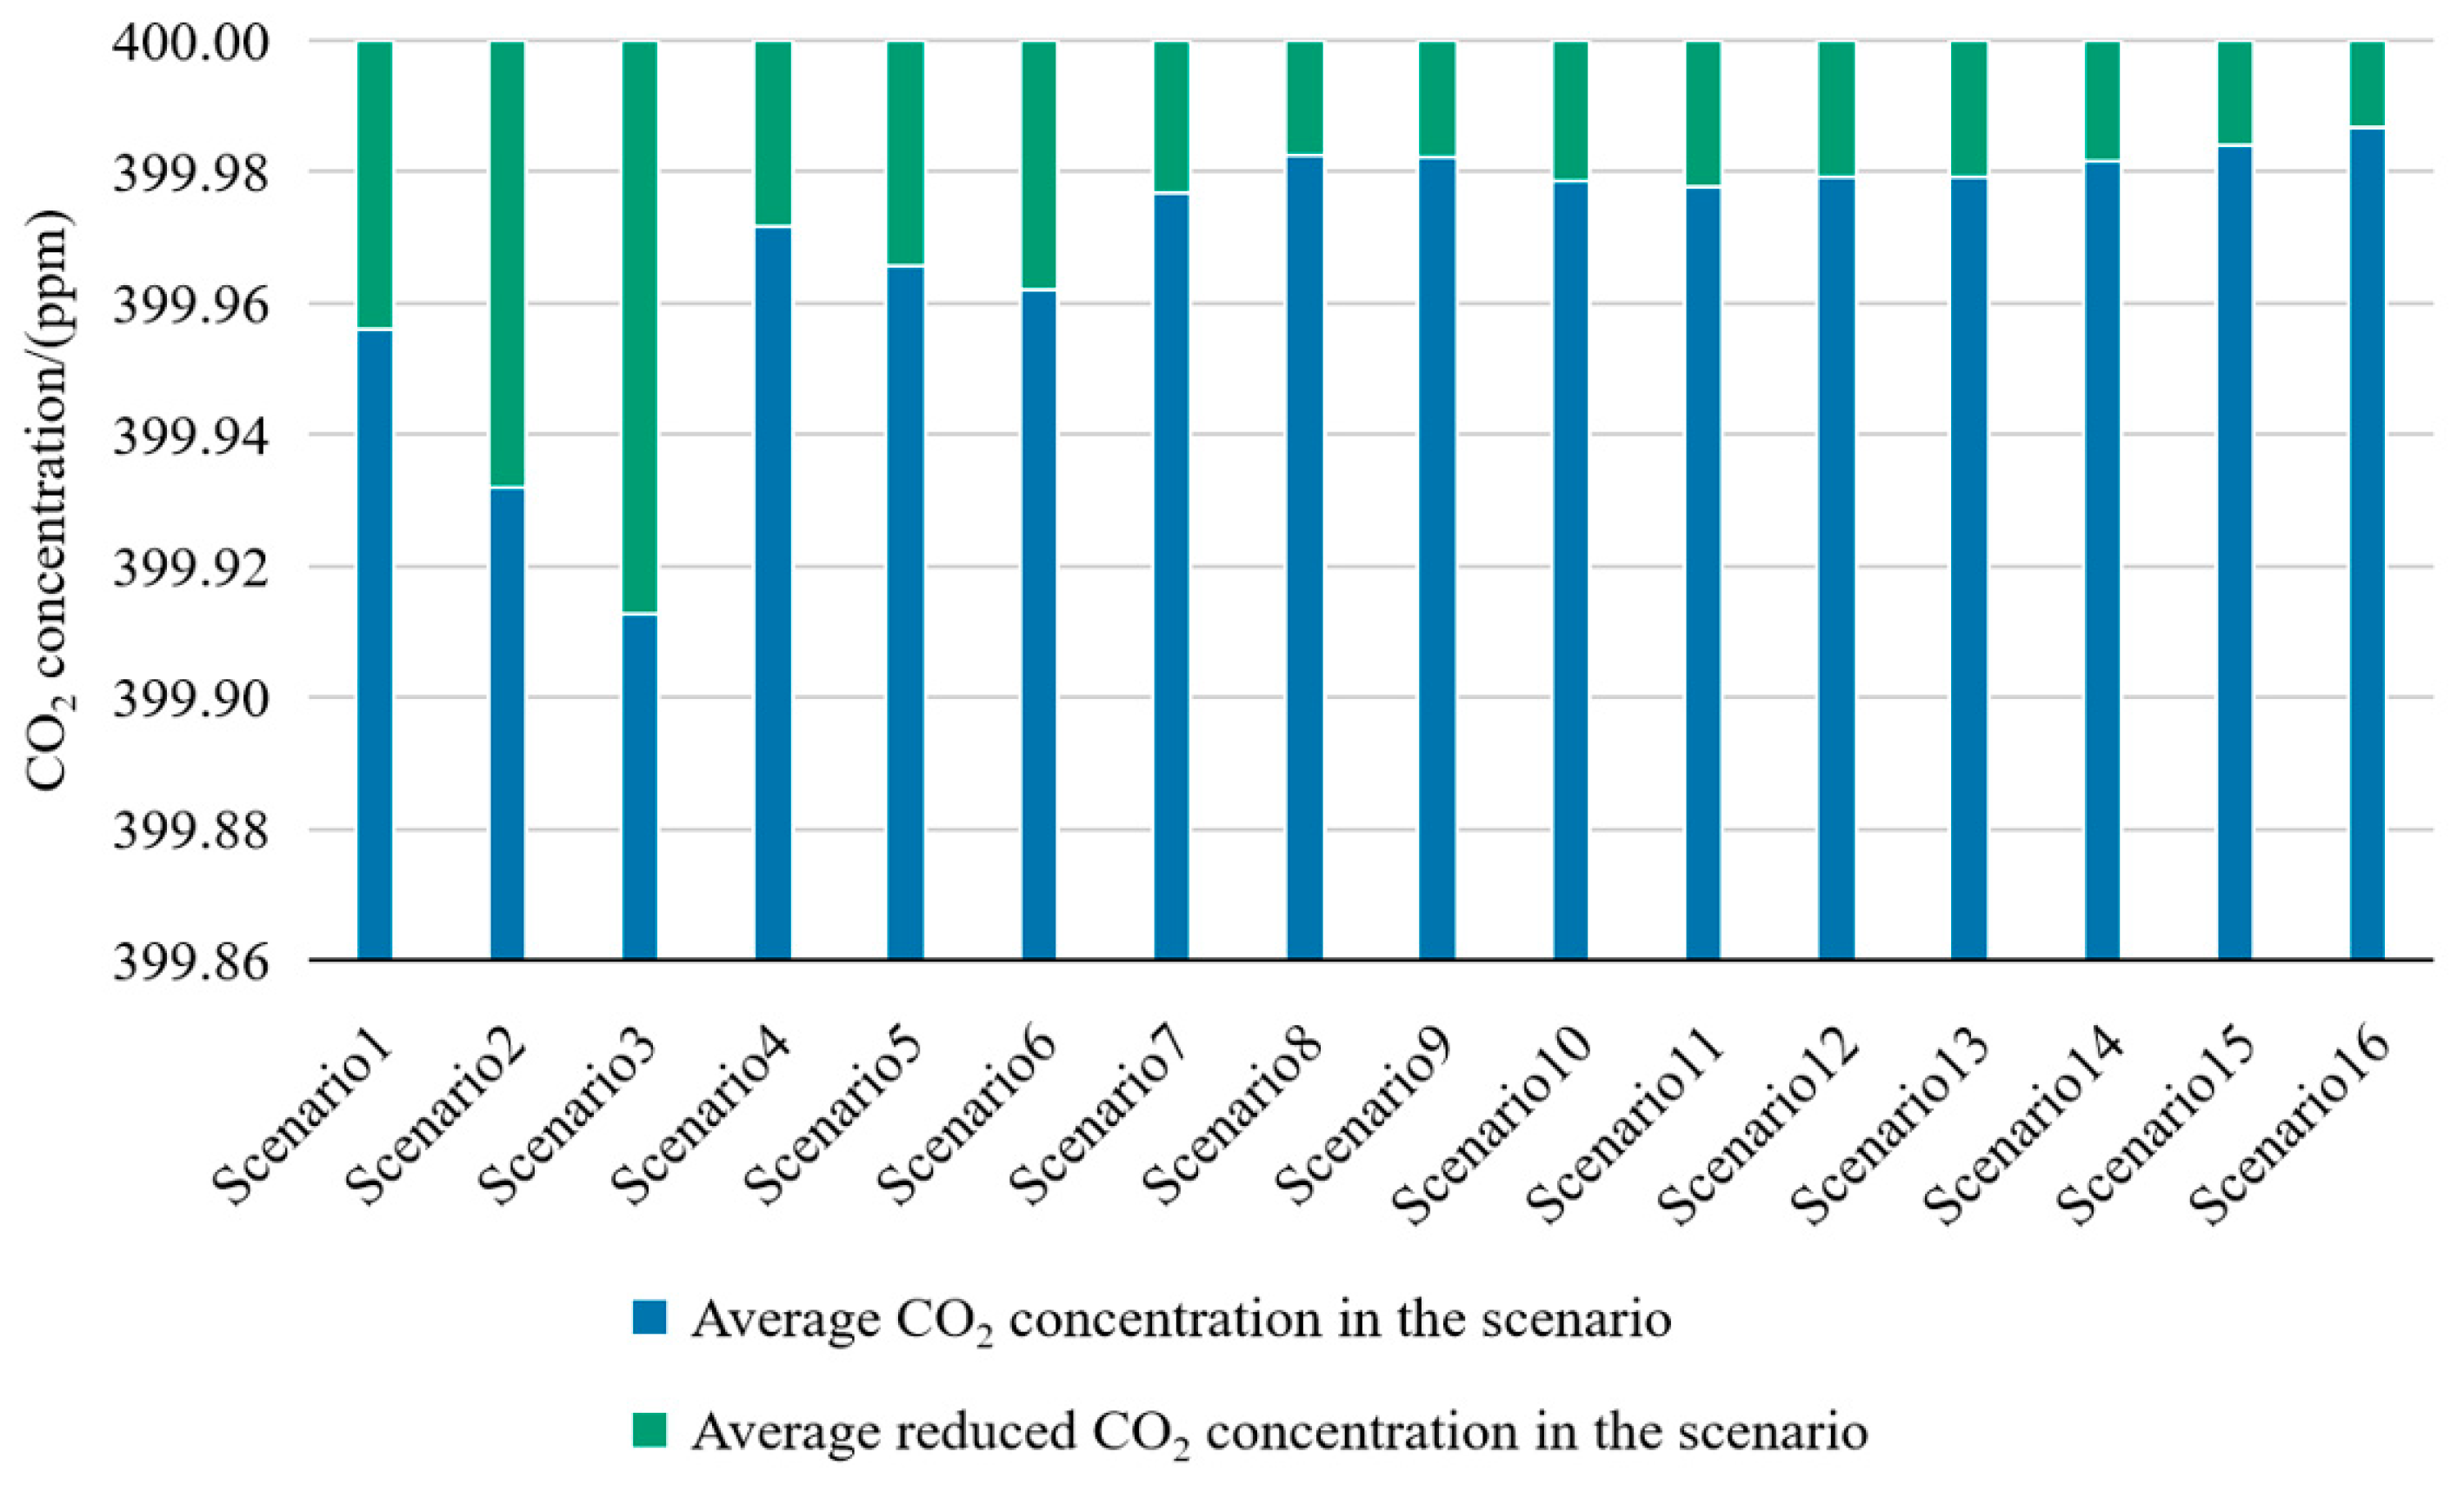
The 10-day average CO
2 concentration simulation results for 16 scenarios are presented in
Figure 10. Among the six scenarios reflecting variations in water–green morphological relationships, the simulation outcomes for Scenarios 1, 2, and 3 demonstrate that as the water–green width ratio increases, the carbon sequestration benefit of green spaces exhibits a significant upward trend, with the 10-day average CO
2 concentrations measuring 399.956 ppm, 399.932 ppm, and 399.913 ppm, respectively; in Scenarios 4, 5, and 6, as the degree of water–green contact increases, the average CO
2 concentrations are 399.972 ppm, 399.966 ppm, and 399.962 ppm sequentially, with a corresponding increase in carbon sequestration benefits (
Table 4). Therefore, the simulation results indicate that appropriately adjusting the water–green width ratio and water–green contact degree can effectively enhance the carbon sequestration benefits of waterfront green spaces. Furthermore, the carbon sequestration benefits in the three scenarios with changes in the water–green contact degree surpass those in the three scenarios with variations in the water–green width ratio, suggesting that modifying the water–green contact degree yields greater carbon sequestration benefits compared to altering the width ratio.
Among the ten scenarios involving changes in forest land distribution, the top five carbon sequestration benefits are observed in the following order: Scenario 7, Scenario 11, Scenario 10, Scenario 12, and Scenario 13. Compared to the latter five scenarios, these scenarios share two characteristics: first, forest land is distributed within 10 m at proportions of 0.33 or 0.66; second, the proportion of forest land at varying distances from water remains below 1. This finding aligns with the results of the random forest regression analysis, indicating that the proportion of forest land area within 10 m significantly influences the carbon sequestration benefits of waterfront green spaces. In Scenario 7, which yields the highest carbon sequestration benefits, when the proportions of forest land in the 0–10 m, 10–20 m, and 20–30 m zones are all 0.33, the carbon sequestration benefit reaches its maximum, suggesting that a balanced plant distribution enables green spaces to achieve optimal carbon sequestration efficiency. Analysis of Scenarios 15 and 16, which exhibit the lowest carbon sequestration benefits, reveals that when the forest land area in the 10–20 m and 20–30 m zones is 1, the carbon sequestration benefit is minimized. This finding partially substantiates that strip planting in waterfront green spaces results in lower carbon sequestration benefits.
Finally, to verify the stability and detectability of the scenario simulation results, we calculated the coefficient of variation (CV) and relative sensitivity. Overall, the simulation yielded a CV of 0.000051 and a relative sensitivity of 0.000185, indicating that the results were stable and not influenced by noise. For further analysis, we calculated the CV and relative sensitivity for each scenario based on the ten-day average CO2 concentration. The standard deviations ranged from 0.010 to 0.046 ppm, the CV from 0.000027 to 0.000115, and the relative sensitivity from 0.000100 to 0.000415. Considering the day-to-day variations over the ten days, these small changes indicate the reliability of the simulation results.
4. Discussion
4.1. Synergy Mechanism of Water–Green Spatial Characteristics in Waterfront Green Spaces
According to the data analysis, the carbon sequestration efficiency and stability of waterfront green spaces in the study area were overall slightly higher than those of non-waterfront areas. There are several possible explanatory directions for this pattern. First, water bodies may improve soil moisture conditions, thereby facilitating plant growth [
48,
49]. Second, water bodies may help optimize local microclimates—such as temperature, humidity, and wind environments—providing relatively favorable conditions for vegetation [
50]. Similar associations between carbon sequestration benefits and microclimatic conditions have also been reported by Bian Hongyan et al. [
51,
52]. It should be noted, however, that the field measurements in this study were mainly conducted in September and October, so the results primarily reflect carbon sequestration performance in late summer and autumn.
Building on the documented cooling and humidifying effects of blue–green spaces [
53], this study further developed indicators (e.g., P10 and P20) to characterize water–green spatial relationships. The results suggest that the spatial distribution of woodlands at different distances from the river is an important factor shaping carbon sequestration efficiency. The influence of proximity decreases sequentially at 0–10 m, 10–20 m, and 20–30 m from the riverbank, indicating that closer vegetation tends to support higher efficiency. In particular, increasing the proportion of trees and shrubs within 10 m of the riverbank was associated with notably higher carbon sequestration benefits; when the proportion of forested land within this range reached 0.66, benefits increased significantly. However, when woodland within the 10–30 m range formed a fully continuous belt (proportion = 1), carbon sequestration benefits declined instead. This finding is consistent with Wang et al. [
46], who noted that overly dense or homogeneous vegetation configurations may hinder ventilation and lead to uneven resource allocation, thereby diminishing the carbon sequestration and oxygen release benefits of plants [
54].
On the other hand, indicators related to water–green morphological relationships exhibit certain scale dependency. Previous large-scale studies have shown that spatial pattern metrics, such as green space area, patch type, landscape shape index, and aggregation degree, are significantly correlated with carbon sequestration efficiency [
55]. However, in the present regression analysis, the effects of water–green contact degree (R) and water–green width ratio (W) were not statistically significant, indicating that at small-to-medium scales, morphological factors exert a weaker influence on carbon sequestration efficiency compared to distance-related indicators. Scenario simulations revealed that both W and R can effectively enhance carbon sequestration efficiency when their values vary substantially. This may be attributable to the simulation method, in which changes in spatial morphology were implemented by adjusting length–width ratios, thereby indirectly altering green space area and the number of trees. Accordingly, we distinguished between morphological changes and forest distribution variations in our analysis. Overall, the simulation results indicate that increasing the width of waterfront green spaces to expand the area of water–green synergy, or enhancing water–green contact to optimize the interface with water bodies, can both steadily improve carbon sequestration benefits. Comparatively, the increase associated with the water–green width ratio was slightly greater than that of contact degree, suggesting that at small-to-medium scales, moderately expanding the width of waterfront green spaces may have a more pronounced effect on enhancing carbon sequestration efficiency.
4.2. Design and Renewal Strategies for Waterfront Green Spaces to Enhance Carbon Sequestration Efficiency
Studies have demonstrated the influence of water–green spatial relationships on the carbon sequestration efficiency of waterfront green spaces. Based on these findings, design and renewal strategies aimed at enhancing carbon sequestration efficiency in waterfront green spaces are proposed (
Figure 11).
(1) Prioritize woodland layout within 10 m of the water’s edge
Random forest regression analysis indicates that forest land distribution is a key factor influencing carbon sequestration efficiency, with the proportion of forest land within 10 m of the water’s edge being particularly important. Therefore, in waterfront green space renewal projects, forest land layout should be optimized, prioritizing the placement of woodlands in areas adjacent to the water. In addition, planting moisture-tolerant tree species with high carbon sequestration capacity—such as Taxodium distichum, Triadica sebifera, Pterocarya stenoptera, and Salix babylonica—is recommended. Considering urban river flood control standards and embankment protection requirements, coordinated efforts across multiple departments are necessary, for example, by integrating near-natural river restoration approaches. Furthermore, large impervious surfaces, such as roads and plazas, should be avoided within the 10 m buffer zone to minimize fragmentation of water–green spaces by artificial hard interfaces and to ensure sufficient ecological space for forest land in near-water areas.
(2) Enhance shoreline complexity and maximize green space depth
Simulation results indicate that increasing the water–green width ratio and improving the contact degree both significantly affect carbon sequestration efficiency. Therefore, waterfront planning and design should favor single green space forms with considerable depth, aiming to create composite green landscapes composed of “aquatic plants—wetland herbs—moisture-tolerant tree forests,” and to establish multitiered vegetation community structures. Regarding the optimization of water–green contact, straight water edges should be minimized in favor of natural, diverse shoreline morphologies that increase the interface area between water bodies and green spaces. Moreover, various land-water junction forms—such as peninsulas, water bays, and islands—can be incorporated to develop a richly layered waterfront landscape.
(3) Plant trees and shrubs in a balanced manner
Research shows that balanced plant arrangements maximize carbon sequestration efficiency in green spaces. Consequently, planting design in waterfront green spaces should emphasize the spatial distribution of trees and shrubs, maintaining balanced tree-shrub configurations within the 0–10 m, 10–20 m, and 20–30 m zones from the water, while avoiding strip planting whenever possible. Medium- and small-sized trees and large flowering shrubs should dominate, supplemented by large-diameter trees. For example, selecting high carbon sequestration species such as Cinnamomum camphora and Metasequoia glyptostroboides as upper-layer trees, combined with flowering shrubs like Lagerstroemia indica and Hibiscus syriacus, alongside herbaceous ground covers such as Ophiopogon japonicus and Zephyranthes candida in the understory, not only creates a rich spatial vegetation structure but also enhances overall carbon sink capacity. During the renewal of urban river waterfronts, local thinning and lateral expansion of tree areas can be implemented to optimize row and strip planting zones, thereby improving the carbon sequestration efficiency of green spaces.
4.3. Limitations and Prospects
The present study has several limitations. First, there is room for improvement in data accuracy. Plant carbon sequestration efficiency was estimated based on field surveys of tree species and measured LAI data. Future studies could construct high-precision plant models using point cloud data and apply allometric growth equations to further improve the accuracy of carbon sequestration estimates. Second, the temporal scope of the study could be expanded. This research focused on the carbon sequestration efficiency of waterfront and non-waterfront green spaces along the Qinhuai New River during late summer and autumn; however, seasonal variations in rainfall, temperature, and sunlight can affect plant growth and, consequently, carbon sequestration performance. Third, the range of application scenarios could be enriched. This study only considered riverine waterfront areas and did not include other types of urban waterfronts, such as lakes. Future work could incorporate additional scenarios to deepen and broaden the study of water–green space interactions. Fourth, regarding simulation validation, tree parameters in the modeled scenarios were simplified to maintain variable uniformity, which is consistent with the carbon sequestration calculation method but inevitably neglects species- and structure-specific differences. Therefore, future research could build more detailed models based on actual field conditions and include comparisons with observed CO2 data to enhance the completeness and reliability of the study. Finally, given that the carbon sequestration efficiency indicator C already incorporates area weighting, P10–P30 may be somewhat correlated with total forest area, potentially leading to multicollinearity or information leakage. When interpreting model results, caution should be exercised, as the independent effects of local proportion indicators on carbon sequestration efficiency may be over- or underestimated. Future studies could consider strategies such as feature selection, principal component analysis, residual indicators, or regularization to mitigate the impact of multicollinearity on model interpretation, thereby optimizing feature usage and model construction.
5. Conclusions
Blue–green spaces serve as critical carbon sequestration carriers in cities, with waterfront green spaces being typical areas for water–green synergy. To investigate the impact of water–green spatial relationships on carbon sequestration efficiency in green spaces, this study took urban waterfront green spaces as the research object, constructed an index system for water–green spatial relationships, identified key factors influencing carbon sequestration efficiency through field measurements and Random Forest regression analysis, and further validated these key factors using scenario simulation. The main conclusions are as follows:
(1) Waterfront green spaces exhibit higher carbon sequestration efficiency compared to non-waterfront green spaces.
(2) Distance from water is a primary factor affecting the carbon sequestration efficiency of waterfront green spaces, with the proportion of 10 m forest land area (P10) and proportion of 10–20 m forest land area (P20) being the two most critical influencing factors.
(3) In the design of waterfront areas, green spaces should be prioritized within 10 m of the water’s edge, while enhancing shoreline complexity and maximizing green space depth.
(4) It is advisable to use high carbon-sequestering and water-tolerant trees and shrubs with balanced distribution in green spaces, avoiding strip planting as much as possible.
This study confirms the synergistic effect of water–green interactions on carbon sequestration efficiency, enriching research on carbon sink benefits of small-scale blue–green spaces. By identifying the water–green spatial relationship indicators affecting carbon sequestration, this research provides data support and theoretical references for the optimization and renewal of urban waterfront green spaces, contributing to the planning, design, and renewal of urban waterfront green spaces with high carbon sequestration as a goal.
