Abstract
Clarifying the role of density regulation in different stand types of Chinese fir (Cunninghamia lanceolata) is beneficial for sustainable management. Stand density management diagrams (SDMDs) can help in simulating thinning, regulating stand structure, and balancing timber yield. This study, conducted in Ganzhou City, a mid-subtropical region of China, used second-class forest resource survey plots dominated by Chinese fir, including 541 Chinese fir pure stands, 232 Chinese fir-conifer mixed stands, and 351 Chinese fir-broadleaf mixed stands. Equations for self-thinning, dominant height, and stand volume were constructed, and the SDMDs were subsequently developed to simulate two management scenarios: self-thinning and thinning. The results indicate that self-thinning relationships differ among Chinese fir stand types and that appropriate thinning can improve stand growth. Mixed stands, particularly Chinese fir–broadleaf mixed stands, showed greater growth potential at later stages, highlighting the role of species mixing in reducing competition and enhancing resource-use efficiency. The SDMDs developed in this study provide a practical tool for density regulation and silvicultural planning in Chinese fir plantations. However, being based on regional-scale growth models, the results mainly reflect regional conditions and should be further validated with long-term experiments.
1. Introduction
Forests are the largest terrestrial carbon reservoir, and their carbon sequestration rates and productivity are strongly influenced by stand structural regulation. Adjusting stand density to improve forest structure is an important measure to enhance productivity and carbon sink capacity, thereby contributing to forest quality improvement and ecological functions [1,2]. Appropriate stand density should be dynamically optimized according to developmental stage, species composition, and regional climate [3]. Compared to pure stands, which rely on heavy thinning to sustain growth during the rotation, mixed stands exhibit higher density adaptability, maintaining better growth even under higher densities [4]. Long-term experiments have shown that mixed stands retain higher structural stability and productivity in later developmental stages [5]. Previous studies further demonstrated that tree species diversity indirectly stabilizes productivity by optimizing stand structure [6], and density regulation can improve productivity in mixed stands [7]. Unlike initial decisions on species composition, density and structural regulation can be implemented at different stages of stand development, continuously influencing resource-use efficiency, productivity, ecosystem stability, and resilience [8]. Therefore, examining the effects of density regulation on stand productivity and structural optimization is crucial for developing scientifically sound forest management strategies.
As a quantitative silvicultural tool, the stand density management diagram (SDMD) has been widely applied in planning thinning intensity [9], carbon storage regulation, and density diagnosis [10]. With the growing role of mixed stands in sustainable forestry, some studies have attempted to integrate mixture degree into SDMDs to improve their applicability; however, the effect has proven negligible [11]. At the same time, increasing evidence indicates that mixed stands differ from pure stands in density–growth mechanisms [7,12]. Therefore, constructing and comparing SDMDs for different stand types, while linking them to stand structural factors, is essential for revealing their differential mechanisms and providing theoretical support for density regulation strategies across stand types.
Mixed stands generally outperform pure stands in terms of ecological functions and stability, yet their management theories and methods remain less developed due to the complexity of species composition and structure [13]. SDMDs provide an effective framework for simulating silvicultural regimes, exploring density–growth relationships, and optimizing stand management. Chinese fir (Cunninghamia lanceolata), the most important plantation species in subtropical China, is typically managed in pure stands that suffer from strong intraspecific competition and low resource-use efficiency. Structural regulations are thus necessary to improve both productivity and forest quality [14].
In this study, we focused on Ganzhou City, located in the mid-subtropical region of China, and classified Chinese fir–dominated plots into three stand types: Chinese fir pure stands, Chinese fir–conifer mixed stands, and Chinese fir–broadleaf mixed stands. For each stand type, we developed Reineke’s self-thinning model along with the dominant height and stand volume equation and drew SDMDs. We then compared the optimal density ranges and structural regulation mechanisms among these stand types. Specifically, we hypothesized that the natural self-thinning rule and growth equations differ among stand types, reflecting their divergent density regulation requirements, and that thinning improves stand growth and productivity relative to self-thinning stands. Guided by this hypothesis, this study addressed two scientific questions: (1) Do different Chinese fir stand types have distinct density regulation requirements? (2) Can appropriate thinning enhance stand growth and productivity? Based on these questions, we proposed two hypotheses.
2. Materials and Methods
2.1. Study Area and Data Source
The study area is located in Ganzhou City, China, which lies in the typical mid-subtropical humid climate zone of southern China. It extends from 24°29′ to 27°09′ N and from 113°54′ to 116°38′ E, covering a total area of 39,400 km2. The region has a mean annual temperature of 18–20 °C and an annual precipitation of 1400–1600 mm, characterized by a warm and humid subtropical monsoon climatec [15]. Ganzhou City is one of the major production areas of Chinese fir plantations in China. With a long cultivation history, Chinese fir plantations account for approximately 27% of the total forested area.
The plots data were obtained from the 2019 forest management inventory (second-class forest resource survey) database for Ganzhou City. Plots were systematically established on a 2 km × 2 km grid, with each plot being a fixed-area square of 0.08 ha (28.28 m × 28.28 m). The inventory database contains both individual-tree and plot-level data. For trees with DBH ≥ 5.0 cm, DBH at 1.3 m, species identity, and individual stem volume were recorded. Plot-level records included stand age and number of trees per hectare. To analyze the characteristics of density regulation among different Chinese fir stand types, we selected plots in which Chinese fir was the dominant species (stand volume of Chinese fir ≥ 65%). Stands with a Chinese fir volume proportion ≥ 90% were classified as Chinese fir pure stands (CF) [16]. Stands with a proportion from 65% to <90% were defined as mixed stands, and further divided into two types according to the main associated species: Chinese fir–broadleaf mixed stands (CFB) and Chinese fir–conifer mixed stands (CFC). Based on this classification, a total of 541 CF plots, 351 CFB plots, and 232 CFC plots were identified from the database. The basic characteristics of these plots are summarized in Table 1.

Table 1.
Characteristics of different Chinese fir stand types.
In the construction of SDMDs, dominant height is not only an indicator of stand developmental stage but also an auxiliary parameter for identifying volume regulation zones along different density trajectories, thereby improving the interpretability and applicability of SDMDs [17]. Since tree height was not directly measured in the second-class forest resource survey, we estimated tree height using DBH–height equations. In each plot, the mean height of the three tallest dominant trees was calculated as the stand dominant height. For all sample trees, Chinese fir was estimated using the equation of Chen et al. [18] (Equation (1)); coniferous species were estimated using the Masson pine equation of Du et al. [19] (Equation (2)); and broadleaved species were estimated using the Schima superba equation of Lin et al. [20] (Equation (3)):
where H is tree height (m), and DBH is diameter at breast height (cm).
To characterize stand developmental stage, we used the quadratic mean diameter (QMD), which we calculated as follows:
where QMD is the quadratic mean diameter (cm), n is the number of trees in the plot, and DBHi is the diameter at breast height (cm) of the i-th tree.
2.2. Model Construction Methods
2.2.1. Selection of Fully Stocked Plots
To adequately capture the optimal condition of tree competition and growth during the natural self-thinning process, fully stocked plots (i.e., stands at maximum density without further space for growth) were identified using the relative density method. Based on the stand maximum density theory by Reineke [21], we assumed the slope of the maximum density model to be −1.605 and fitted the intercept. Accordingly, the maximum stand density for each plot was calculated as:
where Nmax is the maximum stand density (trees·ha−1), QMD is the quadratic mean diameter (cm), and b is the model intercept.
To ensure that the self-thinning models for different stand types were constructed from fully stocked plots, the Relative Density was further calculated for each plot as:
where RD is the relative density, N is the stand density (trees·ha−1), and Nmax is the maximum stand density (trees·ha−1). Following the criterion of Solomon et al. [22], plots with RD > 0.7 were considered fully stocked stands.
2.2.2. Construction of the Self-Thinning Model
To analyze the self-thinning rule of different stand types, Reineke’s self-thinning model was fitted separately for each stand type. The self-thinning rule is a fundamental principle in forest ecology, describing the dynamic change in stand density under natural competition and providing a theoretical basis for density management [3]. Reineke’s model has been widely used to examine the relationship between stand density and tree growth. Its core lies in establishing a log–linear relationship between stand density and quadratic mean diameter, thereby revealing the growth characteristics of stands at maximum density. This model provides essential theoretical support for density regulation and thinning practices and has been validated in many studies [21,23,24]. In this study, regression fitting was conducted using the nonlinear least squares method (NLS). The model is expressed as:
where N is stand density (trees·ha−1), QMD is the quadratic mean diameter (cm), a0 is the slope and b0 is the intercept.
2.2.3. Construction of Dominant Height and Stand Volume Equations
To better capture the growth status of different stand types, dominant height and stand volume equations were incorporated into the SDMDs, in addition to the self-thinning model. These include the dominant height equation (Equation (8)) and the stand volume equation (Equation (9)) [24]. Both models were fitted using nonlinear least squares regression, expressed as:
where HD is dominant height (m), V is stand volume (m3·ha−1), QMD is the quadratic mean diameter (cm), N is stand density (trees·ha−1), and a1, a2, b1, b2, c1, c2 are parameters estimated by regression.
2.3. Model Evaluation
To assess the goodness of fit and predictive performance of the model, and to provide a basis for the construction of the SDMDs, this study evaluated each regression model using three metrics: adjusted R-squared (R2adj), root mean square error (RMSE), and mean absolute error (MAE).
2.4. Construction of Stand Density Management Diagrams
Based on the self-thinning rule, SDMDs were developed for each stand type of Chinese fir. The quadratic mean diameter (cm) was used as the x-axis and stand density (trees·ha−1) as the y-axis, with both axes plotted on a logarithmic scale. Following Vacchiano et al. [25] the maximum size–density line was determined by shifting the self-thinning model’s intercept upward to the upper 95% confidence limit, thus defining the maximum stand density. To ensure optimal growth within the optimum density range, the upper limit of optimum density was set at 60% of the maximum density, based on previous studies [9,26]. Accordingly, the upper and lower limits of the optimum density range, as well as the closure line, were set at 60%, 30%, and 20% of the maximum density, respectively, thus delineating the reference zones for stand regulation. In addition, the dominant height equation and stand volume equation were linearized and superimposed on the SDMDs to illustrate how stand structural attributes respond to changes in density, thereby providing auxiliary decision support for silvicultural practices. Furthermore, based on the maximum density line and optimum density range, management scenarios were designed to compare changes in stand volume growth across different stand types (self-thinning and thinning). The self-thinning model was fitted using the lmodel2 [27] package, all statistical analyses were conducted in R 4.2.1, and figures were prepared using Origin 2021.
3. Results
3.1. Results and Evaluation of the Self-Thinning Models
Based on the criterion of RD > 0.7, fully stocked plots were selected, including 149 plots of Chinese fir pure stands, 25 plots of Chinese fir–conifer mixed stands, and 86 plots of Chinese fir–broadleaf mixed stands (Figure 1). The fitted slopes of the self-thinning models were −1.557 for Chinese fir pure stands, −1.468 for Chinese fir–conifer mixed, and −1.372 for Chinese fir–broadleaf mixed stands. The R2adj were 0.799, 0.715, and 0.740 for the three stand types, respectively. The RMSE ranged from 0.140 to 0.176, while MAE ranged from 0.118 to 0.140. These results indicate that the models adequately described the self-thinning relationships of different stand types.
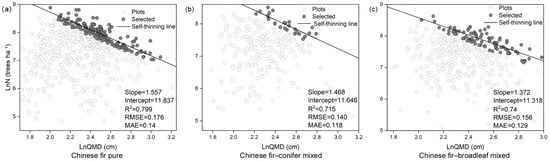
Figure 1.
Self-thinning lines fitted for different stand types and the most fully stocked plots used for model fitting. (a) Chinese fir pure stands; (b) Chinese fir–conifer mixed stands; (c) Chinese fir–broadleaf mixed stands.
Based on Reineke’s self-thinning models for different stand types, the maximum density line, the optimum density upper limit (60% of maximum), the optimum density lower limit (30% of maximum), and the closure line (20% of maximum) were calculated (Table 2). The results indicated that density thresholds varied among stand types: the intercept value was highest for Chinese fir pure stands and lower for mixed stands, reflecting differences in stand structure and self-thinning dynamics.
Table 2.
Parameters of stand density control lines.
3.2. Dominant Height and Stand Volume Equations
The dominant height and stand volume equations were fitted for different stand types of Chinese fir, and the parameter estimates are shown in Table 3. For the dominant height equations, all parameters were highly significant (p < 0.001). Across stand types, R2adj ranged from 0.817 to 0.998. Both RMSE and MAE were small, indicating good fits and reliable performance. These equations are therefore suitable for constructing SDMDs.
Table 3.
Parameter estimates of dominant height and stand volume equations for different stand types.
3.3. Stand Density Management Diagrams
Based on the self-thinning equations together with the dominant height and stand volume equations, SDMDs were developed for Chinese fir pure, Chinese fir–broadleaf mixed, and Chinese fir–conifer mixed stands (Figure 2). The quadratic mean diameter (QMD, cm) is shown on the x-axis and stand density (N, trees·ha−1) on the y-axis, on logarithmic scales.

Figure 2.
Stand density management diagrams for Chinese fir pure (a), and Chinese fir–conifer mixed (b), Chinese fir–broadleaf mixed stands (c). The x-axis represents quadratic mean diameter (QMD, cm) and the y-axis represents stand density (N, trees·ha−1), both plotted on logarithmic scales.
In the SDMDs, the green lines represent the maximum density line, the optimum density upper limit (60% of maximum), the optimum density lower limit (30% of maximum), and the closure line (20% of maximum), delineating the reference zones for density regulation. The orange dashed lines are stand volume, and the blue lines are dominant height. These lines, obtained from the fitted equations, illustrate how stand structure and productivity vary along the density changes.
3.4. Simulated Management Scenarios of Different Stand Types of Chinese Fir
Under the same initial conditions (QMD = 10 cm, stand density = 2000 trees·ha−1), two management scenarios were simulated using the SDMDs to compare stand production at a final QMD of 40 cm (Figure 3): (1) No management (0→I→III→V): when stand density exceeded the optimum density upper limit, increased intraspecific competition was assumed to cause self-thinning, and stand density declined along the 60% line; and (2) Thinning (0→I→II→III→IV→V): whenever stand density reached the upper limit of the optimum density range, thinning was applied to reduce density to just above the lower limit, thereby keeping stands within the optimum density range over the long term.
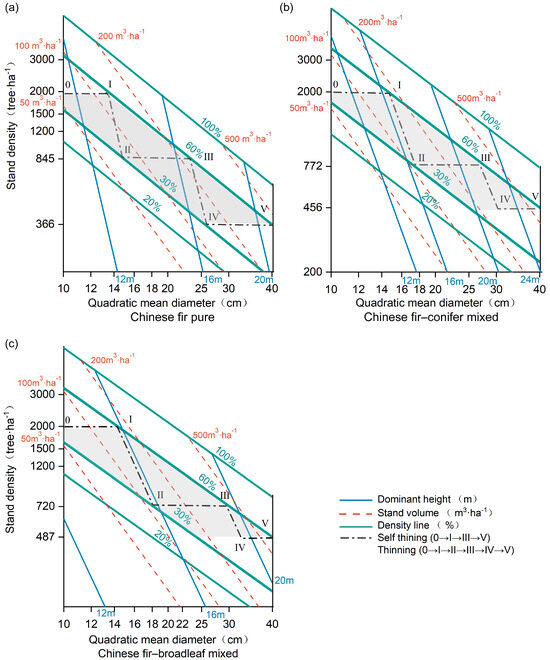
Figure 3.
Simulated stand density management diagrams (SDMDs) for Chinese fir pure (a), Chinese fir–conifer mixed (b), and Chinese fir–broadleaf mixed stands (c) under alternative management scenarios. The shaded area represents the optimum density range.
The results (Table 4) showed that under the no-management scenario, exceeding the density limit led to natural mortality and substantial growing stand volume losses. At the final stage, cumulative volume losses were 432.09 m3·ha−1 for Chinese fir–broadleaf mixed stands, 453.80 m3·ha−1 for Chinese fir–conifer mixed stands, and 302.91 m3·ha−1 for pure stands.
Table 4.
Results of no management scenarios (self-thinning) for different stand types of Chinese fir.
Under the appropriate thinning scenario (Table 5), stands were maintained within the optimum density range, self-thing was reduced, and mixed stands consistently showed higher stand volumes than pure stands. Notably, in the IV→V stage, the volume of Chinese fir–broadleaf mixed stands eventually surpassed that of Chinese fir–conifer mixed stands. At the final stage (QMD = 40 cm), the final stand volume was 618.78 m3·ha−1 for Chinese fir–broadleaf mixed stands, 605.72 m3·ha−1 for Chinese fir–conifer mixed stands, and 434.46 m3·ha−1 for pure stands.
Table 5.
Results of thinning scenario for different stand types of Chinese fir.
4. Discussion
4.1. Self-Thinning Models of Different Chinese Fir Stand Types
This study used the Reineke self-thinning model to analyze the self-thinning patterns of subtropical Chinese fir under different stand types. The intercept of the self-thinning line varies among species, but the slope is generally stable. Reineke [21] reported a slope of about –1.605 for the log relationship between tree size and density, whereas Yoda [28] suggested a value of –1.500. These values have been widely applied across forest types. Here, the fitted slopes for fully stocked plots were –1.557 in pure stands, –1.468 in Chinese fir–conifer mixed stands, and –1.372 in Chinese fir–broadleaf mixed stands, all close to the theoretical values, confirming the model’s applicability to subtropical Chinese fir forests. The slopes of mixed stands were smaller than those of pure stands, meaning that for the same diameter growth, density declined more slowly. This may result from higher maximum density in mixed stands, where niche complementarity and vertical stratification improve resource use, reduce competition, and slow self-thinning [29]. A similar trend was observed in Europe, where Pretzsch and Biber [30] found that European beech (Fagus sylvatica) had a much smaller slope in mixture with Norway spruce (Picea abies) than in pure stands, showing slower self-thinning. This agrees with our finding of smaller slopes in Chinese fir–broadleaf mixed stands, indicating a general pattern of slower self-thinning in mixed stands across regions and species. By contrast, Han et al. [31] found in southeastern China that mixing mainly raised the intercept of the self-thinning line, while the slope stayed close to Reineke’s value. Thus, whether through slope reduction or intercept elevation, mixing increases stand carrying capacity and delays self-thinning, highlighting the role of structural diversity in enhancing stand stability and sustained growth.
From the perspective of tree species composition, Chinese fir–broadleaf mixed stands exhibit a high mixing degree, spatial uniformity, and compositional complexity, resembling subtropical climax communities [32]. Such characteristics confer greater structural stability and ecological restoration potential, making them a target stand structure advocated by close-to-nature silviculture [33]. Thus, differences in self-thinning patterns among Chinese fir stand types not only reflect differences species composition but also provide a theoretical basis for diversified management strategies. For density regulation, following Vacchiano [25], the optimum density zone was defined as 30%–60% of the maximum density line. West et al. [34], based on self-thinning trajectories of Eucalyptus obliqua and other species, further suggested that stand trajectories often converge toward a common intersection point. Although derived through different approaches, both highlight the natural upper limits of stand density and provide theoretical support for constructing SDMDs.
4.2. Comparison of Management Potential Based on Density Regulation
At all developmental stages, mixed stands maintained higher stand densities than pure stands. Simulation results showed that volume loss under unmanaged scenarios followed the order: Chinese fir–broadleaf mixed > Chinese fir–conifer mixed > Chinese fir pure stands, indicating that while natural self-thinning occurs, density regulation is more critical in mixed stands. In mortality models for Chinese fir in this region, previous studies have confirmed that higher canopy cover and basal area intensify competition and increase mortality [35]. Excessive density triggers negative density dependence, suppressing growth and raising mortality, with latitudinal variation observed globally [36]. In pure stands, high density mainly intensifies intraspecific competition [37]. In mixed stands, although interspecific complementarity exists, imbalance in density control can still limit growth due to uneven resource allocation and greater structural complexity [31]. According to Solomon et al. [22], once stand density exceeds a threshold, self-thinning becomes an unavoidable regulatory mechanism. Therefore, maintaining stand density within an optimal range to balance short-term growth and long-term volume accumulation is essential for sustainable management.
In the study area, Chinese fir plantations usually undergo one or two thinning operations at early and middle stages to improve light conditions and adjust stand density. Under reasonable thinning scenarios, mixed stands—particularly Chinese fir–broadleaf mixed stands—showed stronger volume growth in later stages, highlighting their advantages for long-term management. This trend is supported by other studies. Castedo-Dorado et al. [17] developed a density management diagram for radiata pine in Spain and found that moderate thinning improved stand stability and promoted volume growth. Similarly, long-term thinning experiments in typical European mixed stands (e.g., Picea abies, Pinus sylvestris, Fagus sylvatica) showed that moderate thinning reduces density stress, releases growth resources, promotes sustained growth of dominant trees, and maintains higher carbon stocks [38]. These findings align with our results, suggesting that moderate thinning and species mixing are broadly effective across regions and species. Long-term observations by Guillaume et al. [39] further showed that 40% thinning intensity significantly enhanced dominant tree growth, particularly in mixed stands. In addition, site improvements in mixed stands provide a foundation for later growth. Subtropical studies have shown that the introduction of broadleaf species into conifer stands accelerates litter decomposition, increases soil organic carbon and nitrogen, enhances microbial activity, and significantly improves nutrient cycling [40]. In Chinese fir plantations, adding broadleaf species such as Michelia macclurei or Mytilaria laosensis also improves soil stability and resistance to erosion [41]. These improvements provide a solid ecological basis for mixed stands to maintain long-term productivity, build high-quality forests, and achieve sustainable management, in line with the principles of close-to-nature management.
Overall, pure stands tend to stagnate in growth and carbon accumulation at middle and late stages due to intensified intraspecific competition and gradual soil nutrient and structural decline [42]. In contrast, mixed stands benefit from species complementarity and site improvement, maintaining higher productivity and carbon sequestration potential. For example, a global meta-analysis found that aboveground carbon stocks in mixed planted forests were on average 70% higher than in monocultures and 77% higher than in commercial monocultures [43]. Thus, Chinese fir pure stands and mixed stands differ in management goals. For pure stands, studies show that moderate thinning in early to middle stages can significantly alter stand structure and maturation. Proper density regulation reduces intraspecific competition and supports efficient cultivation of either short-rotation timber or large-diameter wood, making it suitable for short-cycle production forests [44]. Mixed stands, however, benefit from complementarity throughout the rotation, achieving 7%–53% higher productivity, 3%–36% higher leaf area index, and up to 31% greater radial growth efficiency, while showing higher resource-use efficiency at the same density [4]. In summary, under proper density control and thinning regimes, Chinese fir–broadleaf mixed stands can exhibit greater volume growth in later stages due to density advantage, site improvement, and complementarity, thereby supporting higher productivity and stability of Chinese fir forests. However, the SDMD is a stand-level average model that does not capture individual-tree variation, and its application in management practice should therefore be complemented by tree-level considerations.
5. Conclusions
This study developed stand density management diagrams (SDMDs) for Chinese fir pure stands, Chinese fir–conifer mixed stands, and Chinese fir–broadleaf mixed stands in the mid-subtropical region of China. The results demonstrate that stand types differ in their density regulation patterns, with mixed stands showing greater benefits from appropriate thinning than pure stands. In particular, Chinese fir–broadleaf mixed stands exhibited the strongest long-term growth potential, underscoring the importance of species mixing in enhancing stand productivity and resilience. These findings highlight the need for stand type–specific density regulation strategies, rather than a uniform approach. The SDMDs constructed here provide a practical tool for guiding thinning regimes and structural adjustments in Chinese fir plantations, supporting the transition toward close-to-nature management. Future work should focus on validating these models through long-term experimental studies and refining management strategies to optimize species composition and thinning intensity for sustainable plantation development under changing environmental conditions.
Author Contributions
Conceptualization, Y.G., X.O. and P.P.; methodology, Y.G. and X.O.; visualization, Y.G. and J.L.; writing—original draft preparation, Y.G.; writing—review and editing, P.P. and C.L.; supervision, P.P.; funding acquisition, X.O. and P.P. All authors have read and agreed to the published version of the manuscript.
Funding
This study was financially supported by the National Natural Science Foundation of China (grant Nos. 32360389 and 32260392) and the Natural Science Foundation of Jiangxi Province (20232BAB215048).
Data Availability Statement
The data that support the findings of this study are available from the corresponding author upon reasonable request.
Acknowledgments
We sincerely thank all the field investigators for their contributions to data collection.
Conflicts of Interest
The authors declare no conflicts of interest.
References
- Ali, A. Forest stand structure and functioning: Current knowledge and future challenges. Ecol. Indic. 2019, 98, 665–677. [Google Scholar] [CrossRef]
- Noormets, A.; Epron, D.; Domec, J.C.; McNulty, S.G.; Fox, T.; Sun, G.; King, J.S. Effects of forest management on productivity and carbon sequestration: A review and hypothesis. For. Ecol. Manag. 2015, 355, 124–140. [Google Scholar] [CrossRef]
- Chivhenge, E.; Ray, D.G.; Weiskittel, A.R.; Woodall, C.W.; D’Amato, A.W. Evaluating the development and application of stand density index for the management of complex and adaptive forests. Curr. For. Rep. 2024, 10, 133–152. [Google Scholar] [CrossRef]
- Pretzsch, H.; Schütze, G. Tree species mixing can increase stand productivity, density and growth efficiency and attenuate the trade-off between density and growth throughout the whole rotation. Ann. Bot. 2021, 128, 767–786. [Google Scholar] [CrossRef]
- Semper, C.C.; Zobel, J.M.; Scherer, S.S.; Reinikainen, M.R.; Russell, M.B.; Gifford, T.S.; Windmuller-Campione, M.A. The perfect pairing: Early stand dynamics in conventional aspen and mixedwood forests in Northern Minnesota, USA. J. For. 2025, 123, 547–569. [Google Scholar] [CrossRef]
- Wang, T.; Dong, L.; Liu, Z. Stand structure is more important for forest productivity stability than tree, understory plant and soil biota species diversity. Front. For. Glob. Change 2024, 7, 1354508. [Google Scholar] [CrossRef]
- Thurm, E.A.; Pretzsch, H. Growth–density relationship in mixed stands—Results from long-term experimental plots. For. Ecol. Manag. 2021, 483, 118909. [Google Scholar] [CrossRef]
- Del Río, M.; Bravo-Oviedo, A.; Pretzsch, H.; Löf, M.; Ruiz-Peinado, R. A review of thinning effects on Scots pine stands: From growth and yield to new challenges under global change. For. Syst. 2017, 26, R3S. [Google Scholar] [CrossRef]
- Li, Y.; Niu, Q.; Meng, J. Development of stand density management diagram for carbon storage management for Masson Pine plantations. For. Res. 2024, 37, 136–145. [Google Scholar] [CrossRef]
- Long, J.N.; Shaw, J.D. A density management diagram for even-aged Sierra Nevada mixed-conifer stands. West. J. Appl. For. 2012, 27, 187–195. [Google Scholar] [CrossRef]
- Askarieh, A.; Ruano, I.; Bravo, F. Is it needed to integrate mixture degree in stand density management diagram (SDMD)? iForest Biogeosci. For. 2023, 16, 274–281. [Google Scholar] [CrossRef]
- Yang, S.; Brandeis, T.J. Estimating maximum stand density for mixed-hardwood forests among various physiographic zones in the eastern US. For. Ecol. Manag. 2022, 521, 120420. [Google Scholar] [CrossRef]
- Forrester, D.I. The spatial and temporal dynamics of species interactions in mixed-species forests: From pattern to process. For. Ecol. Manag. 2014, 312, 282–292. [Google Scholar] [CrossRef]
- Mo, X.; Lu, J.; Lin, J.; Huo, C.; Zhang, W. The effect of mixed plantations on Chinese fir productivity: A meta-analysis. Forests 2025, 16, 105. [Google Scholar] [CrossRef]
- Mao, S.; Ouyang, X.; Pan, P.; Zhu, T.; Zheng, Y. Basal area growth model of Pinus massoniana forest based on mixed effect. Acta Agric. Univ. Jiangxiensis 2025, 47, 980–991. [Google Scholar] [CrossRef]
- Meng, X. Forest Mensuration, 3rd ed.; China Forestry Publishing House: Beijing, China, 2006; p. 45. [Google Scholar]
- Castedo-Dorado, F.; Crecente-Campo, F.; Alvarez-Alvarez, P.; Barrio-Anta, M. Development of a stand density management diagram for radiata pine stands including assessment of stand stability. Forestry 2009, 82, 1–16. [Google Scholar] [CrossRef]
- Chen, C.; Si, F. Tree height-diameter models of Chinese fir plantations in Dagangshan, Jiangxi Province. For. Sci. Technol. 2018, 11, 16–18. [Google Scholar] [CrossRef]
- Du, Z.; Gan, S. Height-diameter models for Cunninghamia lanceolata and Pinus massoniana based on BP neural network. Cent. South For. Invent. Plan. 2017, 36, 36–39. [Google Scholar] [CrossRef]
- Lin, H. Comparison and selection of the basal tree models for optimum tree height curve of Schima superb. J. Fujian For. Sci. Technol. 2018, 45, 103–107. [Google Scholar] [CrossRef]
- Reineke, L.H. Perfecting a stand-density index for even-aged forests. J. Agric. Res. 1933, 46, 627–638. [Google Scholar]
- Solomon, D.S.; Zhang, L. Maximum size-density relationships for mixed softwoods in the northeastern USA. For. Ecol. Manag. 2002, 155, 163–170. [Google Scholar] [CrossRef]
- Pretzsch, H.; Biber, P. Fertilization modifies forest stand growth but not stand density: Consequences for modelling stand dynamics in a changing climate. For. Int. J. For. Res. 2022, 95, 187–200. [Google Scholar] [CrossRef]
- Xu, X.; Lyu, Y.; Wang, J. Density management diagrams for Larix gmelinii plantations in Daxing’an Mountains. Nat. Prot. Areas 2023, 4, 79–88. [Google Scholar]
- Vacchiano, G.; Derose, R.J.; Shaw, J.D.; Svoboda, M.; Motta, R. A density management diagram for Norway spruce in the temperate European montane region. Eur. J. For. Res. 2013, 132, 535–549. [Google Scholar] [CrossRef]
- Gyenge, J.; Lupi, A.; Ferrere, P.; Milione, G.; Martínez-Meier, A.; Caballé, G.; Daguer, D.D.; Fernández, M.E. Stand density management diagrams of Eucalyptus viminalis: Predicting stem volume, biomass and canopy cover for different production purposes. Cerne 2019, 25, 463–472. [Google Scholar] [CrossRef]
- Legendre, P.; Oksanen, J. Package ‘lmodel2’: Model II Regression. R Package Version 1.7-4. 2024. Available online: https://cran.r-project.org/web/packages/lmodel2/index.html (accessed on 30 September 2025).
- Yoda, K. Self-thinning in overcrowded pure stands under cultivated and natural conditions (Intraspecific competition among higher plants XI). J. Biol. Osaka City 1963, 14, 107–129. [Google Scholar]
- Morin, X.; Toigo, M.; Fahse, L.; Guillemot, J.; Cailleret, M.; Bertrand, R.; Cateau, E.; de Coligny, F.; García Valdés, R.; Ratcliffe, S.; et al. More species, more trees: The role of tree packing in promoting forest productivity. J. Ecol. 2025, 113, 371–386. [Google Scholar] [CrossRef]
- Pretzsch, H.; Zenner, E.K. Toward managing mixed-species stands: From parametrization to prescription. For. Ecosyst. 2017, 4, 19. [Google Scholar] [CrossRef]
- Han, Y.; Wang, B.; Sun, H. Effects of species mixing on maximum size-density relationships in Chinese fir (Cunninghamia lanceolata (Lamb.) Hook.)-dominated mixed forests converted from even-aged pure stands. Front. Plant Sci. 2024, 15, 1342307. [Google Scholar] [CrossRef]
- Qian, P.; Han, Y.; Li, X.; Jin, S. Ecological benefits and structure of mixed vs. pure forest plantations in subtropical China. Forests 2025, 16, 738. [Google Scholar] [CrossRef]
- Wang, L.; Wei, F.; Tagesson, T.; Fang, Z.; Svenning, J. Transforming forest management through rewilding: Enhancing biodiversity, resilience, and biosphere sustainability under global change. One Earth 2025, 8, 101195. [Google Scholar] [CrossRef]
- West, P.W.; Ratkowsky, D.A. Do stands self-thin through a common point? An additional concept for the self-thinning rule. Forests 2025, 16, 199. [Google Scholar] [CrossRef]
- Liu, J.; Ouyang, X.; Pan, P.; Ning, J.; Guo, Y. Modeling stand mortality of Chinese fir plantations in subtropical China using mixed-effects zero-inflated negative binomial models. For. Ecol. Manag. 2024, 565, 122016. [Google Scholar] [CrossRef]
- LaManna, J.A.; Mangan, S.A.; Alonso, A.; Bourg, N.A.; Brockelman, W.Y.; Bunyavejchewin, S.; Chang, L.; Chiang, J.; Chuyong, G.B.; Clay, K.; et al. Plant diversity increases with the strength of negative density dependence at the global scale. Science 2017, 356, 1389–1392. [Google Scholar] [CrossRef]
- Versace, S.; Garfì, V.; Dalponte, M.; Febbraro Mirko, D.; Frizzera, L.; Gianelle, D.; Tognetti, R. Species interactions in pure and mixed-species stands of silver fir and European beech in Mediterranean mountains. iForest Biogeosci. For. 2021, 14, 3476. [Google Scholar] [CrossRef]
- Pretzsch, H.; Hilmers, T. Structural diversity and carbon stock of forest stands: Tradeoff as modified by silvicultural thinning. Eur. J. For. Res. 2024, 144, 775–796. [Google Scholar] [CrossRef]
- Moreau, G.; Auty, D.; Pothier, D.; Shi, J.; Lu, J.; Achim, A.; Xiang, W. Long-term tree and stand growth dynamics after thinning of various intensities in a temperate mixed forest. For. Ecol. Manag. 2020, 473, 118311. [Google Scholar] [CrossRef]
- Gao, W.; Lin, G.; Yan, Y.; Zheng, Z.; Zheng, Q. Effects of broad-leaved cultivation on soil carbon and nitrogen transformation in Pinus massoniana plantation. J. Nanjing Norm. Univ. 2025, 48, 63–72. [Google Scholar] [CrossRef]
- Tang, L.; Mao, L.; Wang, Z.; Ye, S.; Wang, S. Mixed with broadleaf tree species improved soil aggregate stability in Chinese fir (Cunninghamia lanceolata) plantations: Based on the le bissonnais method. J. Soil Sci. Plant Nut. 2023, 23, 2110–2121. [Google Scholar] [CrossRef]
- West, P.W. A review of the growth behaviour of stands and trees in even-aged, monospecific forest. Ann. For. Sci. 2024, 81, 34. [Google Scholar] [CrossRef]
- Warner, E.; Cook-Patton, S.C.; Lewis, O.T.; Brown, N.; Koricheva, J.; Eisenhauer, N.; Ferlian, O.; Gravel, D.; Hall, J.S.; Jactel, H.; et al. Young mixed planted forests store more carbon than monocultures-a meta-analysis. Front. For. Glob. Change 2023, 6, 1226514. [Google Scholar] [CrossRef]
- Sun, K.; Sun, H.; Lu, G.; Fang, L.; Wan, Z.; Tan, Z. Study on the effects of stand density management of Chinese fir plantation in Northern China. Front. Plant Sci. 2023, 14, 1130299. [Google Scholar] [CrossRef] [PubMed]
Disclaimer/Publisher’s Note: The statements, opinions and data contained in all publications are solely those of the individual author(s) and contributor(s) and not of MDPI and/or the editor(s). MDPI and/or the editor(s) disclaim responsibility for any injury to people or property resulting from any ideas, methods, instructions or products referred to in the content. |
© 2025 by the authors. Licensee MDPI, Basel, Switzerland. This article is an open access article distributed under the terms and conditions of the Creative Commons Attribution (CC BY) license (https://creativecommons.org/licenses/by/4.0/).