Article

Variation in Functional Traits of Woody Plants Across Successional Stages in Subtropical Forests

1
Key Laboratory of Forest Ecology and Environment of National Forestry and Grassland Administration, Ecology and Nature Conservation Institute, Chinese Academy of Forestry, Beijing 100091, China
2
Key Laboratory of Geospatial Technology for the Middle and Lower Yellow River Regions, The College of Geography and Environmental Science, Henan University, Kaifeng 475004, China
*
Author to whom correspondence should be addressed.
Forests 2025, 16(5), 868; https://doi.org/10.3390/f16050868
Submission received: 21 April 2025 / Revised: 15 May 2025 / Accepted: 20 May 2025 / Published: 21 May 2025

Abstract

Variation patterns in plant functional traits and their interrelationships play a crucial role in understanding species coexistence mechanisms and ecological differentiation within local plant communities. However, the dynamic patterns of plant functional traits across different forest successional stages remain insufficiently understood. Here, we investigated the woody species composition of subtropical evergreen–deciduous broadleaved mixed forest across 75 plots, representing three successional stages (20-year-old secondary forest, 35-year-old secondary forest, and old-growth forest (>80 years)), in Xingdoushan and Mulinzi National Nature Reserves, Hubei Province, Central China. We measured four functional traits of woody plants: leaf area (LA), specific leaf area (SLA), leaf dry matter content (LDMC), and wood density (WD). For each different age plant community, we calculated (1) species abundance-weighted mean community trait values, and (2) species-level mean trait values. We applied trait gradient analysis to partition and assess correlations of four functional traits across communities of different successional stages, separating within-community (α components) and between-community (β components) variation. To quantify the extent to which environmental constraints influence trait expression, we used the ecological constraint index (Ci). The results revealed significant variation in the four functional traits across communities at different successional stages. Community-level mean LA and SLA decreased significantly with age, WD increased significantly with age, and there was no significant relationship between LDMC and age. The α trait components consistently varied more widely than β components at different successional stages, indicating that biological competition dominates the assembly of local forest communities across various successional stages. Correlations between the four functional traits were dynamically adjusted with the study scale (community-level and species-level) and forest age. The ecological constraints on the four functional traits varied significantly across forest successional stages, with SLA being subject to the strongest constraints. Our findings reveal that biotic competition predominantly shapes community assembly during the succession of subtropical evergreen–deciduous broadleaved mixed forests, while stronger ecological filtering in old-growth stands underscores their role in maintaining ecosystem stability. These insights support more effective conservation and restoration strategies.

1. Introduction

Trait-based approaches are widely used in community ecology for exploring the plants of ecological strategies, community assembly, and relationship between biodiversity and ecosystem functioning [1,2,3]. Attention to functional traits arises from their capacity to reveal the mechanisms by which organisms adapt to and interact with their environment [4,5,6,7]. The variation in plant functional traits reflects differences in individual physiological functions and adaptive strategies to the environment, while the correlation structure among these traits offers insights into plant functional diversity and the processes underlying community assembly [8,9,10,11]. Some studies indicated that the plant functional traits which exhibit strong correlations at regional and global scales may still be decoupled at a local scale, thereby contributing to plant ecological differentiation among plants and their coexistence [12,13,14,15]. Therefore, investigating the distribution of plant functional traits and their associations at the local scale can provide valuable insights into patterns of plant differentiation and the mechanisms underlying species coexistence. This, in turn, can provide a scientific basis for developing local strategies for forest conservation and vegetation restoration.
Plant functional traits embody the outcomes of ecological and evolutionary processes shaping community assembly [16]. Their role in mediating community assembly and species coexistence has long been a central focus of ecological research [17]. Indeed, community assembly has been primarily attributed to two key ecological processes: environmental filtering and limiting similarity [18,19,20]. Environmental filtering reflects the responses of plant species to prevailing abiotic conditions [21,22,23], while limiting similarity emphasizes the role of biotic interactions, such as interspecific competition, in shaping community structure [24,25,26]. Species composition within communities is typically shaped by the combined effects of environmental filtering and biotic competition. Since the introduction of trait gradient analysis (TGA) by Ackerly and Cornwell (2007) [12], inferring the relative influence of these two processes from patterns of trait variation has become a key approach in understanding community assembly. TGA links species’ mean traits to environmental gradients by decomposing them into within-site (α) and between-site (β) components [12]. When interspecific competition is strong within a community, species tend to partition ecological niches along multiple functional strategy axes, resulting in greater dispersion of the within-site (α) components of functional traits. When environmental gradients between communities are pronounced, strong environmental filtering acts on community composition, resulting in greater dispersion of the between-site (β) components of functional traits. Testing variation and correlation with α and β components of different functional traits contributes to understanding of community assembly mechanism and the species coexistence [8].
While TGA illustrates the response of species traits to environmental gradients, it does not assess the extent to which ecological constraints, driven by environmental factors, influence trait expression along these gradients [27]. To address this, based on the theoretical framework of TGA, Ottaviani et al. (2018) [27] developed new parameters, namely the ecological constraint index (Ci), to quantify the effects of ecological constraints on trait expression. This index captures the cumulative effect of both biotic and abiotic forces on the expression of species’ traits. The subtropical evergreen–deciduous broadleaf mixed forest is a representative vegetation type in the subtropical regions of China. Characterized by its complex structure, high productivity, and rich biodiversity, it plays a critical role in maintaining regional ecological stability and contributing to the global carbon balance [28,29,30]. Numerous studies have investigated this forest type using trait-based approaches to better understand its structure and function [31,32,33]. However, few have systematically applied this framework to study functional trait variation and associations across different successional stages in subtropical evergreen–deciduous broadleaf mixed forests.
In this study, we investigated four plant functional traits—leaf area (LA), specific leaf area (SLA), leaf dry matter content (LDMC), and wood density (WD)—of woody plants across 75 forest dynamics plots (0.04 ha each) in two nature reserves in Hubei Province, China. These plots represented subtropical forest types of different successional stages: 20-year-old secondary forest, 35-year-old secondary forest, and old-growth forest (>80 years). We integrated trait gradient analysis and an ecological constraint index with correlation analysis to explore the variation and associations of functional traits among species at different stand ages. Specifically, we sought to address the following questions: (a) How do functional traits vary across subtropical evergreen and deciduous broadleaved mixed forests at different stand ages? (b) What are the patterns of plant functional trait variation and association within and between communities? (c) How does trait expression respond to ecological constraints (biotic and abiotic) at different stand ages?

2. Methods

2.1. Study Sites

This study was conducted primarily in two adjacent national nature reserves in Enshi, Hubei Province, Central China—Xingdou Mountain (29°57′–30°10′ N, 108°57′–109°27′ E) and Mulinzi Mountain (29°55′–30°10′ N, 109°59′–110°17′ E). Situated in the transitional zone between the central and northern subtropics, the region experiences a typical continental monsoon climate. The dominant vegetation is subtropical evergreen–deciduous broadleaved mixed forest. The area receives an average annual precipitation of approximately 1500 mm, with a mean annual temperature of around 12 °C. The dominant soil types are yellow-brown soil, brown soil, and yellow soil. Seventy-five permanent forest dynamics plots (20 m × 20 m) were randomly established in the Xingdou and Mulinzi Montane National Nature Reserves, located in Hubei Province, central China, following the protocol of the Forest Global Earth Observatory (ForestGEO; https://forestgeo.si.edu/, accessed on 8 July 2013). These plots span an elevation gradient from 900 to 1800 m and encompass three distinct successional stages of subtropical evergreen–deciduous broadleaved mixed forest: 20-year-old secondary forest (20SF), 35-year-old secondary forest (35SF), and old-growth forest (>80 years) (OF), with 25 plots allocated to each category. Each forest dynamics plot included all standing woody stems (trees, shrubs, and lianas) with a DBH (diameter at breast height) of at least 1 cm, which were tagged, measured, and identified to species level. All woody plant species names were verified against the Flora of China (https://www.iplant.cn/foc, accessed on 8 July 2024).

2.2. Functional Trait Measurements

We evaluated four functional traits—LA, SLA, WD, and LDMC—which are widely regarded as key indicators of plant performance and reflective of species’ life-history strategies [5,34,35,36]. In each 20 m × 20 m plot, species with fewer than 10 individuals were fully sampled, while for common species, more than 10 individuals were sampled. For each sampled individual, two to five mature and healthy leaves were selected. The fresh weight of the leaves was measured immediately after collection in the field. After being dried in an oven at 80 °C for 48 h, the dry weight was then measured (using the same device). LA (cm2) was determined using a LICOR 3100C leaf area meter (LI-COR, Lincoln, NE, USA). LDMC (g/g) was obtained by dividing the dry weight of a leaf by its fresh weight. SLA (cm2/g) was calculated as the ratio of leaf surface area to its dry weight. To minimize damage to sampled individuals, WD (g/cm3) was measured using branch segments (1–2 cm in diameter) rather than extracting tree cores. After removing the bark, the fresh volume was determined using the water displacement method, and the dry mass was recorded after oven-drying the samples at 70 °C for 72 h [37].

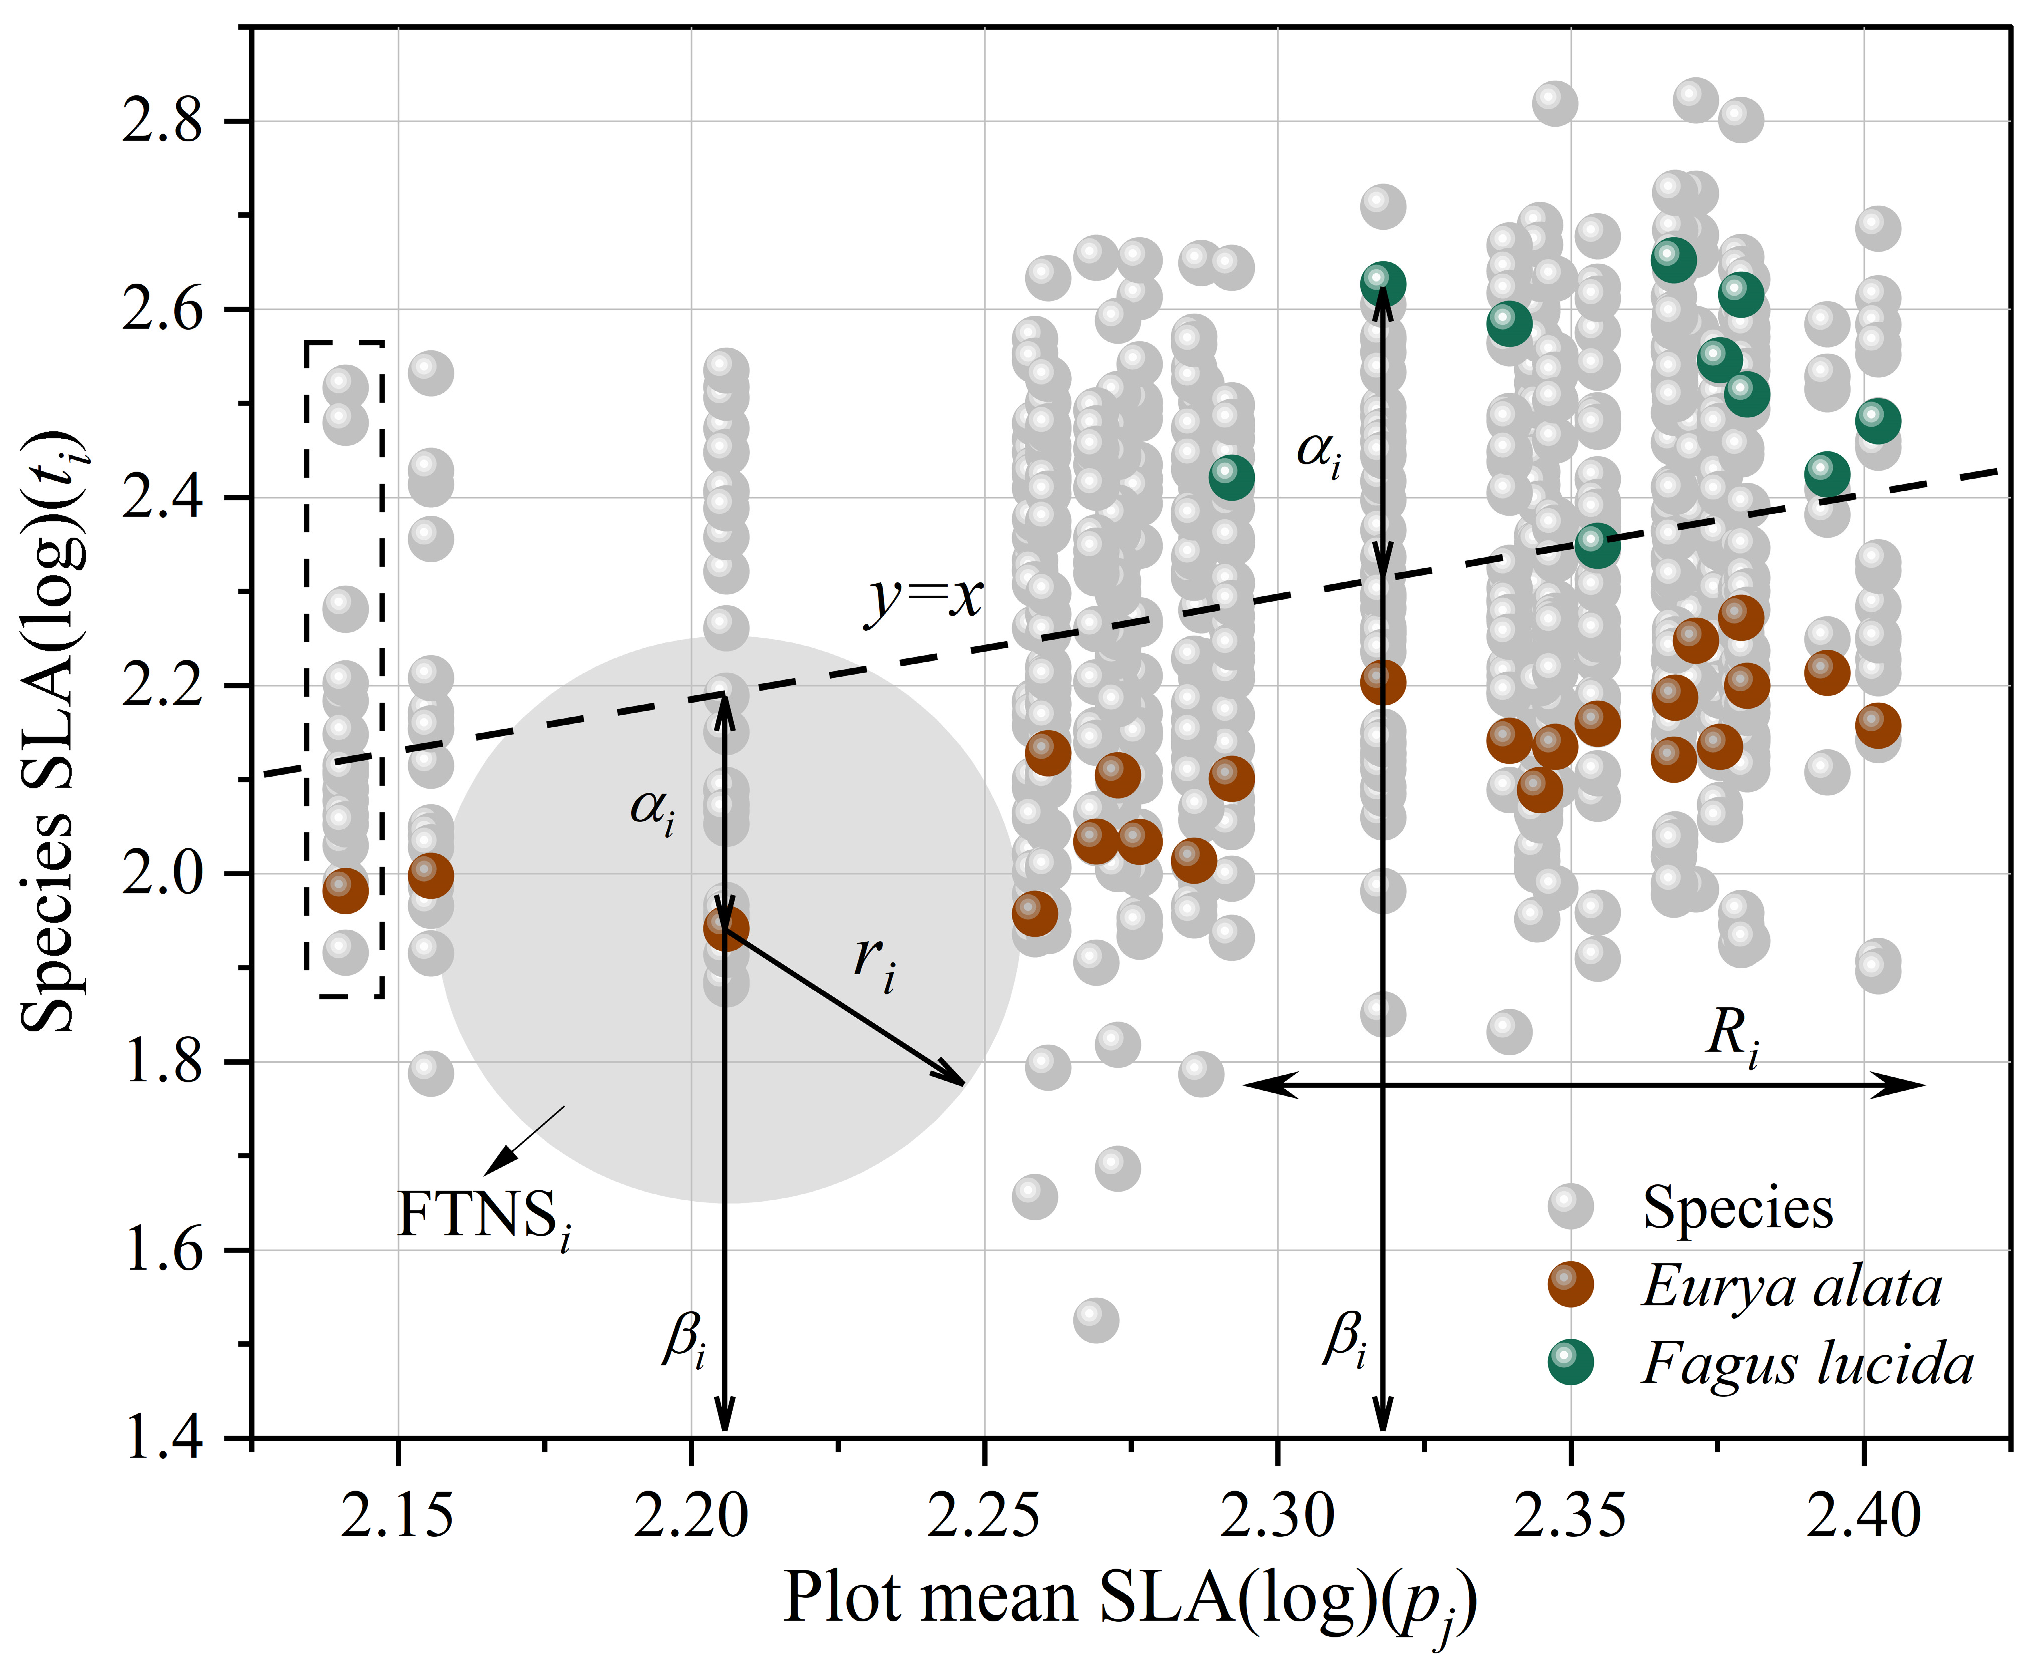
2.3. Trait Gradient Analysis

Trait gradient analysis (TGA) was used to partition species trait values into two components: alpha, representing variation within plots, and beta, capturing variation among different plots [12].
For each plot, a weighted average of trait values was calculated across all resident species. These plots were then ordered along a continuum defined by these weighted averages, resulting in the trait gradient illustrated in Figure 1—the core output of TGA. In this framework, the beta component (β) corresponds to the mean position of each species along the x-axis, representing how species respond to environmental variation across communities. In contrast, the alpha component (α) captures the deviation of trait values within a site, indicating the diversity of adaptive strategies among coexisting species under the same local environmental conditions. These computed as follows:
p j = i = 1 s a i j · t i j / i = 1 s a i j
t i = j = 1 n a i j · t i j / j = 1 n a i j
β i = j = 1 n p j · a i j / j = 1 n a i j
α i = t i β i
where pj is the weighted average trait value for each plot, ti is species mean trait values, βi is mean of plot means for plots occupied by each species (beta components), tij is the trait value for species i in plot j, aij is the abundance for species i in plot j, the total number of plots for each stand age in the study is n, and the species richness of plot j is s.
We illustrated the trait gradient analysis using log10-transformed SLA. We chose two dominant woody species (Fagus lucida and Eurya alata) in old-growth forest for illustration. First, the weighted-average trait value of SLA (pj) was calculated for each plot. Then, these plots were arranged along a gradient according to the weighted average trait value of SLA, forming Figure 1 (the ‘trait gradient’ of TGA).

2.4. Ecological Constraint Index

Based on the theoretical and methodological framework of TGA, Ottaviani et al. (2018) [27] developed a new index: ecological constraint index. The ecological constraint index is used to quantify the average effect of ecological forces on a species’ trait expression. A greater value indicates a stronger influence of ecological forces, which computed as follows:
F T N S i = α i · β i
r i = F T N S i / π 2
C i = β i / α i
FTNSi (functional trait niche space) refers to the average functional space that a species can occupy within a given system along a trait—environment gradient (Figure 1, outlined by the gray circle). It represents a two-dimensional, single-trait functional space specific to species Si along this gradient. The variable ri denotes the mean trait range of species Si.

2.5. Data Analysis

To meet the assumption of normality, all functional traits were log10-transformed prior to analysis. Differences in trait values among groups were assessed using one-way analysis of variance (ANOVA). Additionally, Pearson’s correlation coefficients (r) were computed to evaluate relationships among functional traits at both the species and community levels. Linear regression analyses were conducted separately at the species and community levels to examine the associations between functional traits and stand age. Data are expressed as mean ± SE, with p < 0.05 considered statistically significant. Analyses were performed in R 4.2.1 using the lm function for linear regressions.

3. Results

3.1. Functional Trait Variation Among Forests of Different Stand Ages

At the species level, the 20-year-old secondary forest exhibited the highest average values for LA (96.5 ± 253.15 cm2), LDMC (0.33 ± 0.08 g/g), and SLA (511.23 ± 186.45 cm2/g). In contrast, the greatest average WD value (0.52 ± 0.11 g/cm3) was observed in the old-growth forest (Table 1). SLA of woody plants differed significantly among stand ages (20, 35 years, and old-growth; p < 0.05), while LA and LDMC showed no significant differences. WD was also significantly different between the 20-year-old secondary forest and the other age classes (p < 0.05). Moreover, with increasing stand age, SLA exhibited a significant decreasing trend (p < 0.01), while WD showed a significant increasing trend (p < 0.01). In contrast, LA and LDMC did not show significant changes (Figure 2A).
At the community level, the 20-year-old secondary forest also exhibited the highest average values of LA (90.01 ± 47.18 cm2), LDMC (0.34 ± 0.03 g/g), and SLA (500.62 ± 101.67 cm2/g). In contrast, the highest average WD (0.55 ± 0.02 g/cm3) was still observed in the old-growth forest (Table 1). Meanwhile, with the increase in stand age, both LA and SLA showed a significant decreasing trend (p < 0.01), while WD exhibited a significant increasing trend (p < 0.01). LDMC, however, did not show a significant change (Figure 2B).

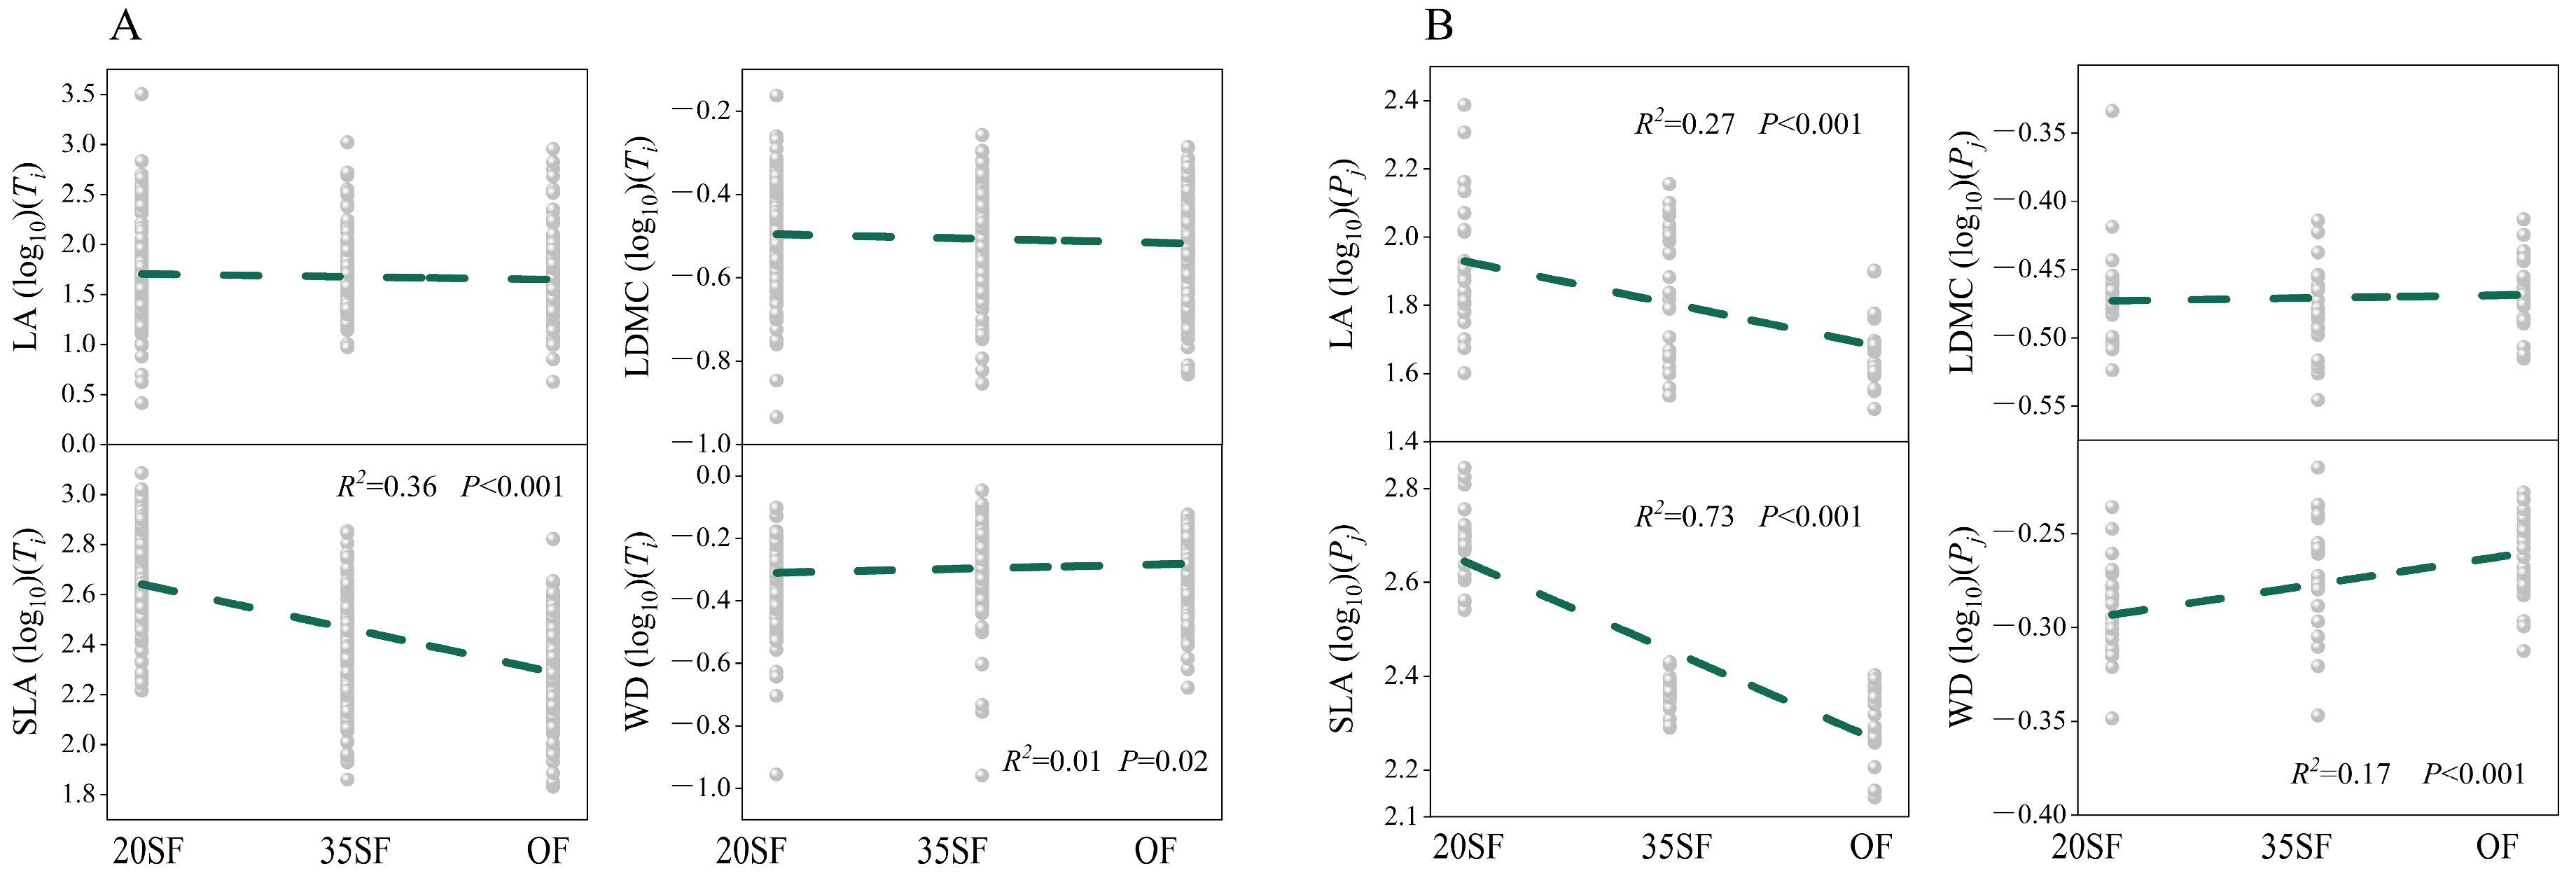
3.2. Correlations for Pairwise Combinations of Functional Traits and Distribution Characteristics of Alpha (α) and Beta (β) Components

At both the species and community levels across the three successional stages (Figures S1–S3), WD was consistently negatively correlated with LA and SLA, and positively correlated with LDMC. LDMC also exhibited strong negative correlations with both LA and SLA, while the relationship between LA and SLA was the weakest and showed no consistent pattern. Furthermore, the correlations between WD and leaf traits (LA, SLA, and LDMC) were more pronounced in the old-growth forest. Meanwhile, the correlations among pairwise combinations of alpha (α) trait components were stronger than those among beta (β) components.
The distribution patterns of the alpha (α) and beta (β) components of functional traits differed (Figures S4 and S5). Across all four functional traits and successional stages, the range of α values was consistently greater than that of the β values. Moreover, α trait values of woody species exhibited relatively consistent distributions across different stand ages, while β values were more variable and widely dispersed.

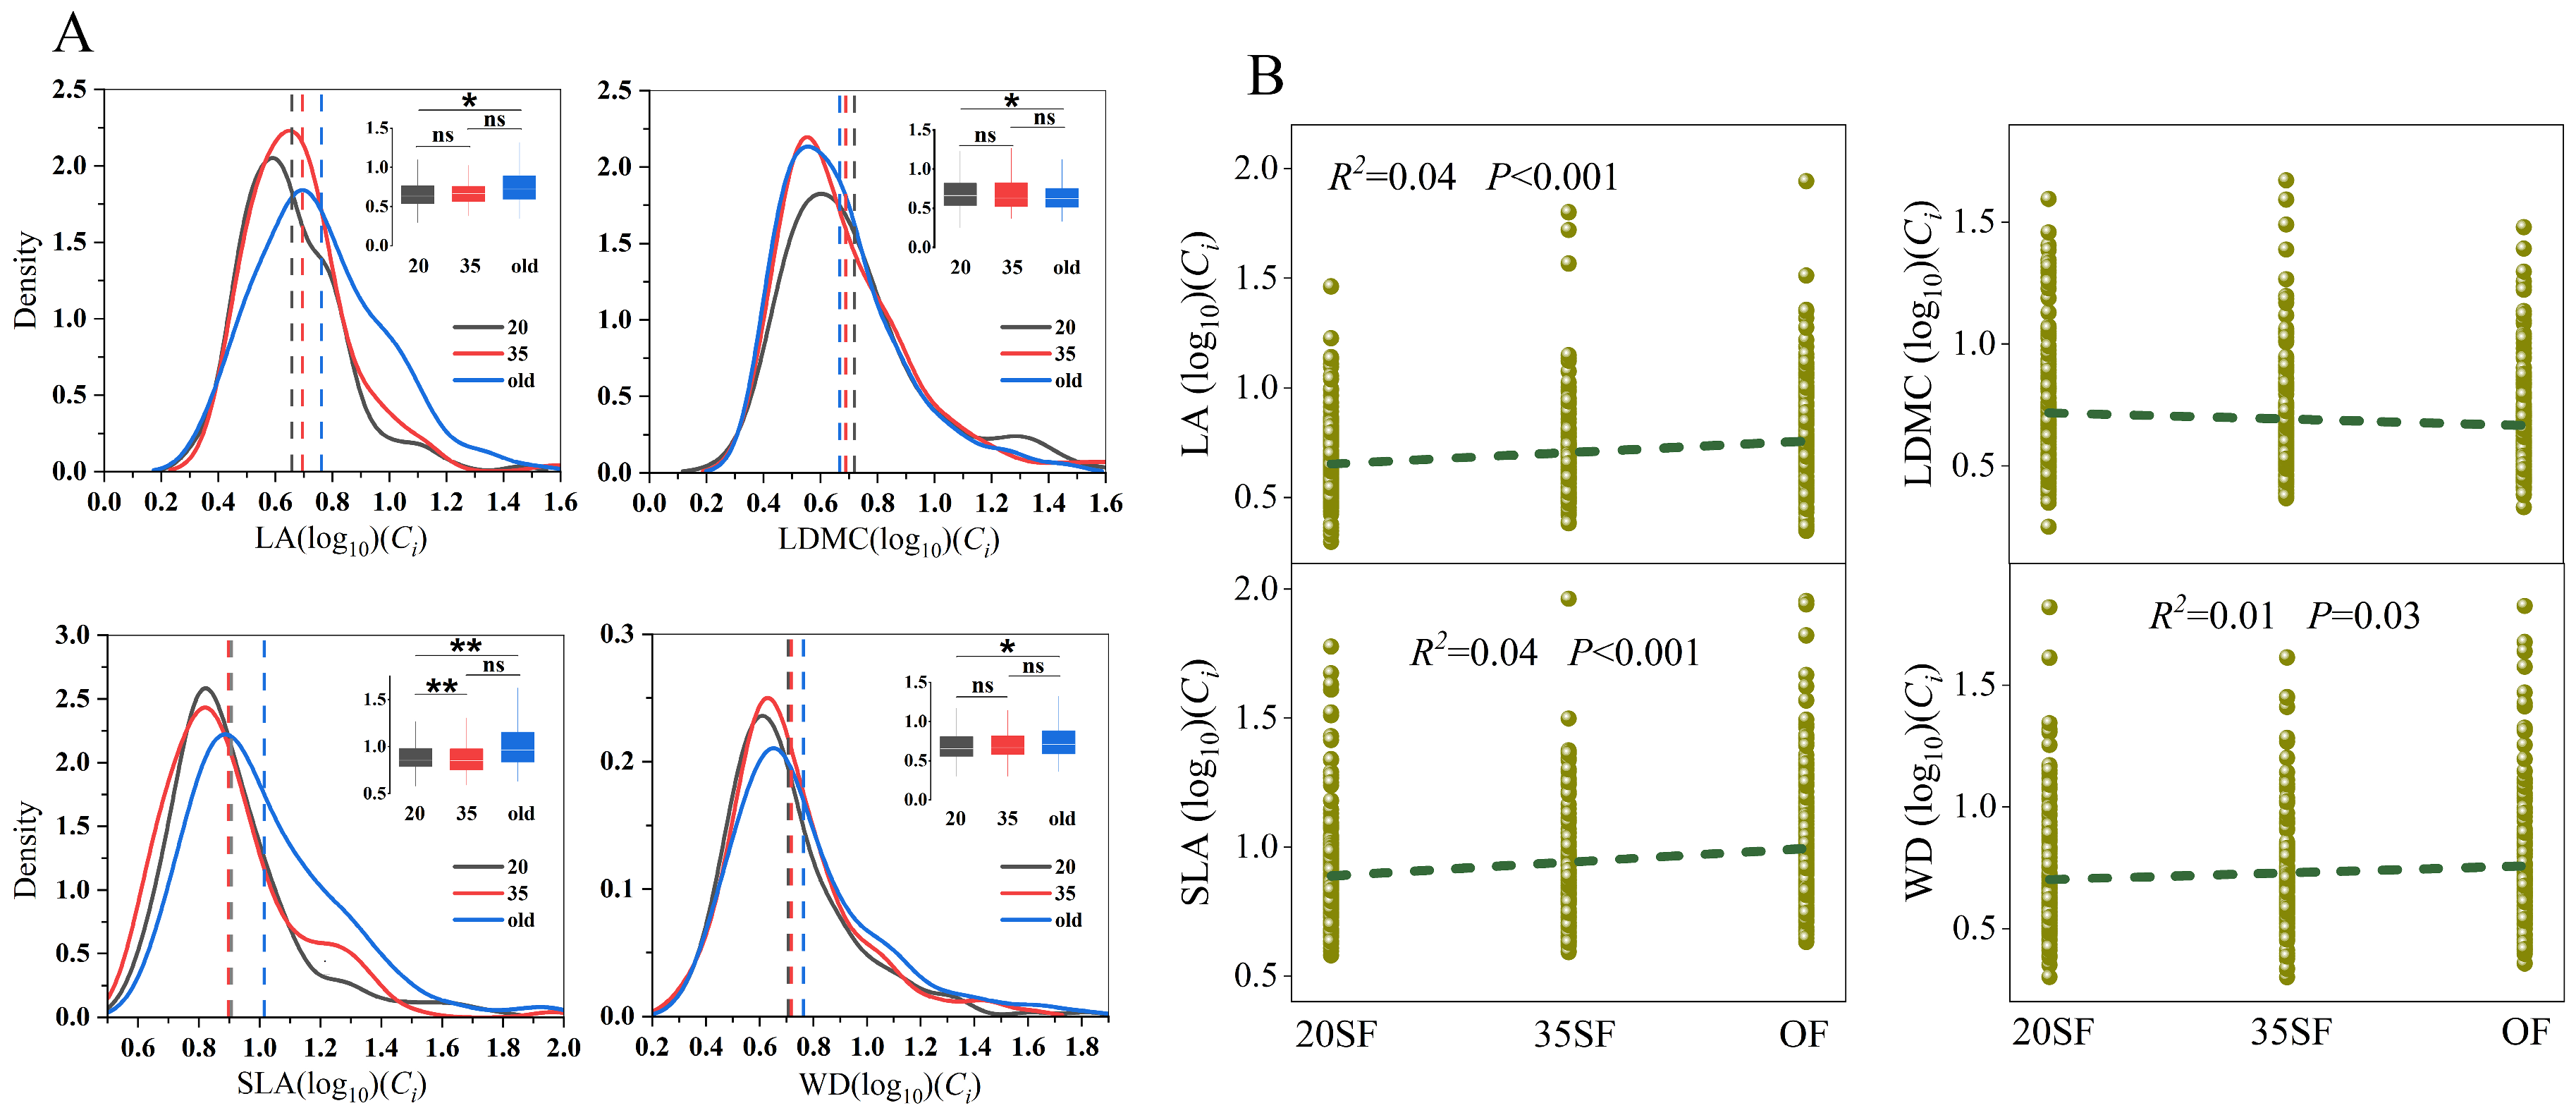
3.3. Distribution Characteristics of the Ecological Constraint Index (Ci)

Significant differences in the ecological constraint index (Ci) for the four functional traits were observed across different stand ages, particularly between the 20-year-old secondary forest and the old-growth forest (Figure 3A). With increasing stand age, the ecological constraint index (Ci) of LA showed a slightly increasing but significant trend (p < 0.01), while that of SLA exhibited a slightly decreasing yet significant trend (p < 0.01). In contrast, the Ci values of LDMC and WD showed no significant correlation with stand age (Figure 3B). The distribution of the ecological constraint index (Ci) for the four functional traits was more consistent across different stand ages. For most woody species, the Ci values of LA, LDMC, and WD were generally lower than that of SLA at all stand ages.

4. Discussion

In forest ecosystems, a limited range of species trait values is frequently seen as a sign of habitat filtering [22,38]. The integration of morphology and function related to the local symbiotic environment (soil and climate conditions) leads to stronger trait correlations but reduces trait breadth at the landscape (beta) scale [8]. Indeed, species that share similar traits tend to be filtered into habitats along abiotic gradients [39,40]. However, at local scales (α), a wider range of trait variation may indicate the presence of various mechanisms that allow species to coexist [41,42]. Variations in functional traits at both the species and community levels can reflect different adaptive strategies to environmental changes. The differences we observed were clearly influenced by the plant species sampled, emphasizing the significance of considering multiple levels (species and communities) in such studies [14]. This study focused on inter-species trait variation in the context of community assembly, rather than examining phenotypic variation within species.

4.1. Variation in Functional Traits at the Species and Community Levels Across Different Stand Ages

Our findings showed that functional traits (LA, LDMC, SLA, WD) of woody plant species varied significantly across different stand ages at both the species and community levels in subtropical evergreen–deciduous broadleaf mixed forests. At the species level, only SLA exhibited a significant relationship with stand age. At the community level, LA, SLA, and WD all demonstrated significant relationships with stand age. In contrast, leaf traits at the community level exhibited stronger correlations with stand age than those at the species level. This could be because community traits more effectively capture the true structure of the community [43,44]. As stand age increases and forest density rises within the community, a decrease in leaf area (LA) may occur. Simultaneously, with the gradual decline in light availability and a reduction in the community’s photosynthetic capacity, specific leaf area (SLA) may also decrease [45]. As the community shifts from an acquisitive to a conservative type, WD gradually increases. Additionally, the similarity in local environmental conditions, such as temperature and humidity, leads to minimal variation in leaf respiratory consumption [46], which in turn results in no significant changes in LDMC as stand age increases.
Species mean functional traits were partitioned into alpha components (within-site) and beta components (between-site) based on TGA. The distribution characteristics of these components indicated different coexistence strategies, providing insights into community assembly [8,12]. Alpha trait values capture the variation between the functional traits of individual species and the community’s mean functional traits, shedding light on the influence of biological competition on community assembly. In contrast, beta trait values reflect a species’ position along a trait gradient defined by the community’s average functional traits, emphasizing the role of habitat filtering in shaping community structure [12]. We observed that, regardless of stand age, the variation in alpha values of functional traits exhibited a broader range than that in beta values. This suggests that the variation in species’ functional traits (LA, SLA, LDMC, and WD) within a site is more pronounced than between sites, indicating that the interactions among coexisting species communities at different stand ages are stronger than the influence of environmental factors on species traits [47,48].

4.2. Relationships for Pairwise Combinations of Functional Traits at Different Stand Ages

Plant functional traits do not function independently; they are closely interconnected and work together to adapt to changes in the external environment [49]. Previous research has demonstrated that although functional traits often show strong correlations at regional and global scales, they can become decoupled at the local scale [12,50]. For instance, while a significant positive correlation between LA and SLA was observed at regional and global scales [13,51], such a correlation was either negative or nonexistent at the community level [52,53]. The variations in correlations between different functional traits at various scales can be attributed to differences in community types, species composition, and other local factors. These differences give rise to independent axes of ecological differentiation and coexistence [54]. Our results indicated that the variation in the relationships for pairwise combinations of functional traits at different stand ages differed significantly across species and community levels. There was a weak correlation between WD and SLA at the species level in the 20-year-old secondary forest, which might be due to the lack of correlation in the alpha components. However, the correlation gradually strengthened with increasing stand age. Regardless of the species or community level, the correlations between LA and SLA were weak across different stand ages. These results are consistent with a previous study by Baraloto et al. (2010) [55], which suggests that LA and SLA represent different ecological strategy dimensions at local scales, and therefore, do not necessarily correlate with stand age. Furthermore, the correlations between pairwise combinations of functional traits showed dynamic changes with increasing stand age. This indicates that the correlation structure between these traits continuously adjusts to meet the needs of community species in response to biotic and abiotic environmental factors. However, contrary to earlier studies [8], the correlations across species in this study predominantly arose from the alpha component (Figures S1–S3), rather than the beta component. This further suggests that biological competition has a greater impact on community composition than environmental filtering in local communities.

4.3. Ecological Constraints on Functional Trait Expression Across Different Stand Ages

Assessing the impact of ecological constraints on trait expression and diversity enhances our understanding of the processes underlying community assembly [27]. Our results indicated that the ecological constraint index (Ci) of LA, SLA, and WD showed a slight but significant increase with stand age. This suggests that these traits are more ecologically constrained in older forests [45]. With increasing stand age, forest density gradually increased, leading to a progressive decline in light availability, which may have caused the convergence of LA and SLA expression [45,56]. WD increased with stand age, indicating that resources were gradually being compressed and environmental constraints became progressively stronger [57]. While LDMC (Ci) was not significantly correlated with increasing stand age, this may be because local environmental variations were not sensitive enough to impose strong ecological constraints on LDMC expression [58]. Meanwhile, significant differences in ecological constraints on functional traits were observed only over longer stand age intervals, but not over shorter ones. This suggests that environmental constraints on functional traits operate as a long-term process. Furthermore, the ecological constraint values (Ci) of SLA for most species across different stand age communities were higher than those of LA, LDMC, and WD, indicating that SLA is more susceptible to local ecological constraints.

5. Conclusions

By employing trait gradient analysis, plant functional traits were separated into alpha (within-community) and beta (among-community) components to explore how environmental gradients and competition affect trait variation across different stand ages. At the community level, LA, SLA and WD exhibited significant correlations with stand age, indicating that community-level traits more accurately reflect ecological reality. The relationships among these functional traits across different stand ages displayed dynamic changes, reflecting adaptive strategies of plant communities in response to biotic and abiotic environmental conditions. Meanwhile, the alpha trait components consistently varied more widely than beta components at different successional stages, indicating that biological competition dominates the assembly of local forest communities across various successional stages. Furthermore, ecological constraints on functional trait expression varied with stand age development, with SLA demonstrating particularly strong environmental dependence in later successional stages. Our study highlights that the functional traits of forest community species change with increasing stand age, contributing to a more comprehensive understanding of community assembly in subtropical regions. Our research provides valuable insights into the assembly processes of subtropical evergreen–deciduous broadleaved mixed forest and supports the development of age-specific, trait-based strategies for their restoration and management.

Supplementary Materials

The following supporting information can be downloaded at https://www.mdpi.com/article/10.3390/f16050868/s1, Figure S1: Scatterplots of species mean trait values (ti), plot-mean trait values (pj), species alpha trait values (αi), and species beta trait values (βi) are shown for pairwise combinations of leaf area (log10), specific leaf area (log10), leaf dry matter content (actual), and wood density (actual) in a 20-year secondary forest. Correlation coefficients (r) are indicated; Figure S2: Scatterplots of species mean trait values (ti), plot-mean trait values (pj), species alpha trait values (αi), and species beta trait values (βi) are shown for pairwise combinations of leaf area (log10), specific leaf area (log10), leaf dry matter content (actual), and wood density (actual) in a 35-year secondary forest. Correlation coefficients (r) are indicated; Figure S3: Scatterplots of species mean trait values (ti), plot-mean trait values (pj), species alpha trait values (αi), and species beta trait values (βi) are shown for pairwise combinations of leaf area (log10), specific leaf area (log10), leaf dry matter content (actual), and wood density (actual) in an old-growth forest. Correlation coefficients (r) are indicated; Figure S4: The frequency distribution of α-values for the functional trait. k indicates the degree of skewness in species-level values: k < 0 indicates a right-skewed distribution, while k > 0 indicates a left-skewed distribution relative to the mean. The dotted line represents the mean; Figure S5: The frequency distribution of β-values for the functional trait. k indicates the degree of skewness in species-level values: k < 0 indicates a right-skewed distribution, while k > 0 indicates a left-skewed distribution relative to the mean. The dotted line represents the mean.

Author Contributions

C.S.: Writing—original draft, Visualization. J.Y.: Methodology, Writing. Y.H.: Data curation, Investigation. R.Z.: Conceptualization, Supervision. All authors have read and agreed to the published version of the manuscript.

Funding

This work was supported by the China–EU international cooperation project of the National Key Research and Development Program of China [2023YFE0112801].

Data Availability Statement

The original contributions presented in the study are included in the article and Supplementary Materials, further inquiries can be directed to the corresponding author.

Acknowledgments

We gratefully acknowledge the invaluable contributions of the field researchers and assistants whose data collection efforts made this study possible.

Conflicts of Interest

The authors declare no conflicts of interest.

References

  1. Nock, C.A.; Vogt, R.J.; Beisner, B.E. Functional Traits. eLS 2016, 1, 1–8. [Google Scholar]
  2. Laurans, M.; Munoz, F.; Charles-Dominique, T.; Heuret, P.; Fortunel, C.; Isnard, S.; Sabatier, S.-A.; Caraglio, Y.; Violle, C. Why incorporate plant architecture into trait-based ecology? Trends Ecol. Evol. 2024, 39, 524–536. [Google Scholar] [CrossRef] [PubMed]
  3. Laughlin, D.C. Unifying functional and population ecology to test the adaptive value of traits. Biol. Rev. 2024, 99, 1976–1991. [Google Scholar] [CrossRef]
  4. Roscher, C.; Gubsch, M.; Lipowsky, A.; Schumacher, J.; Weigelt, A.; Buchmann, N.; Schulze, E.-D.; Schmid, B. Trait means, trait plasticity and trait differences to other species jointly explain species performances in grasslands of varying diversity. Oikos 2018, 127, 865. [Google Scholar] [CrossRef]
  5. Vandewalle, M.; de Bello, F.; Berg, M.P.; Bolger, T.; Dolédec, S.; Dubs, F.; Feld, C.K.; Harrington, R.; Harrison, P.A.; Lavorel, S.; et al. Functional traits as indicators of biodiversity response to land use changes across ecosystems and organisms. Biodivers. Conserv. 2010, 19, 2921–2947. [Google Scholar] [CrossRef]
  6. Liu, X.; Ma, K. Plant Functional Traits—Concepts, Applications and Future Directions. Sci. Sin. Vitae 2015, 45, 325–339. [Google Scholar] [CrossRef]
  7. de Bello, F.; Lavorel, S.; Hallett, L.M.; Valencia, E.; Garnier, E.; Roscher, C.; Conti, L.; Galland, T.; Goberna, M.; Májeková, M.; et al. Functional trait effects on ecosystem stability: Assembling the jigsaw puzzle. Trends Ecol. Evol. 2021, 36, 822–836. [Google Scholar] [CrossRef]
  8. Kooyman, R.; Cornwell, W.; Westoby, M. Plant functional traits in Australian subtropical rain forest: Partitioning within-community from cross-landscape variation. J. Ecol. 2010, 98, 517–525. [Google Scholar] [CrossRef]
  9. Dong, L.-W.; Ren, Z.-W.; Zhang, R.; Xie, C.-D.; Zhou, X.-L. Functional diversity rather than species diversity can explain community biomass variation following short-term nitrogen addition in an alpine grassland. Chin. J. Plant Ecol. 2022, 46, 871–881. [Google Scholar] [CrossRef]
  10. He, N.; Li, Y.; Liu, C.; Xu, L.; Li, M.; Zhang, J.; He, J.; Tang, Z.; Han, X.; Ye, Q.; et al. Plant Trait Networks: Improved Resolution of the Dimensionality of Adaptation. Trends Ecol. Evol. 2020, 35, 908–918. [Google Scholar] [CrossRef]
  11. Ramachandran, A.; Dee, L.; Hayden, M.; Suding, K. Leveraging plant functional traits in the design of nature-based solutions: A research agenda. J. Ecol. 2024, 112, 2492–2501. [Google Scholar] [CrossRef]
  12. Ackerly, D.D.; Cornwell, W.K. A trait-based approach to community assembly: Partitioning of species trait values into within- and among-community components. Ecol. Lett. 2007, 10, 135–145. [Google Scholar] [CrossRef] [PubMed]
  13. Ackerly, D.; Knight, C.; Weiss, S.; Barton, K.; Starmer, K. Leaf size, specific leaf area and microhabitat distribution of chaparral woody plants: Contrasting patterns in species level and community level analyses. Oecologia 2002, 130, 449–457. [Google Scholar] [CrossRef]
  14. Bruelheide, H.; Dengler, J.; Purschke, O.; Lenoir, J.; Jiménez-Alfaro, B.; Hennekens, S.M.; Botta-Dukát, Z.; Chytrý, M.; Field, R.; Jansen, F.; et al. Global trait-environment relationships of plant communities. Nat. Ecol. Evol. 2018, 2, 1906–1917. [Google Scholar] [CrossRef]
  15. Westerband, A.C.; Knight, T.M.; Barton, K.E. Scale-dependent variation in leaf functional traits clarifies mechanisms of invasion. Ecography 2025, e07539. [Google Scholar] [CrossRef]
  16. Mori, A.S.; Isbell, F.; Cadotte, M.W. Assessing the importance of species and their assemblages for the biodiversity-ecosystem multifunctionality relationship. Ecology 2023, 104, e4104. [Google Scholar] [CrossRef]
  17. He, Y.-Y.; Guo, S.-L.; Wang, Z. Research progress of trade-off relationships of plant functional traits. Chin. J. Plant Ecol. 2019, 43, 1021–1035. [Google Scholar] [CrossRef]
  18. Stubbs, W.J.; Wilson, J.B. Evidence for Limiting Similarity in a Sand Dune Community. J. Ecol. 2004, 92, 557–567. [Google Scholar] [CrossRef]
  19. Freschet, G.T.; Dias, A.T.C.; Ackerly, D.D.; Aerts, R.; van Bodegom, P.M.; Cornwell, W.K.; Dong, M.; Kurokawa, H.; Liu, G.; Onipchenko, V.G.; et al. Global to community scale differences in the prevalence of convergent over divergent leaf trait distributions in plant assemblages. Glob. Ecol. Biogeogr. 2011, 20, 755–765. [Google Scholar] [CrossRef]
  20. Huang, L.; Pan, X.; Ma, J.; Jian, R.; Zhang, H.; Bai, K.; Mo, Y.; Zhang, Q.; Yang, Z. Assembly of understory woody communities during the close-to-nature restoration of a Pinus massoniana lamb. plantation in the southern subtropical region of China: From environmental filtering to competitive exclusion. For. Ecol. Manag. 2023, 541, 121060. [Google Scholar] [CrossRef]
  21. Kraft, N.J.B.; Adler, P.B.; Godoy, O.; James, E.C.; Fuller, S.; Levine, J.M.; Fox, J. Community assembly, coexistence and the environmental filtering metaphor. Funct. Ecol. 2014, 29, 592–599. [Google Scholar] [CrossRef]
  22. Denelle, P.; Violle, C.; Munoz, F. Distinguishing the signatures of local environmental filtering and regional trait range limits in the study of trait–environment relationships. Oikos 2019, 128, 960–971. [Google Scholar] [CrossRef]
  23. Cai, L.; Kreft, H.; Denelle, P.; Taylor, A.; Craven, D.; Dawson, W.; Essl, F.; van Kleunen, M.; Pergl, J.; Pyšek, P.; et al. Environmental filtering, not dispersal history, explains global patterns of phylogenetic turnover in seed plants at deep evolutionary timescales. Nat. Ecol. Evol. 2025, 9, 314–324. [Google Scholar] [CrossRef]
  24. Schwilk, D.W.; Ackerly, D.D. Limiting similarity and functional diversity along environmental gradients. Ecol. Lett. 2005, 8, 272–281. [Google Scholar] [CrossRef]
  25. Li, Y.; Mo, Y.-X.; Cui, H.-L.; Zhang, Y.-J.; Dossa, G.G.O.; Tan, Z.-H.; Song, L. Intraspecific plasticity and co-variation of leaf traits facilitate Ficus tinctoria to acclimate hemiepiphytic and terrestrial habitats. Tree Physiol. 2024, 44, tpae007. [Google Scholar] [CrossRef]
  26. Cadotte, M.W. The interacting influences of competition, composition and diversity determine successional community change. J. Ecol. 2023, 111, 1670–1680. [Google Scholar] [CrossRef]
  27. Ottaviani, G.; Tsakalos, J.L.; Keppel, G.; Mucina, L. Quantifying the effects of ecological constraints on trait expression using novel trait-gradient analysis parameters. Ecol. Evol. 2018, 8, 435–440. [Google Scholar] [CrossRef]
  28. Guo, Y.; Lu, Z.; Wang, Q.; Lu, J.; Xu, Y.; Meng, H.; Liu, H.; Zhang, J.; Bao, D.; Qiao, X.; et al. Detecting density dependence from spatial patterns in a heterogeneous subtropical forest of central China. Can. J. For. Res. 2015, 45, 710–720. [Google Scholar] [CrossRef]
  29. Yu, G.; Chen, Z.; Piao, S.; Peng, C.; Ciais, P.; Wang, Q.; Li, X.; Zhu, X. High Carbon Dioxide Uptake by Subtrop. For. Ecosyst. East Asian Monsoon Reg. 2014, 111, 4910–4915. [Google Scholar]
  30. Cheng, K.; Zhang, Y.; Yang, H.; Ren, Y.; Xiang, T.; Chen, Y.; Yang, Z.; Chen, M.; Xu, J.; Huang, G.; et al. China’s naturally regenerated forests currently have greater aboveground carbon accumulation rates than newly planted forests. Commun. Earth Environ. 2025, 6, 345. [Google Scholar] [CrossRef]
  31. Yao, L.; Ding, Y.; Yao, L.; Ai, X.; Zang, R. Trait Gradient Analysis for Evergreen and Deciduous Species in a Subtropical Forest. Forests 2020, 11, 364. [Google Scholar] [CrossRef]
  32. Xi, X.-Q.; Zhao, Y.-J.; Liu, Y.-G.; Wang, X.; Gao, X.-M. Variation and correlation of plant functional traits in karst area of central Guizhou Province, China. Chin. J. Plant Ecol. 2011, 35, 1000–1008. [Google Scholar] [CrossRef]
  33. Guang, F.; Jun-Qing, L.; Run-Guo, Z.; Yi, D.; Xun-Ru, A.; Lan, Y. Variation in three community features across habitat types and scales within a 15-ha subtropical evergreen-deciduous broadleaved mixed forest dynamics plot in China. Ecol. Evol. 2018, 8, 11987–11998. [Google Scholar]
  34. Hulshof, C.M.; Violle, C.; Spasojevic, M.J.; McGill, B.; Damschen, E.; Harrison, S.; Enquist, B.J. Intra-specific and inter-specific variation in specific leaf area reveal the importance of abiotic and biotic drivers of species diversity across elevation and latitude. J. Veg. Sci. 2013, 24, 921–931. [Google Scholar] [CrossRef]
  35. Garnier, E.; Shipley, B.; Roumet, C.; Laurent, G. A Standardized Protocol for the Determination of Specific Leaf Area and Leaf Dry Matter Content. Funct. Ecol. 2001, 15, 688–695. [Google Scholar] [CrossRef]
  36. Ryser, P.; Urbas, P. Ecological Significance of Leaf Life Span among Central European Grass Species. Oikos 2000, 91, 41–50. [Google Scholar] [CrossRef]
  37. Cornelissen, J.H.; Lavorel, S.; Garnier, E.; Díaz, S.; Buchmann, N.; Gurvich, D.E.; Reich, P.B.; Ter Steege, H.; Morgan, H.D.; Van Der Heijden, M.G.A.; et al. A handbook of protocols for standardised and easy measurement of plant functional traits worldwide. Aust. J. Bot. 2003, 51, 335–380. [Google Scholar] [CrossRef]
  38. Cornwell, W.K.; Schwilk, D.W.; Ackerly, D.D. A trait-based test for habitat filtering: Convex hull volume. Ecology 2006, 87, 1465–1471. [Google Scholar] [CrossRef]
  39. Leibold, M.A.; Holyoak, M.; Mouquet, N.; Amarasekare, P.; Chase, J.M.; Hoopes, M.F.; Holt, R.D.; Shurin, J.B.; Law, R.; Tilman, D.; et al. The metacommunity concept: A framework for multi-scale community ecology. Ecol. Lett. 2004, 7, 601–613. [Google Scholar] [CrossRef]
  40. Carboni, M.; Calderon-Sanou, I.; Pollock, L.; Violle, C.; DivGrass, C.; Thuiller, W. Functional traits modulate the response of alien plants along abiotic and biotic gradients. Glob. Ecol. Biogeogr. 2018, 27, 1173–1185. [Google Scholar] [CrossRef]
  41. Tilman, D. Competition and biodiversity in spatially structured habitats. Ecology 1994, 75, 2–16. [Google Scholar] [CrossRef]
  42. Hu, Y.K.; Pan, X.; Yang, X.J.; Liu, G.F.; Liu, X.Y.; Song, Y.B.; Zhang, M.Y.; Cui, L.J.; Dong, M. Is there coordination of leaf and fine root traits at local scales? A test in temperate forest swamps. Ecol. Evol. 2019, 9, 8714–8723. [Google Scholar] [CrossRef] [PubMed]
  43. Gamier, E.; Navas, M.-L. A trait-based approach to comparative functional plant ecology: Concepts, methods and applications for agroecology. A review. Agron. Sustain. Dev. 2012, 32, 365–399. [Google Scholar]
  44. Anderegg, L.D.L. Why can’t we predict traits from the environment? New Phytol. 2023, 237, 1998–2004. [Google Scholar] [CrossRef]
  45. Ying, L.; Qian, L.; Li, X.; Mingxu, L.; Zhi, C.; Zhaopeng, S.; Jihua, H.; Nianpeng, H. Plant community traits can explain variation in productivity of selective logging forests after different restoration times. Ecol. Indic. 2021, 131, 108181. [Google Scholar]
  46. Milla, R.; Reich, P.B. The scaling of leaf area and mass: The cost of light interception increases with leaf size. Proc. Biol. Sci. 2007, 274, 2109–2115. [Google Scholar] [CrossRef]
  47. Wright, I.J.; Reich, P.B.; Westoby, M.; Ackerly, D.D.; Baruch, Z.; Bongers, F.; Cavender-Bares, J.; Chapin, T.; Cornelissen, J.H.C.; Diemer, M.; et al. The worldwide leaf economics spectrum. Nat. Int. Wkly. J. Sci. 2004, 428, 821–827. [Google Scholar] [CrossRef] [PubMed]
  48. Westoby, M.; Wright, I.J. Land-plant ecology on the basis of functional traits. Trends Ecol. Evol. 2006, 21, 261–268. [Google Scholar] [CrossRef]
  49. Bongers, F.J.; Schmid, B.; Sun, Z.; Li, Y.; Härdtle, W.; Oheimb, G.; Li, Y.; Li, S.; Staab, M.; Ma, K.; et al. Growth–trait relationships in subtropical forest are stronger at higher diversity. J. Ecol. 2020, 108, 256–266. [Google Scholar] [CrossRef]
  50. Maynard, D.S.; Bialic-Murphy, L.; Zohner, C.M.; Averill, C.; van den Hoogen, J.; Ma, H.; Mo, L.; Smith, G.R.; Acosta, A.T.; Aubin, I.; et al. Global relationships in tree functional traits. Nat. Commun. 2022, 13, 3185. [Google Scholar] [CrossRef]
  51. Fonseca, C.R.; Overton, J.M.; Collins, B.; Westoby, M. Shifts in Trait-Combinations along Rainfall and Phosphorus Gradients. J. Ecol. 2000, 88, 964–977. [Google Scholar] [CrossRef]
  52. Shipley, B. Structured Interspecific Determinants of Specific Leaf Area in 34 Species of Herbaceous Angiosperms. Funct. Ecol. 1995, 9, 312–319. [Google Scholar] [CrossRef]
  53. Grubb, P.J. A reassessment of the strategies of plants which cope with shortages of resources. Perspect. Plant Ecol. Evol. Syst. 1998, 1, 3–31. [Google Scholar] [CrossRef]
  54. Zhou, J.; Cieraad, E.; van Bodegom, P.M. Global analysis of trait–trait relationships within and between species. New Phytol. 2022, 233, 1643–1656. [Google Scholar] [CrossRef]
  55. Baraloto, C.; Timothy Paine, C.E.; Poorter, L.; Beauchene, J.; Bonal, D.; Domenach, A.M.; Hérault, B.; Patiño, S.; Roggy, J.C.; Chave, J. Decoupled leaf and stem economics in rain forest trees. Ecol. Lett. 2010, 13, 1338–1347. [Google Scholar] [CrossRef]
  56. Lasky, J.R.; Uriarte, M.; Boukili, V.K.; Chazdon, R.L. Trait-mediated assembly processes predict successional changes in community diversity of tropical forests. Proc. Natl. Acad. Sci. USA 2014, 111, 5616–5621. [Google Scholar] [CrossRef]
  57. Slik, J.F.; Bernard, C.S.; Breman, F.C.; Van Beek, M.; Salim, A.; Sheil, D. Wood density as a conservation tool: Quantification of disturbance and identification of conservation-priority areas in tropical forests. Conserv. Biol. 2008, 22, 1299–1308. [Google Scholar] [CrossRef]
  58. Zirbel, C.R.; Grman, E.; Bassett, T.; Brudvig, L.A. Landscape context explains ecosystem multifunctionality in restored grasslands better than plant diversity. Ecology 2019, 100, e02634. [Google Scholar] [CrossRef]
Figure 1. SLA trait gradient for two species of woody plant. Each point represents a single species. The dashed line y = x represents the slope of the constructed trait gradient, where the x-axis denotes the community-weighted mean specific leaf area (SLA), and the y-axis denotes the species-level mean SLA. The vertical series of points enclosed by the dashed rectangle represents all coexisting species within community j at a given plot pj. αi is the perpendicular distance from a species point to the dashed line y = x, indicating the deviation of the species’ mean trait value from the community mean; βi is the x-coordinate of the point, representing the community mean SLA at that location. The range of plots occupied of a species represented its niche breadth (Ri).
Forests 16 00868 g001
Figure 2. Relationship between the variation in functional traits and stand age at the species (A) and community (B) levels.
Forests 16 00868 g002
Figure 3. Distribution of the ecological constraint index (Ci) for functional traits (A) and its relationship with stand age (B). “ns” indicates not significant, * p < 0.05, ** p < 0.01.
Forests 16 00868 g003
Table 1. Characteristics of plant functional traits across different stand ages.
TableAge of Stand
(Year)
Species CharacteristicsPlot Characteristics
ti, Meanti, Min–MaxPj, MeanPj, Min–Max
LA
(cm2)
2096.50 ± 25.32 A2.59–3183.1390.01 ± 47.18 A39.92–244.16
3574.39 ± 115.26 A9.33–1050.0576.68 ± 31.88 A34.26–143.01
old68.32 ± 106.53 A4.24–903.2047.14 ± 11.44 B31.32–79.94
SLA
(cm2/g)
20511.23 ± 186.45 A164.63–1217.88500.62 ± 101.67 A347.64–698.65
35262.79 ± 125.63 B72.46–714.65231.50 ± 17.92 B194.91–269.01
old232.27 ± 94.48 C67.90–663.80207.43 ± 30.93 B138.36–252.56
LDMC
(g/g)
200.33 ± 0.08 A0.12–0.690.34 ± 0.03 A0.30–0.46
350.32 ± 0.08 A0.14–0.550.33 ± 0.02 A0.28–0.39
old0.32 ± 0.08 A0.15–0.520.34 ± 0.02 A0.31–0.39
WD
(g/cm3)
200.49 ± 0.11 A0.11–0.790.51 ± 0.04 A0.37–0.58
350.53 ± 0.12 B0.11–0.900.54 ± 0.04 B0.45–0.61
old0.52 ± 0.11 B0.21–0.750.55 ± 0.02 B0.49–0.59
Note: Different letters indicate significant differences.
Disclaimer/Publisher’s Note: The statements, opinions and data contained in all publications are solely those of the individual author(s) and contributor(s) and not of MDPI and/or the editor(s). MDPI and/or the editor(s) disclaim responsibility for any injury to people or property resulting from any ideas, methods, instructions or products referred to in the content.

