Article

Nitrogen Addition Promotes the Accumulation of Soil Particulate Organic Carbon in a Subtropical Forest

1
School of Geographical Sciences, Fujian Normal University, Fuzhou 350117, China
2
Fujian Provinical Key Laboratory for Subtropical Resources and Environment, Fujian Normal University, Fuzhou 350117, China
3
Institute of Ecology, College of Urban and Environmental Sciences, Laboratory for Earth Surface Processes, Ministry of Education, Peking University, Beijing 100871, China
4
Daiyun Mountain National Nature Reserve Administration Bureau, Quanzhou 362500, China
*
Author to whom correspondence should be addressed.
Forests 2024, 15(4), 619; https://doi.org/10.3390/f15040619
Submission received: 27 February 2024 / Revised: 18 March 2024 / Accepted: 26 March 2024 / Published: 28 March 2024

Abstract

:
Nitrogen (N) deposition rates of terrestrial ecosystems have gradually declined but are still high in some areas. Previous studies have reported that N addition elicits diverse impacts on soil organic carbon (SOC) pools. SOC can be divided into different functional fractions, namely, particulate organic carbon (POC) and mineral-associated organic carbon (MAOC). The responses of these fractions to N addition should be elucidated to better understand the changes in SOC pools. Here, we conducted a N addition experiment (0, 40, and 80 kg N ha−1 yr−1) in a subtropical Castanopsis fabri forest to simulate N deposition. The surface (0−10 cm) SOC fractions, aboveground litter product, fine root (diameter < 2 mm) biomass, soil exchangeable cation content, and soil enzyme activity under different N addition treatments were measured. The results showed the following: (1) N addition showed a positive effect on POC and SOC contents but did not significantly affect MAOC content; (2) POC content was negatively correlated with pH and soil enzyme activity and positively correlated with aboveground litter product, suggesting that POC accumulation was influenced by aboveground litter input and microbial decomposition; (3) a close negative relationship was observed between exchangeable Al3+ and Ca2+ or K+ contents, indicating that there is likely to be a trade-off between the mineral sorption and desorption, thus resulting in an insignificant reaction of MAOC to N addition. Overall, the accumulation of SOC under short-term N addition was found to be primarily driven by POC, and the response of different SOC functional fractions to N addition was inconsistent. By incorporating these nuances into ecosystem models, it is possible to predict SOC dynamics more accurately in response to global change.

1. Introduction

As the biggest carbon (C) sink in terrestrial ecosystems, the soil organic carbon (SOC) pool is essential to C cycle-climate feedback [1]. Since the mid-20th century, the excessive agricultural, industrial, and urban developments have led to an increase in atmospheric nitrogen (N) deposition [2,3]. It was reported that the N deposition rate has gradually stabilized in recent years, but the N deposition rate in southeastern China is still higher than that in other regions within the country [4]. C and N cycles are considered tightly linked [5,6], so the effect of N deposition on the SOC pool has attracted the attention of the scientific community. Several studies have examined the effects of N addition on SOC and have reported that the SOC pool rises [7], decreases [8], or remains unchanged [9] with N addition. Overall, there is no unified conclusion on the effect of N deposition on SOC.
Recently, the theory that the chemical complexity of SOC primarily governs its persistence has been criticized for lacking thermodynamic evidence and for neglecting microbial accessibility to substrate components [10,11]. On the contrary, the mineral protective mechanism is considered as an acceptable explanation for SOC persistence. Based on particle size widely used in SOC fractionation, SOC can be divided into particulate organic carbon (POC, >53 μm) and mineral-associated organic carbon (MAOC, <53 μm) [12]. POC is mostly composed of plant components that are readily decomposable (i.e., carbohydrates and aliphatic compounds), and it has a faster turnover rate [13]. MAOC is primarily derived from microbial necromass and plant low-molecular-weight compounds (i.e., root exudates), which prevent breakdown by chemically binding with minerals; thus, MAOC has a slower turnover rate and is relatively stable [12,14]. Dividing SOC into different functional fractions may better elucidate SOC dynamics under N addition [12,15].
As is well known, N is an important factor limiting plant productivity, and thus it is expected that the addition of N could result in plant biomass increase, thereby promoting the accumulation of POC [16,17]. Given that plant-derived compounds could directly adsorbed onto soil minerals, N addition inducing an increase in plant biomass would promote the formation of MAOC [18,19]. Acidification is a common reaction of soil to N addition because of the (1) release of H+ during nitrification; (2) release of H+ after plant uptake of NH4+-N; and (3) leaching of exchangeable cations [20]. The different functional fractions of SOC are susceptible to soil acidification. For instance, Rocci et al. [21] elucidated that N addition led to increases in POC and MAOC levels. They attributed the accumulation of POC to a soil-acidification-induced reduction in microbial biomass and SOC decomposition rate [22]. Conversely, studies have shown adverse effects of N addition on POC and MAOC levels [15,23,24]. The fast leaching of soil cations (e.g., Ca2+) and oxides brought on by N addition changed the formation of organo-mineral associations by affecting cation bond bridges and/or ligand exchange, being inconducive for the formation of MAOC [23,25]. In other words, in the absence of mineral protection, MAOC is easily decomposed by microorganisms [26], resulting in a reduction in MAOC content under N addition. Overall, complex SOC composition may be the reason for the varied responses of SOC to N addition [27,28], but the mechanism underlying the response of POC and MAOC to N addition has not yet been determined.
We carried out a N addition experiment in a subtropical Castanopsis fabri forest to investigate the effects of short-term N addition on POC and MAOC as well as their underlying mechanisms. The SOC fractions and various parameters, including aboveground litter product, fine root biomass, soil enzyme activities, soil physicochemical properties, and exchangeable cations were examined. We hypothesized that (1) N addition promotes POC accumulation, as the N availability induced by N addition increases plant biomass and litter input, and soil acidification leads to a decrease in microbial biomass and enzyme activity; (2) N addition decreases MAOC content, because N addition causes the depletion of exchangeable cations and attenuates mineral protection.

2. Materials and Methods

2.1. Study Site

A Castanopsis fabri natural forest in Daiyun Mountain National Nature Reserve in southern China was selected as an experimental area (25°38′07″−25°43′40″ N, (118°05′22″−118°20′15″ E, 1200 m a.s.l.). The study site has a typical subtropical oceanic monsoon climate [29]. The reserve’s average annual temperature and rainfall are roughly 17.6 °C and 1800 mm, respectively, and precipitation mainly occurs during March–September. Since the establishment of the national nature reserve, this forest has not been disturbed by human activities. At the beginning of the experiment, the tree height was 15–20 m, the diameter at breast height was 20−40 cm, and the closure was about 75%. The understory vegetation includes Micheliamaudiae, Lindera aggregate, Schima superba, and Ilex pubescens. The soil type is Ultisol according to the US Department of Agriculture soil order, with 45% sand, 33% silt, and 22% clay.

2.2. Experimental Design

In December 2019, a total of twelve 10 m × 10 m plots were established. Spacing between plots was >10 m to avoid N fertilizer transfer. Based on previous reports on atmospheric N deposition rates in the study and nearby areas [30,31], we set up the following experimental treatments: control (CT, 0 kg N ha−1 yr−1), low-N addition (LN, 40 kg N ha−1 yr−1), and high-N addition (HN, 80 kg N ha−1 yr−1). There was no significant difference in soil organic carbon (SOC), total N, and pH among different plots before N addition. The experiment adopted a completely random design, and the three N addition treatments were randomly distributed in twelve plots with four replicates per treatment. Starting in early May 2020, N fertilizer was added once a month during March to September. A specific amount of urea (CO(NH2)2; Shangdong Mingwei Chemical Co., Ltd., Shandong, China) (LN, 24.49 g; HN, 48.98 g) was dissolved in 20 L deionized water and uniformly sprayed over the low-N addition and high-N addition plots using a backpack sprayer (Delixi Group Co., Ltd., Zhejiang, China). For the control plots, the same volume of deionized water was sprayed.
In December 2021, the surface litter was removed first, and the topsoil (0–10 cm) was collected from each plot using the five-point sampling method. Five samples from each plot were thoroughly combined, then placed in a low-temperature insulated box and taken right away to the laboratory for further processing. In the laboratory, the soil was sieved through a 2 mm screen after being freed of fine gravel, trash, and plant roots using tweezers. The sieved soil was partially stored in a 4 °C refrigerator. Within one week, soil enzyme activity, microbial biomass, and mineral N were evaluated. The other soil was air-dried to determine the SOC fractions and soil pH. To quantify the soil exchangeable cations, a piece of the air-dried soil was filtered through a mesh of 0.149 mm.

2.3. Soil Physicochemical Characteristics

Soil pH was measured using a glass electrode (soil/water; 1:2.5) (Starter 300, pH Portable; OHAUS, Parsippany, NJ, USA). After inorganic C was eliminated from the soil samples using 0.5 mol L−1 HCl (Xilong Scientific Co., Ltd., Shanghai, China), SOC and total N (TN) contents were measured using a CN analyzer (Elementar Vario EL III; Langenselbod, Germany). The chloroform fumigation-extraction method was used to measure the amount of microbial biomass carbon (MBC) [32]. Soil mineral N was extracted in a 2 mol L−1 KCl solution (Xilong Scientific Co., Ltd., Shanghai, China) and quantified using a continuous flow on auto-analyzer (San++; SKALAR, Breda, The Netherlands) [33].

2.4. SOC Fractions

SOC fractions were investigated using a wet sieving method described by Marriott and Wander [34]. Specifically, we weighed 20.0 g of air-dried soil samples into plastic bottles and added 100 mL of sodium hexametaphosphate solution (5 g L−1) to each sample. The mixture was first shaken for 18 h. Subsequently, the dispersion was transferred to a 53 μm sieve of a reciprocating shaker (AS200 control; Retsch, Heidelsheim, Germany) with an amplitude of 3 cm, and the samples were subjected to 100 vibrations. A continuous flow of deionized water was used to flush the sieve to disperse the SOC within aggregates. Meanwhile, a clean beaker was used to collect the sample passing through the 53 μm sieve. Soil samples collected on the sieve and in the beaker were dried at 60 °C until their weight remained stable. Finally, we obtained two particle size classes: particulate organic matter (POM, >53 μm) and mineral-associated organic matter (MAOM, <53 μm). The SOC content in each fraction was evaluated using an elemental analyzer (Elementar Vario EL III, Germany). The following equations were used to obtain the POC (g kg−1) and MAOC (g kg−1) contents:
Mass   recovery   % = Mass POC + Mass MAOC Mass Bulk   soil × 100
POC   g   kg 1 = Mass POC × OC POC Mass Bulk   soil × Mass   recovery / 100
MAOC   g   kg 1 = Mass MAOC × OC MAOC Mass Bulk   soil × Mass   recovery / 100
where MassBulk soil is the soil mass used for sieving (g); MassPOC and MassMAOC are the masses of the POC and MAOC fractions obtained after sieving (g), respectively; and OCPOC and OCMAOC are the C contents of POC and MAOC (g C kg−1 fraction), respectively.

2.5. Exchangeable Cations and Soil Enzyme Activities

Soil exchangeable cations (K+, Na+, Ca2+, Mg2+, and Al3+) were extracted using 0.1 mol L−1 BaCl2 (Xilong Scientific Co., Ltd., Shanghai, China), and their contents were measured using inductively coupled plasma emission spectrometry (ICP-OES; Thermo Fisher Scientific, Waltham, MA, USA). Activities of soil enzymes, including β-glucosidase (BG) and cellulolytic enzyme cellobiohydrolase (CBH), were measured using the method reported by Saiya-Cork et al. [35]. We added 1.0 g of soil sample and 125 mL of 50 mmol L−1 acetate buffer solution (Hunan Beekman Biotechnology Co., Ltd., Changde, China) to a triangular flask. The mixture was homogenized for 5 min using a magnetic stirrer, and the supernatant was collected as the test solution. In a 96-well microplate, the test solutions were applied to different substrates (4-methylumbelliferyl-d-glucopyranoside and 4-methylumbelliferyl-d-cellobioside) (Sigma Aldrich, Milwaukee, WI, USA) to measure BG and CBH activity, respectively. A multi-purpose microplate reader (SpectraMax M5; Molecular Devices, San Jose, CA, USA) equipped with 365 nm excitation and 450 nm emission filters was used to measure fluorescence.

2.6. Aboveground Litter Product and Fine Root Biomass

In each plot, three litter traps (1 m × 1 m) were installed approximately 1 m above the ground surface. Around the 20th of each month, litter was collected from the Castanopsis fabri forest. Litter from the same plot (with three traps) was collected and mixed in the laboratory. The collected litter was dried and weighed to determine the aboveground litter product. This process was continuously performed for one year in 2021. In December 2021, a five-point sampling technique was used to collect fresh soil cores from each plot at a depth of 0−10 cm using a 3.5 cm diameter soil auger. The diameter <2 mm fine roots in the soil cores were carefully selected and thoroughly washed, then dried at a constant temperature of 60 °C and finally weighed.

2.7. Statistical Analyses

R 4.2.3 (R Core Team, 2023, Vienna, Austria) and SPSS 27.0 (IBM Corp., Armonk, NY, USA) were used to conduct statistical analyses. One-way analysis of variance (ANOVA) was examined to test the effects of N addition on SOC fractions, soil physicochemical characteristics, exchangeable cations, soil enzyme activities, aboveground litter product, and fine root biomass. The least significant difference (LSD) method was employed to compare treatment differences at a significance level of 0.05. Principal component analysis was examined using the “factoextra” package in R 4.2.3 to explore the influence of soil factors (exchangeable cations contents), plant factors (aboveground litter product and fine root biomass), and soil microbial factors (enzyme activities) on SOC fractions. Graphs were created using Origin 9.1 software (OriginLab, Northampton, MA, USA).

3. Results

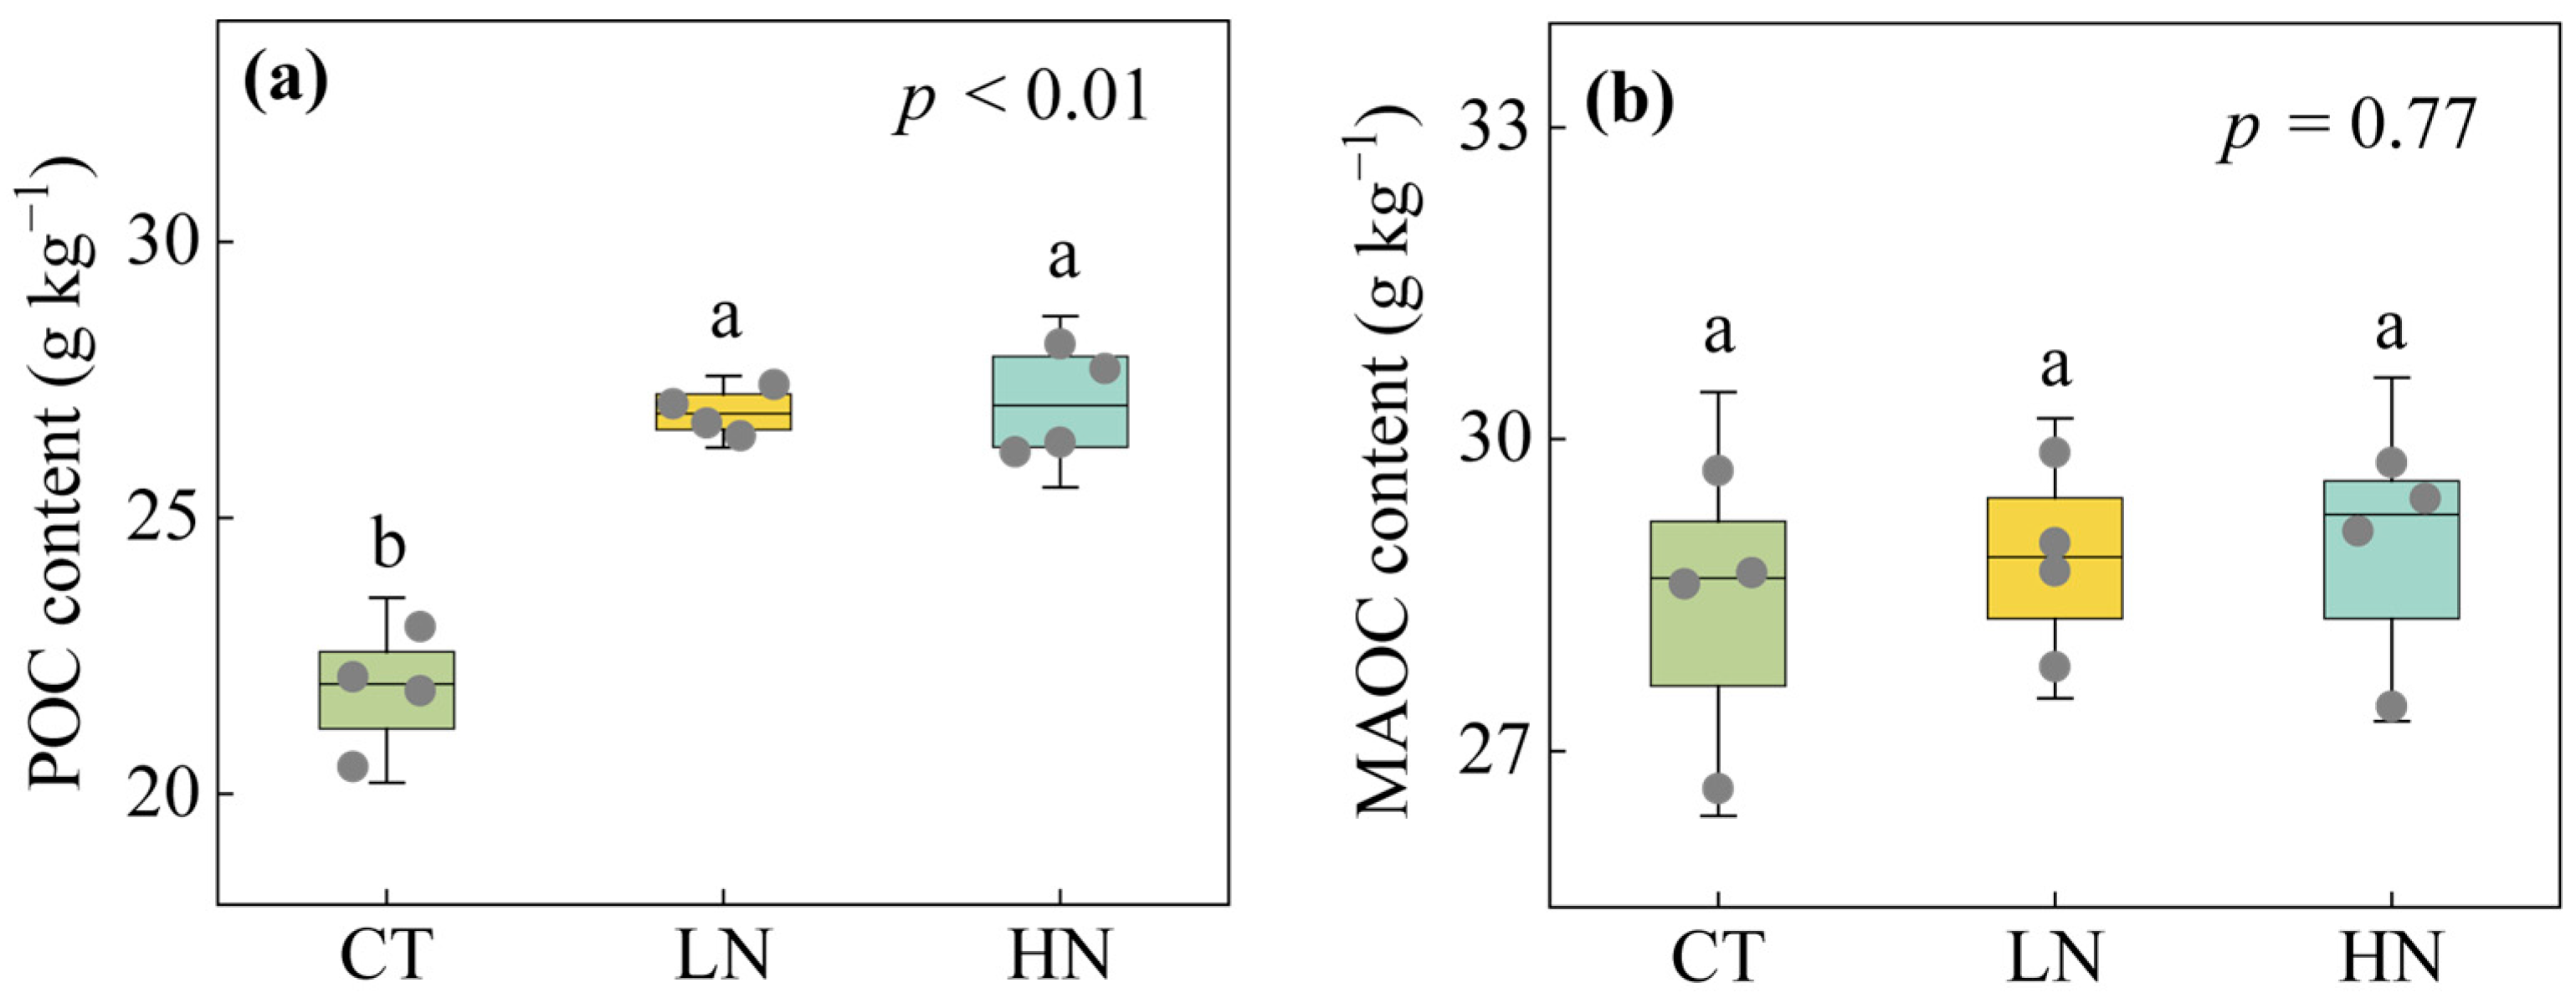
3.1. Responses of SOC Fractions to Short-Term N Addition

Compared with the control, both low-N addition and high-N addition significantly reduced soil pH and significantly increased SOC content (p < 0.05; Table 1). The POC content of soil samples was significantly affected by short-term N addition in a content-dependent manner (p < 0.01), but N addition did not exert any significant effect on the MAOC content (Figure 1).

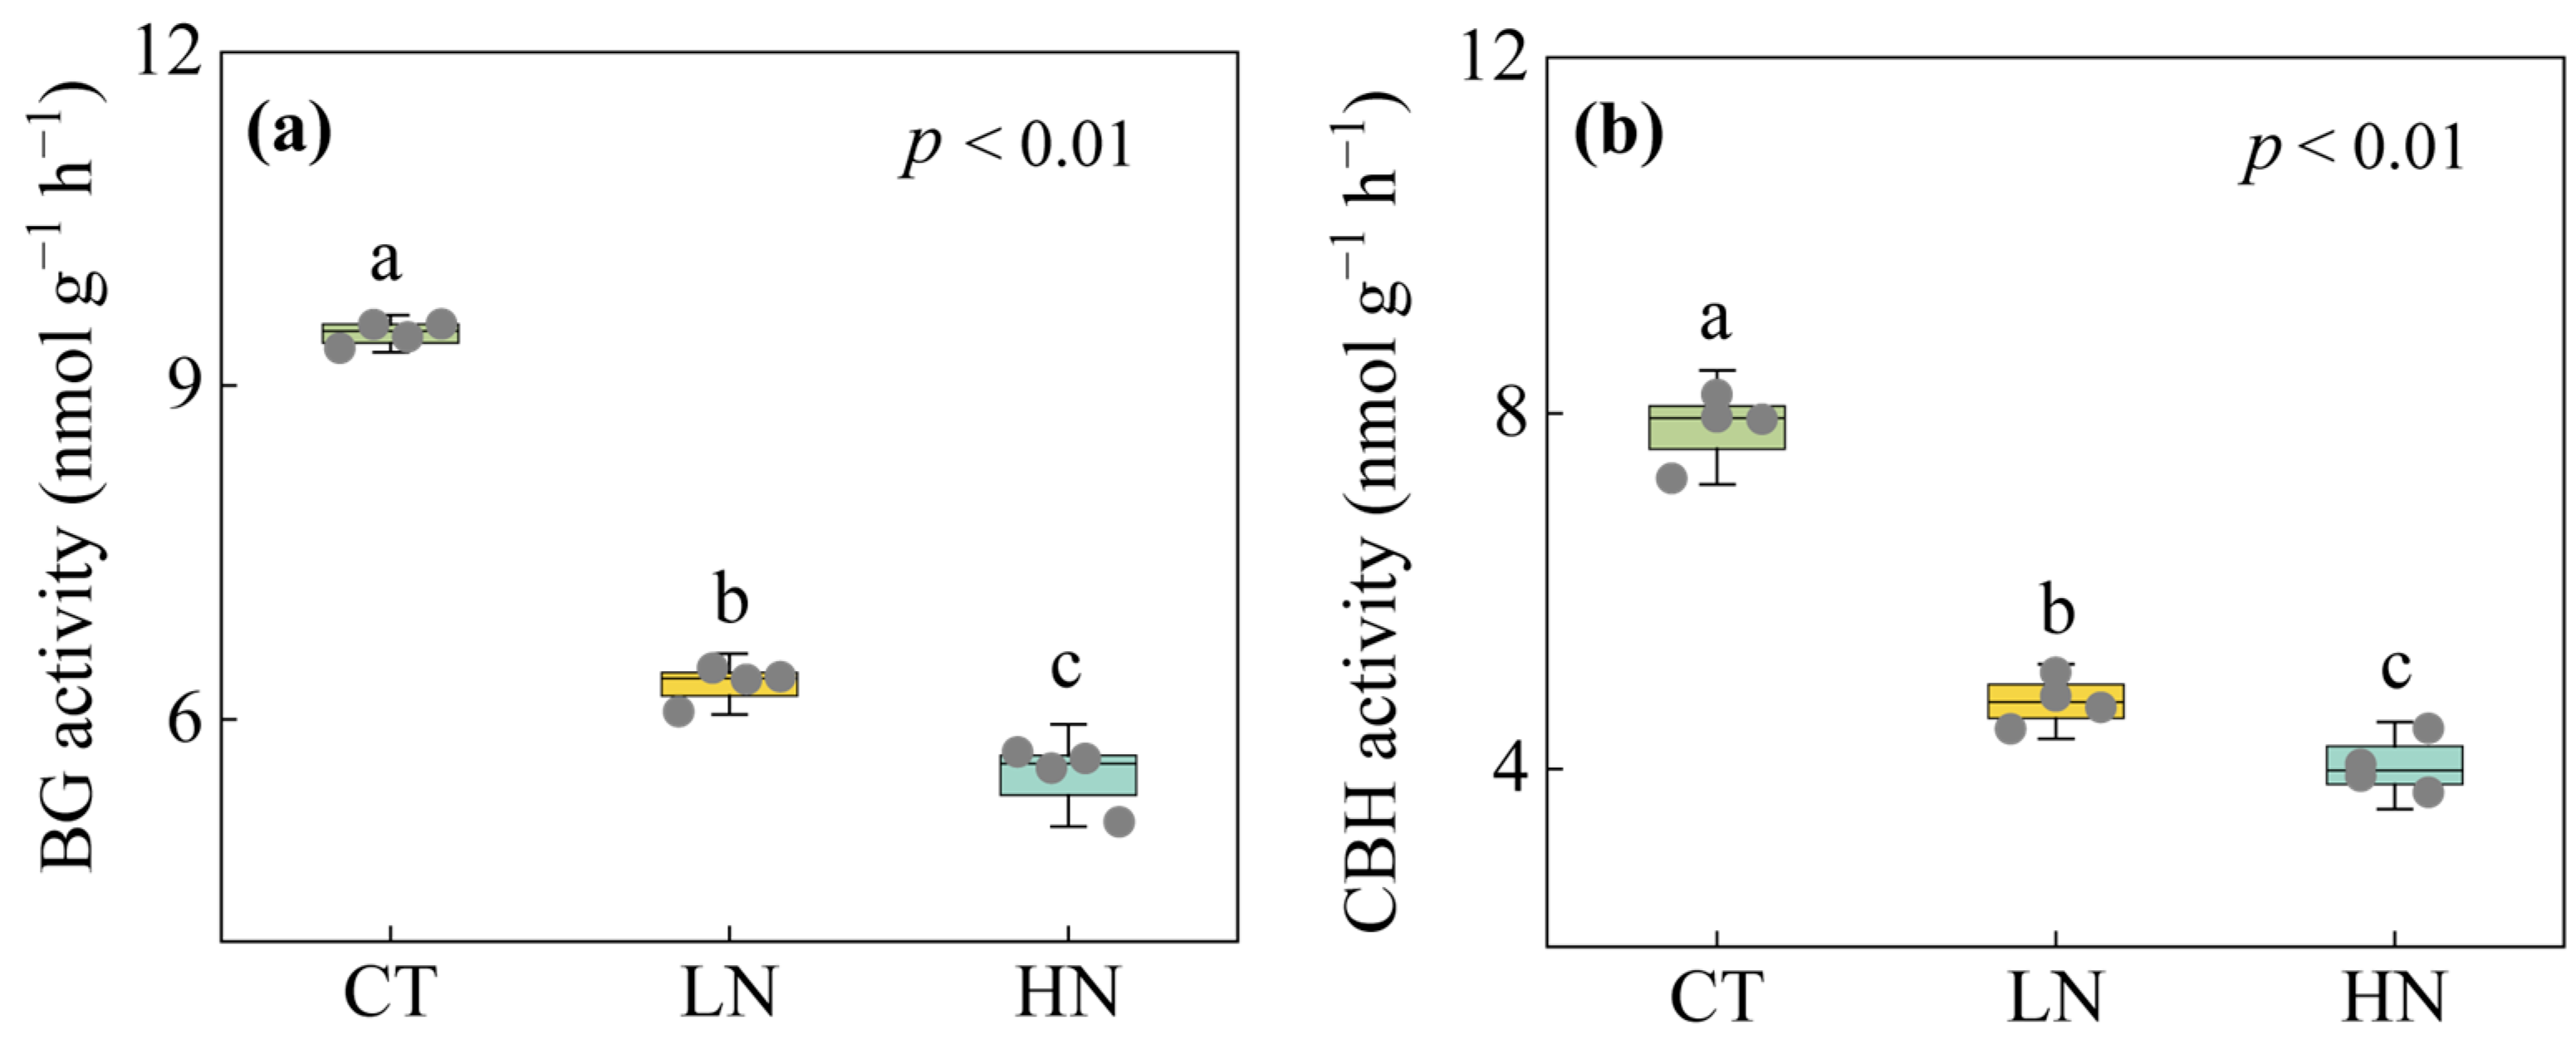
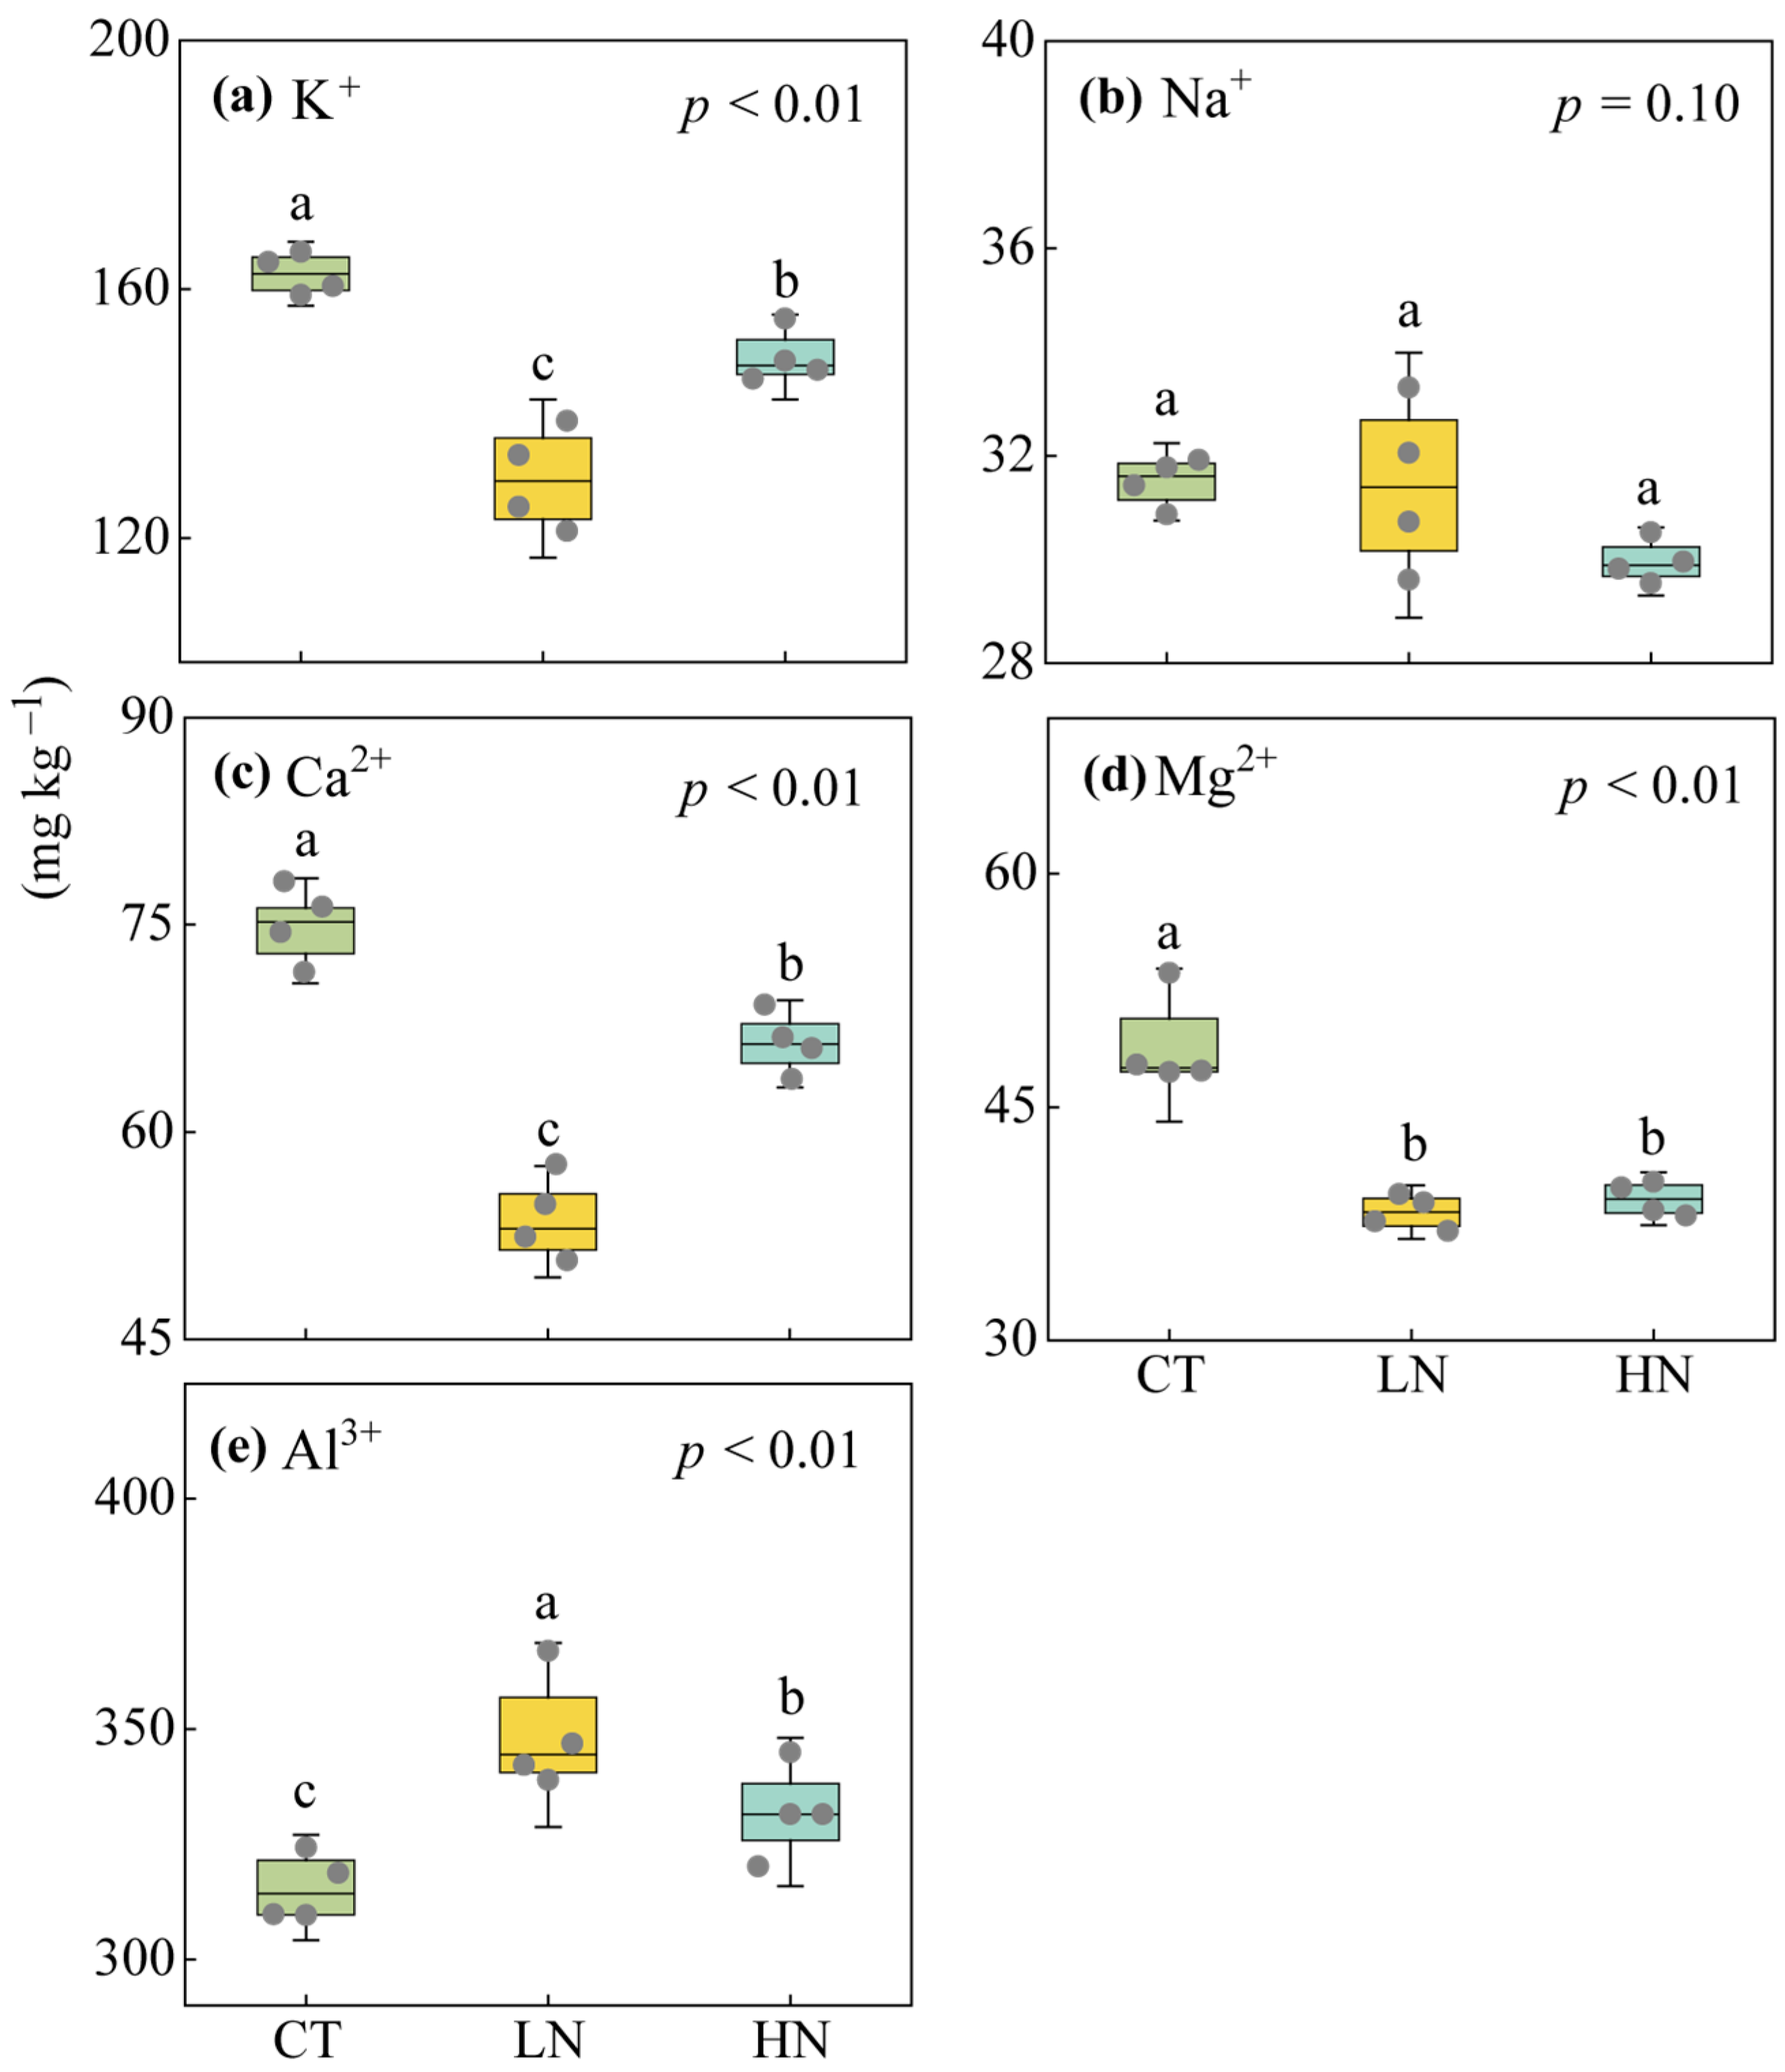
3.2. Responses of Soil Exchangeable Cations and Enzyme Activities to Short-Term N Addition

N addition had a significant effect on exchangeable cation content, except for Na+ content. Specifically, the Al3+ content of the low-N addition and high-N addition groups was significantly higher than that of control group, whereas the K+, Ca2+, and Mg2+ contents were significantly lower than those of the control group (p < 0.01; Figure 2). With rising N-addition rate, soil enzyme activities (BG and CBH) reduced (p < 0.01; Figure 3).

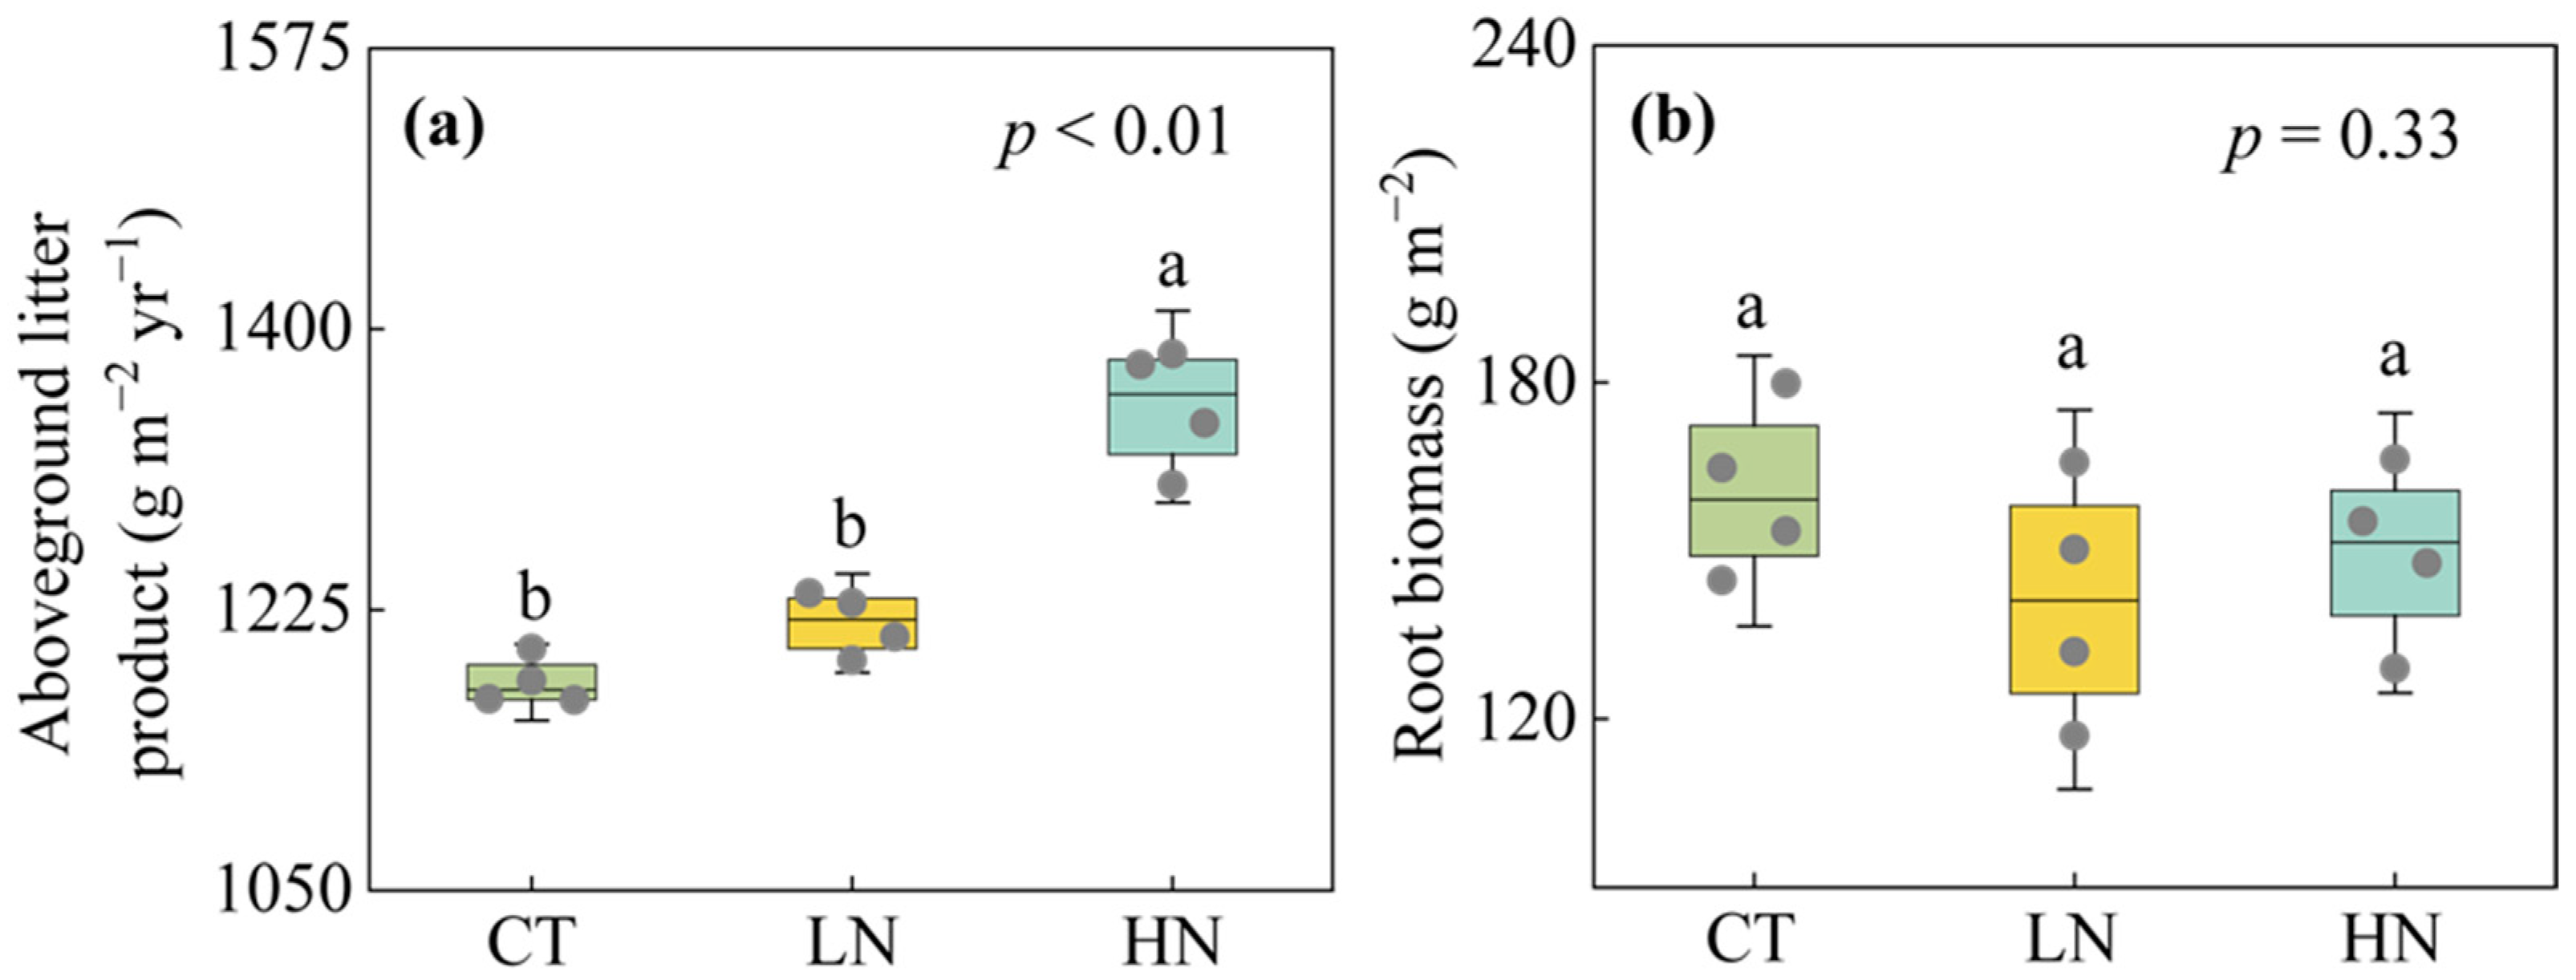
3.3. Responses of Aboveground Litter Product and Fine Root Biomass to Short-Term N Addition

N addition significantly affected the aboveground litter product (p < 0.01). In comparison to that in the control plots, the aboveground litter product in the high-N addition plots was significantly increased by 28% (p < 0.05). In contrast, the fine root biomass was unaffected by the addition of N (p = 0.33; Figure 4).

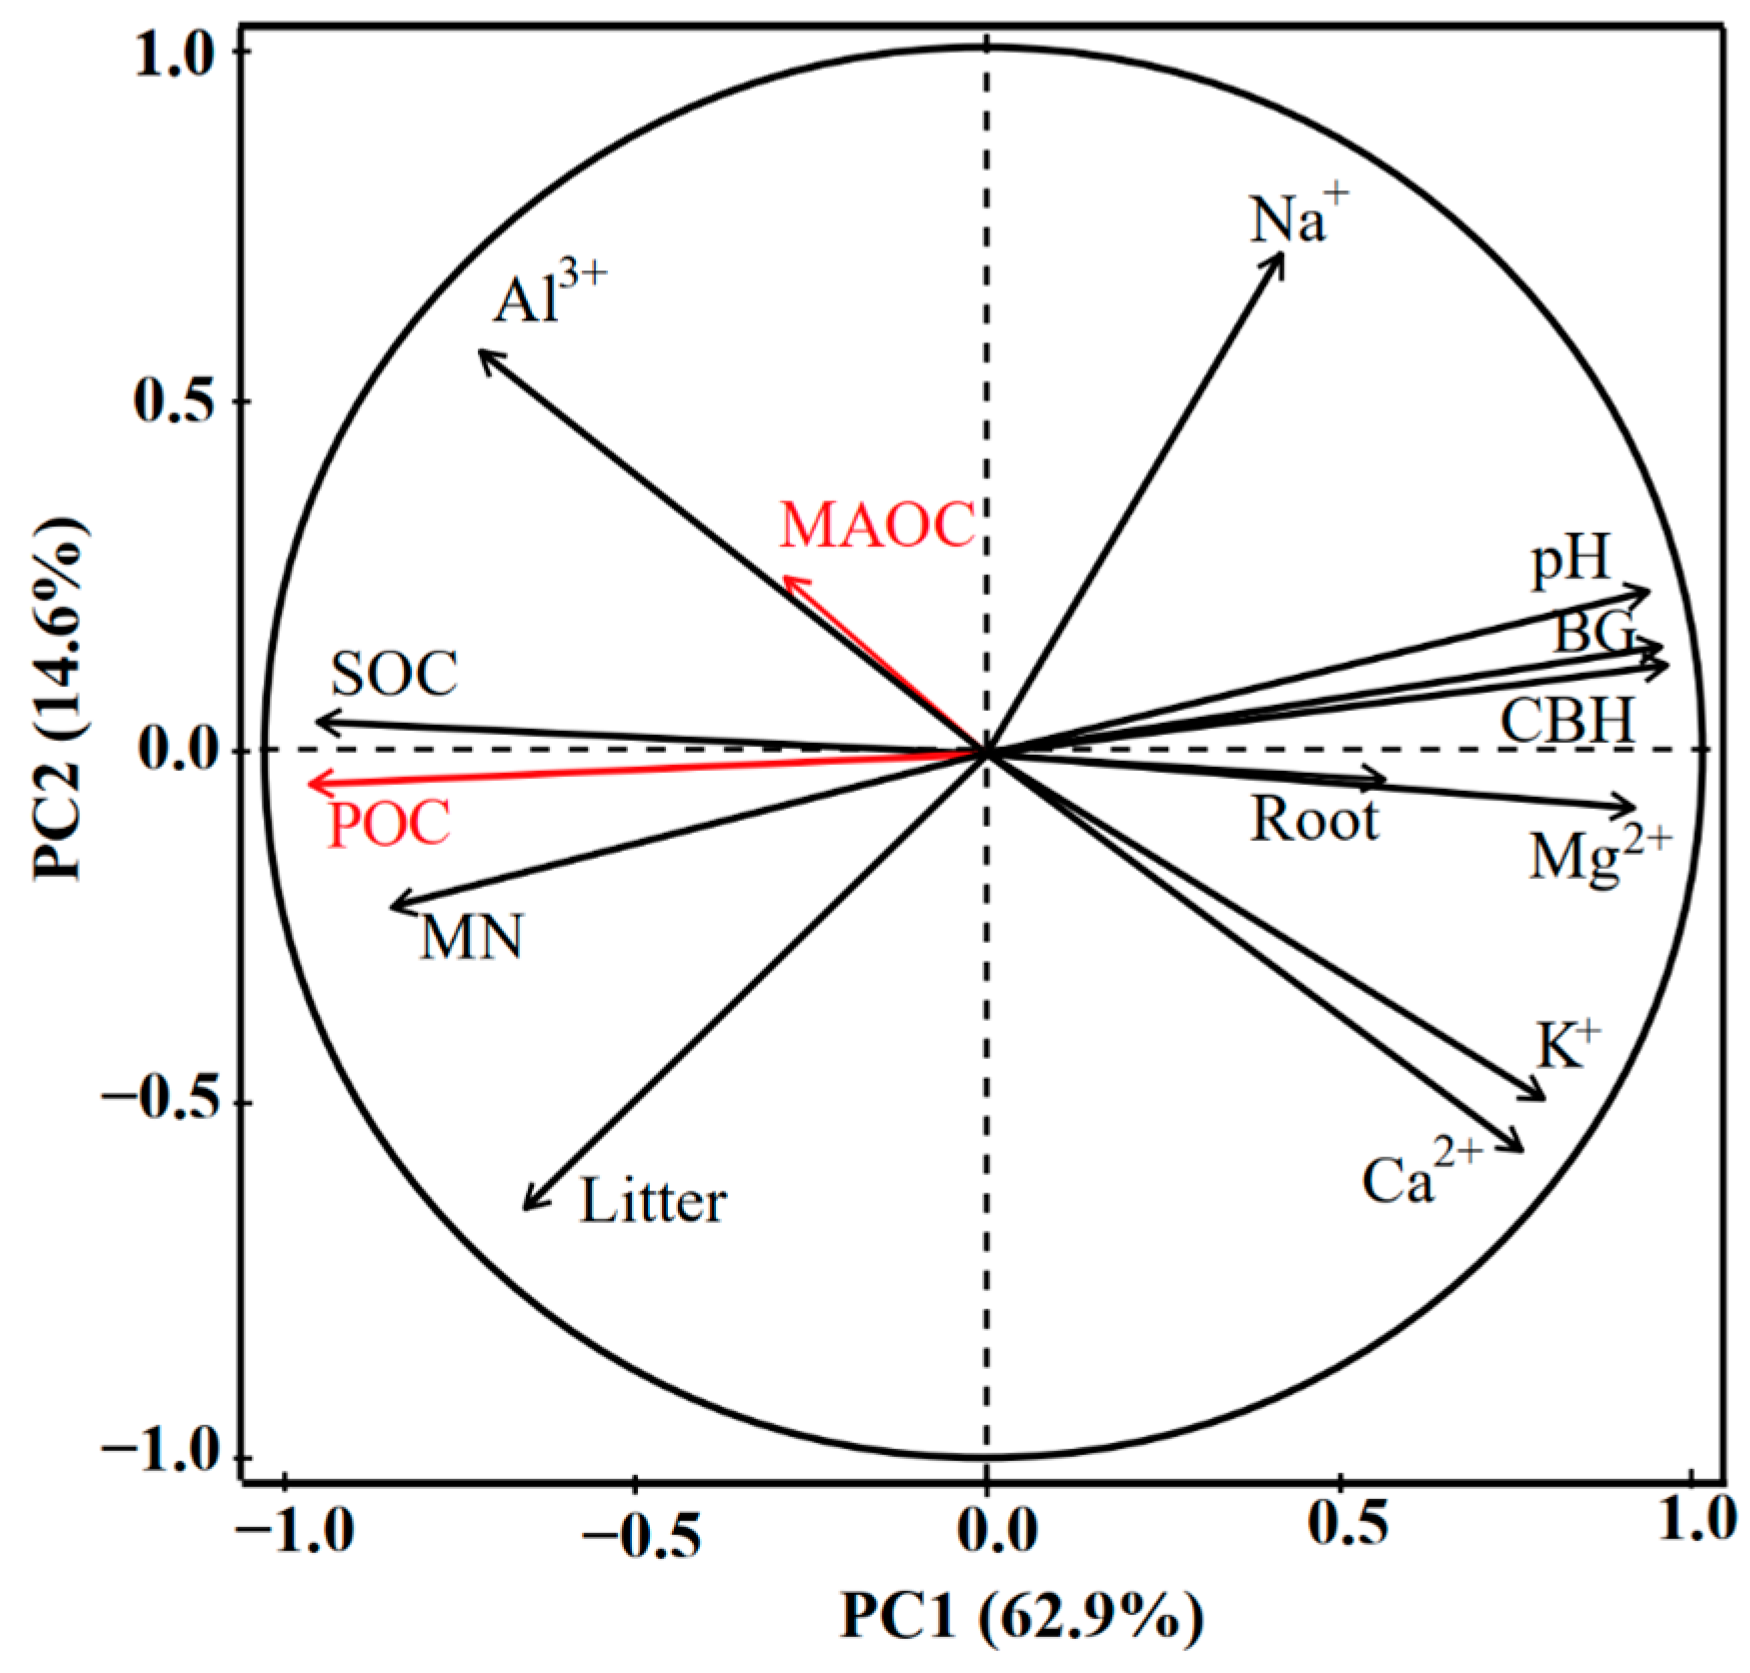
3.4. Analysis of Key Factors Influencing SOC Fraction Changes

Principal component analysis revealed a significant positive correlation between POC and aboveground litter product (R2 = 0.48) or SOC (R2 = 0.89), as well as significant negative correlations between POC and soil exchangeable cations (Mg2+, Ca2+, K+), pH, and soil enzyme activities (BG, CBH) (R2POC-Mg = 0.73, R2POC-Ca = 0.52, R2POC-K = 0.57, R2POC-pH = 0.82, R2POC-BG = 0.88, R2POC-CBH = 0.91). Moreover, we found a close negative connection between Al3+ and Ca2+ or K+ (R2Al-Ca = 0.57, R2Al-K = 0.55). There was no significant relationship between MAOC and root biomass (R2 < 0.01; Figure 5).

4. Discussion

4.1. Positive Response of POC to Short-Term N Addition

Lugato et al. [28] reported that POC in forest soils is susceptible to depletion under climate change, and they recommended the implementation of coniferous forest management strategies aimed at increasing plant inputs into the soil to counteract POC losses. In the present study, short-term low and high N additions increased POC content (p < 0.01; Figure 1a). This is in line with previous findings [15,36,37] and confirms our first hypothesis. The mechanisms of N addition to increase POC can include the following points. First, POC is predominantly formed by plant-based compounds [38], so the rise in POC content following the addition of N may be due to the increase in the inputs of plant residues to soils. In our study, high N addition enhanced aboveground litter product considerably, but not fine root biomass. This result in combination with the significant correlation between POC and aboveground litter product (Figure 5) suggested that short-term N-induced increase in POC was derived from plant aboveground rather than belowground roots. Yang et al. [39] found that the leaf litter from six common plant species with varying litter quality consistently decomposed faster on larger islands, where higher soil fertility facilitated decomposition. The addition of N enhances soil N availability, which may promote the transformation of aboveground litter product into POC. Previous studies suggested that the POC pool is mainly affected by plant belowground roots [17,24,40]. However, this phenomenon may be not appliable to our study, as N addition can enhance soil nutrient resources and decrease the proportion of biomass allocation to belowground and thus the amount of belowground C inputs [16]. It is also possible that one year of N addition is not sufficient to decay the root biomass, whereas litter decomposition is faster than this.
Second, the increase in POC may be associated with the lower soil enzyme activities under N addition, as soil enzymes are important drivers of SOC decomposition [41]. We found the significant decreases in soil enzyme activities in the low-N addition and high-N addition plots compared to the control plots (Figure 3). There was a significant negative relationship between soil enzyme activity and POC (Figure 4). This could have been due to the leaching of soil exchangeable cations, which decrease soil pH. Soil acidification can inhibit soil microbial biomass and soil enzyme activities [42,43,44], thereby reducing the decomposition and loss of POC. In our study, short-term N addition showed a positive effect on SOC, with POC explaining 89% of the variation in SOC (Figure 5), suggesting that the increase in SOC is driven by POC. Overall, the increases in POC content under N addition is not only related to N-induced increase in plant-derived C inputs but also related to N-induced decrease in microbial decomposition.

4.2. Non-Significant Response of MAOC to Short-Term N Addition

N addition had no significant effect on the MAOC content (Figure 1b); such a result is contrary to our second hypothesis and previous studies [17,21,45]. Chen et al. [46] showed that microbial necromass is a major driver of MAOC, and the undetectable change in MAOC content under N addition might be regulated by maintaining an equilibrium between microbial necromass input and microbial decomposition output. Here, we attribute the non-significant response of MAOC to N addition to the following reasons. First, the non-significant response of MAOC to N addition may have been due to the duration of N addition was too short. Second, we observed a decrease in MBC content and an increase in aboveground litter product under high N addition (Table 1). The mineral sorption of dissolved organic C and microbial necromass C produced by microbial decomposition and transformation of plant residues could exhibit an increase and a decrease under N addition, respectively. These two opposite changes may lead to an insignificant response of MAOC to N addition [47].
Third, the presence of exchangeable cations facilitates the formation of organo-mineral complexes through polyvalent cation bond bridges and/or ligand exchange and protects SOC from microbial attack [16,48,49]. Therefore, we attribute the neutral response of MAOC to N addition to soil mineral protection. Specifically, Yu et al. [50] demonstrated that fertilization promoted the enrichment of aluminum and iron ions on the surface of soil particles, thereby enhancing soil aggregation. This increased soil aggregation reduced the rate of soil mineralization, potentially increasing MAOC storage and preservation [51]. In contrast, Chen et al. [15] indicated that N addition had no discernible effect on soil Al3+ content but decreased soil MAOC and Ca2+ contents. The reduction in Ca2+ content could regulate sorption and deposition reactions [48], resulting in the depletion of MAOC content. In this study, a significant rise in soil Al3+ content and simultaneous decline in Mg2+, Ca2+, and K+ contents were observed following the addition of N (Figure 2). Principal component analysis revealed a strong negative correlation between Al3+ and Ca2+ (or K+) (Figure 5). The reaction of different exchangeable cations to N addition may counteract the formation of organo-mineral associations, leading to an insignificant response of MAOC to the addition of N in this subtropical forest. Fourth, previous studies have shown that compared to aboveground litter, roots make a greater contribution to the MAOC, as they can interact with soil minerals, microorganisms, and aggregates [52,53]. However, fine root biomass was not influenced by short-term N addition in this study, and there was no significant relationship between fine root biomass and MAOC. The regulatory role of fine root biomass on MAOC needs further exploration. Overall, MAOC with a long turnover rate is critical for maintaining the persistence of SOC [54]. Thus, we propose enhancing SOC persistence by regulating soil exchangeable cations to facilitate mineral sorption of microbial necromass and its products.

5. Conclusions

In this study, we elucidated that short-term N addition has a significant positive effect on POC. The reason for the accumulation of POC caused by N addition is the combination of increased aboveground litter input and decreased microbial decomposition. By contrast, short-term N addition did not exhibit a marked effect on MAOC but significantly increased Al3+ content and decreased Mg2+, Ca2+, and K+ contents. The mineral sorption and desorption reactions may jointly lead to an insignificant response of MAOC to N addition. Overall, the response of different SOC functional fractions to N addition is inconsistent. Our study links the responses of POC and MAOC under N addition to the plant–microbial–soil system, emphasizing that incorporating different SOC functional fractions into ecosystem models will help more accurately predict SOC dynamics under climate change.

Author Contributions

Q.Z. (Qiufang Zhang), Y.C. and J.C. conceived and designed the study; H.D., Q.Z. (Quanxin Zeng), X.S. and W.C. collected the samples; J.C. and Y.P. analyzed the samples/data and wrote the manuscript with help from Q.Z. (Qiufang Zhang); Q.Z. (Qiufang Zhang), J.F., B.Z. and Y.C. revised the manuscript. All authors have read and agreed to the published version of the manuscript.

Funding

This work was supported by the National Natural Science Foundation of China (32101330 and 31988102) and the Opening Foundation of Laboratory for Earth Surface Processes, Ministry of Education.

Data Availability Statement

The data presented in this study are available on request from the corresponding author. The data are not publicly available due to privacy restrictions.

Acknowledgments

We would like to thank the administrative staff of Daiyun Mountain National Nature Reserve Administration Bureau for their support. We would also like to thank anonymous reviewers for their helpful comments and suggestions on this paper.

Conflicts of Interest

The authors declare no conflict of interest.

References

  1. Bradford, M.A.; Wieder, W.R.; Bonan, G.B.; Fierer, N.; Raymond, P.A.; Crowther, T.W. Managing uncertainty in soil carbon feedbacks to climate change. Nat. Clim. Change 2016, 6, 751–758. [Google Scholar] [CrossRef]
  2. Clark, C.M.; Tilman, D. Loss of plant species after chronic low-level nitrogen deposition to prairie grasslands. Nature 2008, 451, 712–715. [Google Scholar] [CrossRef]
  3. Ackerman, D.; Millet, D.B.; Chen, X. Global Estimates of Inorganic Nitrogen Deposition Across Four Decades. Glob. Biogeochem. Cycles 2019, 33, 100–107. [Google Scholar] [CrossRef]
  4. Yu, G.R.; Jia, Y.L.; He, N.P.; Zhu, J.X.; Chen, Z.; Wang, Q.F.; Piao, S.L.; Liu, X.J.; He, H.L.; Gou, X.B.; et al. Stabilization of atmospheric nitrogen deposition in China over the past decade. Nat. Geosci. 2019, 12, 424–429. [Google Scholar] [CrossRef]
  5. Greaver, T.L.; Clark, C.M.; Compton, J.E.; Vallano, D.; Talhelm, A.F.; Weaver, C.P.; Band, L.E.; Baron, J.S.; Davidson, E.A.; Tague, C.L.; et al. Key ecological responses to nitrogen are altered by climate change. Nat. Clim. Chang. 2016, 6, 836–843. [Google Scholar] [CrossRef]
  6. Cheng, S.J.; Hess, P.G.; Wieder, W.R.; Thomas, R.Q.; Nadelhoffer, K.J.; Vira, J.; Lombardozzi, D.L.; Gundersen, P.; Fernandez, I.J.; Schleppi, P.; et al. Decadal fates and impacts of nitrogen additions on temperate forest carbon storage: A data-model comparison. Biogeosciences 2019, 16, 2771–2793. [Google Scholar] [CrossRef]
  7. Ullah, S.; Raza, M.M.; Abbas, T.; Guan, X.; Zhou, W.; He, P. Responses of soil microbial communities and enzyme activities under nitrogen addition in fluvo-aquic and black soil of North China. Front. Microbiol. 2023, 14, 1249471. [Google Scholar] [CrossRef]
  8. Wu, Z.F.; Tang, Z.H.; Yu, T.Y.; Zhang, J.C.; Zheng, Y.M.; Yang, J.S.; Wu, Y. Nitrogen fertilization rates mediate rhizosphere soil carbon emissions of continuous peanut monoculture by altering cellulose-specific microbes. Front. Plant Sci. 2023, 14, 1109860. [Google Scholar] [CrossRef] [PubMed]
  9. Wang, M.H.; Li, F.C.; Dong, L.L.; Wang, X.; Han, L.B.; Olesen, J.E. Effects of exogenous organic/inorganic nitrogen addition on carbon pool distribution and transformation in grassland soil. Sci. Total Environ. 2023, 858, 159919. [Google Scholar] [CrossRef]
  10. Schmidt, M.W.I.; Torn, M.S.; Abiven, S.; Dittmar, T.; Guggenberger, G.; Janssens, I.A.; Kleber, M.; Kogel-Knabner, I.; Lehmann, J.; Manning, D.A.C.; et al. Persistence of soil organic matter as an ecosystem property. Nature 2011, 478, 49–56. [Google Scholar] [CrossRef]
  11. Qi, P.; Chen, J.; Wang, X.J.; Zhang, G.Z.; Cai, L.Q.; Jiao, Y.P.; Li, Z.Q.; Han, G.J. Changes in soil particulate and mineral-associated organic carbon concentrations under nitrogen addition in China—A meta-analysis. Plant Soil 2023, 489, 439–452. [Google Scholar] [CrossRef]
  12. Lavallee, J.M.; Soong, J.L.; Cotrufo, M.F. Conceptualizing soil organic matter into particulate and mineral-Associated forms to address global change in the 21st century. Glob. Chang. Biol. 2020, 26, 261–273. [Google Scholar] [CrossRef] [PubMed]
  13. Witzgall, K.; Vidal, A.; Schubert, D.I.; Höschen, C.; Schweizer, S.A.; Buegger, F.; Pouteau, V.; Chenu, C.; Mueller, C.W. Particulate organic matter as a functional soil component for persistent soil organic carbon. Nat. Commun. 2021, 12, 4115. [Google Scholar] [CrossRef] [PubMed]
  14. Poeplau, C.; Don, A.; Six, J.; Kaiser, M.; Benbi, D.; Chenu, C.; Cotrufo, M.F.; Derrien, D.; Gioacchini, P.; Grand, S.; et al. Isolating organic carbon fractions with varying turnover rates in temperate agricultural soils-A comprehensive method comparison. Soil Biol. Biochem. 2018, 125, 10–26. [Google Scholar]
  15. Chen, J.G.; Wen, X.; Zheng, C.Y.; Zhu, B. Nitrogen addition has contrasting effects on particulate and mineral-associated soil organic carbon in a subtropical forest. Soil Biol. Biochem. 2020, 142, 107708. [Google Scholar] [CrossRef]
  16. Feng, H.L.; Guo, J.H.; Peng, C.H.; Kneeshaw, D.; Roberge, G.; Pan, C.; Ma, X.H.; Zhou, D.; Wang, W.F. Nitrogen addition promotes terrestrial plants to allocate more biomass to aboveground organs: A global meta-analysis. Glob. Chang. Biol. 2023, 29, 3970–3989. [Google Scholar]
  17. Sun, T.; Mao, X.L.; Han, K.F.; Wang, X.J.; Cheng, Q.; Liu, X.; Zhou, J.J.; Ma, Q.X.; Ni, Z.H.; Wu, L.H. Nitrogen addition increased soil particulate organic carbon via plant carbon input whereas reduced mineral−associated organic carbon through attenuating mineral protection in agroecosystem. Sci. Total Environ. 2023, 899, 165705. [Google Scholar] [CrossRef]
  18. Angst, G.; Mueller, K.E.; Nierop, K.G.J.; Simpson, M.J. Plant or microbial-derived? A review on the molecular composition of stabilized soil organic matter. Soil Biol. Biochem. 2021, 156, 108–189. [Google Scholar]
  19. Craig, M.E.; Geyer, K.M.; Beidler, K.V.; Brzostek, E.R.; Frey, S.D.; Stuart, G.A.; Liang, C.; Phillips, R.P. Fast-decaying plant litter enhances soil carbon in temperate forests but not through microbial physiological traits. Nat. Commun. 2022, 13, 1229. [Google Scholar] [CrossRef]
  20. Tian, D.S.; Niu, S.L. A global analysis of soil acidification caused by nitrogen addition. Environ. Res. Lett. 2015, 10, 024019. [Google Scholar] [CrossRef]
  21. Rocci, K.S.; Lavallee, J.M.; Stewart, C.E.; Cotrufo, M.F. Soil organic carbon response to global environmental change depends on its distribution between mineral-associated and particulate organic matter: A meta-analysis. Sci. Total Environ. 2021, 793, 148569. [Google Scholar] [CrossRef]
  22. Riggs, C.E.; Hobbie, S.E. Mechanisms driving the soil organic matter decomposition response to nitrogen enrichment in grassland soils. Soil Biol. Biochem. 2016, 99, 54–65. [Google Scholar] [CrossRef]
  23. Ye, C.L.; Chen, D.M.; Hall, S.J.; Pan, S.; Yan, X.B.; Bai, T.S.; Guo, H.; Zhang, Y.; Bai, Y.F.; Hu, S.J. Reconciling multiple impacts of nitrogen enrichment on soil carbon: Plant, microbial and geochemical controls. Ecol. Lett. 2018, 21, 1162–1173. [Google Scholar] [CrossRef]
  24. Zhang, H.; Liu, Y.H.; Zhou, Z.Y.; Zhang, Y.Y. Inorganic nitrogen addition affects soil respiration and belowground organic carbon fraction for a Pinus tabuliformis forest. Forests 2019, 10, 369. [Google Scholar] [CrossRef]
  25. Wu, J.J.; Zhang, H.; Pan, Y.T.; Cheng, X.L.; Zhang, K.R.; Liu, G.H. Particulate organic carbon is more sensitive to nitrogen addition than mineral-associated organic carbon: A meta-analysis. Soil Tillage Res. 2023, 232, 105770. [Google Scholar] [CrossRef]
  26. Lehmann, J.; Kleber, M. The contentious nature of soil organic matter. Nature 2015, 528, 60–68. [Google Scholar] [CrossRef]
  27. Six, J.; Conant, R.T.; Paul, E.A.; Paustian, K. Stabilization mechanisms of soil organic matter: Implications for C-saturation of soils. Plant Soil 2002, 241, 155–176. [Google Scholar] [CrossRef]
  28. Lugato, E.; Lavallee, J.M.; Haddix, M.L.; Panagos, P.; Cotrufo, M.F. Different climate sensitivity of particulate and mineral-associated soil organic matter. Nat. Geosci. 2021, 14, 295–300. [Google Scholar] [CrossRef]
  29. Zeng, Q.X.; Fan, Y.X.; Zhang, Q.F.; Yuan, X.C.; Lin, K.M.; Zhou, J.C.; Lin, H.Y.; Xie, H.; Cui, J.Y.; Wu, Y.; et al. Differential factors determine the response of soil P fractions to N deposition in wet and dry seasons in a subtropical Moso bamboo forest. Plant Soil 2022. [Google Scholar] [CrossRef]
  30. Zhou, G.Y.; Yan, J.H. The influences of regional atmospheric precipitation characteristics and its element inputs on the existence and development of Dinghushan forest ecosystems. Acta Ecol. Sin. 2001, 21, 2002–2012. [Google Scholar]
  31. Yuan, L.; Li, W.; Chen, W.; Zhang, J.; Cai, Z. Characteristics of nitrogen deposition in Daiyun Mountain National Nature Reserve. Environ. Sci. 2016, 37, 4142–4146. [Google Scholar]
  32. Vance, E.D.; Brookes, P.C.; Jenkinson, D.S. An extraction method for soil microbial biomass-C. Soil Biol. Biochem. 1987, 19, 703–707. [Google Scholar] [CrossRef]
  33. Abhiram, G.; Grafton, M.; Jeyakumar, P.; Bishop, P.; Davies, C.E.; McCurdy, M. The Nitrogen Dynamics of Newly Developed Lignite-Based Controlled-Release Fertilisers in the Soil-Plant Cycle. Plants 2022, 11, 3288. [Google Scholar] [CrossRef]
  34. Marriott, E.E.; Wander, M.M. Total and labile soil organic matter in organic and conventional farming systems. Soil Sci. Soc. Am. J. 2006, 70, 950–959. [Google Scholar] [CrossRef]
  35. Saiya-Cork, K.R.; Sinsabaugh, R.L.; Zak, D.R. The effects of long term nitrogen deposition on extracellular enzyme activity in an Acer saccharum forest soil. Soil Biol. Biochem. 2002, 34, 1309–1315. [Google Scholar] [CrossRef]
  36. Riggs, C.E.; Hobbie, S.E.; Bach, E.M.; Hofmockel, K.S.; Kazanski, C.E. Nitrogen addition changes grassland soil organic matter decomposition. Biogeochemistry 2015, 125, 203–219. [Google Scholar] [CrossRef]
  37. Chen, H.; Li, D.; Feng, W.; Niu, S.; Plante, A.; Luo, Y.; Wang, K. Different responses of soil organic carbon fractions to additions of nitrogen. Eur. J. Soil Sci. 2018, 69, 1098–1104. [Google Scholar] [CrossRef]
  38. Cotrufo, M.F.; Lavallee, J.M. Chapter One-Soil organic matter formation, persistence, and functioning: A synthesis of current understanding to inform its conservation and regeneration. Adv. Agron. 2022, 172, 1–66. [Google Scholar]
  39. Yang, X.; Wang, Y.; Xu, Q.; Liu, W.; Liu, L.; Wu, Y.; Jiang, L.; Lu, J. Soil fertility underlies the positive relationship between island area and litter decomposition in a fragmented subtropical forest landscape. CATENA 2021, 204, 105414. [Google Scholar] [CrossRef]
  40. Sokol, N.W.; Kuebbing, S.E.; Karlsen-Ayala, E.; Bradford, M.A. Evidence for the primacy of living root inputs, not root or shoot litter, in forming soil organic carbon. New Phytol. 2019, 221, 233–246. [Google Scholar] [CrossRef]
  41. Liang, C.; Schimel, J.P.; Jastrow, J.D. The importance of anabolism in microbial control over soil carbon storage. Nat. Microbiol. 2017, 2, 17105. [Google Scholar] [CrossRef] [PubMed]
  42. Averill, C.; Waring, B. Nitrogen limitation of decomposition and decay: How can it occur. Glob. Chang. Biol. 2018, 24, 1417–1427. [Google Scholar] [CrossRef] [PubMed]
  43. Yan, B.G.; Sun, Y.; He, G.X.; He, R.L.; Zhang, M.Y.; Fang, H.D.; Shi, L.T. Nitrogen enrichment affects soil enzymatic stoichiometry via soil acidification in arid and hot land. Pedobiologia 2020, 81–82, 150663. [Google Scholar] [CrossRef]
  44. Bowman, W.D.; Cleveland, C.C.; Lubos, H.; Hresko, J.; Baron, J.S. Negative impact of nitrogen deposition on soil buffering capacity. Nat. Geosci. 2008, 1, 767–770. [Google Scholar] [CrossRef]
  45. Lu, X.K.; Vitousek, P.M.; Mao, Q.G.; Gilliam, F.S.; Luo, Y.Q.; Turner, B.L.; Zhou, G.Y.; Mo, J.M. Nitrogen deposition accelerates soil carbon sequestration in tropical forests. Proc. Natl. Acad. Sci. USA 2021, 118, 16. [Google Scholar] [CrossRef] [PubMed]
  46. Chen, Y.; Liu, X.; Hou, Y.H.; Zhou, S.R.; Zhu, B. Particulate organic carbon is more vulnerable to nitrogen addition than mineral-associated organic carbon in soil of an alpine meadow. Plant Soil 2021, 458, 93–103. [Google Scholar]
  47. Feng, J.G.; He, K.Y.; Zhang, Q.F.; Han, M.G.; Zhu, B. Changes in plant inputs alter soil carbon and microbial communities in forest ecosystems. Glob. Chang. Biol. 2022, 28, 3426–3440. [Google Scholar] [CrossRef]
  48. Rowley, M.C.; Grand, S.; Verrecchia, É.P. Calcium-mediated stabilisation of soil organic carbon. Biogeochemistry 2018, 137, 27–49. [Google Scholar]
  49. Tang, B.; Rocci, K.S.; Lehmann, A.; Rillig, M.C. Nitrogen increases soil organic carbon accrual and alters its functionality. Glob. Chang. Biol. 2023, 29, 1971–1983. [Google Scholar] [CrossRef]
  50. Yu, G.H.; Xiao, J.; Hu, S.J.; Polizzotto, M.L.; Zhao, F.J.; Mcgrath, S.P.; Li, H.; Ran, W.; Shen, Q.R. Mineral availability as a key regulator of soil carbon storage. Environ. Sci. Technol. 2017, 51, 4960–4969. [Google Scholar] [CrossRef]
  51. Waychunas, G.A.; Kim, C.S.; Banfield, J.F. Nanoparticulate iron oxide minerals in soils and sediments: Unique properties and contaminant scavenging mechanisms. J. Nanopart. Res. 2005, 7, 409–433. [Google Scholar] [CrossRef]
  52. Wu, J.J.; Zhang, D.D.; Chen, Q.; Feng, J.; Li, Q.X.; Yang, F.; Zhang, Q.; Cheng, X.L. Shifts in soil organic carbon dynamics under detritus input manipulations in a coniferous forest ecosystem in subtropical China. Soil Biol. Biochem. 2018, 126, 1–10. [Google Scholar] [CrossRef]
  53. Whalen, E.D.; Lounsbury, N.; Geyer, K.; Anthony, M.; Morrison, E.; van Diepen, L.T.A.; Le Moine, J.; Nadelhoffer, K.; vanden Enden, L.; Simpson, M.J.; et al. Root control of fungal communities and soil carbon stocks in a temperate forest. Soil Biol. Biochem. 2021, 161, 108390. [Google Scholar] [CrossRef]
  54. Kristensen, J.A.; Svenning, J.; Georgiou, K.; Malhi, Y. Can large herbivores enhance ecosystem carbon persistence. Trends Ecol. Evol. 2022, 37, 117–128. [Google Scholar]
Figure 1. Effects of N addition on the contents of particulate organic carbon (POC, (a)) and mineral-associated organic carbon (MAOC, (b)). Boxes and horizontal lines represent the quartile range and median, respectively, with lines extending 1.5 times above and below the quartile range (n = 4). Solid gray dots represent individual sample points. p value represents the main effect of N addition. Significant differences between various N addition treatments are shown by different letters above the boxes (p < 0.05). CT, LN, and HN represent control, low-nitrogen, and high-nitrogen treatments, respectively.
Forests 15 00619 g001
Figure 2. Effects of N addition on the contents of exchangeable cations (K+, (a); Na+, (b); Ca2+, (c); Mg2+, (d); Al3+, (e)) in soil samples. Boxes and horizontal lines represent the quartile range and median, respectively, with lines extending 1.5 times above and below the quartile range (n = 4). Solid gray dots represent individual sample points. p value represents the N addition effect. Significant differences between various N addition treatments are shown by different letters above the boxes (p < 0.05). CT, LN, and HN represent control, low-nitrogen, and high-nitrogen treatments, respectively.
Forests 15 00619 g002
Figure 3. Effects of N addition on the activities of β-glucosidase (BG, (a)) and 1, 4-β-cellobiohydrolase (CBH, (b)). Boxes and center lines represent the quartile range and median, respectively, with lines extending 1.5 times above and below the quartile range (n = 4). Solid gray dots represent individual sample points. p value represents the N addition effect. Significant differences between various N addition treatments are shown by different letters above the boxes (p < 0.05). CT, LN, and HN represent control, low-nitrogen, and high-nitrogen treatments, respectively.
Forests 15 00619 g003
Figure 4. Effects of N addition on aboveground litter product (a) and fine root biomass (b). Boxes and center lines represent the quartile range and median, respectively, with lines extending 1.5 times above and below the quartile range (n = 4). Solid gray dots represent individual sample points. p value represents the N addition effect. Significant differences between various N addition treatments are shown by different letters above the boxes (p < 0.05). CT, LN, and HN represent control, low-nitrogen, and high-nitrogen treatments, respectively.
Forests 15 00619 g004
Figure 5. Principal component analysis of soil organic carbon fractions and other soil parameters. POC, particulate organic carbon; MAOC, mineral-associated organic carbon; SOC, soil organic carbon; MN, mineral nitrogen; Litter, aboveground litter product; Root, fine root biomass; BG, β-glucosidase; CBH, 1, 4-β-cellobiohydrolase.
Forests 15 00619 g005
Table 1. Effects of N addition on physiochemical characteristics of soils (mean ± standard deviation, n = 4).
TreatmentCTLNHNp Value
pH4.94 ± 0.04 a4.58 ± 0.07 b4.46 ± 0.12 b<0.01
SOC (g kg−1)51.0 ± 3.1 b57.5 ± 5.1 a58.0 ± 3.2 a<0.01
TN (g kg−1)3.85 ± 0.27 b4.44 ± 0.18 a4.65 ± 0.26 a<0.01
SOC:TN13.3 ± 0.8 a13.0 ± 1.3 a12.5 ± 0.5 a0.58
Mineral N (mg kg−1)56.2 ± 5.6 b70.8 ± 8.4 a76.8 ± 7.2 a<0.01
MBC (mg kg−1)1790 ± 67 a1429 ± 146 b1314 ± 75 b<0.01
p value represents the main effect of N addition. Different letters in the same row indicate significant differences among the N addition treatments.
Disclaimer/Publisher’s Note: The statements, opinions and data contained in all publications are solely those of the individual author(s) and contributor(s) and not of MDPI and/or the editor(s). MDPI and/or the editor(s) disclaim responsibility for any injury to people or property resulting from any ideas, methods, instructions or products referred to in the content.

