Article

The Seasonal Impact of Thinning Intensities on Soil Carbon Cycling in the Lesser Xing’an Range, Northeast China

1
Key Laboratory of Sustainable Forest Management and Environmental Microorganism Engineering of Heilongjiang Province, Northeast Forestry University, Harbin 150036, China
2
Faculty of Forestry and Environmental Management, University of New Brunswick, Fredericton, NB E3B 5A3, Canada
*
Author to whom correspondence should be addressed.
These authors contributed equally to this work.
Forests 2024, 15(3), 449; https://doi.org/10.3390/f15030449
Submission received: 8 February 2024 / Revised: 24 February 2024 / Accepted: 26 February 2024 / Published: 27 February 2024

Abstract

:
Forest degradation, driven by human and natural factors, diminishes ecological functions and carbon storage. Understanding the complex dynamics of soil carbon pools is crucial for the global carbon cycle, although these dynamics are poorly understood. This study examines how different thinning intensities influence seasonal soil carbon cycling in degraded forests. ANOVA revealed significant differences in soil properties across treatments (p < 0.05). Redundancy analysis and random forest analyses were used to explore relationships among thinning intensities, soil properties, and carbon sequestration. Thinning significantly altered soil attributes, as revealed by field experiments and data analysis. Moderate thinning (20% intensity) significantly enhanced litter retention and soil nutrient levels year-round (p < 0.05). Seasonal variations affected soil carbon dynamics and lower thinning intensities improved carbon sequestration in spring and summer. Conversely, higher thinning intensities led to carbon loss in autumn and winter. Litter carbon, fine root carbon, and correction factor significantly respond to thinning intensities year-round as examined through redundancy analysis and random forest analyses. Findings indicate moderate thinning effectively enhances soil carbon sequestration in degraded forests. Strategically planned thinning could aid climate change mitigation by boosting forest soil carbon storage, influencing forest management and conservation.

1. Introduction

Forests are essential ecosystems, crucial to the modern world [1]. Forests, rich in biodiversity and key to the global carbon cycle, provide habitats for many species [2]. Through photosynthesis, forests capture atmospheric carbon dioxide and transform it into organic matter, which is the main method of carbon storage in soil [3,4]. Soil stores carbon as organic carbon over extended periods, though some is eventually reconverted to carbon dioxide and emitted into the atmosphere [5]. However, human activities like excessive logging and agricultural development, along with natural factors such as wildfires and pest infestations, are increasingly destroying and degrading forests [6]. Consequently, these degraded forests’ soils suffer a significant reduction in both ecological functions and carbon storage capacity [7]. The protection and restoration of these forests to enhance their ecological integrity and carbon storage is imperative. Effective forest management strategies are increasingly recognized for their importance. Management-induced adjustments to forest structure can differently impact the soil carbon cycle in various seasons, affecting the forest’s role as a carbon sink [8,9].
The soil carbon pool is critical for carbon storage in forest ecosystems, significantly affecting overall carbon storage. Its fluctuations are key in defining the ecosystem’s function as either a carbon source or sink [10]. Despite the soil carbon pool’s critical role in the global carbon cycle, our understanding of carbon sources, losses, and cycles within this complex system remains limited [11]. Consequently, the soil carbon cycle, a critical component, has garnered considerable attention from scientists [12]. Soil carbon storage, a vital element of the global carbon cycle, directly impacts greenhouse gas emissions and atmospheric carbon dioxide levels [13]. Degraded forests reduce carbon sequestration and can increase carbon release, thus, accelerating climate change [14]. Hence, comprehending and enhancing these forest soils’ carbon cycle processes is vital in tackling global climate change [15]. The soil carbon cycle comprises two main components: carbon input and output. Carbon inputs primarily derive from decomposing plant residues and atmospheric carbon deposition, while outputs occur through soil respiration and leaching [16]. Given that carbon deposition and leaching are influenced by precipitation, litter decomposition and soil respiration, which release carbon, are key indicators of the soil carbon cycle, and are often used to assess the system’s carbon status [17,18]. A profound understanding of the soil carbon cycle is essential for predicting and managing forest ecosystems’ carbon cycle [19]. Accurate quantification of carbon inputs and outputs is crucial in evaluating the soil carbon cycle, as factors like soil temperature and moisture affect the decomposition rate of plant residues [20]. Additionally, in identical experimental plots, atmospheric deposition remains relatively constant [21]. Seasonal and environmental conditions influence soil carbon outputs, like those released through soil respiration [22]. This interplay of factors renders predicting and managing forest ecosystems’ carbon cycle complex. Consequently, adopting suitable ecological restoration measures is crucial for comprehending the soil carbon cycle’s seasonal variations and devising effective forest management strategies.
Ecological restoration measures are vital in forest ecosystems for enhancing forest quality and increasing soil carbon storage capacity. These measures, including thinning, reforestation, and sustainable forestry management, produce diverse effects [23]. Sustainable forestry management practices, like limiting logging intensity, practicing selective logging, and preserving forest land diversity, are crucial for boosting forest carbon storage capacity [24,25]. These methods contribute to the balance and stability of forest ecosystems, ensuring long-term carbon fixation and storage. Varying ecological restoration measures can have different impacts on soil carbon cycling. For instance, factors such as the intensity of forest thinning, afforestation type and density, and climate conditions influence carbon fixation rates and amounts [26]. Thus, selecting suitable restoration strategies is crucial for maximizing soil carbon storage. Thinning, a strategic forest management approach, lowers stand density to boost understory vegetation growth and biodiversity, thus, elevating soil organic matter and improving soil carbon storage [27]. Selective tree removal enhances the health and growth of the remaining trees, increasing the forest carbon sequestration and reducing emissions from tree disease and death [28]. Appropriate thinning alters forest structure and composition, aiding regeneration, combating climate change, and benefiting the long-term carbon cycle in forest ecosystems [29]. The careful application of thinning techniques is vital for boosting forest carbon storage and combating climate change [30].
This study examines how ecological thinning affects soil carbon cycling’s seasonal variations in degraded forests. Conducting field experiments and data analysis, this study compared the seasonal impacts of varying thinning intensities on soil carbon cycling in degraded forests. We analyzed how restoration measures affect soil carbon inputs and outputs across seasons, identifying the significance of soil environmental factors on thinning intensity during these changes. This study addresses a knowledge gap in the forest soil carbon cycle, focusing on seasonal variations in thinning intensity effects. It explores the impact of different thinning levels on soil carbon sequestration and release, providing insights into soil carbon stock dynamics in degraded forests. Findings indicate moderate thinning enhances soil carbon storage, which is essential for climate change mitigation and forest management. The research findings enhance our understanding of soil carbon cycling mechanisms and offer a scientific basis for developing effective forest management and restoration strategies.

2. Materials and Methods

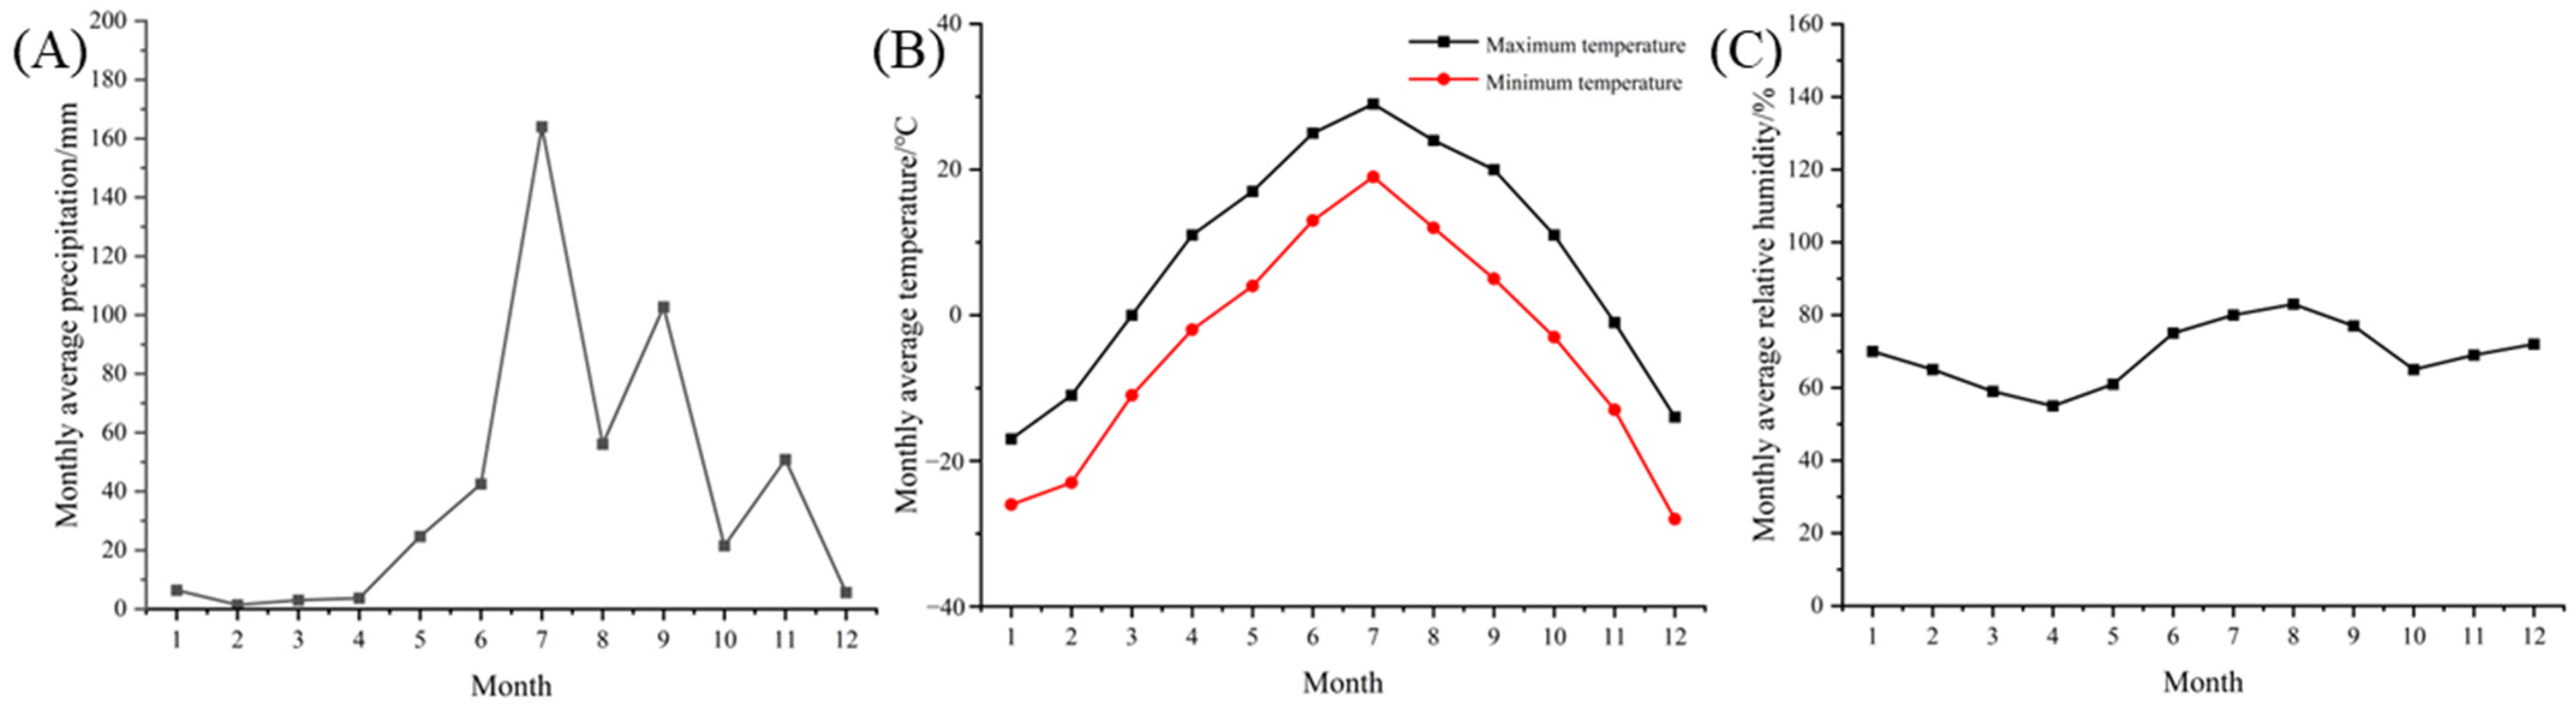
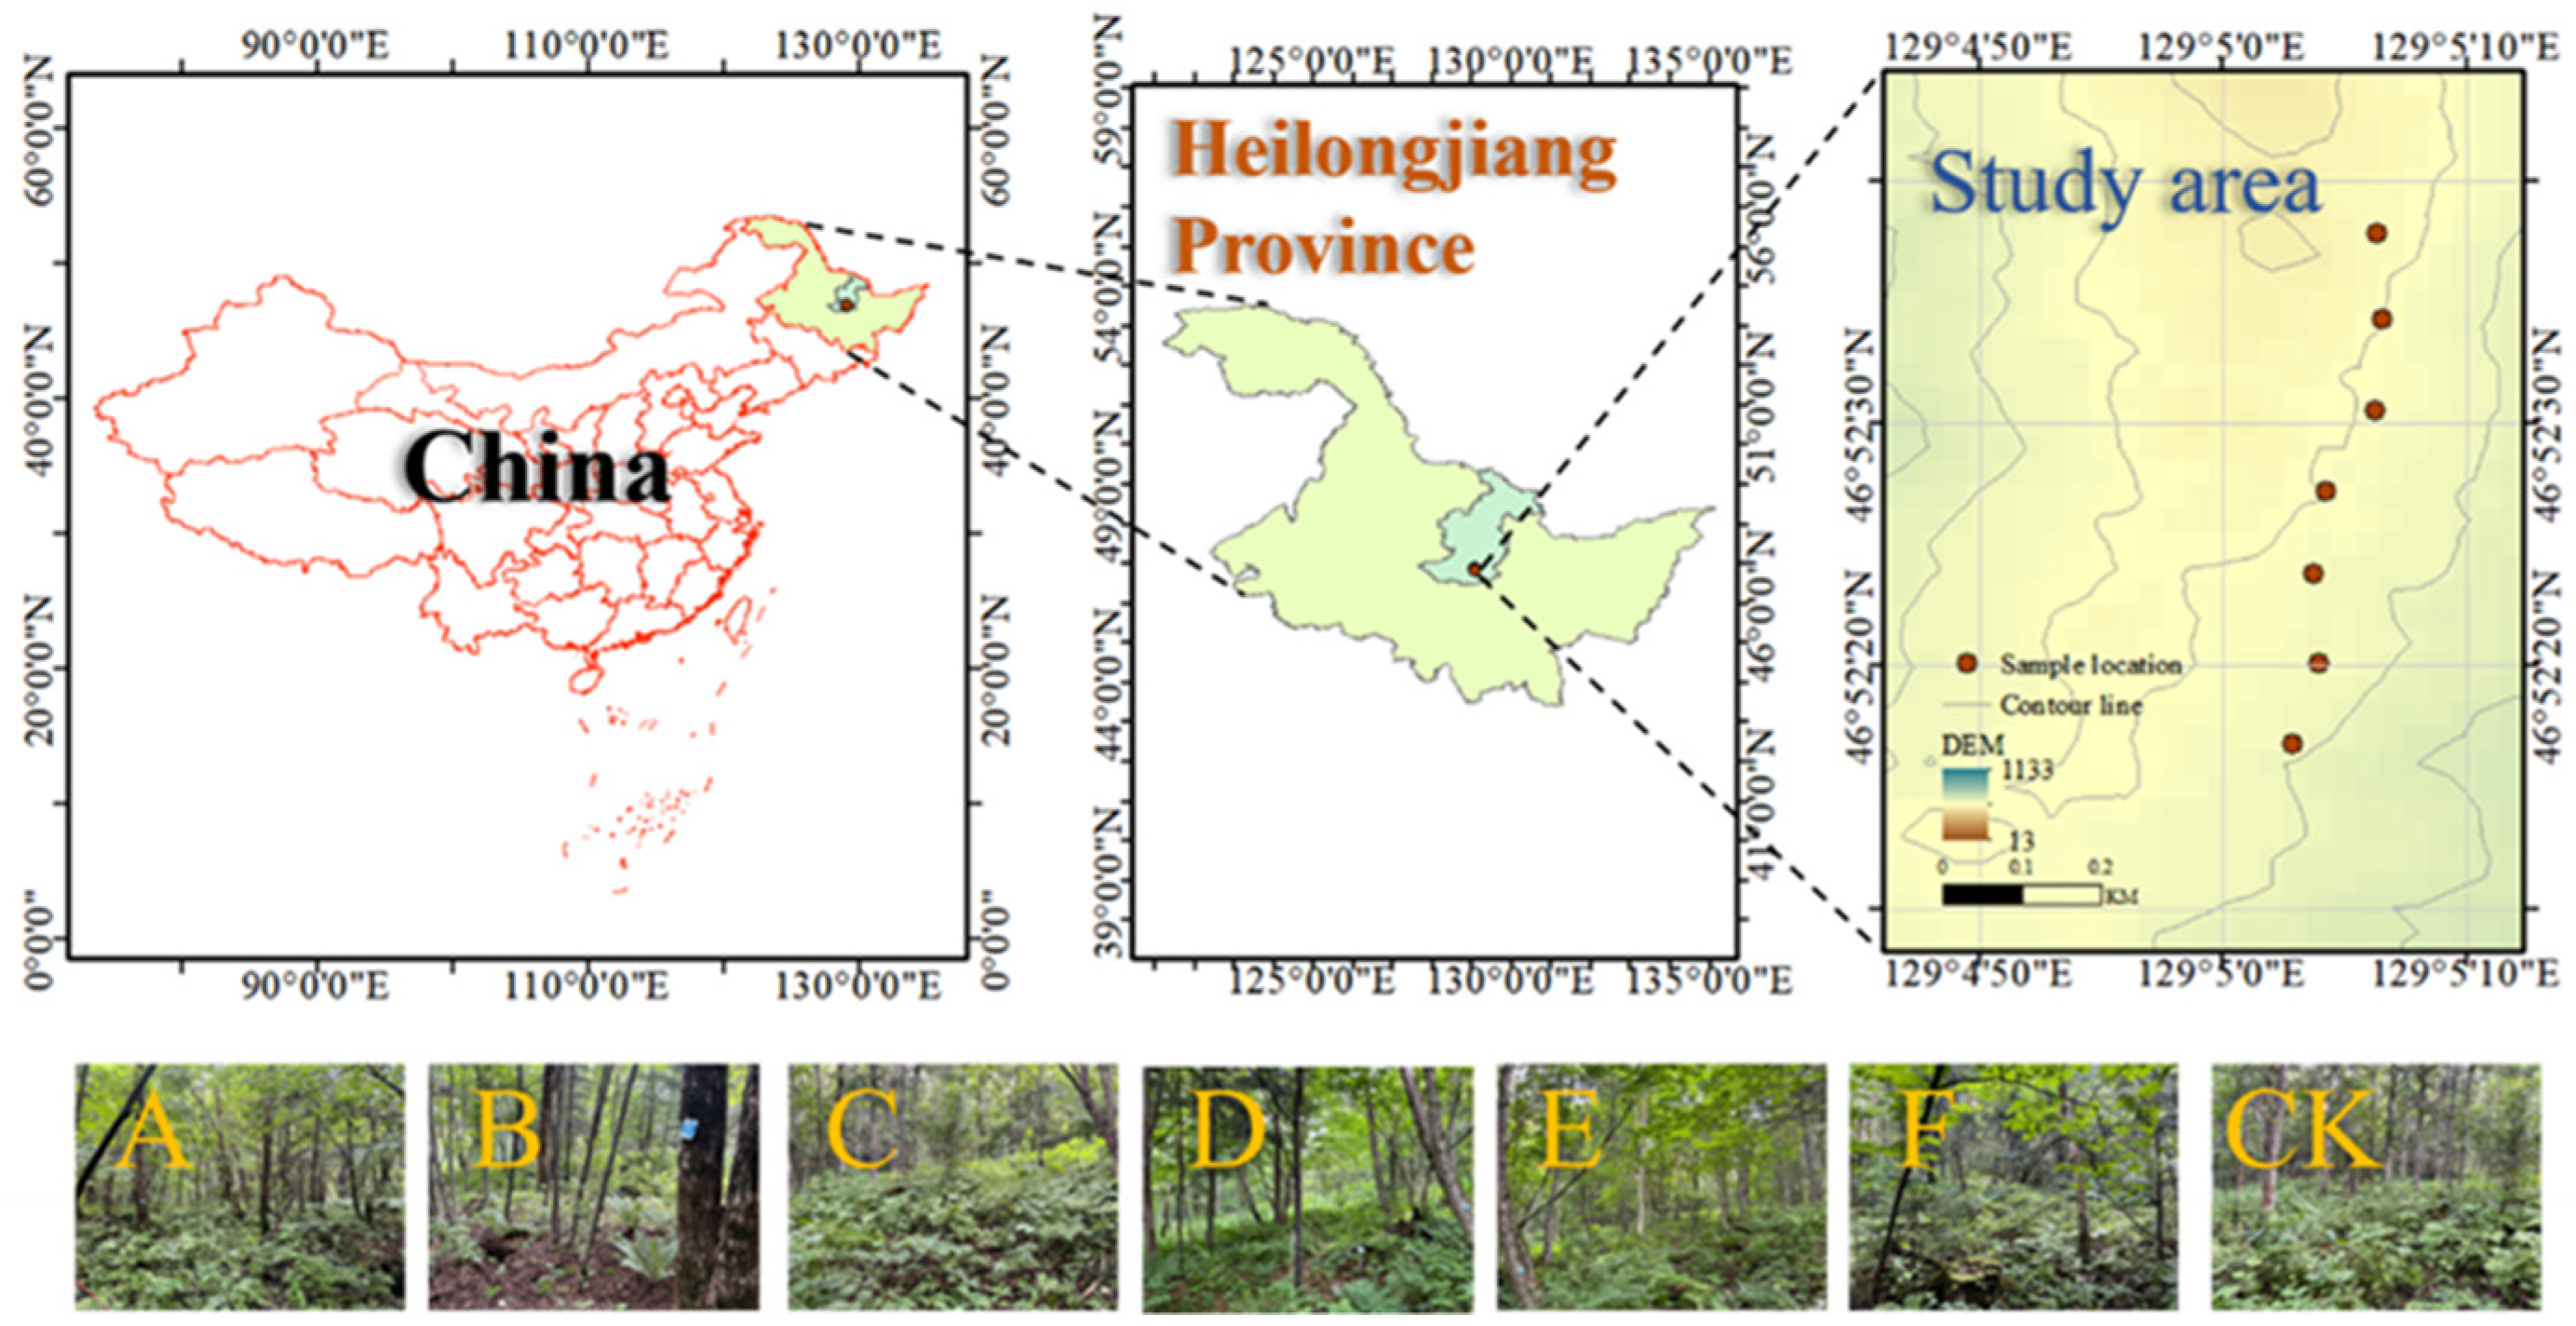
2.1. Overview of the Study Area

A forest management experiment was conducted at the Dongfanghong Forestry Farm in Daqingshan County, Yichun City, situated in the Lesser Xing’an Range of Northeast China. The region, located at longitude 128°37′–129°17′ and latitude 46°50′–47°21′, experiences a continental humid monsoon climate. Figure 1 displays the fundamental climate conditions at the research location. Predominantly dark brown soil supports the area’s primary mixed coniferous and broadleaf forests. However, the forest is severely degraded, suffering from low species diversity, disrupted stand structures, and ecosystem fragility. In November 2011, researchers initiated an experiment to address these issues by improving the degraded mixed forest through thinning and reforestation. The experiment included seven thinning treatments with intensities ranging from 10% to 35% and a control group without thinning (CK), as shown in Figure 2. Each 100 by 100 m treatment was replicated three times, including three 30 by 30 m plots and a 10 m buffer zone to minimize edge effects [31,32]. Treatment areas, spaced 100 m apart, ensured consistency in environmental factors like slope, aspect, and forest type. Prior to thinning, the forest stands averaged 70 years in age, with trees reaching 10.5 m in height and 13.5 cm in DBH. Thinning involved a lower layer tending method, which involved removing non-target species, excess harmful trees, and those suppressed, dying, malformed, dead, or diseased. It was accompanied by replanting, and Pinus koraiensis Siebold & Zucc. and Picea koraiensis Nakai were selected as the species for replanting. In 2021, a field survey measured species, DBH, height, and tree counts with a DBH over 5 cm across the seven experimental plots (Table 1).

2.2. Experimental Design and Sample Collection

2.2.1. Litter Decomposition

In July 2021, three 1 m × 1 m litter collection baskets were deployed in each thinning plot to collect all newly fallen senescent leaves, encompassing both coniferous and broadleaf types. Leaves collected were merged into one sample, brought to the lab, and dried in an oven at 65 °C until they weighed consistently. For the initial carbon content analysis, 45 g of this material was set aside. The remainder was placed into nylon mesh bags measuring 15 cm × 15 cm with a 1 mm mesh, with each bag containing 15 g. Five sample quadrats were established diagonally at each plot and thinning intensity level, after clearing the soil surface of existing litter and debris. The decomposition bags were then secured to the soil surface with wire, with four bags placed in each quadrat. Bags were removed from each quadrat after 46 (autumn), 101 (winter), 294 (spring), and 370 (summer) days to assess the mass and carbon content changes in the decomposed litter [33].

2.2.2. Fine Root Decomposition

We collected fine roots using the soil coring method [34]. In July 2021, a soil corer (50 mm diameter and 25 cm length bit) was used to extract soil cores up to 20 cm deep. The cores were placed in sterilized bags for transportation to the laboratory. Initially, soil cores were water-soaked to detach roots from soil, with fine roots under 2 mm in diameter being selected. Living and dead roots were then differentiated by the fine roots’ color, shape, elasticity, and cortex separation from the stele, using flotation. Fine roots were oven-dried at 65 °C to a constant weight for initial carbon content analysis. Remaining fine roots were packed into 10 cm × 10 cm, 60-mesh nylon bags, each weighing 2.0 g (accuracy: 0.0001 g and margin of error: ± 0.0005 g). In each thinning intensity plot, five quadrats were diagonally arranged, hosting four fine root decomposition bags each. Bags were retrieved after 46 (autumn), 101 (winter), 294 (spring), and 370 days (summer) for analysis of mass and carbon content changes in decomposed fine roots.

2.2.3. Soil Sample Collection

In July 2021, we organized five quadrats in a “Z” formation across plots with different thinning intensities, collecting soil samples from depths of 0 to 20 cm in each quadrat. We used a 100 cm3 ring knife to collect a portion of the samples, aiming to measure physical soil properties like temperature, moisture content, and bulk density. Another set of samples was sieved through a 2 mm mesh before being frozen, for evaluating chemical properties such as pH, organic carbon, total nitrogen, and the carbon-to-nitrogen ratio.

2.3. Analytical Methods

2.3.1. Soil Properties

The study measured soil properties including pH, temperature, moisture, bulk density, organic carbon content, total nitrogen content, and the carbon-to-nitrogen ratio. Soil pH is measured by mixing soil with water in a 1:5 w/v ratio then shaking for 30 min, followed by analysis with a Sartorius AG pH meter (Göttingen, Germany) [35]. Soil temperature and moisture are precisely measured using the LI-8150 system (Lincoln, NE, USA), which includes a Type E thermocouple and an EC-5 soil moisture probe. Soil bulk density determination typically employs the core method [36]. The potassium dichromate–sulfuric acid oxidation method quantifies soil organic carbon (SOC) content [37]. The Kjeldahl method is used to quantify total nitrogen (TN) content in soil [38]. The carbon-to-nitrogen ratio is derived from the ratio of organic carbon to total nitrogen.

2.3.2. Litter and Fine Root Carbon Content

Aboveground litter and belowground fine roots, once crushed and sieved, are digested with an H2SO4–H2O2 mixture to create a stock solution. The carbon content is then determined through the potassium dichromate oxidation method [37].

2.3.3. Residual Rate and Decomposition Rate

Decomposition rates are determined using the Olson negative exponential decay model [39,40]:
M 1 M t = a e k t
where M1 represents the initial mass (g) of aboveground litter and belowground fine roots, Mt denotes their mass (g) at time t (years), and k is the decomposition coefficient.
The mass residue rate (MR) and nutrient residue rate (NR) for both aboveground litter and belowground fine roots are defined by the following parameters:
M R = M 1 M t × 100 %
N R = C t M t C 1 M 1 × 100 %
where C1 denotes the initial nutrient concentration (mg/g), while Ct denotes the concentration post-decomposition over time t.
Litter carbon release (LC) is calculated as:
L C = L B × C % L B n × C n %
where LC represents the carbon released from litter, LB denotes the initial mass of the litter prior to decomposition, C (%) indicates the carbon content percentage in the litter, LBn represents the mass of litter remaining post-decomposition, and Cn (%) specifies the carbon content percentage in the residual litter.
Fine root carbon release (FRC) is calculated as:
F R C = F R B × C % F R B n × C n %
where FRC represents the carbon released from fine root, FRB denotes the initial mass of the fine root prior to decomposition, C (%) indicates the carbon content percentage in the fine root, FRBn represents the mass of fine root remaining post-decomposition, and Cn (%) specifies the carbon content percentage in the residual fine root.

2.3.4. Soil Carbon Storage and Respiration

Carbon storage in soil layers is calculated as follows:
S S O D = i = 1 n C i × P i × T i 10 1
where SSOD represents the organic carbon storage (t/hm2) at a specified depth. Here, Ci is the average organic carbon content (g/kg), Pi the bulk density (g/cm3), and Ti the thickness (cm) of the ith layer. The variable n indicates the total number of soil layers.
Soil respiration (SR) assessments near our sampling points utilized the LI-8150 system. A 20 cm inner diameter PVC soil collar was installed in the soil one day before the survey, protruding 2–3 cm above the surface to safeguard the original litter at its boundary. Measurements were taken every half hour over a 24 h period using the LI-8150 multiplex system. The formula to calculate the quarterly respiratory carbon loss is presented as:
S R C = F × 365 × 24 × 10,000 × 0.2727 / 1,000,000
where SRC (t/hm2) denotes the quarterly respiratory carbon loss and where F represents the daily soil respiration rate. Here, 365 signifies the number of days in a year, and 0.2727 corresponds to the carbon fraction in carbon dioxide.

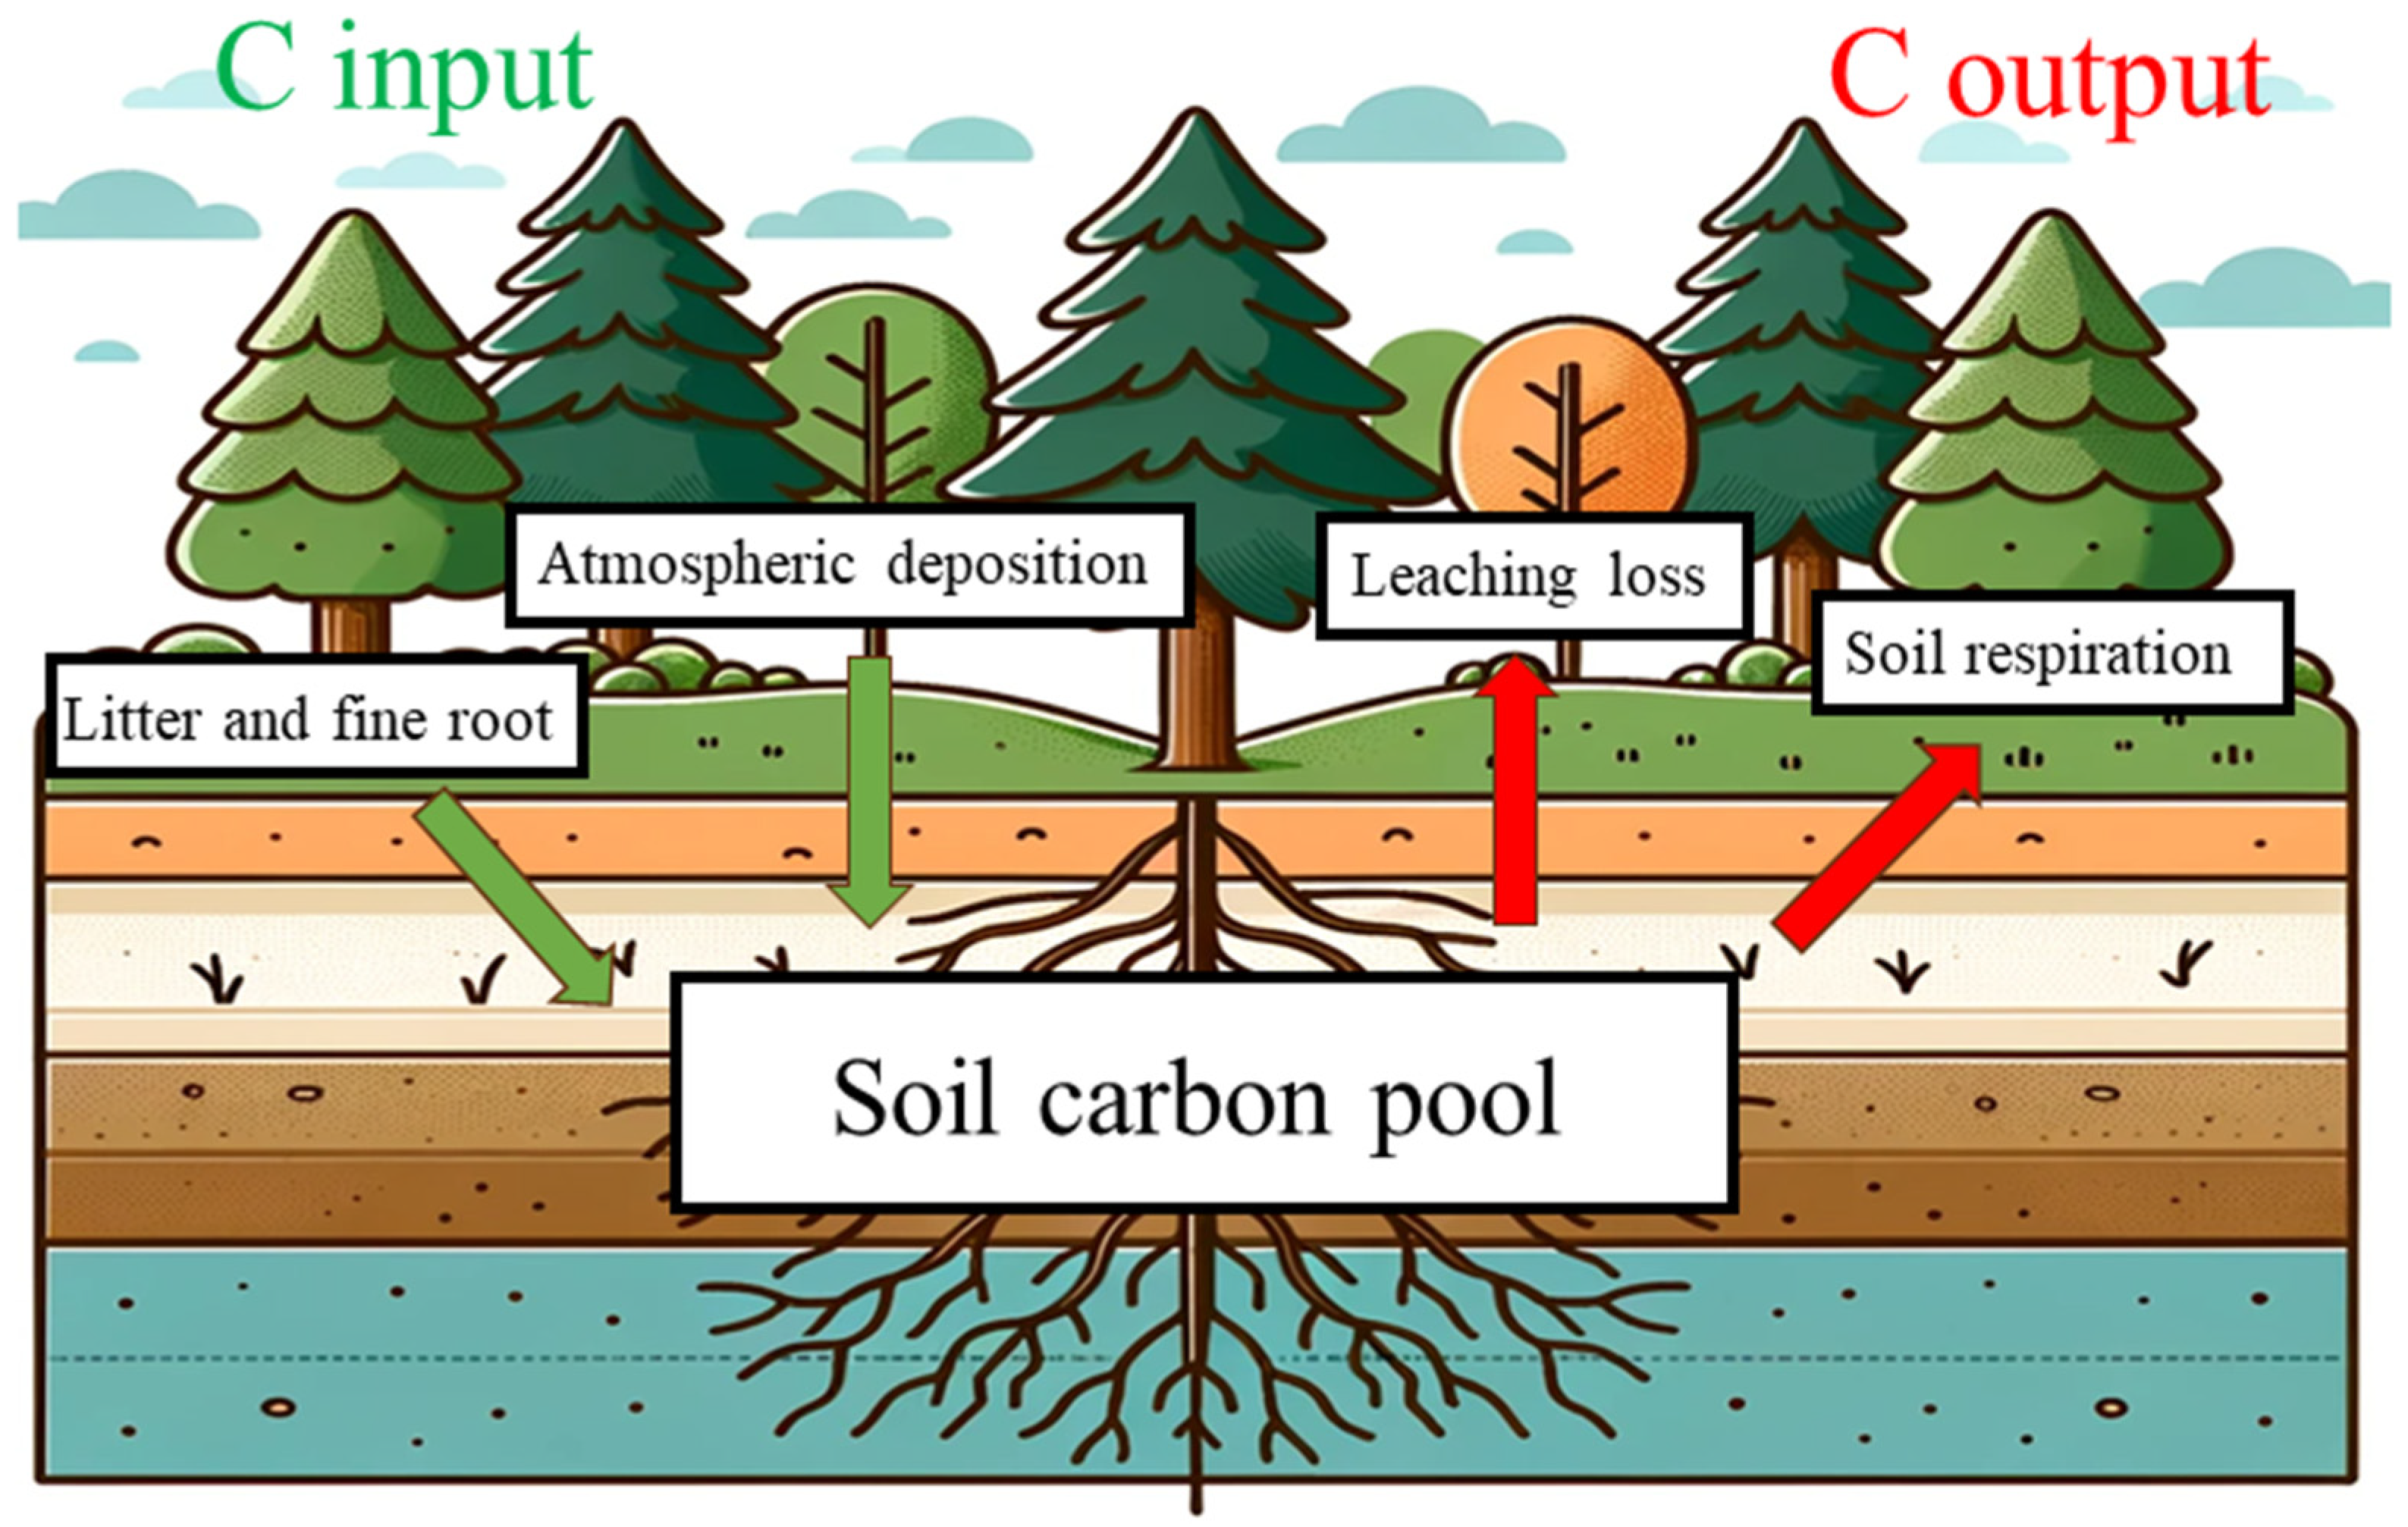
2.3.5. Construction of Soil Carbon Balance

Excluding parent material factors, the soil carbon sequestration (Figure 3) reveals that soil carbon is mainly influenced by litter, fine roots, soil respiration, atmospheric deposition, and leaching. Consequently, the equation for net quarterly soil carbon fixation is:
S C = L C + F R C + A I S R C L L
where ΔSC represents the net quarterly soil carbon change and LC, FRC, AI, SRC, and LL denote carbon fluxes from litter, fine roots, atmospheric deposition, soil respiration, and leaching per quarter, respectively. Given that atmospheric deposition and leaching are influenced by rainfall and the absorptive capabilities of plant roots and soil, and considering the uniform rainfall across all experimental sites, the indices AI and LL effectively indicate the soil’s carbon retention or loss capacity due to rainfall.
The equation simplifies by combining these indices:
S C = L C + F R C S R C + C F ( ε )
where CF(ε) is viewed as encompassing other factors influencing soil carbon balance or serves as a correction factor. Alternatively, net quarterly soil carbon fixation is the difference between soil carbon storage in consecutive quarters:
S C = S C n + 1 S C n
where SCn+1 denotes the soil carbon storage for quarter n + 1, while SCn represents the storage for quarter n.
Iteration of Equations (9) and (10) yields the formula accounting for other factors (correction factor) in soil carbon balance:
C F ε = S C n + 1 S C n L C F R C + S R C

2.4. Data Processing

Single-factor analysis of variance (ANOVA) and the least significant difference (LSD) method in SPSS 26.0 were used to assess the significance of varying thinning intensities on soil properties. Redundancy analysis (RDA) was conducted using the Vegan package in R version 4.1.0. RDA was used to explore the relationship between soil carbon cycling indicators and environmental factors across the four seasons. The “Boruta” algorithm, a random forest-based analysis method implemented in R, was employed to identify significant factors influencing varying intensities of thinning. All graphics were created using R version 4.1.0 and Origin 2021.

3. Results

3.1. Changes in Soil Physicochemical Properties

Thinning intensity significantly affected soil pH, temperature, moisture, organic carbon, total nitrogen, and the C/N ratio throughout the seasons (Table 2). Spring thinning E (30%) significantly raised soil pH compared to the untreated control (CK). Lower thinning intensities enhanced soil moisture and C/N ratios, whereas very high intensities reduced them (p < 0.001). As thinning intensity increased, total nitrogen content tended to decrease. Soil pH changes were relatively stable in the summer compared to the CK thinning. Thinning intensity, particularly at high levels, significantly increased soil moisture and organic carbon (p < 0.001). Autumn thinning significantly increased soil moisture over CK, with notable differences between thinnings (p < 0.001). The CK thinning sustained elevated total nitrogen levels (p < 0.01). Autumn thinning treatments had significantly impacted soil pH and C/N ratio. By winter, soil pH had decreased and moisture content had increased with higher thinning intensities. At 30% thinning intensity, SOC had peaked, significantly differing from other levels (p < 0.05). TN had reached its peak at a 35% thinning intensity. From spring to summer, soil pH, SM, and SOC had shown an increase. Between summer and autumn, there had been slight decreases in soil pH, moisture, and organic carbon. Winter brought a significant drop in soil temperature and an increase in moisture content for most samples. Furthermore, the C/N ratio in winter was substantially higher than in other seasons.

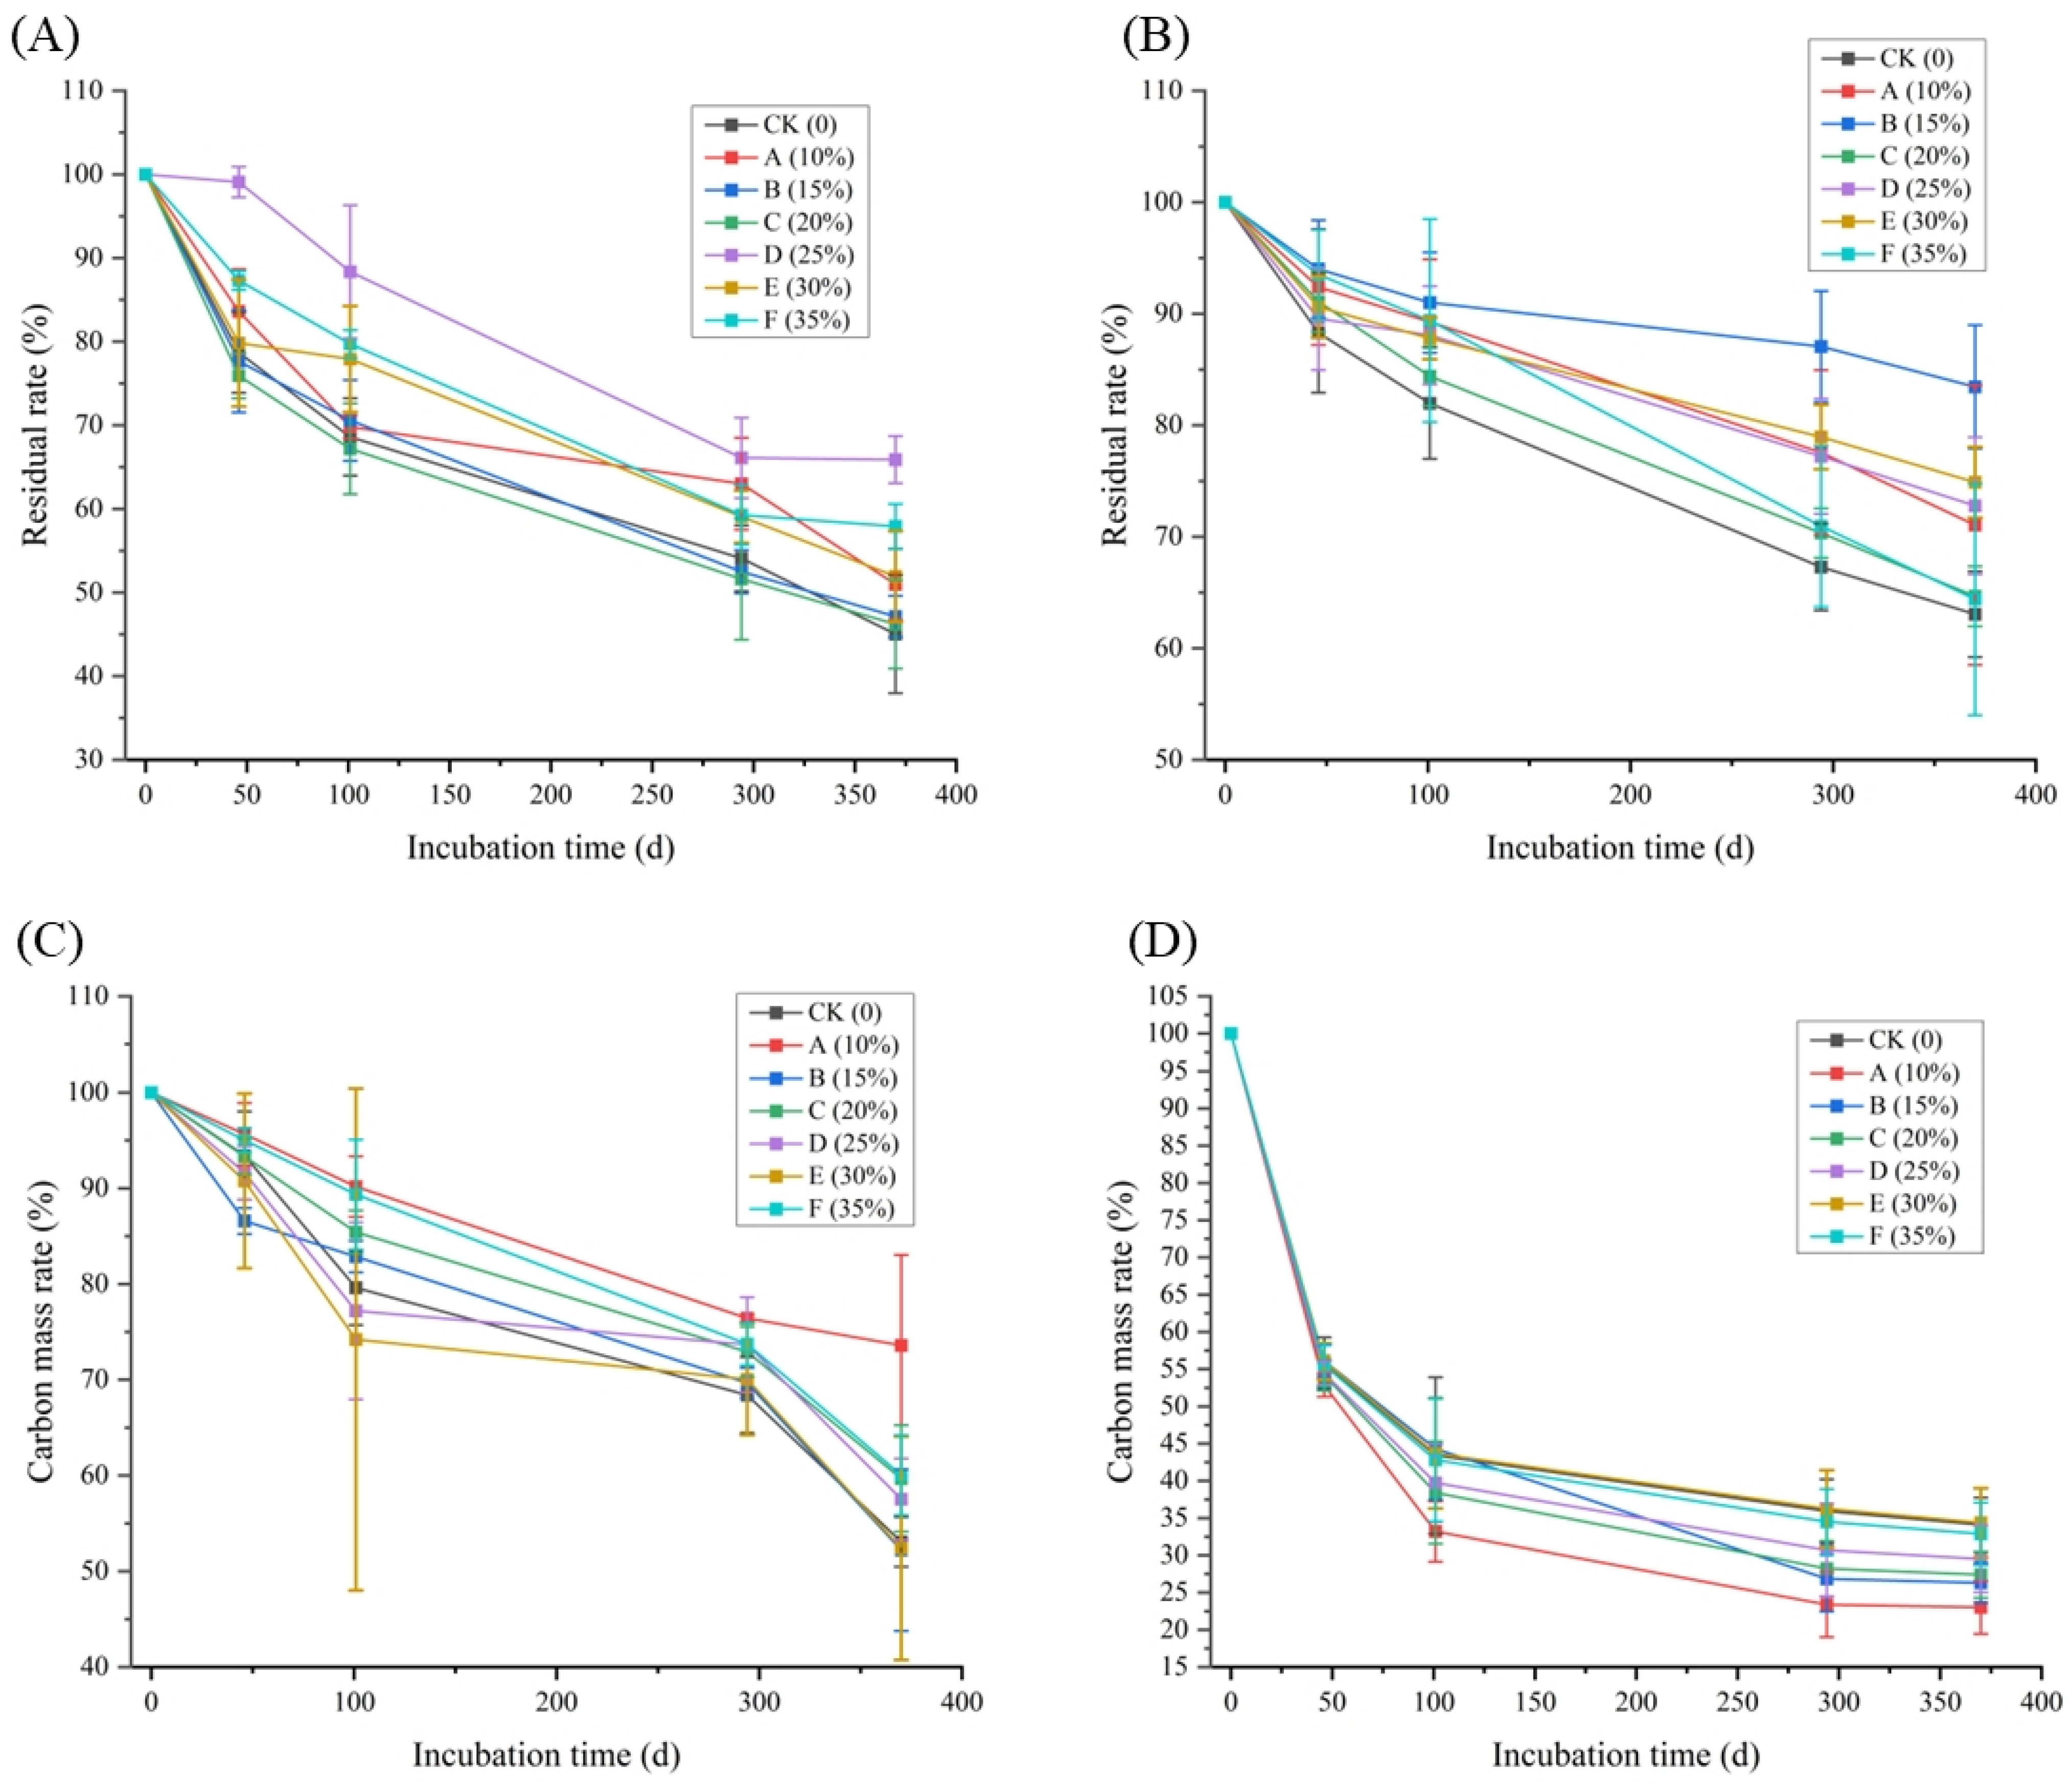
3.2. Litter and Fine Root Decomposition

The decomposition rate of litter mass initially declined rapidly, then slowed, peaking within the first two months (Figure 4A). After a year, the average remaining mass rate across various thinning intensities was 52.15%. During this period, the control plot (CK) showed the lowest remaining mass rate at 45.03%, whereas the moderate thinning intensity (25%) area had the highest at 65.89%. Using the Olson decay model (a negative exponential equation), we described the fine root decomposition mass loss pattern and calculated the decomposition constant k (Table 3). A one-way ANOVA showed the significant effects of thinning intensity on the decomposition coefficient (F = 9.138, p < 0.05), with coefficients ranked from highest to lowest as follows: C (20%), CK (0%), B (15%), E (30%), A (10%), F (35%), and D (25%). The decomposition coefficient was highest at 20% thinning intensity (0.7469) and lowest at 25% thinning intensity (4.713). For the control area, the decomposition coefficient stood at 0.7390. It took 0.94 to 1.24 years to decompose 50% and 4.05 to 4.06 years for 95% decomposition. Over a year, carbon content in the litter gradually decreased across all thinning intensities, showing a decline with increasing decomposition days (Figure 4C). After a year, the remaining rate of carbon content varied from 52.21% to 73.59%. The highest remaining rate occurred at 10% thinning intensity (73.59%), with the lowest at 15% (52.21%). The control plot (CK) had a relatively lower carbon content remaining rate of 53.07%. Overall, the litter’s carbon content remaining rate gradually decreased with increasing thinning intensity.
Fine root mass across all thinning intensities declined over time (Figure 4B). Decomposition rates initially were fast in the first two months and slowed in later periods. After a year, the average remaining fine root mass was 70.61%. Plot B (15%) showed the slowest, and the control plot (CK) the fastest decomposition rates among all thinning intensities. Initially, fine roots released carbon content rapidly, but slowed over time. The Olson decay model revealed significant variability in constants across thinning intensities (p < 0.05) (Table 4). Decomposition coefficients ranked from highest to lowest as follows: CK (0%), F (35%), C (20%), A (10%), D (25%), E (30%), and B (15%). Notably, the unthinned plot (CK) decomposed fastest, and plot B (15%) slowest. For the unthinned plot, decomposition to 50% was estimated at 1.57 years and to 95% at 6.8 years. After a year, significant variations in the carbon content remaining rates appeared across thinning intensities (Figure 4D). The control plot (CK) maintained a relatively higher carbon content remaining rate. Overall, the carbon content’s mass remaining rate initially increased with thinning intensity, then decreased. Specifically, plot D (25%) recorded the highest carbon content remaining rate at 34.37%.

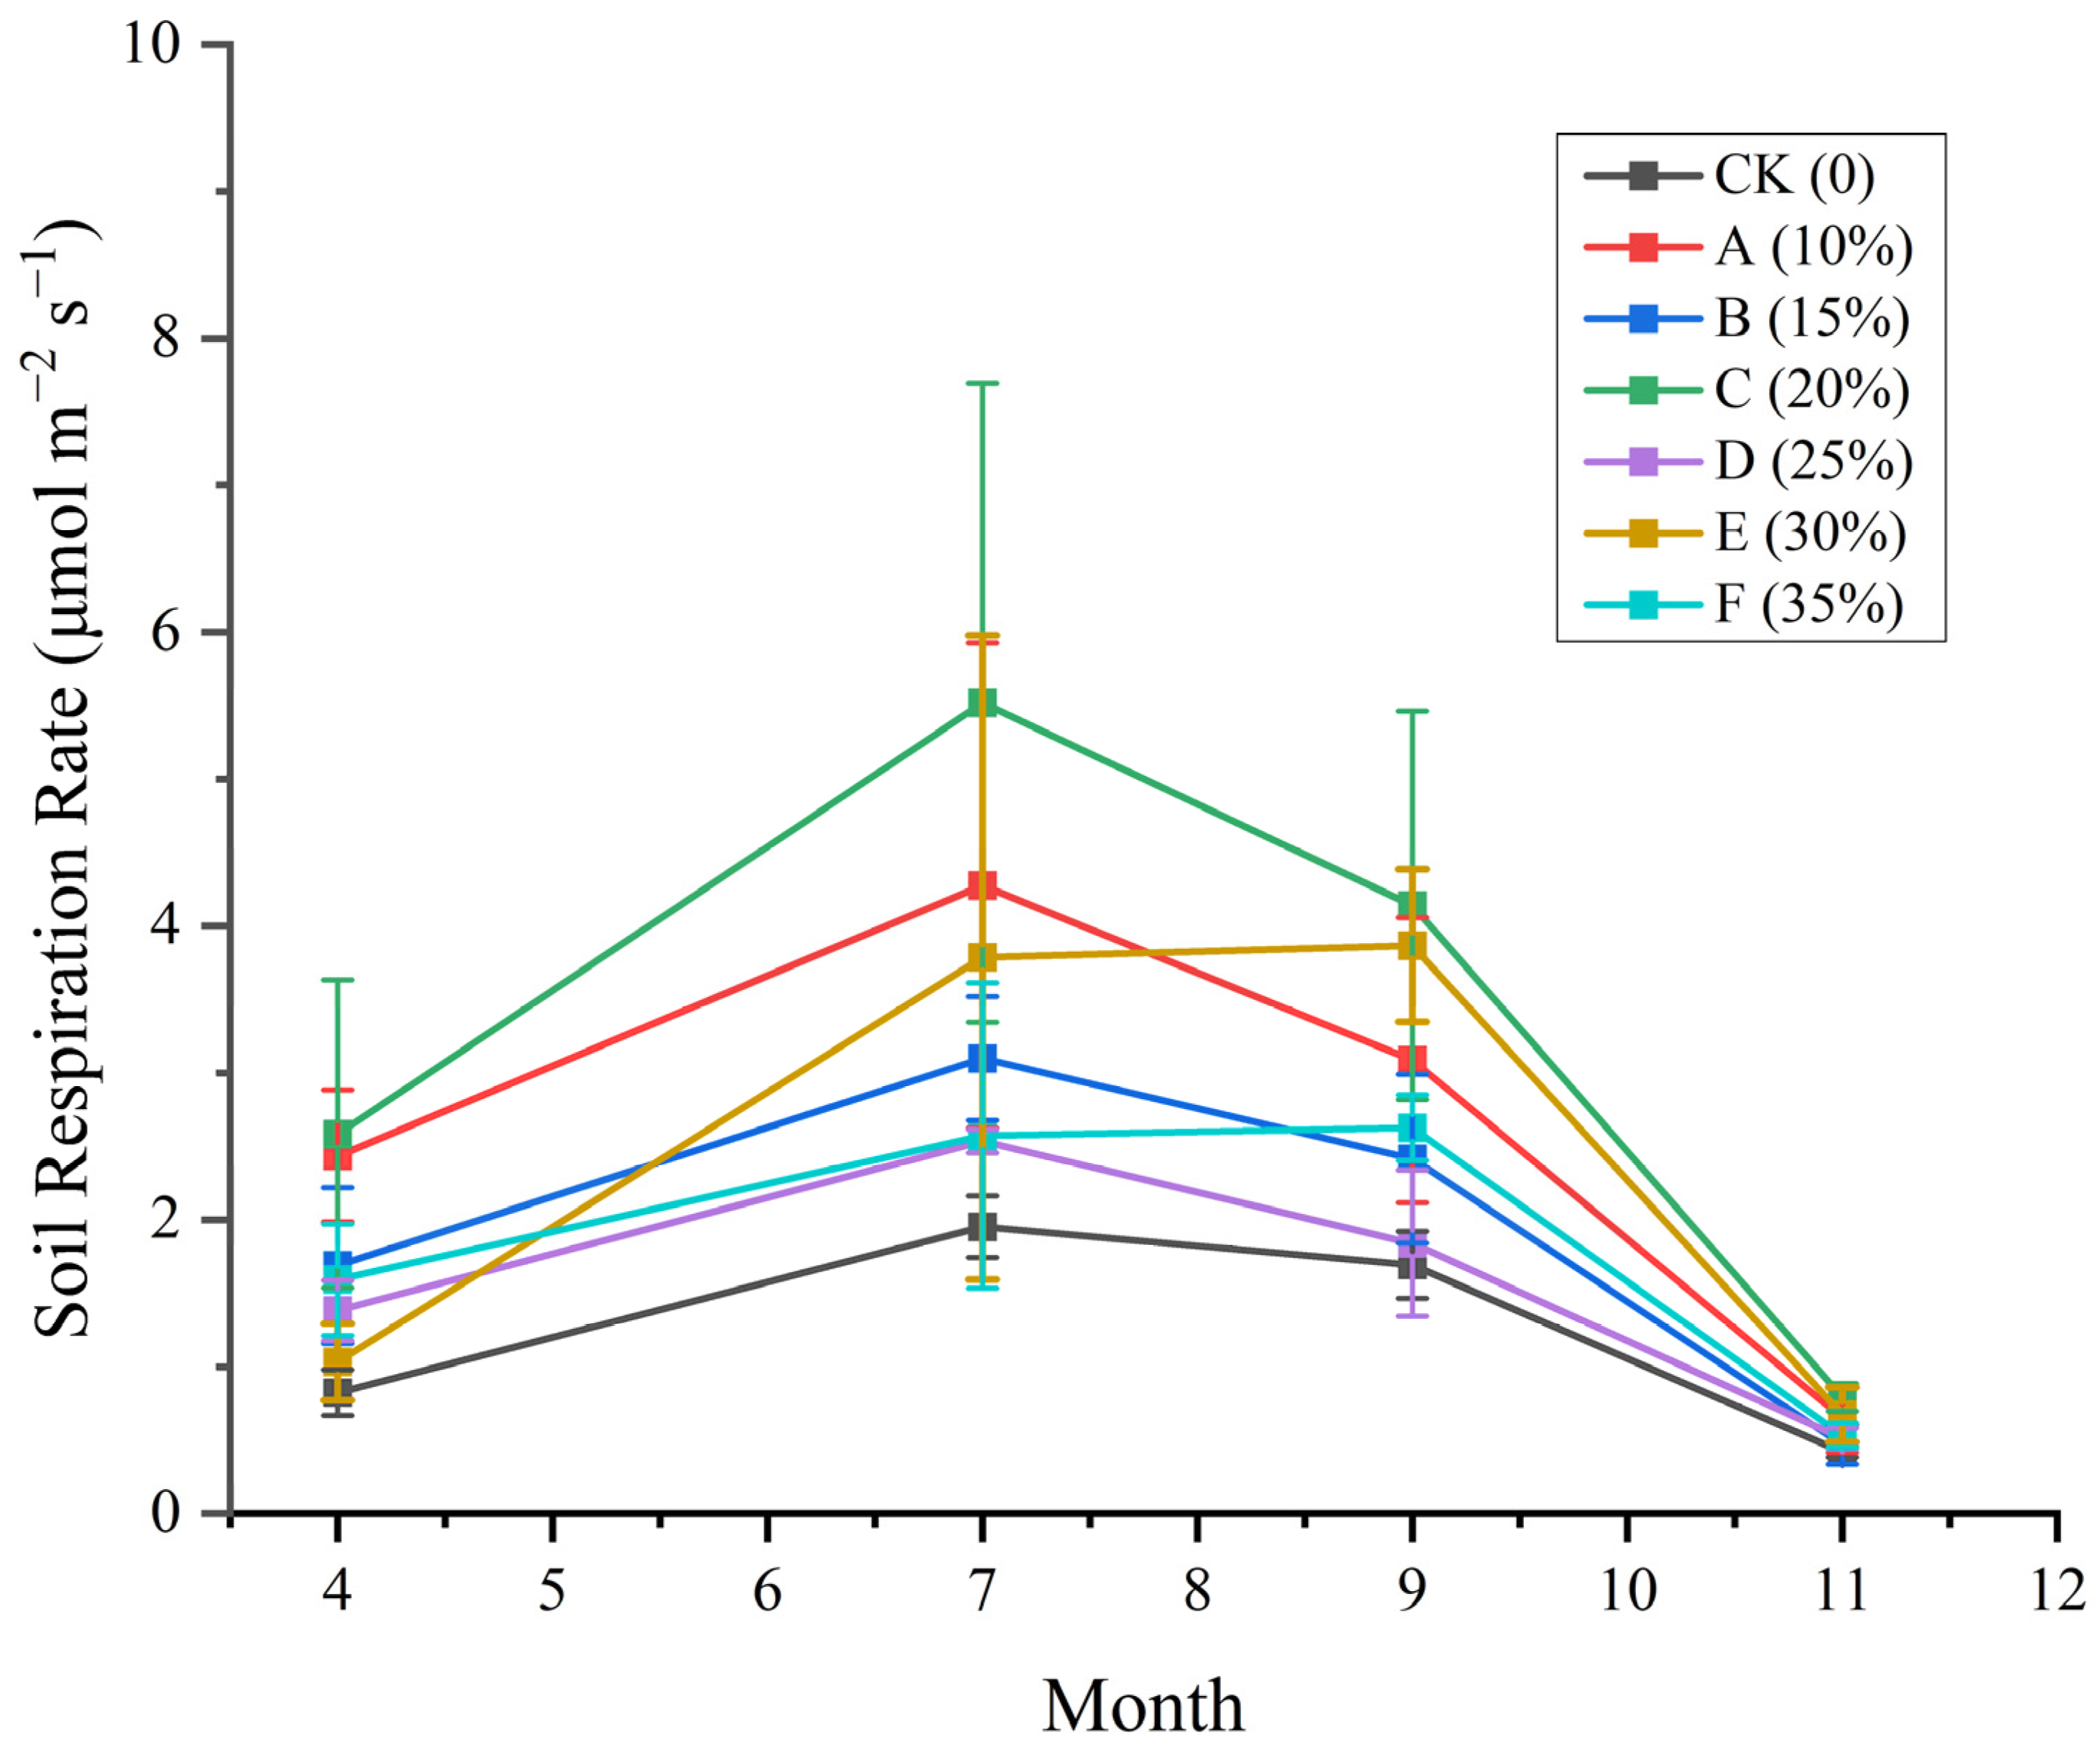
3.3. Seasonal Variation in Soil Respiration Rates

Soil respiration across all thinning intensities exhibited a seasonal pattern of increasing initially and then decreasing (Figure 5). Soil respiration rates were relatively low for all thinning intensity groups in spring. Respiration rates for most thinning intensity groups peaked in summer, declined in autumn, and reached their lowest in winter, nearly returning to April’s levels. In summer, thinning intensity C peaked at a respiration rate of 5.519 μmol m−2 s−1, while the control group (CK) recorded a lower rate of 1.951 μmol m−2 s−1, maintaining the lowest rate among all groups. Summer was the peak period for soil respiration rates across all groups. By autumn, despite a decrease, respiration rates remained relatively high for most groups, suggesting a diminishing influence of high temperatures and seasonal factors on soil respiration rates. By winter, soil respiration rates for all groups significantly decreased, approaching spring’s initial levels. In winter, thinning intensity C′s respiration rate dropped from its July peak to 0.792 μmol m−2 s−1, and the control group (CK) decreased further to 0.42 μmol m−2 s−1.

3.4. Seasonal Changes in Soil Carbon Balance

Significant seasonal changes in soil carbon dynamics (Table 5). In spring and summer, CF values were positive across all thinning intensities. This pattern suggested soil carbon sequestration first increased then decreased as thinning intensity rose during these seasons, indicating significant carbon fixation (Table S1). As thinning intensity rose, soil carbon adsorption and sequestration initially increased, then decreased. Specifically, lower thinning intensities, such as 15%, significantly boosted soil carbon sequestration in spring. This effect, however, was absent in autumn and winter. Conversely, in autumn and winter, higher thinning intensities led to greater carbon loss, not increased adsorption capacity. In autumn, negative CF values from thinning intensities, except for 30% (E), indicated net carbon loss from inadequate soluble carbon adsorption due to rainfall. This trend was especially pronounced at thinning intensities C, D, and F, where larger negative CF values signaled significant soluble carbon loss from rainfall. In winter, all thinning intensities showed negative CF values, reflecting decreased soil and root system capacity to retain soluble carbon. The overall decline in CF values highlighted seasonal effects on soil carbon cycling, particularly during winter’s cold and dry conditions.

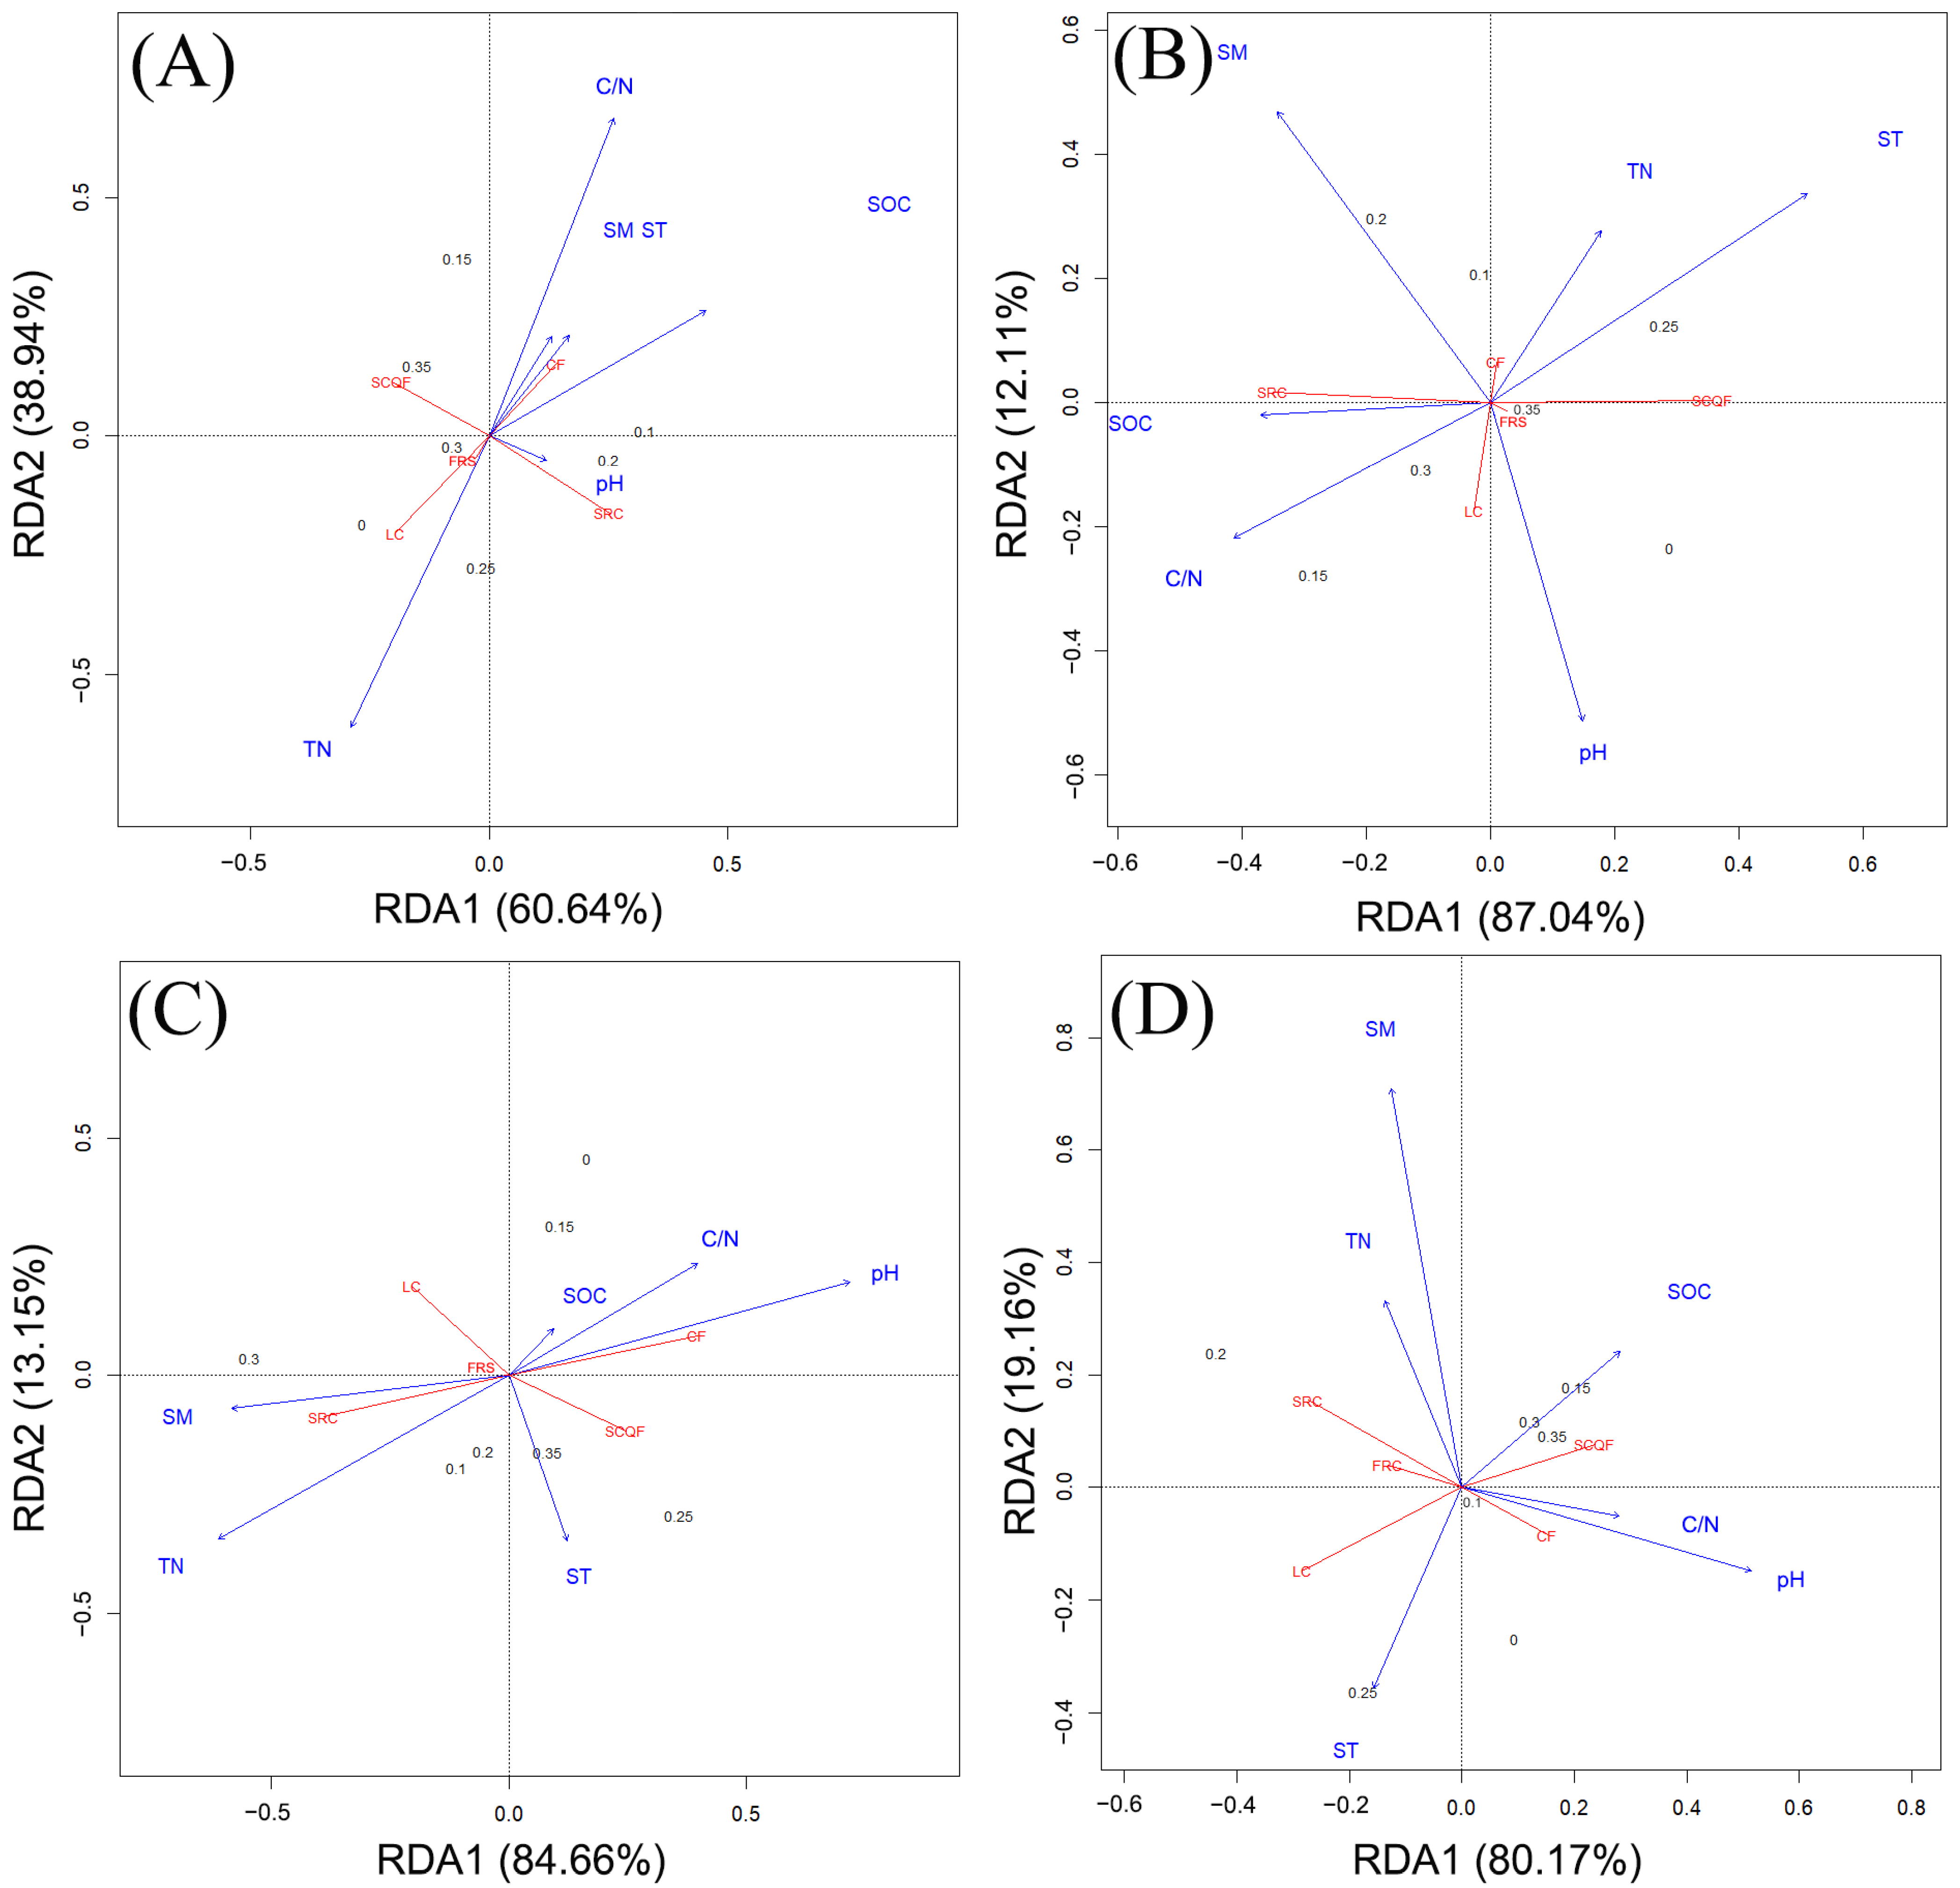
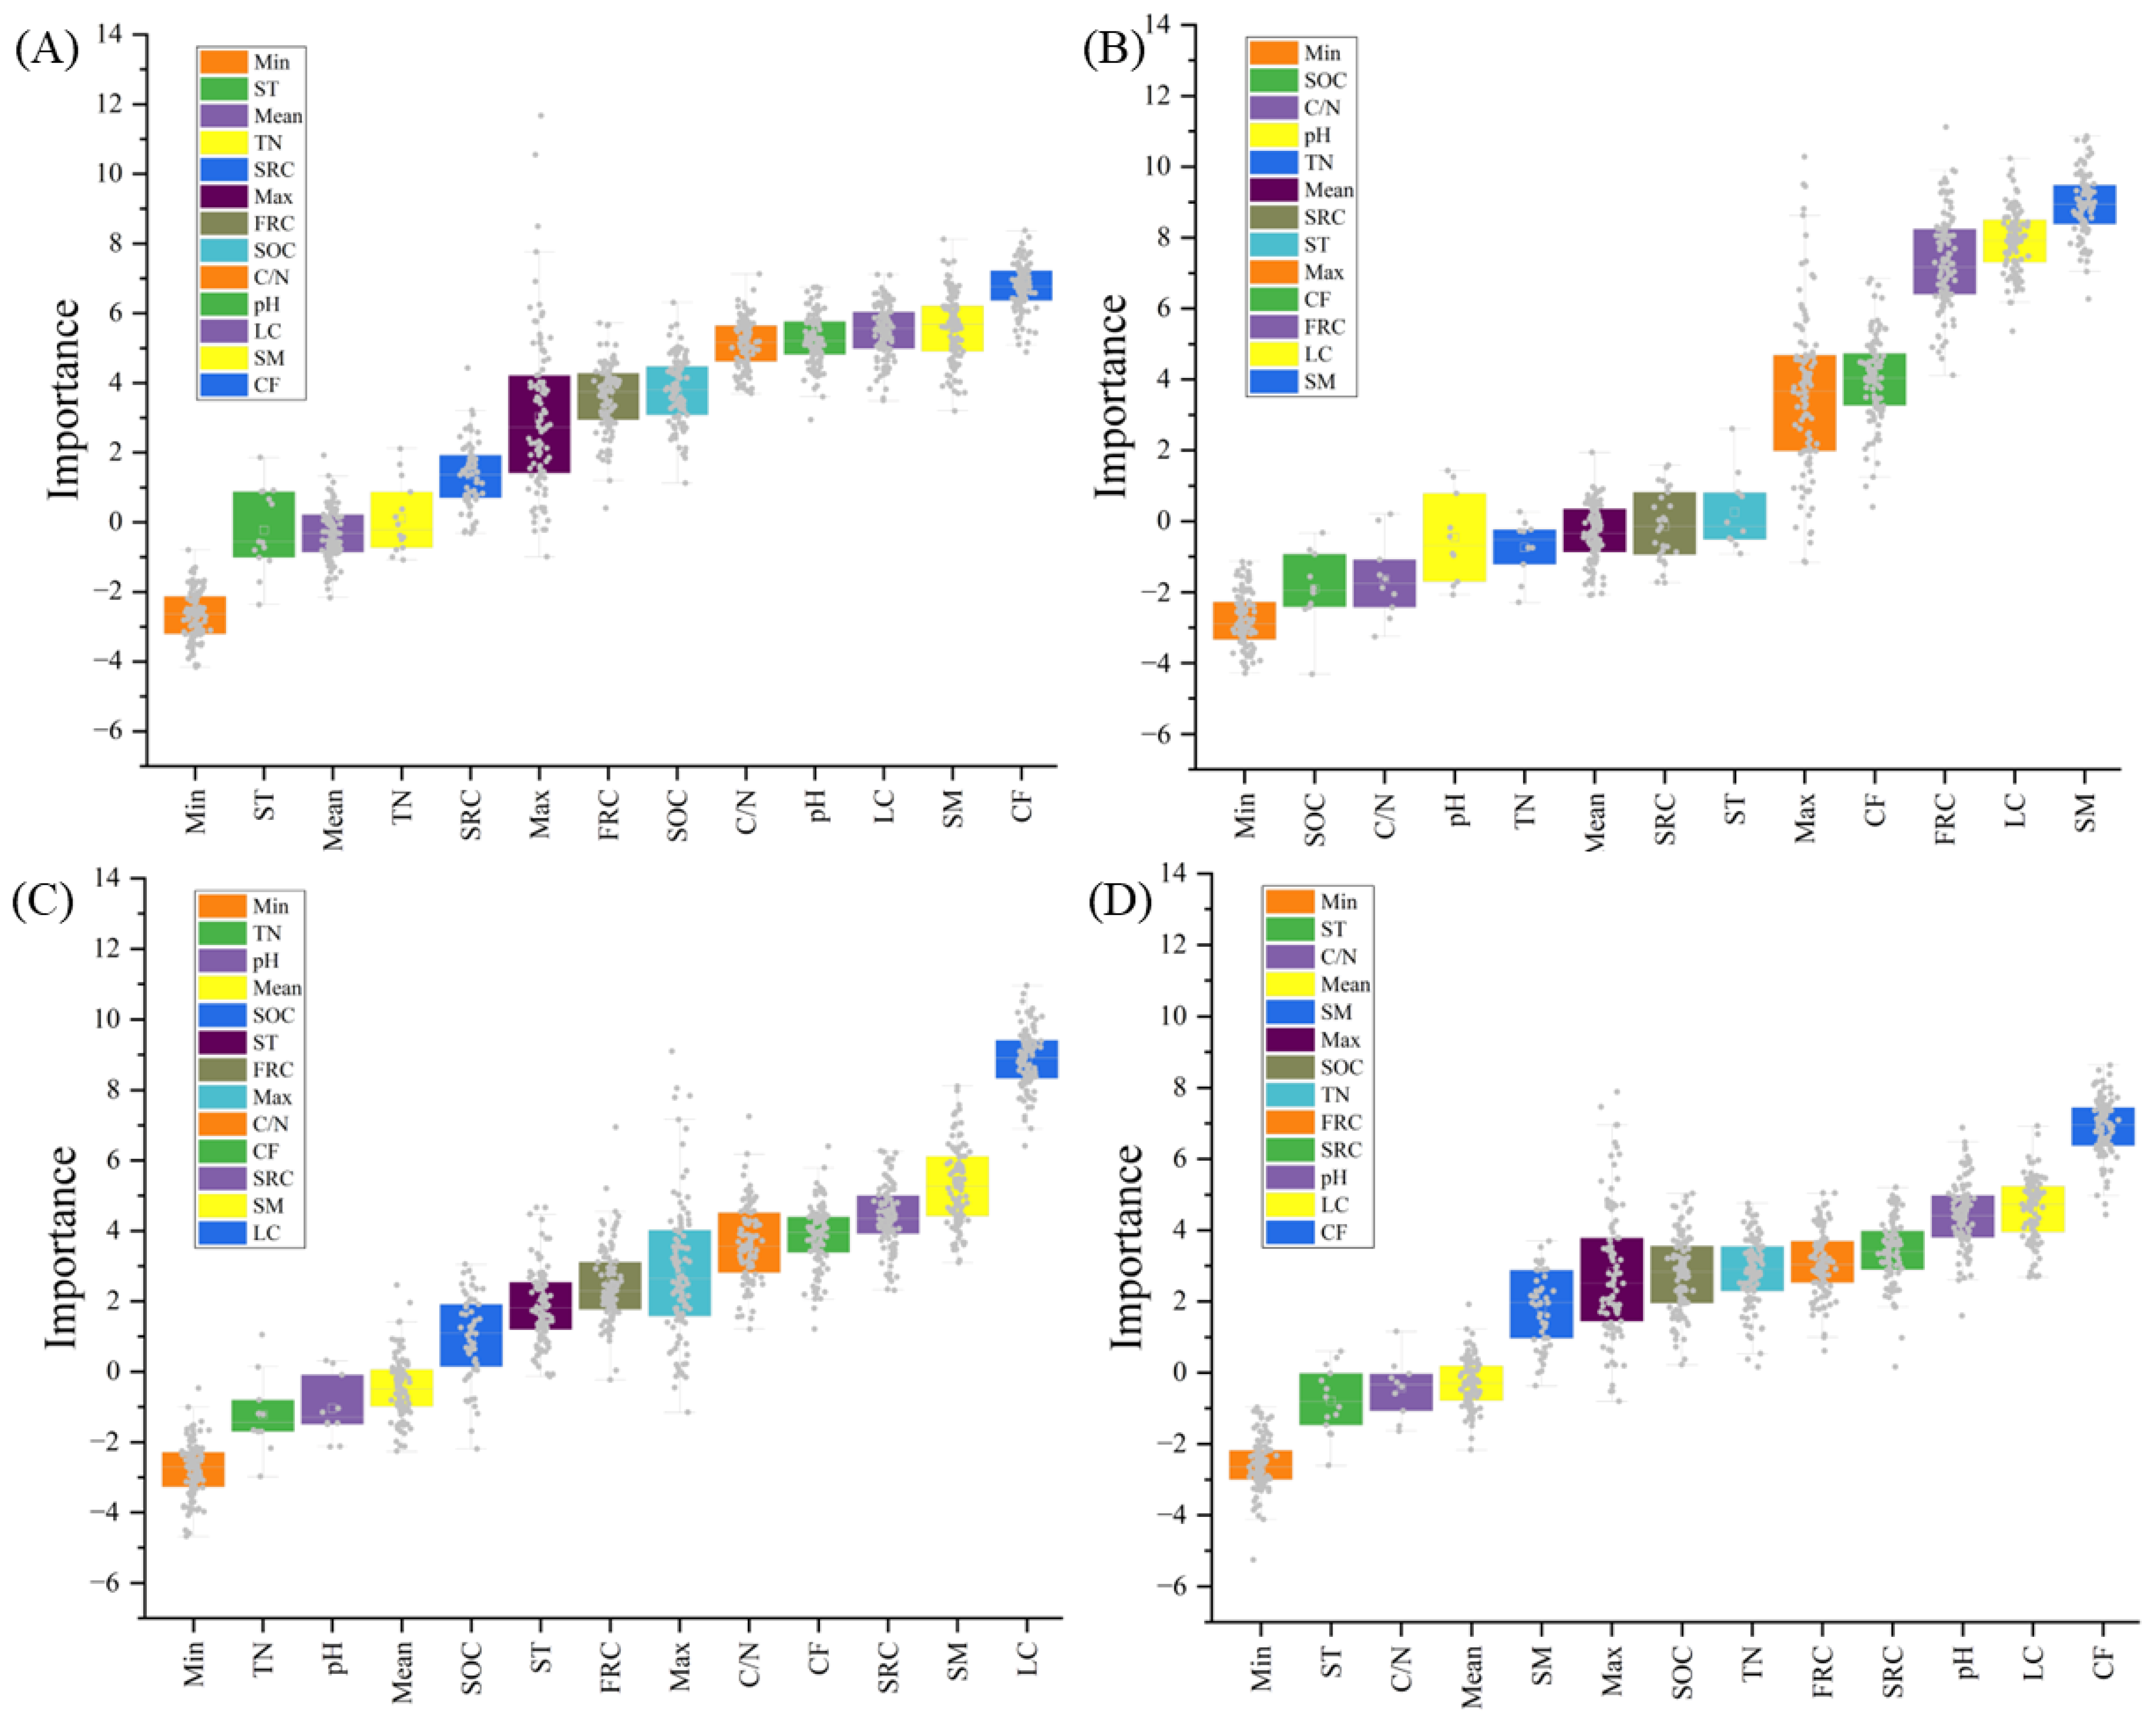
3.5. Influence of Environmental Factors on Thinning Intensity

We used Redundancy analysis (RDA) to explore the relationship between soil carbon cycling indicators and environmental factors throughout the four seasons (Figure 6). In spring, the RDA showed that RDA1 explained 60.64% of the variability and RDA2 explained 39.36% (Figure 6A). CF was positively correlated with soil moisture (SM), temperature (ST), and carbon-to-nitrogen ratio (C/N), and negatively with total nitrogen (TN) and pH. Additionally, SRC was found to positively correlate with pH. The findings for summer indicated that RDA1 accounted for 87.04% of the variability, with RDA2 at 12.96% (Figure 6B). A parallel or near-parallel vector between SRC and SOC suggested a positive correlation. For autumn, RDA revealed that RDA1 accounted for 84.66% of the explained variability, with RDA2 at 13.15% (Figure 6C). CF was positively correlated with the carbon-to-nitrogen ratio (C/N) and pH. In winter, RDA1 was found to explain 80.17% of the variability, with RDA2 at 19.16% (Figure 6D). CF was positively correlated with C/N and pH, while SRC was negatively correlated with SM, and SCQF also showed a negative correlation with TN.
In spring, SM and CF significantly influenced responses to varying thinning intensities (Figure 7A). Furthermore, FRC, SOC, TN, and soil pH were also crucial. The results for summer revealed that the significance of CF was paramount, with FRC and SM also playing essential roles in reacting to varied thinning intensities (Figure 7B). Autumn maintained the high importance of FRC and CF, with SRC, SM, and LC also being significant (Figure 7C). Winter saw an increased importance of SOC and TN, while FRC, SRC, soil pH, LC, and CF continued to be critical (Figure 7D). A year-round analysis identified CF, FRC, and LC as consistent factors significantly impacting responses to varying thinning intensities. SM was particularly crucial in spring and summer, while the importance of SOC and TN became more pronounced in winter.

4. Discussion

4.1. Effect of Thinning Intensity on Soil Physicochemical Properties

Thinning, a forestry management tactic, significantly impacts soil’s physicochemical properties through the selective removal of trees to optimize forest structure [41]. This approach modifies soil temperature and moisture, and indirectly changes chemical properties like pH, organic carbon, and total nitrogen content, impacting the C/N ratio [42]. Our study showed that spring thinning boosts soil moisture and organic carbon, with summer thinning potentially amplifying these benefits. These changes significantly enhance soil nutrient cycling and boost the ecosystem’s carbon capture and storage capabilities. Studies indicated that thinning raises soil organic matter content and reshapes the microbial community due to enhanced sunlight and air flow, thus, stimulating microbial activity in the topsoil [41,43]. Additionally, thinning decreases plant cover, impacting soil moisture evaporation and infiltration, and thereby changing soil moisture levels [44]. Thinning also boosts forest resilience by lowering tree density, reducing the impact of extreme climate events like droughts and floods, safeguarding soil resources, and enhancing recovery potential [45].
Thinning’s impact on soil physicochemical properties varies significantly with the seasons. Understanding these seasonal variations is essential for optimizing thinning’s ecological effects. Spring thinning maintains soil moisture and organic carbon, thanks to increased precipitation and reduced evaporation [46]. Conversely, summer thinning may worsen soil drought with high temperatures and intense evaporation, while also enhancing organic matter decomposition and nutrient cycling [47]. Seasonal changes also affect thinning’s effectiveness. Winter and early spring thinning minimally impact soil, thanks to low temperatures and snow cover, but summer’s high temperatures and drought can amplify these effects [48]. Therefore, incorporating seasonal variations modulates thinning outcomes, offering strategies to maximize soil quality and ecosystem services for forest management and ecological restoration. In summary, thinning changes forest structure and significantly affects soil physicochemical properties across seasons, underscoring the need for seasonal forest management strategies. A deeper understanding of thinning’s seasonal effects on soil and ecosystems helps optimize forestry management, enhancing ecosystem health and sustainability.

4.2. Effects of Thinning on Soil Carbon Input and Output

Thinning indirectly impacts litter and fine root decomposition rates by changing the understory’s light, temperature, and humidity levels [49]. Reduced canopy cover increases sunlight exposure, elevates surface temperature, and potentially alters soil moisture, collectively enhancing litter decomposition [50]. Thinning alters litter’s chemical composition and quantity, further affecting its decomposition [51]. Fine root decomposition is vital for soil nutrient cycling and the forest ecosystems’ carbon balance. Accelerating litter and fine root decomposition increases soil organic carbon inputs, enhancing soil carbon cycling [52]. Thinning reduces tree and potentially fine root biomass, impacting fine root decomposition rates [53,54]. Studies indicate fine root decomposition rates post-thinning vary with soil microbial communities and environmental conditions [52,55]. This study reveals moderate thinning intensity boosts litter and fine root decomposition rates, aiding soil carbon accumulation and soil carbon storage growth. However, excessive thinning may inhibit decomposition, impairing soil carbon cycling and forest quality. Soil respiration, a critical component of forest ecosystems’ carbon cycle, involves soil microbes breaking down organic matter to release carbon dioxide [56]. Studies show thinning may boost respiration rates through higher soil temperatures and better aeration, although decreased plant biomass could lower organic carbon inputs, impacting soil respiration [57,58]. This study reveals significant seasonal variations in soil respiration rates, with a notable peak in summer, linked to temperature and soil moisture changes. Thinning positively influenced the soil microenvironment and altered soil respiration’s seasonal pattern, especially by intensifying the summer peak, benefiting the carbon cycle. Seasonal variations significantly influence thinning’s effects on ecological processes, with seasonal factors crucial to the forest ecosystems’ response [24,59]. Thinning effects are most pronounced during the growing season due to heightened microbial activity, which accelerates litter, fine root decomposition, and soil respiration [60].
Thinning, a forest management technique, complexly affects soil carbon storage and dynamics. Research indicates the varied impacts of forest management strategies on soil organic carbon dynamics, highlighting their critical role in carbon cycling [61]. Thinning is regarded as an effective strategy to boost soil carbon sequestration, aiding in global warming mitigation [62]. Our research found moderate thinning markedly enhanced soil properties, elevating both moisture and carbon storage levels. Aligning with Settineri et al., this study confirms moderate thinning positively impacts soil chemistry and carbon storage [63]. In 2015, Bravo-Oviedo et al. explored thinning’s impact on p. sylvestris L. in Southern Europe, noting improvements in soil organic carbon concentrations and overall soil health [64]. Ma et al. demonstrated moderate thinning raised soil organic carbon in Northeast China’s Larix forests, underscoring thinning’s beneficial effect on soil carbon storage [65]. However, Abdallah et al. reported no significant changes in surface or deep soil carbon due to logging controls [66]. Rozak et al. observed significant declines in above-ground carbon stocks due to selective logging, noting that unmanaged or lightly logged forests maintained higher carbon stocks than heavily logged ones [67]. Differing from previous research, this study zeroes in on a specific forest type at Dongfanghong forestry farm, potentially influencing result comparability. Research indicates that appropriate thinning intensities can significantly boost soil carbon in forests [68,69], though impacts vary with forest type, climate, soil properties, and stand structure [70]. The impact of thinning on soil carbon content varies across forest types, due to soil, climate, and ecosystem characteristics [71,72,73]. These factors jointly influence the specific impacts of thinning on soil carbon dynamics [74]. Comprehending thinning and forest management’s effects on soil carbon is crucial for developing effective policies, optimizing carbon storage, and minimizing emissions [75]. Scientists stress the importance of adopting targeted management measures, tailored to specific forest types, soil conditions, and climates [76,77]. While recognizing moderate thinning’s role in boosting soil carbon storage, this study notes its applicability may be limited by certain environmental conditions. This study underscores considering regional and specific environmental factors in thinning for effective, sustainable management. Thus, forest management can promote ecosystem health, enhance forest soil as a carbon sink, and support climate change mitigation.

4.3. Seasonal Effects of Thinning on Soil Carbon Cycling Dynamics

Grasping the seasonal variations in soil carbon balance is vital for understanding ecosystem dynamics and the global carbon cycle. As a major carbon reservoir, soil changes directly impact the climate. Temperature, precipitation, and sunlight, as seasonal environmental factors, significantly influence soil carbon inputs and outputs [59,78]. In spring and summer, increased thinning intensity correlates with positive soil carbon fixation, as shown by positive CF values, indicating enhanced carbon absorption. Rising temperatures and longer daylight hours stimulate plant photosynthesis, boosting soil carbon inputs [79]. During this time, vigorous plant growth absorbs significant carbon dioxide and boosts soil organic carbon via root exudates [80]. The warm and moist environment speeds up microbial decomposition of organic matter, often leading to carbon inputs surpassing outputs and, thus, soil carbon accumulation [81]. In autumn and winter, higher thinning intensities lead to negative CF values, signaling increased carbon losses, especially from soluble carbon washed away by rainfall. Lower temperatures and reduced sunlight slow plant growth and photosynthesis, thus, decreasing carbon inputs [82]. Lower temperatures may reduce microbial activity and soil respiration, but increased precipitation can heighten dissolved organic carbon loss, with undecomposed plant litter also contributing to carbon losses [83,84,85]. Consequently, soil experiences carbon loss in autumn and winter.
Thinning influences soil carbon cycling by modifying soil properties and environmental conditions in forests, impacting carbon sequestration and release. Reducing tree density via thinning enhances light penetration and air flow, thereby regulating soil temperature and moisture [86]. This alters the soil’s carbon-to-nitrogen ratio and microbial activity, directly influencing carbon cycling processes such as absorption, storage, and release [87]. Moreover, thinning improves soil conditions, fostering root development and increasing carbon sequestration capacity [76]. Adjusting thinning’s intensity and timing can control soil carbon cycling efficiency, offering a scientific foundation for forest management. This study’s RDA uncovered complex seasonal relationships between soil carbon cycling indicators and environmental factors, highlighting the crucial role of the CF in maintaining soil carbon balance throughout the year. The springtime data showed soil moisture and temperature positively affected CF, underscoring the importance of optimal microenvironmental conditions for soil carbon sequestration. Summer and autumn analyses further confirmed a positive correlation between SOC and SRC. Winter data highlighted the risk of carbon loss due to low temperature and moisture. Many studies have identified soil moisture and temperature as key factors influencing the soil carbon cycle [88,89]. Soil temperature influences microbial activity and root growth, affecting the decomposition and accumulation of soil organic carbon [90]. Soil moisture affects soil respiration and microbial water availability, thereby influencing carbon outputs [91,92]. Using a random forest model, this study highlighted the importance of spring SM and CF in response to varying thinning intensities and demonstrated the vital roles of FRC, SOC, TN, and soil pH in regulating soil carbon balance. Analysis from summer to winter further showed the continued impact of these variables, especially CF, FRC, and LC, on their significant response to thinning intensities throughout the year.

4.4. Implications for Management Practice

Research has shown that soil cover and management practices, including thinning and fertilization, significantly affect soil carbon’s seasonal variation [93,94]. For example, soil cover enhances microbial activity and carbon accumulation by minimizing moisture evaporation and boosting soil moisture [95]. Additionally, adjusting soil nutrient levels through timely thinning and fertilization can influence plant growth and microbial activity, thus, regulating the soil carbon balance [96]. Our study highlights the profound impact of thinning intensity on the carbon cycle and seasonal variations in degraded forest soils. Spring thinning enhances soil pH and organic carbon, whereas summer thinning significantly boosts soil moisture and carbon, suggesting moderate thinning aids in soil carbon storage. Thinning further impacts the carbon cycle by altering litter and fine root decomposition rates. Forest management and thinning practices, by employing optimal thinning intensity and frequency, enhance soil carbon storage and forest carbon sequestration [97,98]. Adjusting thinning strategies to seasonal changes in the soil carbon cycle increases soil organic carbon content and enhances litter decomposition. Future research should explore the long-term effects of thinning intensity and frequency on forest ecosystem functions across various forest types and soil conditions, and assess its impacts on biodiversity. Additionally, research should evaluate thinning’s contribution to climate change adaptability, forest restoration, and ecosystem service sustainability. Comprehensive analysis and future studies will enable a holistic understanding of forest thinning’s impacts on ecosystems, leading to more effective management strategies.

5. Conclusions

Our study showed that thinning practices, timed seasonally, significantly influence the carbon cycle in degraded forest soils. Spring thinning raised soil pH and organic carbon levels, whereas summer thinning increased soil moisture and carbon storage. Moderate thinning, specifically at a 20% intensity, improved soil health and facilitated carbon sequestration throughout the year. Such practices help manage soil carbon emissions and improve the structure and function of forests. Our results endorse an optimal thinning regimen to enhance soil carbon storage, highlighting the imperative for additional studies on its enduring effects and contributions to climate resilience and ecosystem health. Moreover, this research underlines the impact of thinning on decomposition rates of litter and fine roots, offering essential insights into the prolonged carbon sequestration capabilities of forest ecosystems. Emphasizing seasonal variability in forest management promotes the ecological advantages of thinning, including increased productivity, carbon sequestration, and biodiversity preservation. This strategy is essential for creating effective forest management plans to combat climate change, significantly affecting both academic research and practical forest management.

Supplementary Materials

The following supporting information can be downloaded at: https://www.mdpi.com/article/10.3390/f15030449/s1, Table S1: Soil carbon storage in each layer degraded forests under different thinning intensities.

Author Contributions

Conceptualization, B.Z.; Data curation, R.G.; methodology, B.Z.; resources, R.G.; supervision, X.D.; visualization, B.Z.; writing—original draft, B.Z.; writing—review and editing, X.D. All authors have read and agreed to the published version of the manuscript.

Funding

This research was funded by the National Key Research and Development Program of China, grant number: 2022YFD2201001; the Applied Technology research and Development program of Heilongjiang Province, grant number: GA19C006; and the Fundamental Research Funds for the Central Universities, grant number: 2572021AW48.

Data Availability Statement

The data presented in this study are available on request from the corresponding authors.

Conflicts of Interest

The authors declare no conflicts of interest.

References

  1. Bonan, G.B. Forests and climate change: Forcings, feedbacks, and the climate benefits of forests. Science 2008, 320, 1444–1449. [Google Scholar] [CrossRef]
  2. Hansen, M.C.; Potapov, P.V.; Moore, R.; Hancher, M.; Turubanova, S.A.; Tyukavina, A.; Thau, D.; Stehman, S.V.; Goetz, S.J.; Loveland, T.R. High-resolution global maps of 21st-century forest cover change. Science 2013, 342, 850–853. [Google Scholar] [CrossRef]
  3. Malhi, Y.; Meir, P.; Brown, S. Forests, carbon and global climate. Philos. Trans. R. Soc. Lond. Ser. A Math. Phys. Eng. Sci. 2002, 360, 1567–1591. [Google Scholar] [CrossRef]
  4. Kuzyakov, Y.; Gavrichkova, O. Time lag between photosynthesis and carbon dioxide efflux from soil: A review of mechanisms and controls. Glob. Change Biol. 2010, 16, 3386–3406. [Google Scholar] [CrossRef]
  5. Munjonji, L.; Ntuli Innocentia, H.; Ayisi, K.K.; Dlamini, P.; Mabitsela, K.E.; Lehutjo, C.M.; Magnificent Zwane, P.S. Seasonal dynamics of soil CO2 emissions from different semi-arid land-use systems. Acta Agric. Scand. Sect. B—Soil Plant Sci. 2024, 74, 2312934. [Google Scholar] [CrossRef]
  6. Keenan, R.J.; Reams, G.A.; Achard, F.; de Freitas, J.V.; Grainger, A.; Lindquist, E. Dynamics of global forest area: Results from the FAO Global Forest Resources Assessment 2015. For. Ecol. Manag. 2015, 352, 9–20. [Google Scholar] [CrossRef]
  7. Houghton, R.A.; Byers, B.; Nassikas, A.A. A role for tropical forests in stabilizing atmospheric CO2. Nat. Clim. Chang. 2015, 5, 1022–1023. [Google Scholar] [CrossRef]
  8. Solanki, A.C.; Gurjar, N.S.; Wang, Z.; Kumar, A.; Solanki, M.K. Decoding Seasonal Changes: Soil Parameters and Microbial Communities in Tropical Dry Deciduous Forests. Front. Microbiol. 2024, 15, 1258934. [Google Scholar] [CrossRef]
  9. Zhang, W.; Wang, L.; Chen, J.; Zhang, Y. Preferential Flow in Soils: Review of Role in Soil Carbon Dynamics, Assessment of Characteristics, and Performance in Ecosystems. Eurasian Soil Sci. 2024. [Google Scholar] [CrossRef]
  10. Jobbágy, E.G.; Jackson, R.B. The vertical distribution of soil organic carbon and its relation to climate and vegetation. Ecol. Appl. 2000, 10, 423–436. [Google Scholar] [CrossRef]
  11. Lal, R. Soil carbon sequestration impacts on global climate change and food security. Science 2004, 304, 1623–1627. [Google Scholar] [CrossRef] [PubMed]
  12. Schmidt, M.W.; Torn, M.S.; Abiven, S.; Dittmar, T.; Guggenberger, G.; Janssens, I.A.; Kleber, M.; Kögel-Knabner, I.; Lehmann, J.; Manning, D.A. Persistence of soil organic matter as an ecosystem property. Nature 2011, 478, 49–56. [Google Scholar] [CrossRef] [PubMed]
  13. Post, W.M.; Kwon, K.C. Soil carbon sequestration and land-use change: Processes and potential. Glob. Chang. Biol. 2000, 6, 317–327. [Google Scholar] [CrossRef]
  14. Canadell, J.G.; Schulze, E.D. Global potential of biospheric carbon management for climate mitigation. Nat. Commun. 2014, 5, 5282. [Google Scholar] [CrossRef]
  15. Pan, Y.; Birdsey, R.A.; Fang, J.; Houghton, R.; Kauppi, P.E.; Kurz, W.A.; Phillips, O.L.; Shvidenko, A.; Lewis, S.L.; Canadell, J.G. A large and persistent carbon sink in the world’s forests. Science 2011, 333, 988–993. [Google Scholar] [CrossRef] [PubMed]
  16. Schlesinger, W.H.; Andrews, J.A. Soil respiration and the global carbon cycle. Biogeochemistry 2000, 48, 7–20. [Google Scholar] [CrossRef]
  17. Lloyd, J.; Taylor, J. On the temperature dependence of soil respiration. Funct. Ecol. 1994, 8, 315–323. [Google Scholar] [CrossRef]
  18. Davidson, E.A.; Belk, E.; Boone, R.D. Soil water content and temperature as independent or confounded factors controlling soil respiration in a temperate mixed hardwood forest. Glob. Chang. Biol. 1998, 4, 217–227. [Google Scholar] [CrossRef]
  19. Fahey, T.; Siccama, T.; Driscoll, C.; Likens, G.; Campbell, J.; Johnson, C.; Battles, J.; Aber, J.; Cole, J.; Fisk, M. The biogeochemistry of carbon at Hubbard Brook. Biogeochemistry 2005, 75, 109–176. [Google Scholar] [CrossRef]
  20. Fierer, N.; Allen, A.S.; Schimel, J.P.; Holden, P.A. Controls on microbial CO2 production: A comparison of surface and subsurface soil horizons. Glob. Change Biol. 2003, 9, 1322–1332. [Google Scholar] [CrossRef]
  21. Canadell, J.G.; Le Quéré, C.; Raupach, M.R.; Field, C.B.; Buitenhuis, E.T.; Ciais, P.; Conway, T.J.; Gillett, N.P.; Houghton, R.; Marland, G. Contributions to accelerating atmospheric CO2 growth from economic activity, carbon intensity, and efficiency of natural sinks. Proc. Natl. Acad. Sci. USA 2007, 104, 18866–18870. [Google Scholar] [CrossRef] [PubMed]
  22. Baldocchi, D.; Falge, E.; Gu, L.; Olson, R.; Hollinger, D.; Running, S.; Anthoni, P.; Bernhofer, C.; Davis, K.; Evans, R. FLUXNET: A new tool to study the temporal and spatial variability of ecosystem-scale carbon dioxide, water vapor, and energy flux densities. Bull. Am. Meteorol. Soc. 2001, 82, 2415–2434. [Google Scholar] [CrossRef]
  23. Paquette, A.; Messier, C. The effect of biodiversity on tree productivity: From temperate to boreal forests. Glob. Ecol. Biogeogr. 2011, 20, 170–180. [Google Scholar] [CrossRef]
  24. Tian, D.; Xiang, Y.; Seabloom, E.; Wang, J.; Jia, X.; Li, T.; Li, Z.; Yang, J.; Guo, H.; Niu, S. Soil carbon sequestration benefits of active versus natural restoration vary with initial carbon content and soil layer. Commun. Earth Environ. 2023, 4, 83. [Google Scholar] [CrossRef]
  25. Lan, Z.; Zhao, Y.; Zhang, J.; Jiao, R.; Khan, M.N.; Sial, T.A.; Si, B. Long-term vegetation restoration increases deep soil carbon storage in the Northern Loess Plateau. Sci. Rep. 2021, 11, 13758. [Google Scholar] [CrossRef] [PubMed]
  26. Jandl, R.; Lindner, M.; Vesterdal, L.; Bauwens, B.; Baritz, R.; Hagedorn, F.; Johnson, D.W.; Minkkinen, K.; Byrne, K.A. How strongly can forest management influence soil carbon sequestration? Geoderma 2007, 137, 253–268. [Google Scholar] [CrossRef]
  27. Zhang, H.; Liu, S.; Yu, J.; Li, J.; Shangguan, Z.; Deng, L. Thinning increases forest ecosystem carbon stocks. For. Ecol. Manag. 2024, 555, 121702. [Google Scholar] [CrossRef]
  28. Zald, H.S.; May, C.J.; Gray, A.N.; North, M.P.; Hurteau, M.D. Thinning and prescribed burning increase shade-tolerant conifer regeneration in a fire excluded mixed-conifer forest. For. Ecol. Manag. 2024, 551, 121531. [Google Scholar] [CrossRef]
  29. Garfì, V.; Garfì, G. Differential Tree Growth Response to Management History and Climate in Multi-Aged Stands of Pinus pinea L. Plants 2023, 13, 61. [Google Scholar] [CrossRef]
  30. Demarest, A.B.; Fornwalt, P.J.; Wolk, B.H.; Rodman, K.C.; Redmond, M.D. Mechanical forest restoration treatments stimulate understory plants in the Colorado Front Range. For. Ecol. Manag. 2023, 548, 121322. [Google Scholar] [CrossRef]
  31. Addo-Fordjour, P.; Abrokwah, J.; Arko, A.P.; Pappoe, N.A.; Yawson, D.; Yeboah, N.; RobertTsiquaye, A.; Puobe, R.N.; Anane-Frimpong, K.; Fosu, S.A.; et al. Effects of linear edges on tree communities and soil properties in a moist semi-deciduous forest in Ghana. Plant Ecol. 2024. [Google Scholar] [CrossRef]
  32. Dang, P.; Gao, Y.; Liu, J.; Yu, S.; Zhao, Z. Effects of thinning intensity on understory vegetation and soil microbial communities of a mature Chinese pine plantation in the Loess Plateau. Sci. Total Environ. 2018, 630, 171–180. [Google Scholar] [CrossRef]
  33. Elias, D.M.; Robinson, S.; Both, S.; Goodall, T.; Majalap-Lee, N.; Ostle, N.J.; McNamara, N.P. Soil microbial community and litter quality controls on decomposition across a tropical forest disturbance gradient. Front. For. Glob. Chang. 2020, 3, 81. [Google Scholar] [CrossRef]
  34. Fu, Y.; Feng, F.; Fan, X.; Hu, Y.; Zhang, X. Seasonal dynamics of fine root respiration in the degraded and successional primary Korean pine forests in the Lesser Khingan mountains of Northern China. Ecol. Indic. 2019, 102, 1–9. [Google Scholar] [CrossRef]
  35. Bao, S. Soil and Agricultural Chemistry Analysis; China Agriculture Press: Beijing, China, 2000. [Google Scholar]
  36. Nyambo, P.; Chiduza, C.; Araya, T. Effect of conservation agriculture on selected soil physical properties on a haplic cambisol in Alice, Eastern Cape, South Africa. Arch. Agron. Soil Sci. 2022, 68, 195–208. [Google Scholar] [CrossRef]
  37. Li, H.; Qiu, Y.; Yao, T.; Han, D.; Gao, Y.; Zhang, J.; Ma, Y.; Zhang, H.; Yang, X. Nutrients available in the soil regulate the changes of soil microbial community alongside degradation of alpine meadows in the northeast of the Qinghai-Tibet Plateau. Sci. Total Environ. 2021, 792, 148363. [Google Scholar] [CrossRef] [PubMed]
  38. Tang, S.; Ma, Q.; Luo, J.; Xie, Y.; Hashmi, M.L.U.R.; Pan, W.; Zheng, N.; Liu, M.; Wu, L. The inhibition effect of tea polyphenols on soil nitrification is greater than denitrification in tea garden soil. Sci. Total Environ. 2021, 778, 146328. [Google Scholar] [CrossRef] [PubMed]
  39. Harmon, M.E.; Silver, W.L.; Fasth, B.; Chen, H.; Burke, I.C.; Parton, W.J.; Hart, S.C.; Currie, W.S.; Lidet. Long-term patterns of mass loss during the decomposition of leaf and fine root litter: An intersite comparison. Glob. Change Biol. 2009, 15, 1320–1338. [Google Scholar] [CrossRef]
  40. Olson, J.S. Energy storage and the balance of producers and decomposers in ecological systems. Ecology 1963, 44, 322–331. [Google Scholar] [CrossRef]
  41. Wu, R.; Cheng, X.; Han, H. The effect of forest thinning on soil microbial community structure and function. Forests 2019, 10, 352. [Google Scholar] [CrossRef]
  42. Cheng, X.; Yu, M.; Wang, G.G. Effects of thinning on soil organic carbon fractions and soil properties in Cunninghamia lanceolata stands in eastern China. Forests 2017, 8, 198. [Google Scholar] [CrossRef]
  43. Heckman, K.A.; Possinger, A.R.; Badgley, B.D.; Bowman, M.M.; Gallo, A.C.; Hatten, J.A.; Nave, L.E.; SanClements, M.D.; Swanston, C.W.; Weiglein, T.L. Moisture-driven divergence in mineral-associated soil carbon persistence. Proc. Natl. Acad. Sci. USA 2023, 120, e2210044120. [Google Scholar] [CrossRef] [PubMed]
  44. Wang, T.; Xu, Q.; Gao, D.; Zhang, B.; Zuo, H.; Jiang, J. Effects of thinning and understory removal on the soil water-holding capacity in Pinus massoniana plantations. Sci. Rep. 2021, 11, 13029. [Google Scholar] [CrossRef] [PubMed]
  45. Ma, Y.; Cheng, X.; Kang, F.; Han, H. Effects of thinning on soil aggregation, organic carbon and labile carbon component distribution in Larix principis-rupprechtii plantations in North China. Ecol. Indic. 2022, 139, 108873. [Google Scholar] [CrossRef]
  46. Erkan, N.; Güner, Ş.T.; Aydın, A.C. Thinning effects on stand growth, carbon stocks, and soil properties in Brutia pine plantations. Carbon Balance Manag. 2023, 18, 1–10. [Google Scholar] [CrossRef]
  47. Lull, C.; Gil-Ortiz, R.; Bautista, I.; Lidón, A. Seasonal variation and soil texture-related thinning effects on soil microbial and enzymatic properties in a semi-arid pine forest. Forests 2023, 14, 1674. [Google Scholar] [CrossRef]
  48. Tan, X.; Luo, S.; Li, H.; Hao, X.; Wang, J.; Dong, Q.; Chen, Z. Investigating the effects of snow cover and vegetation on soil temperature using remote sensing indicators in the three river source region, China. Remote Sens. 2022, 14, 4114. [Google Scholar] [CrossRef]
  49. Çömez, A.; Güner, Ş.T.; Tolunay, D. The effect of stand structure on litter decomposition in Pinus sylvestris L. stands in Turkey. Ann. For. Sci. 2021, 78, 1–13. [Google Scholar] [CrossRef]
  50. Li, S.; Xu, Z.; Yu, Z.; Fu, Y.; Su, X.; Zou, B.; Wang, S.; Huang, Z.; Wan, X. Litter decomposition and nutrient release are faster under secondary forests than under Chinese fir plantations with forest development. Sci. Rep. 2023, 13, 16805. [Google Scholar] [CrossRef]
  51. Han, S.H.; An, J.Y.; Hernandez, J.O.; Yang, H.M.; Kim, E.-S.; Noh, N.J.; Seo, J.M.; Park, B.B. Effects of Thinning Intensity on Litterfall Production, Soil Chemical Properties, and Fine Root Distribution in Pinus koraiensis Plantation in Republic of Korea. Plants 2023, 12, 3614. [Google Scholar] [CrossRef]
  52. Saha, S.; Huang, L.; Khoso, M.A.; Wu, H.; Han, D.; Ma, X.; Poudel, T.R.; Li, B.; Zhu, M.; Lan, Q.; et al. Fine root decomposition in forest ecosystems: An ecological perspective. Front. Plant Sci. 2023, 14, 1277510. [Google Scholar] [CrossRef] [PubMed]
  53. Wang, Z.; Liu, M.; Chen, F.; Li, H. Variation in fine root traits with thinning intensity in a Chinese fir plantation insights from branching order and functional groups. Sci. Rep. 2021, 11, 22710. [Google Scholar] [CrossRef] [PubMed]
  54. Akburak, S.; Makineci, E. Thinning effects on biomass and element concentrations of roots in adjacent hornbeam and oak stands in Istanbul, Turkey. For. Ecosyst. 2021, 8, 1–10. [Google Scholar] [CrossRef]
  55. Li, Y.; Hong, S.; Fang, S.; Cui, G. Thinning promotes litter decomposition and nutrient release in poplar plantations via altering the microclimate and understory plant diversity. Ann. For. Res. 2023, 66, 3–18. [Google Scholar] [CrossRef]
  56. Davidson, E.A.; Janssens, I.A. Temperature sensitivity of soil carbon decomposition and feedbacks to climate change. Nature 2006, 440, 165–173. [Google Scholar] [CrossRef] [PubMed]
  57. Sullivan, B.; Kolb, T.; Hart, S.; Kaye, J.; Dore, S.; Montes-Helu, M. Thinning reduces soil carbon dioxide but not methane flux from southwestern USA ponderosa pine forests. For. Ecol. Manag. 2008, 255, 4047–4055. [Google Scholar] [CrossRef]
  58. Nissan, A.; Alcolombri, U.; Peleg, N.; Galili, N.; Jimenez-Martinez, J.; Molnar, P.; Holzner, M. Global warming accelerates soil heterotrophic respiration. Nat. Commun. 2023, 14, 3452. [Google Scholar] [CrossRef] [PubMed]
  59. Zhang, X.; Bi, J.; Zhu, D.; Meng, Z. Seasonal variation of net ecosystem carbon exchange and gross primary production over a Loess Plateau semi-arid grassland of northwest China. Sci. Rep. 2024, 14, 2916. [Google Scholar] [CrossRef]
  60. Epron, D.; Ngao, J.; Dannoura, M.; Bakker, M.; Zeller, B.; Bazot, S.; Bosc, A.; Plain, C.; Lata, J.-C.; Priault, P. Seasonal variations of belowground carbon transfer assessed by in situ 13 CO 2 pulse labelling of trees. Biogeosciences 2011, 8, 1153–1168. [Google Scholar] [CrossRef]
  61. Bai, S.H.; Dempsey, R.; Reverchon, F.; Blumfield, T.J.; Ryan, S.; Cernusak, L.A. Effects of forest thinning on soil-plant carbon and nitrogen dynamics. Plant Soil 2017, 411, 437–449. [Google Scholar] [CrossRef]
  62. Ramesh, T.; Bolan, N.S.; Kirkham, M.B.; Wijesekara, H.; Kanchikerimath, M.; Rao, C.S.; Sandeep, S.; Rinklebe, J.; Ok, Y.S.; Choudhury, B.U. Soil organic carbon dynamics: Impact of land use changes and management practices: A review. Adv. Agron. 2019, 156, 1–107. [Google Scholar] [CrossRef]
  63. Settineri, G.; Mallamaci, C.; Mitrović, M.; Sidari, M.; Muscolo, A. Effects of different thinning intensities on soil carbon storage in Pinus laricio forest of Apennine South Italy. Eur. J. For. Res. 2018, 137, 131–141. [Google Scholar] [CrossRef]
  64. Bravo-Oviedo, A.; Ruiz-Peinado, R.; Modrego, P.; Alonso, R.; Montero, G. Forest thinning impact on carbon stock and soil condition in Southern European populations of P. sylvestris L. For. Ecol. Manag. 2015, 357, 259–267. [Google Scholar] [CrossRef]
  65. Ma, J.; Kang, F.; Cheng, X.; Han, H. Moderate thinning increases soil organic carbon in Larix principis-rupprechtii (Pinaceae) plantations. Geoderma 2018, 329, 118–128. [Google Scholar] [CrossRef]
  66. Abdallah, M.A.; Mata-González, R.; Noller, J.S.; Ochoa, C.G. Ecosystem carbon in relation to woody plant encroachment and control: Juniper systems in Oregon, USA. Agric. Ecosyst. Environ. 2020, 290, 106762. [Google Scholar] [CrossRef]
  67. Rozak, A.H.; Rutishauser, E.; Raulund-Rasmussen, K.; Sist, P. The imprint of logging on tropical forest carbon stocks: A Bornean case-study. For. Ecol. Manag. 2018, 417, 154–166. [Google Scholar] [CrossRef]
  68. Nave, L.E.; Vance, E.D.; Swanston, C.W.; Curtis, P.S. Harvest impacts on soil carbon storage in temperate forests. For. Ecol. Manag. 2010, 259, 857–866. [Google Scholar] [CrossRef]
  69. Ellis, E.A.; Montero, S.A.; Gómez, I.U.H.; Montero, J.A.R.; Ellis, P.W.; Rodríguez-Ward, D.; Reyes, P.B.; Putz, F.E. Reduced-impact logging practices reduce forest disturbance and carbon emissions in community managed forests on the Yucatán Peninsula, Mexico. For. Ecol. Manag. 2019, 437, 396–410. [Google Scholar] [CrossRef]
  70. Powers, M.; Kolka, R.; Palik, B.; McDonald, R.; Jurgensen, M. Long-term management impacts on carbon storage in Lake States forests. For. Ecol. Manag. 2011, 262, 424–431. [Google Scholar] [CrossRef]
  71. Gong, C.; Tan, Q.; Liu, G.; Xu, M. Forest thinning increases soil carbon stocks in China. For. Ecol. Manag. 2021, 482, 118812. [Google Scholar] [CrossRef]
  72. Li, C.; Shi, Y.; Zhou, G.; Zhou, Y.; Xu, L.; Tong, L.; Liu, X. Effects of different management approaches on soil carbon dynamics in Moso bamboo forest ecosystems. Catena 2018, 169, 59–68. [Google Scholar] [CrossRef]
  73. Kim, S.; Kim, C.; Han, S.H.; Lee, S.-T.; Son, Y. A multi-site approach toward assessing the effect of thinning on soil carbon contents across temperate pine, oak, and larch forests. For. Ecol. Manag. 2018, 424, 62–70. [Google Scholar] [CrossRef]
  74. McGuire, A.D.; Lawrence, D.M.; Koven, C.; Clein, J.S.; Burke, E.; Chen, G.; Jafarov, E.; MacDougall, A.H.; Marchenko, S.; Nicolsky, D. Dependence of the evolution of carbon dynamics in the northern permafrost region on the trajectory of climate change. Proc. Natl. Acad. Sci. USA 2018, 115, 3882–3887. [Google Scholar] [CrossRef]
  75. Sulman, B.N.; Moore, J.A.; Abramoff, R.; Averill, C.; Kivlin, S.; Georgiou, K.; Sridhar, B.; Hartman, M.D.; Wang, G.; Wieder, W.R. Multiple models and experiments underscore large uncertainty in soil carbon dynamics. Biogeochemistry 2018, 141, 109–123. [Google Scholar] [CrossRef]
  76. Liang, C.; Schimel, J.P.; Jastrow, J.D. The importance of anabolism in microbial control over soil carbon storage. Nat. Microbiol. 2017, 2, 17105. [Google Scholar] [CrossRef]
  77. Luo, Z.; Feng, W.; Luo, Y.; Baldock, J.; Wang, E. Soil organic carbon dynamics jointly controlled by climate, carbon inputs, soil properties and soil carbon fractions. Glob. Chang Biol. 2017, 23, 4430–4439. [Google Scholar] [CrossRef] [PubMed]
  78. Wu, J.; Wang, H.; Li, G.; Wu, J.; Ma, W. Vertical and seasonal changes in soil carbon pools to vegetation degradation in a wet meadow on the Qinghai-Tibet Plateau. Sci. Rep. 2021, 11, 12268. [Google Scholar] [CrossRef]
  79. Moyes, A.B.; Germino, M.J.; Kueppers, L.M. Moisture rivals temperature in limiting photosynthesis by trees establishing beyond their cold-edge range limit under ambient and warmed conditions. New Phytol. 2015, 207, 1005–1014. [Google Scholar] [CrossRef] [PubMed]
  80. Keiluweit, M.; Bougoure, J.J.; Nico, P.S.; Pett-Ridge, J.; Weber, P.K.; Kleber, M. Mineral protection of soil carbon counteracted by root exudates. Nat. Clim. Chang. 2015, 5, 588–595. [Google Scholar] [CrossRef]
  81. Yamaguchi, D.P.; Nakaji, T.; Hiura, T.; Hikosaka, K. Effects of seasonal change and experimental warming on the temperature dependence of photosynthesis in the canopy leaves of Quercus serrata. Tree Physiol. 2016, 36, 1283–1295. [Google Scholar] [CrossRef]
  82. Zhou, J.; Li, P.; Wang, J. Effects of light intensity and temperature on the photosynthesis characteristics and yield of lettuce. Horticulturae 2022, 8, 178. [Google Scholar] [CrossRef]
  83. Witt, C.; Gaunt, J.L.; Galicia, C.C.; Ottow, J.C.; Neue, H.-U. A rapid chloroform-fumigation extraction method for measuring soil microbial biomass carbon and nitrogen in flooded rice soils. Biol. Fertil. Soils 2000, 30, 510–519. [Google Scholar] [CrossRef]
  84. Penuelas, J.; Poulter, B.; Sardans, J.; Ciais, P.; Van Der Velde, M.; Bopp, L.; Boucher, O.; Godderis, Y.; Hinsinger, P.; Llusia, J. Human-induced nitrogen–phosphorus imbalances alter natural and managed ecosystems across the globe. Nat. Commun. 2013, 4, 2934. [Google Scholar] [CrossRef] [PubMed]
  85. Melillo, J.M.; Frey, S.D.; DeAngelis, K.M.; Werner, W.J.; Bernard, M.J.; Bowles, F.P.; Pold, G.; Knorr, M.A.; Grandy, A.S. Long-term pattern and magnitude of soil carbon feedback to the climate system in a warming world. Science 2017, 358, 101–105. [Google Scholar] [CrossRef]
  86. Malik, A.A.; Puissant, J.; Buckeridge, K.M.; Goodall, T.; Jehmlich, N.; Chowdhury, S.; Gweon, H.S.; Peyton, J.M.; Mason, K.E.; van Agtmaal, M. Land use driven change in soil pH affects microbial carbon cycling processes. Nat. Commun. 2018, 9, 3591. [Google Scholar] [CrossRef] [PubMed]
  87. Schimel, J.P.; Schaeffer, S.M. Microbial control over carbon cycling in soil. Front. Microbiol. 2012, 3, 348. [Google Scholar] [CrossRef] [PubMed]
  88. Berg, A.; Findell, K.; Lintner, B.; Giannini, A.; Seneviratne, S.I.; Van Den Hurk, B.; Lorenz, R.; Pitman, A.; Hagemann, S.; Meier, A. Land–atmosphere feedbacks amplify aridity increase over land under global warming. Nat. Clim. Chang. 2016, 6, 869–874. [Google Scholar] [CrossRef]
  89. Lorenz, R.; Argüeso, D.; Donat, M.G.; Pitman, A.J.; van den Hurk, B.; Berg, A.; Lawrence, D.M.; Chéruy, F.; Ducharne, A.; Hagemann, S. Influence of land-atmosphere feedbacks on temperature and precipitation extremes in the GLACE-CMIP5 ensemble. J. Geophys. Res. Atmos. 2016, 121, 607–623. [Google Scholar] [CrossRef]
  90. Yun, J.; Chen, X.; Liu, S.; Zhang, W. Effects of temperature and moisture on soil organic carbon mineralization. In IOP Conference Series: Materials Science and Engineering; IOP Publishing: Bristol, UK, 2019; p. 012085. [Google Scholar]
  91. Schwalm, C.R.; Williams, C.A.; Schaefer, K.; Baldocchi, D.; Black, T.A.; Goldstein, A.H.; Law, B.E.; Oechel, W.C.; Paw, U.K.T.; Scott, R.L. Reduction in carbon uptake during turn of the century drought in western North America. Nat. Geosci. 2012, 5, 551–556. [Google Scholar] [CrossRef]
  92. Seneviratne, S.I.; Lüthi, D.; Litschi, M.; Schär, C. Land–atmosphere coupling and climate change in Europe. Nature 2006, 443, 205–209. [Google Scholar] [CrossRef]
  93. Chahal, I.; Vyn, R.J.; Mayers, D.; Van Eerd, L.L. Cumulative impact of cover crops on soil carbon sequestration and profitability in a temperate humid climate. Sci. Rep. 2020, 10, 13381. [Google Scholar] [CrossRef] [PubMed]
  94. Hoover, C.M. Management impacts on forest floor and soil organic carbon in northern temperate forests of the US. Carbon Balance Manag. 2011, 6, 1–8. [Google Scholar] [CrossRef]
  95. Lange, M.; Eisenhauer, N.; Sierra, C.A.; Bessler, H.; Engels, C.; Griffiths, R.I.; Mellado-Vázquez, P.G.; Malik, A.A.; Roy, J.; Scheu, S. Plant diversity increases soil microbial activity and soil carbon storage. Nat. Commun. 2015, 6, 6707. [Google Scholar] [CrossRef]
  96. Wu, C.-X.; Gao, X.-F.; Yan, B.-S.; Liang, C.-Q.; Chen, J.-R.; Wang, G.-L.; Liu, G.-B. Effects of long-term fertilization on soil nutrient characteristics and microbial resource restrictions in a terrace on the Loess Plateau. Huan Jing Ke Xue = Huanjing Kexue 2022, 43, 521–529. [Google Scholar] [CrossRef]
  97. Lin, J.-C.; Chiu, C.-M.; Lin, Y.-J.; Liu, W.-Y. Thinning effects on biomass and carbon stock for young Taiwania plantations. Sci. Rep. 2018, 8, 3070. [Google Scholar] [CrossRef] [PubMed]
  98. Zou, X.; Zheng, Z.; Yang, C.; Yang, M.; Guo, Z.; Wang, Y.; Huang, Z.; Zhu, L.; Xu, L.; Lin, K. Initial effects of crop tree release and traditional thinning on productivity and carbon storage of Cunninghamia lanceolata plantation. Front. For. Glob. Chang. 2023, 6, 1288613. [Google Scholar] [CrossRef]
Figure 1. The 2021 climate conditions in the research area encompassed (A) monthly average precipitation, (B) monthly average temperature, and (C) monthly average relative humidity.
Forests 15 00449 g001
Figure 2. Experimental and control plots across seven different thinning intensities.
Forests 15 00449 g002
Figure 3. Soil carbon sequestration diagram.
Forests 15 00449 g003
Figure 4. Mass percentages of residual litter (A) and fine roots (B), and carbon content percentages in litter (C) and fine roots (D) at various thinning intensities.
Forests 15 00449 g004
Figure 5. Seasonal variation in soil respiration rate across thinning intensities: categorizing April, July, September, and November as spring, summer, autumn, and winter, respectively.
Forests 15 00449 g005
Figure 6. Seasonal redundancy analysis (RDA) of soil carbon cycling and properties during spring (A), summer (B), autumn (C), and winter (D), analyzing key parameters: litter carbon (LC), fine root carbon (FRC), soil respiration carbon (SRC), correction factor (CF), soil carbon quarterly fixed value (SCQF), potential of Hydrogen (pH), soil organic carbon (SOC), carbon-to-nitrogen ratio (C/N), soil temperature (ST), soil moisture (SM), and total nitrogen (TN).
Forests 15 00449 g006
Figure 7. “Boruta” analysis determined the significance of variables across varying thinning intensities for spring (A), summer (B), autumn (C), and winter (D), with the X-axis representing soil parameters and the Y-axis depicting the importance of these parameters at depth, as measured by Z-scores.
Forests 15 00449 g007
Table 1. Basic overview of the study site.
Thinning
Intensity
Mean Diameter at Breast Height (cm)Mean Tree Height (m)Stand Density per Hectare (Trees/ha)LatitudeLongitude
CK (0)11.65 ± 4.9212.14 ± 4.59145646°52′16.74″129°5′2.89″
A (10%)15.36 ± 8.3412.92 ± 4.2896746°52′37.86″129°5′6.35″
B (15%)15.00 ± 7.5812.58 ± 4.36125646°52′34.32″129°5′6.57″
C (20%)16.14 ± 7.5111.77 ± 4.81102246°52′30.53″129°5′6.32″
D (25%)14.36 ± 8.1911.14 ± 4.40118946°52′27.18″129°5′4.26″
E (30%)13.38 ± 6.6412.17 ± 4.25112246°52′23.82″129°5′3.72″
F (35%)14.66 ± 7.2913.74 ± 4.87116746°52′20.10″129°5′3.94″
Table 2. Seasonal variations in soil properties under different thinning intensities.
SeasonIndexThinning IntensityFp
CK (0)A (10%)B (15%)C (20%)D (25%)E (30%)F (35%)
SpringpH value5.33 ± 1.33 b6.04 ± 0.81 ab6.33 ± 1.06 ab6.48 ± 1.15 ab7.34 ± 0.68 a6.54 ± 0.47 ab6.72 ± 0.15 ab1.42ns
Soil moisture (%)24.24 ± 0.45 e28.50 ± 2.14 d43.86 ± 1.69 a33.46 ± 2.66 c34.17 ± 0.23 c40.67 ± 0.06 b18.47 ± 2.25 f84.46***
Soil temperature (°C)15.08 ± 0.26 b15.05 ± 0.44 b16.63 ± 0.57 a16.93 ± 0.74 a16.22 ± 0.94 ab15.76 ± 0.93 ab15.66 ± 0.51 ab3.53*
Soil organic carbon (g kg−1)23.68 ± 4.09 c49.60 ± 0.80 a35.76 ± 7.03 b33.90 ± 6.65 b36.46 ± 5.17 b38.76 ± 5.07 b43.66 ± 7.79 ab6.15**
Total N (g kg−1)4.44 ± 0.52 a3.32 ± 0.94 ab1.79 ± 0.71 b2.83 ± 1.19 ab3.62 ± 1.47 a3.37 ± 0.88 ab3.62 ± 0.29 a2.31ns
C/N5.36 ± 0.91 b15.85 ± 4.89 ab24.22 ± 16.32 a12.66 ± 2.50 ab11.09 ± 3.88 ab12.05 ± 3.24 ab12.14 ± 2.72 ab2.09ns
SummerpH value6.35 ± 0.22 a5.63 ± 0.36 a6.39 ± 0.06 a5.70 ± 1.55 a5.92 ± 0.28 a5.51 ± 0.18 a6.34 ± 0.11 a1.105ns
Soil moisture (%)23.22 ± 0.08 g39.11 ± 0.71 c28.92 ± 0.07 f40.57 ± 0.15 b34.05 ± 0.45 d44.94 ± 0.17 a29.68 ± 0.68 e989.98***
Soil temperature (°C)20.71 ± 0.26 bc21.24 ± 0.23 ab19.90 ± 0.22 d20.28 ± 0.09 cd21.59 ± 0.61 a18.96 ± 0.47 e21.11 ± 0.34 ab19.63***
Soil organic carbon (g kg−1)37.73 ± 18.80 a46.40 ± 22.92 a59.08 ± 43.88 a58.65 ± 17.40 a56.15 ± 42.89 a84.46 ± 24.62 a33.46 ± 16.61 a1.035ns
Total N (g kg−1)5.39 ± 0.28 cd5.80 ± 0.61 cd6.87 ± 0.39 b7.33 ± 0.28 b10.28 ± 0.60 a5.93 ± 0.52 c5.07 ± 0.31 d47.58***
C/N7.11 ± 3.77 ab7.91 ± 3.40 ab8.85 ± 6.97 ab7.98 ± 2.20 ab5.63 ± 4.59 b14.25 ± 3.85 a6.72 ± 3.50 ab1.29ns
AutumnpH value6.74 ± 0.55 a5.84 ± 0.88 ab6.65 ± 0.53 a6.27 ± 0.47 a6.47 ± 0.24 a5.16 ± 0.69 b6.74 ± 0.44 a3.12*
Soil moisture (%)20.11 ± 0.63 e35.75 ± 0.08 b30.67 ± 2.64 c34.21 ± 0.25 d24.14 ± 0.31 d40.60 ± 0.10 a14.00 ± 0.20 f247.17***
Soil temperature (°C)15.38 ± 0.27 bc17.61 ± 0.27 a16.33 ± 0.69 b16.41 ± 0.84 b15.99 ± 0.84 bc15.13 ± 0.30 c16.03 ± 0.18 bc6.37**
Soil organic carbon (g kg−1)43.50 ± 1.62 a31.35 ± 0.51 c36.04 ± 7.36 bc40.11 ± 4.45 ab41.80 ± 2.73 ab42.09 ± 0.36 ab43.76 ± 2.53 a4.78**
Total N (g kg−1)5.22 ± 0.19 c6.38 ± 0.14 a5.11 ± 0.74 c5.55 ± 0.26 bc5.37 ± 0.54 c6.23 ± 0.19 ab5.45 ± 0.33 c4.68**
C/N8.34 ± 0.03 a4.91 ± 0.03 c7.04 ± 1.08 ab7.24 ± 0.95 ab7.84 ± 0.94 ab6.76 ± 0.19 b8.03 ± 0.49 ab8.51**
WinterpH value6.23 ± 0.41 ab6.48 ± 0.10 a6.08 ± 0.56 ab5.52 ± 0.79 b5.73 ± 0.45 ab5.77 ± 0.20 ab6.05 ± 0.07 ab1.65ns
Soil moisture (%)27.66 ± 0.54 d34.30 ± 0.36 c38.70 ± 0.12 bc44.44 ± 0.27 ab27.03 ± 0.06 d44.99 ± 3.16 a34.4 ± 8.06 c14.59***
Soil temperature (°C)4.02 ± 0.60 bc6.42 ± 0.33 a4.87 ± 0.68 b4.25 ± 0.79 bc6.52 ± 0.23 a3.74 ± 0.15 c4.05 ± 0.68 bc13.61***
Soil organic carbon (g kg−1)27.13 ± 14.97 b27.41 ± 6.82 b47.54 ± 14.69 ab31.93 ± 15.04 b40.55 ± 2.52 b62.92 ± 11.82 a40.27 ± 11.35 b3.44*
Total N (g kg−1)2.63 ± 1.37 b2.17 ± 0.81 b4.13 ± 2.60 ab5.23 ± 2.14 ab3.90 ± 2.52 ab3.33 ± 1.37 ab6.53 ± 1.80 a1.88ns
C/N10.47 ± 2.22 a13.33 ± 3.23 a17.23 ± 13.77 a6.15 ± 2.17 a17.15 ± 16.31 a27.28 ± 8.94 a6.44 ± 2.47 a1.25ns
Note: The values are shown as mean ± standard deviation (S.D.) (n = 3). Different letters indicate significant differences (p < 0.05) among the four different thinning intensities based on a one-way ANOVA followed by an LSD test. ns—not significant; * p < 0.05; ** p < 0.01; and *** p < 0.001.
Table 3. Regression equations between litter residual rates and time.
Thinning IntensityRegression EquationCorrelation Coefficient (R2)Decomposition Constant kt0.5/at0.95/a
CK (0)y = 0.9221 e−0.7381t0.92190.7381 a0.944.06
A (10%)y = 0.9287 e−0.5875t0.88310.5875 cd1.185.10
B (15%)y = 0.9210 e−0.7219t0.92380.7219 ab0.964.15
C (20%)y = 0.9078 e−0.7401t0.89610.7401 a0.944.05
D (25%)y = 1.0165 e−0.4704t0.97020.4704 d1.476.37
E (30%)y = 0.9363 e−0.5991t0.93460.5991 bc1.165.00
F (35%)y = 0.9618 e−0.5595t0.96780.5595 cd1.245.35
Note: t0.5/a denotes the time needed to achieve 50% decomposition, whereas t0.95/a corresponds to the time for 95% decomposition. Variations in lowercase letters signify statistically significant differences in the rates of decomposition among varying intensities of thinning (p < 0.05).
Table 4. Regression equations between fine root residual rates and time.
Thinning IntensityRegression EquationCorrelation Coefficient (R2)Decomposition Constant kt0.5/at0.95/a
CK (0)y = 0.9598 e−0.4403t0.96290.4403 a1.576.80
A (10%)y = 0.9810 e−0.3115t0.98240.3115 abc2.229.62
B (15%)y = 0.9733 e−0.1529t0.90430.1529 d4.5319.60
C (20%)y = 0.9738 e−0.4140t0.98190.4140 ab1.677.24
D (25%)y = 0.9643 e−0.2841t0.94290.2841 bc2.4410.54
E (30%)y = 0.9642 e−0.2574t0.93640.2574 cd2.6911.64
F (35%)y = 0.9972 e−0.4267t0.99810.4267 a1.627.02
Note: t0.5/a denotes the time needed to achieve 50% decomposition, whereas t0.95/a corresponds to the time for 95% decomposition. Variations in lowercase letters signify statistically significant differences in the rates of decomposition among varying intensities of thinning (p < 0.05).
Table 5. Quantitative analysis of seasonal carbon budget under different thinning intensities.
SeasonThinning IntensityLitter Carbon Input (t/hm2)Fine Root Carbon Input (t/hm2)Soil Respiration Carbon Output (t/hm2)Correction Factor ε (t/hm2)Soil Carbon Quarterly Fixed Value (t/hm2)
SpringCK (0)1.140.120.771.331.81
A (10%)0.870.122.273.452.17
B (15%)1.300.181.585.054.95
C (20%)1.150.142.413.592.47
D (25%)1.160.131.291.691.69
E (30%)0.940.100.971.831.90
F (35%)1.690.151.493.814.16
SummerCK (0)0.850.031.824.703.75
A (10%)0.630.023.996.663.31
B (15%)0.710.012.893.271.10
C (20%)0.590.025.157.152.61
D (25%)0.640.032.376.354.65
E (30%)0.810.033.544.962.26
F (35%)0.550.042.404.082.26
AutumnCK (0)1.710.551.58−3.39−2.71
A (10%)1.180.542.88−1.58−2.73
B (15%)1.940.512.26−3.53−3.34
C (20%)1.700.573.87−2.56−4.15
D (25%)0.550.611.72−4.21−4.78
E (30%)1.570.503.610.51−1.03
F (35%)1.040.542.45−2.56−3.43
WinterCK (0)1.220.150.39−3.83−2.85
A (10%)1.010.200.61−3.36−2.75
B (15%)0.520.130.44−2.92−2.71
C (20%)0.790.190.74−1.17−0.93
D (25%)1.340.160.48−2.58−1.56
E (30%)0.830.130.63−3.46−3.13
F (35%)0.720.160.50−3.37−2.99
Disclaimer/Publisher’s Note: The statements, opinions and data contained in all publications are solely those of the individual author(s) and contributor(s) and not of MDPI and/or the editor(s). MDPI and/or the editor(s) disclaim responsibility for any injury to people or property resulting from any ideas, methods, instructions or products referred to in the content.

