Article

A New Strategy for Planning Urban Park Green Spaces by Considering Their Spatial Accessibility and Distributional Equity

1
Co-Innovation Center for Sustainable Forestry in Southern China, Nanjing Forestry University, Nanjing 210037, China
2
Zhejiang Forest Resources Monitoring Centre, Hangzhou 310020, China
3
Zhejiang Forestry Survey Planning and Design Company Limited, Hangzhou 310020, China
*
Authors to whom correspondence should be addressed.
Forests 2024, 15(3), 570; https://doi.org/10.3390/f15030570
Submission received: 23 February 2024 / Revised: 18 March 2024 / Accepted: 20 March 2024 / Published: 21 March 2024
(This article belongs to the Section Urban Forestry)

Abstract

:
Urban park green spaces (PGSs) are crucial social public resources that provide various ecological services and enhance human health and well-being. However, with the acceleration of urbanization, the accessibility and equity of urban PGS resources are increasingly threatened. This study aims to propose an integrated framework that considers accessibility and equity simultaneously to optimize the planning and layout of urban PGS within the high-speed ring road of Hefei City. This study first used an improved two-step floating catchment area (2SFCA) method to quantify the level of accessibility of urban PGS within the ring road. Then, with the use of Lorenz curves, Gini coefficients, and bivariate correlation coefficients, the equity characteristics of these PGSs were quantified and evaluated, followed by an analysis of their relationships to the accessibility levels. Based on this comprehensive evaluation, the particle swarm optimization (PSO) algorithm was employed to the areas with low accessibility and equity levels to propose targeted PGS optimization strategies. The results showed that the accessibility of PGS was unevenly distributed, exhibiting a clear spatial difference of “east–west clustering”. The number of subdistricts with good (52.24–94.78) and best (94.79–283.58) accessibility was four, which was less than one-tenth of the total number of subdistricts in the study area. At the subdistrict level, the Gini coefficients for the accessible area of all types of PGSs were substantially higher than the international warning line of 0.4, indicating a substantial inequity in the population’s access to PGS. The implemented PSO algorithm resulted in eight new parks being planned at the specific optimized locations. Based on the actual land use status of the selected sites, recommendations are provided for the planning and layout of PGS. This proposed framework offers valuable data and theoretical insights for urban public green space planning and design in similar regions.

1. Introduction

Urban park green spaces (PGSs) are vital urban public service facilities and offer the most important green open spaces for city dwellers to connect with nature and enjoy some rest and peace [1,2]. They have diversified ecological service functions, including purifying pollution [1,3], improving urban local microclimate [4,5], mitigating urban heat island effects [5,6,7], maintaining urban biodiversity [8,9], and withstanding natural disasters [10]. Urban PGSs also contribute to reconstructing and displaying urban history and culture while constructing the urban image, providing significant social and psychological values [11,12,13]. However, during the process of rapid urbanization, urban planning and layout often overlook the match of supply and demand between different types of PGSs and population, and further different social groups [1,14], which leads to a spatial dislocation of urban PGS functions and residents’ living needs, raising great social concern over the accessibility and equity of urban PGS resources [15,16,17]. Thus, it is necessary to consider the space accessibility and equity issues comprehensively when planning urban PGS in response to these social and public concerns.
Accessibility is a conceptual measure that reflects the correlation between spatial layout and service efficiency [18]. The accessibility evaluation of PGS measures residents’ convenience of accessing parks, the logical design of parks, and the impartiality of service efficiency. In this regard, relevant scholars have broadly considered and employed this accessibility evaluation [19,20], and a variety of methods and models exist for assessing the accessibility of public facilities. These approaches principally encompass the weighted distance method [21,22], gravity model [23,24], two-step floating catchment area (2SFCA) method [25,26], and others. The 2SFCA model is a significant approach for measuring public service facility spatial accessibility, and it considers time and distance influences as well as the supply of facilities and residents’ demand capacity. On this basis, many scholars have developed and refined the 2SFCA model, with refinements including the gravity 2SFCA (G2SFCA) [27], enhanced 2SFCA (E2SFCA) [28,29], kernel density-type 2SFCA (KD2SFCA) [30,31,32], and Gaussian 2SFCA (Ga2SFCA) [33,34,35]. However, these models do not take into account non-spatial factors when measuring and evaluating the spatial accessibility of service facilities. As we know, during the initial phase of construction, urban PGSs are often influenced by various factors such as funding, transportation, and policies, which can lead to variations in PGS scale and quality. With constant urban developments, these PGSs continue to be subject to disturbances from both natural and human activities, resulting in differences in size, shape, and theme [36]. These varied types of PGSs serve different ecological functions and offer different recreational values. For instance, pocket parks are typically smaller in size and have less green space than regular parks. Due to their small, convenient, and ubiquitous nature, pocket parks can effectively meet the leisure needs of people in high-density urban areas [37]. Conversely, large parks with abundant natural and human resources play a crucial role in the urban ecosystem. They offer a wider range of services, and visitors can spend more time exploring them. Therefore, when analyzing the accessibility of urban PGSs, it is essential to consider their diversity. For example, Li et al. categorized the PGSs in a study area into four types, namely comprehensive parks, community parks, theme parks, and linear parks, to quantify their distinct accessibility and equity in Nanjing City [38]. Zhang conducted an analysis of the accessibility and equity of PGSs in Guangzhou City by involving an attractiveness index for each PGS to ensure precise results [39]. Furthermore, it is important to consider human requirements when assessing the accessibility of PGS [40]. Residents may use different modes of transportation to reach their desired destinations and have distinct preferences regarding the types of PGSs they perceive as leisure spots [38,40]. For example, Hu et al. analyzed the accessibility and equity of PGS in Changchun’s parks across three modes of transportation: walking, public transportation, and private vehicles [34]. Using mobile phone user data, Ren and Guan first included the frequency, length, and duration of PGS activities as indicators in the PGS accessibility evaluation framework [41]. However, previous studies did not adequately consider the competition between different types and qualities of PGS, and incorporating the probability of residents’ choice of PGS into the calculation of PGS accessibility was still rare. Therefore, it is necessary to conduct a comprehensive investigation on the accessibility evaluation of urban PGS by taking into account the diversity of PGS, transportation modes, and the probability of residents’ choice of different PGSs.
PGS equity is another concept that stems from research on equity in public service facilities. It specifically evaluates the fair and reasonable allocation of resources [16]. So far, numerous scholars have studied the equity of PGS availability. For example, Wolch et al. conducted an objective analysis of the correlation between social and economic status and access to park resources for residents of diverse races, and their findings revealed that low-income individuals and minorities, except Caucasians, experienced a significantly reduced access to parks within the same locality [1]. Kong et al. analyzed the effect of urbanization on the accessible equity of urban parks in Beijing from 2000 to 2015, and they concluded that urbanization impacted the number and accessibility of parks positively. However, there existed an inequity in park access in some regions [42]. The Gini coefficient and the Lorenz curve are commonly used in economics to measure the income disparity among residents of a country or region. With the development of cross-fertilization of disciplines, the Gini coefficient is gradually being used to evaluate the equity of the spatial distribution of public resources such as PGS [16,43] and medical resources [44]. For example, Henry et al. identified inequalities in green space provision across German major cities by applying the Gini coefficient [43]. Using Beijing’s central city as an example, Wang et al. discussed the equity of distribution of urban PGSs amidst rapid urbanization [16]. Social equity advocates for equal access to public resources for different social and economic groups, with a focus on providing more opportunities for vulnerable groups [45,46]. China’s rapid economic development and urbanization have led to an inevitable widening of the gap between the rich and the poor [47]. Residents with similar consumption power and class characteristics tend to gather in specific areas of cities. Therefore, it is necessary to investigate the distribution equity of PGS resources among different social and economic groups from the perspective of housing prices.
The layout of urban PGS has a significant impact on their availability and the quality of city residents’ lives [1,48]. Various scholars have proposed novel planning strategies based on different needs. For example, Yao et al. investigated the cooling effect of urban parks and identified the optimal scale to mitigate the urban heat island effect [49]. To improve the accessibility and quality of urban PGS, Wu et al. utilized a combination of landscape pattern index analysis and principal component analysis to assess the supply quality of PGS in the Third Ring Road region of Shenyang. Based on the accessibility analysis, they recommended suggestions for future planning of Shenyang’s green spaces [50]. Li et al. considered various factors such as physics, nature, environment, accessibility, and human activities and used F-AHP and GIS to identify the optimal location for urban park layout in Nanjing [51]. However, few scholars have focused on optimizing the location of urban PGS planning by jointly considering spatial accessibility and equity simultaneously. In the modern era, China’s approach to urbanization places a greater emphasis on accommodating the needs of its residents, necessitating a more comprehensive approach to public space planning that goes beyond mere spatial considerations and accounts for the unique emotional and spiritual demands of its residents [47]. Therefore, effective resource allocation is pivotal in enhancing the benefits of urban PGS resources by facilitating faster access to PGS and the provision of high-quality services. The particle swarm optimization (PSO) algorithm was proposed by Eberhart et al. in 1995 and has since been widely used to optimize the location of public facilities [52]. It offers the advantages of fast convergence, fewer input parameters, and accurate results. Therefore, this paper employed the PSO algorithm to address the issue of low accessibility and unequal distribution of regional PGS resources by determining the optimal locations of newly planned PGSs.
Located in East China, Hefei City is the capital of Anhui Province. As one of the first selected “National Garden Cities” in 1992, Hefei City has rich urban PGS resources and has become a model of successful exploration of urban PGS system planning and construction schemes in early China. In 2014, the city was awarded the title of “National Forest City”. At present, Hefei City has built a number of excellent PGS projects, such as Gu Xiaoyao Jin Park, Xinghua Park, and Luogang Park. The dominant species in the PGS tree layer were Trachycarpus fortunei, Cinnamomum camphora, Ligustrum lucidum, Osmanthusfragrans, etc. By 2020, its GDP had increased to CNY 1004.572 billion. With the rapid development of the economy, the area of the central city has also expanded rapidly. However, this rapid development has also led to the waste of public resources and the unequal distribution of public resources [53]. Thus, Hefei’s urban PGSs need to consider their accessibility and distribution equity more in near future planning. However, previous research on urban PGS in Hefei City mainly focused on analyzing its ecological benefits or landscape pattern changes [54,55]; Hefei City’s urban PGS planning was not adequately explored in the internal relationship between accessibility and equity [53]. Therefore, it is necessary to deeply analyze the accessibility and equity of Hefei City’s PGS and then make planning suggestions based on this analysis. The major aim of this work was to propose an integrated framework that considers accessibility and equity simultaneously to optimize the planning and layout of urban PGS within the high-speed ring road of Hefei City. Through a comprehensive analysis, the primary issues in the current layout of urban PGS and their causes were expected to be identified. Finally, this research is expected to serve as a reference for subsequent construction of ecological and livable city planning.

2. Materials and Methods
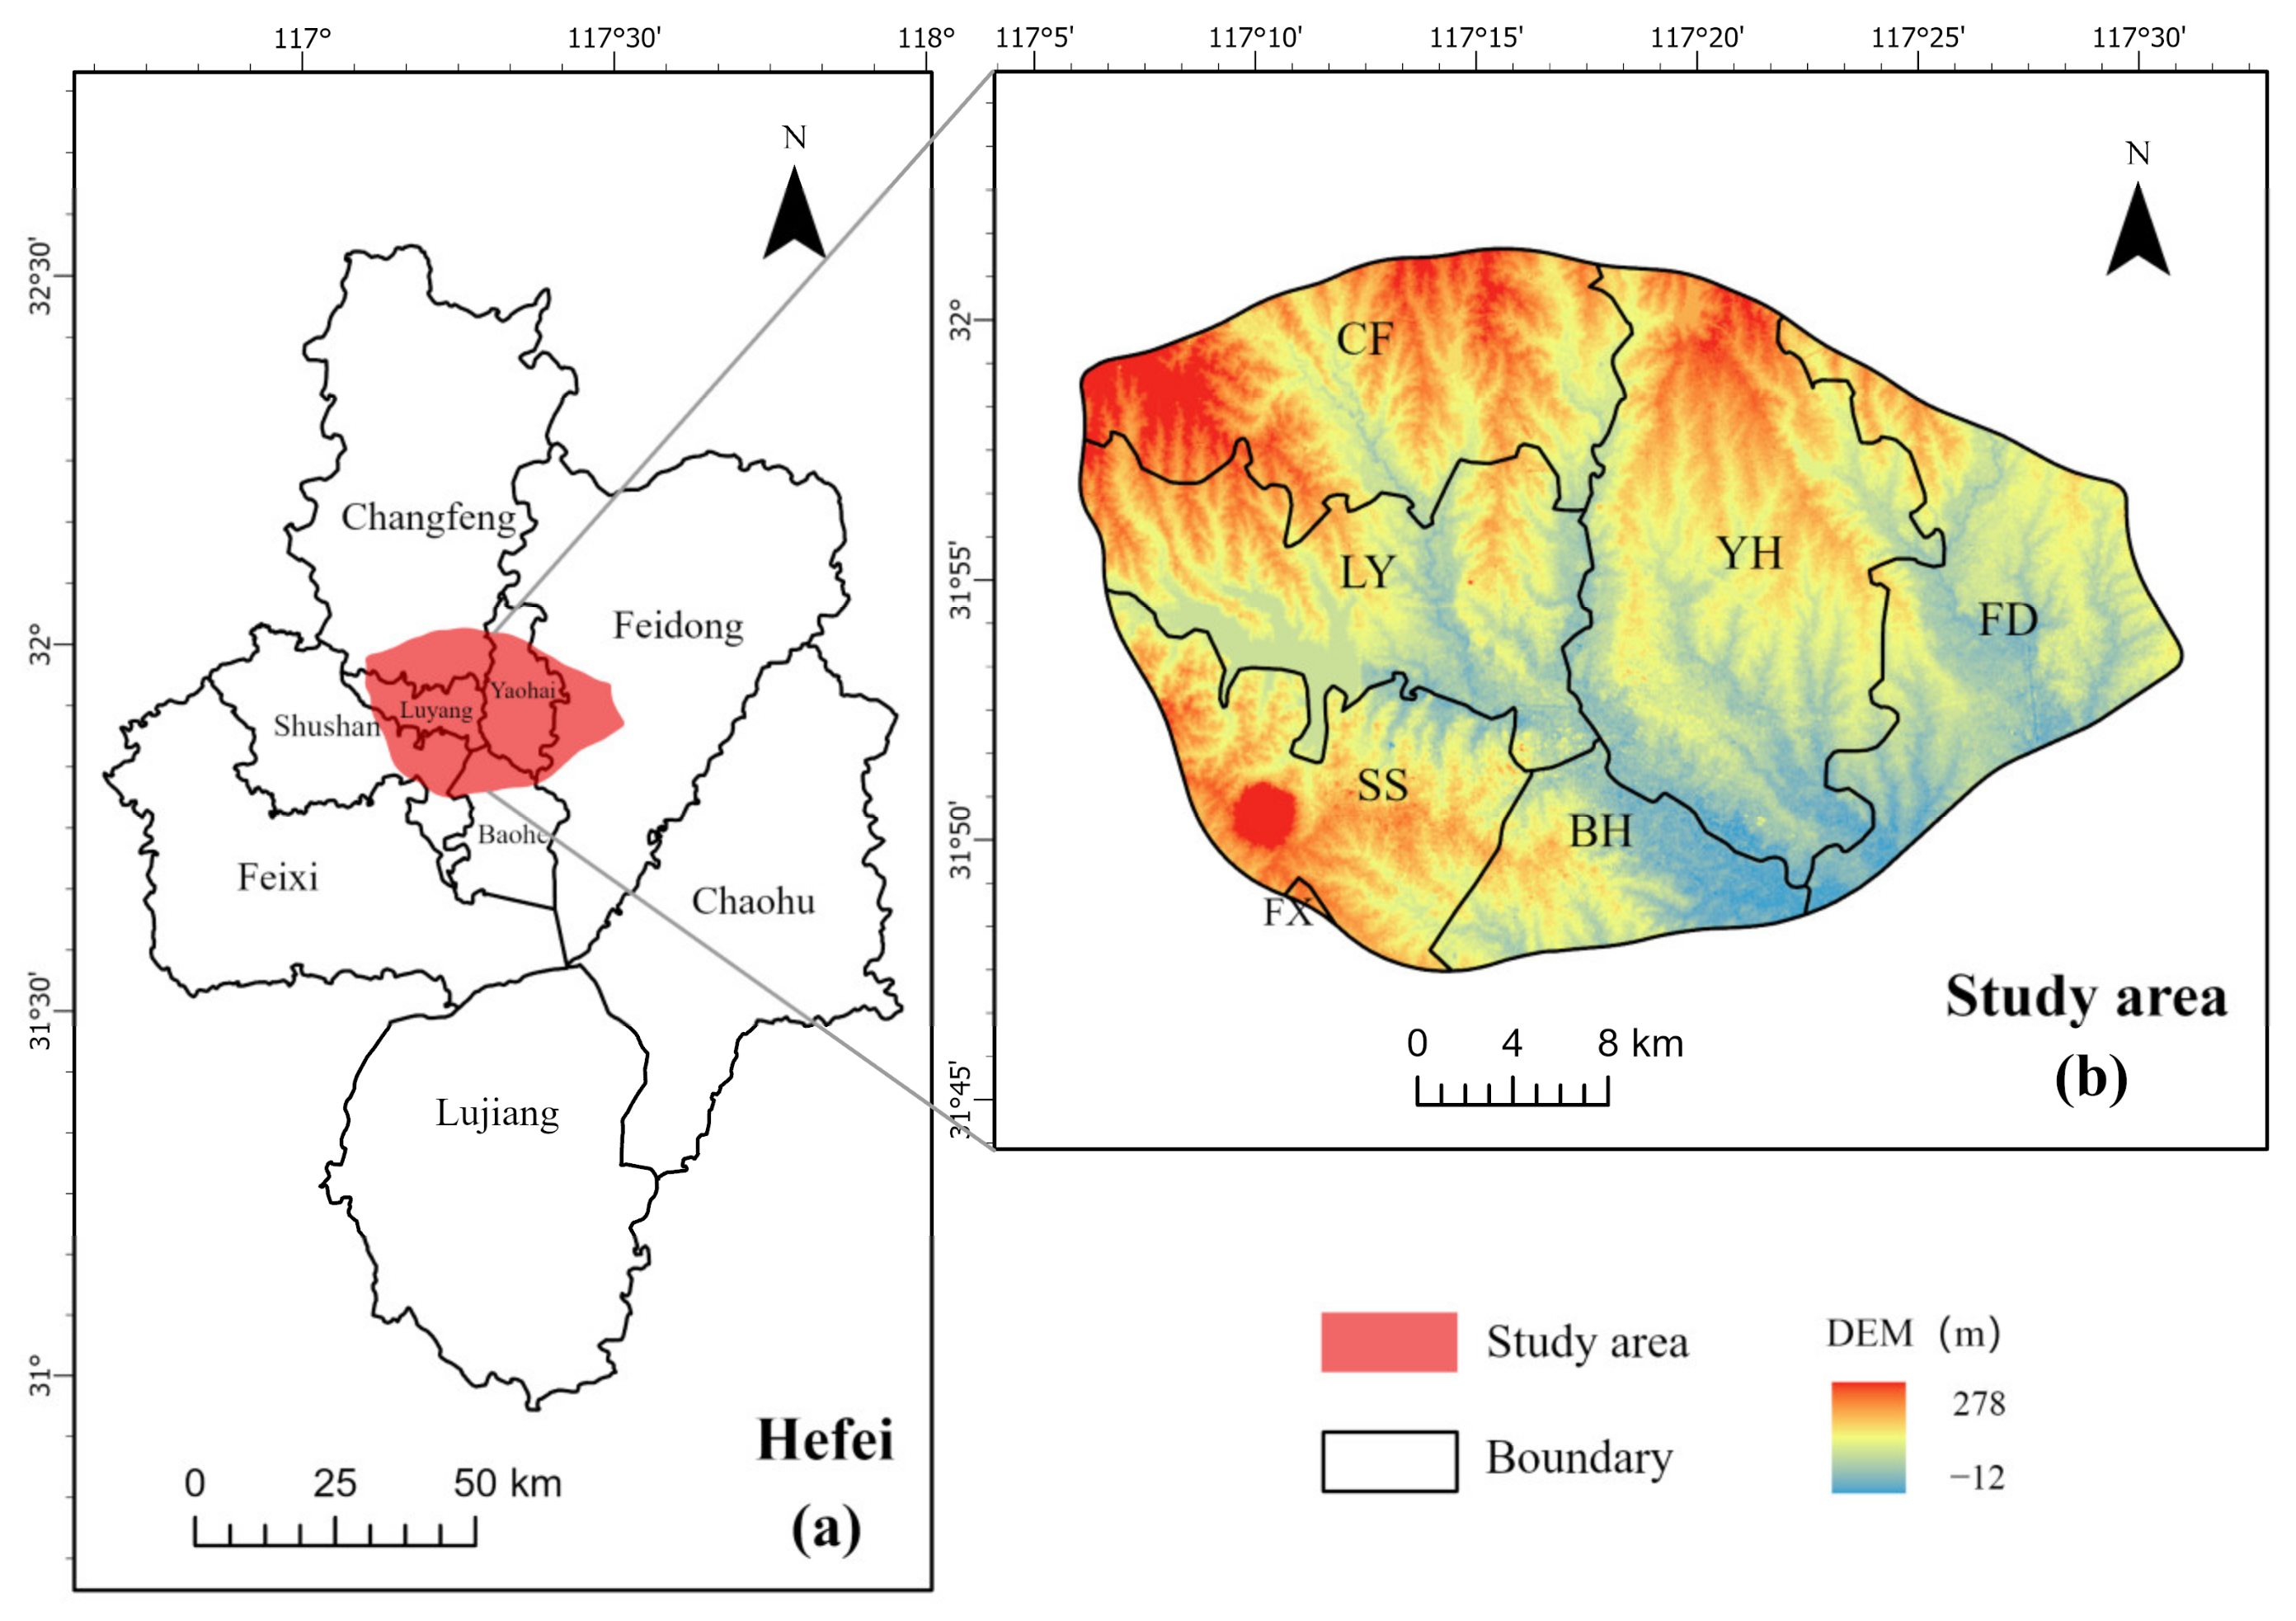
2.1. Study Area

Hefei City is located in the central part of Anhui Province, eastern China (116°41′ E–117°58′ E, 30°57′ N–32°32′ N). It is one of the first three national ecological garden cities. By the end of 2021, the PGS in Hefei City had a total area of 6680 hectares, with a per capita PGS area of 10.41 square meters. The greening coverage rate in the built-up areas was 44.18%. Although the construction and layout of Hefei’s PGS system have been adjusted according to its urban development direction and structure, there are still some problems such as structural imbalance and low public accessibility in existing urban PGS, and the PGS quality and layout also need to be improved. This study focused on the densely populated area within the ring road of Hefei City, which is mainly divided into 7 large areas, namely Shushan Area (SS), Baohe Area (BH), Yaohai Area (YH), Luyang Area (LY), Changfeng Area (CF), Feidong Area (FD), and Feixi Area (FX), with a total area at 71,260 hectares (Figure 1). The area of Feixi County within the ring road was too small to be studied here.

2.2. Data and Preprocessing

2.2.1. Urban PGS Data

This study employed the publicly available PGS data extracted from government websites as the basis dataset. Referring to Google Earth images, an artificial vectorization process was implemented to glean some small-scale PGS data supplementary to the official data. The division criteria stipulated in the GBT51346-2019 [56] Urban Green Space Planning Standard were adopted for the PGS classification in the current study. Considering the central urban green space planning map of “Hefei Green Space System Planning (2007–2020)” and the actual conditions of the study area, the PGSs were categorized into three types: Type I, municipal parks (over 10 hectares in size); Type II, residential-level parks (5 to 10 hectares); and Type III, residential neighborhood-level parks (0.2 to 5 hectares). The total number of PGSs of all three types was 185. Figure 2 shows the spatial distribution of the three types of PGSs in the study area.

2.2.2. Demographic and Economic Data

The accuracy of demographic data has a direct impact on the reliability of accessibility research outcomes [50]. Considering human needs as the core of accessibility computation and acknowledging the diverse shapes of most subdistricts, a population-weighted centroid could more reasonably represent the demands of urban residents for PGS. In this study, a total of 60 residential subdistricts were selected for the analysis. Initially, a Python web crawler code was employed to scrape the point of interest (POI) data of all compounds in the study area from the used housing trading platform at the end of 2020, encompassing compound names, addresses, latitude and longitude coordinates, the total number of buildings, households, and house prices. After filtering, deduplicating, and other data cleaning processes, 3380 “residential compound” data points were tallied. Following preprocessing steps such as spatial correction and matching, a total of 2372 residential compound points were retained. The population of each compound was derived by multiplying the total number of households by the average number of residents per household, and then the overall subdistrict population was summarized. The demographic statistics were cross-validated by using the permanent population data of Hefei subdistricts recorded in the “Anhui Statistical Yearbook 2021”, and the calculated population was essentially consistent with the actual population.

2.2.3. Road Network Data

In the present study, the current road traffic network data for the city were derived from Open Street Map (2021) and corrected using Google Maps. Subsequently, ArcGIS 10.7 was employed to process the road network data. The topological processing of the road network data was conducted by interrupting all roads according to road intersections. Concurrently, the road traffic status map within the central urban area of the Hefei City Master Plan (2011–2020) was utilized to differentiate various road types. Finally, the deficient road traffic network information was repaired based on the visual interpretation of the 2021 remote sensing image, resulting in the formation of a complete road traffic network diagram in this study. Aiming at the urban PGS, the accessibility of three transportation modes, namely walking, cycling, and motorcycling, was analyzed. When calculating the minimum passing cost (time) between the supply and the demand points, referring to the Urban Road Design Code of the Ministry of Construction (CJJ37-90), the motor vehicle passing speed of the express road, the main road, the secondary road, and the branch road were set to 80, 60, 40 and 20 km/h respectively. At the same time, considering the influence of various terrain factors, the walking speed was determined to be 1 m/s [57]. In an urban street environment, the average cyclist was set at 12 km/h, and the waiting time at a traffic light was set at 30 s.

2.2.4. Accessibility Time Threshold

Empirical research indicates that the time cost of urban residents walking to parks for recreational purposes is more sensitive than the distance cost [58]. Consequently, the use of a time threshold, compared to the conventional distance threshold, provides a more accurate reflection of the accessibility services offered by PGS from the perspective of urban residents. The European Environment Agency has recommended that the distance between residential areas and nearby park green facilities should be within a 15 min walk, and the New York 2030 Master Plan also establishes corresponding urban green space construction objectives, seeking to ensure that all New Yorkers are within a 10 min walk from a park. This study referred to the Urban Residential Area Planning and Design Standard (GB50180-2018 [59]) to establish the time threshold of PGS accessibility for various types of parks. Specifically, the time threshold was set to 30 min for municipal parks, 20 min for residential-level parks, and 10 min for residential neighborhood-level parks.

2.3. The Improved 2SFCA Method

Based on the 2SFCA method improved by Liu [60], this work introduced the hierarchical service thresholds and the PGS attraction index and comprehensively considered the competition between the service capability of various types of PGSs to make the improved accessibility calculation results more suitable to the actual situation. The specific steps were as follows:
First, the kernel density distance attenuation function was introduced to extend the 2-step floating catchment area (2SFCA) method. This function employs a concave density function, where the accessibility changes with distance, exhibiting a faster attenuation rate as the distance increases. The accessibility calculation in the model takes into account the optimal utilization of PGS resources and provides an accurate depiction of how the accessibility of such spaces varies with distance, thereby enhancing the reliability of the results. Therefore, this analysis employed the kernel density distance attenuation function to extend 2SFCA [61]. The used kernel density distance attenuation function was as follows:
g t ij = 3 4 1 t ij t 0 2 , t ij < t 0
where t ij represents the travel time between the residential subdistrict point i and the park area point j ; t 0 represents the time threshold of PGS accessibility of the corresponding type of park.
Second, through comprehensively considering factors such as competition between different types of PGSs and PGS service capacity, this study adopted the kernel density function to calculate the weight LG ij , which represents the selection probability of each demand point to the supply point. The weight formula LG ij was defined as follows:
LG ij = S j × g t ij × C j m t im t 0 S m × g t im
where S j represents the service capability of PGS, expressed by the PGS area; C j is the attraction index of PGS, expressed by its grade. The greater the value, the greater the attraction ability. S m represents the PGS area in the search area with the supply point as the center of the circle and t 0 as the search radius. t im represents the travel time between the residential area point i and the park area point m .

2.4. Calculation and Mapping of Urban PGS Accessibility

In the first step, the centroid of a small park (such as a residential neighborhood-level park) was extracted, and the entrance of a large park (such as a municipal park or a residential-level park) was extracted as the PGS supply point j . The search domain of park j was established with the radius t 0 of the road network limit time threshold of the corresponding travel mode of residents to the park, and all the population within the search domain of park j under this travel mode was summarized and weighted by the distance attenuation rule of the kernel density function, and the weight LG ij was considered to calculate the service supply and demand ratio R j of park j :
R j = S j × C j K t kj t 0 LG kj × g ( t kj ) × D k
where D k is the population of kth residential subdistrict in the space search domain of the park green space ( t kj t 0 ).
In the second step, taking the population centroid i of the residential subdistrict as the demand point and t 0 as the search area, all the corresponding types of parks j in the search area were found, and the supply–demand ratio R j of these parks was summarized and summed based on the kernel density attenuation function considering the weight, so as to obtain the spatial accessibility of the specific type of park green space at the demand point i in a single travel mode. The formula for the accessibility of specific types of parks and green spaces under a single mode of travel was as follows:
A i N = j t i j t 0 LG ij × g t ij S j × g t ij × C j K t kj t 0 LG kj × g ( t kj ) × D k
Finally, the comprehensive spatial accessibility of a specific type of PGS was obtained by summing up the accessibility values of different travel modes. The geometric interval method was used to divide the calculated accessibility results into five accessibility levels: worst, poor, average, good, and best [60].
The comprehensive accessibility value of PGS in each subdistrict was calculated by overlaying or accumulating the accessibility results of the three types of PGSs. Using the Jenks Natural Breaks method [62,63], the study area was classified for PGS accessibility in each subdistrict.

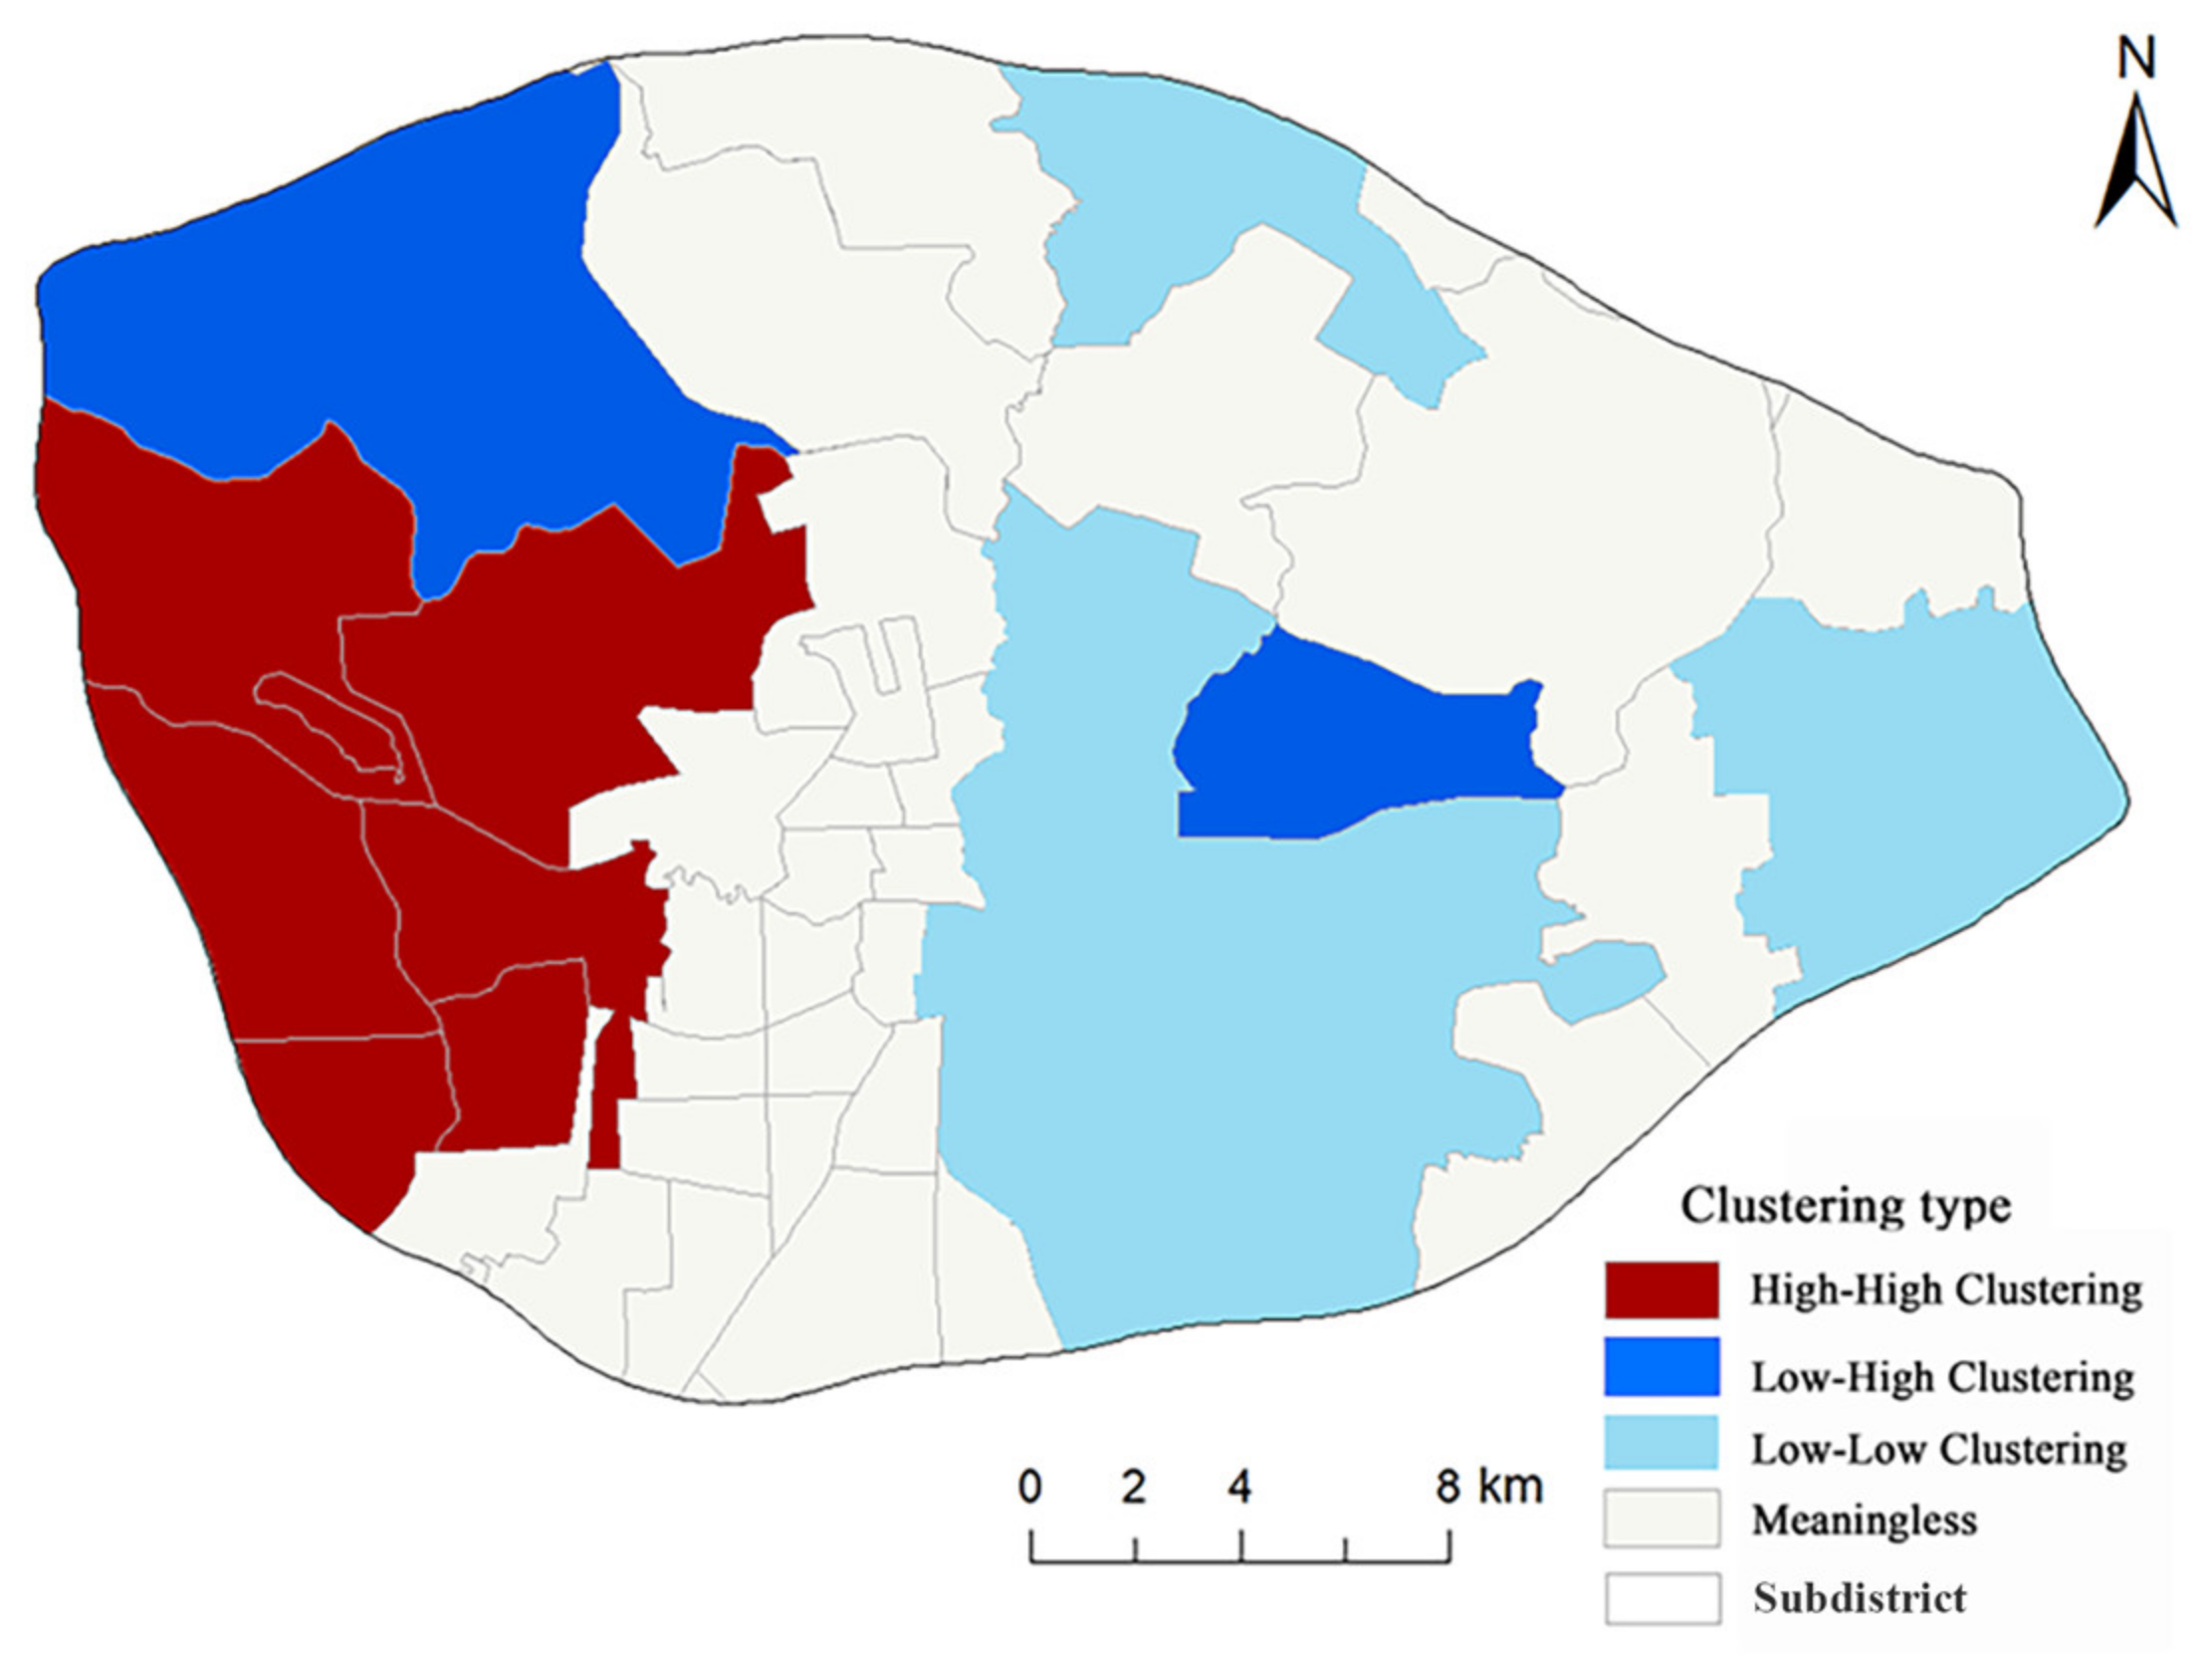
2.5. Spatial Autocorrelation Analysis of Accessibility

The Moran’s I index was employed in this study to quantify the spatial autocorrelation degree or clustering level of different types of PGS accessibility at the subdistrict scale within the ring road of Hefei City. The global Moran’s I index quantifies the overall level of spatial autocorrelation, while the local Moran’s I index measures the strength of correlation between a single variable and its neighboring regions [64,65].

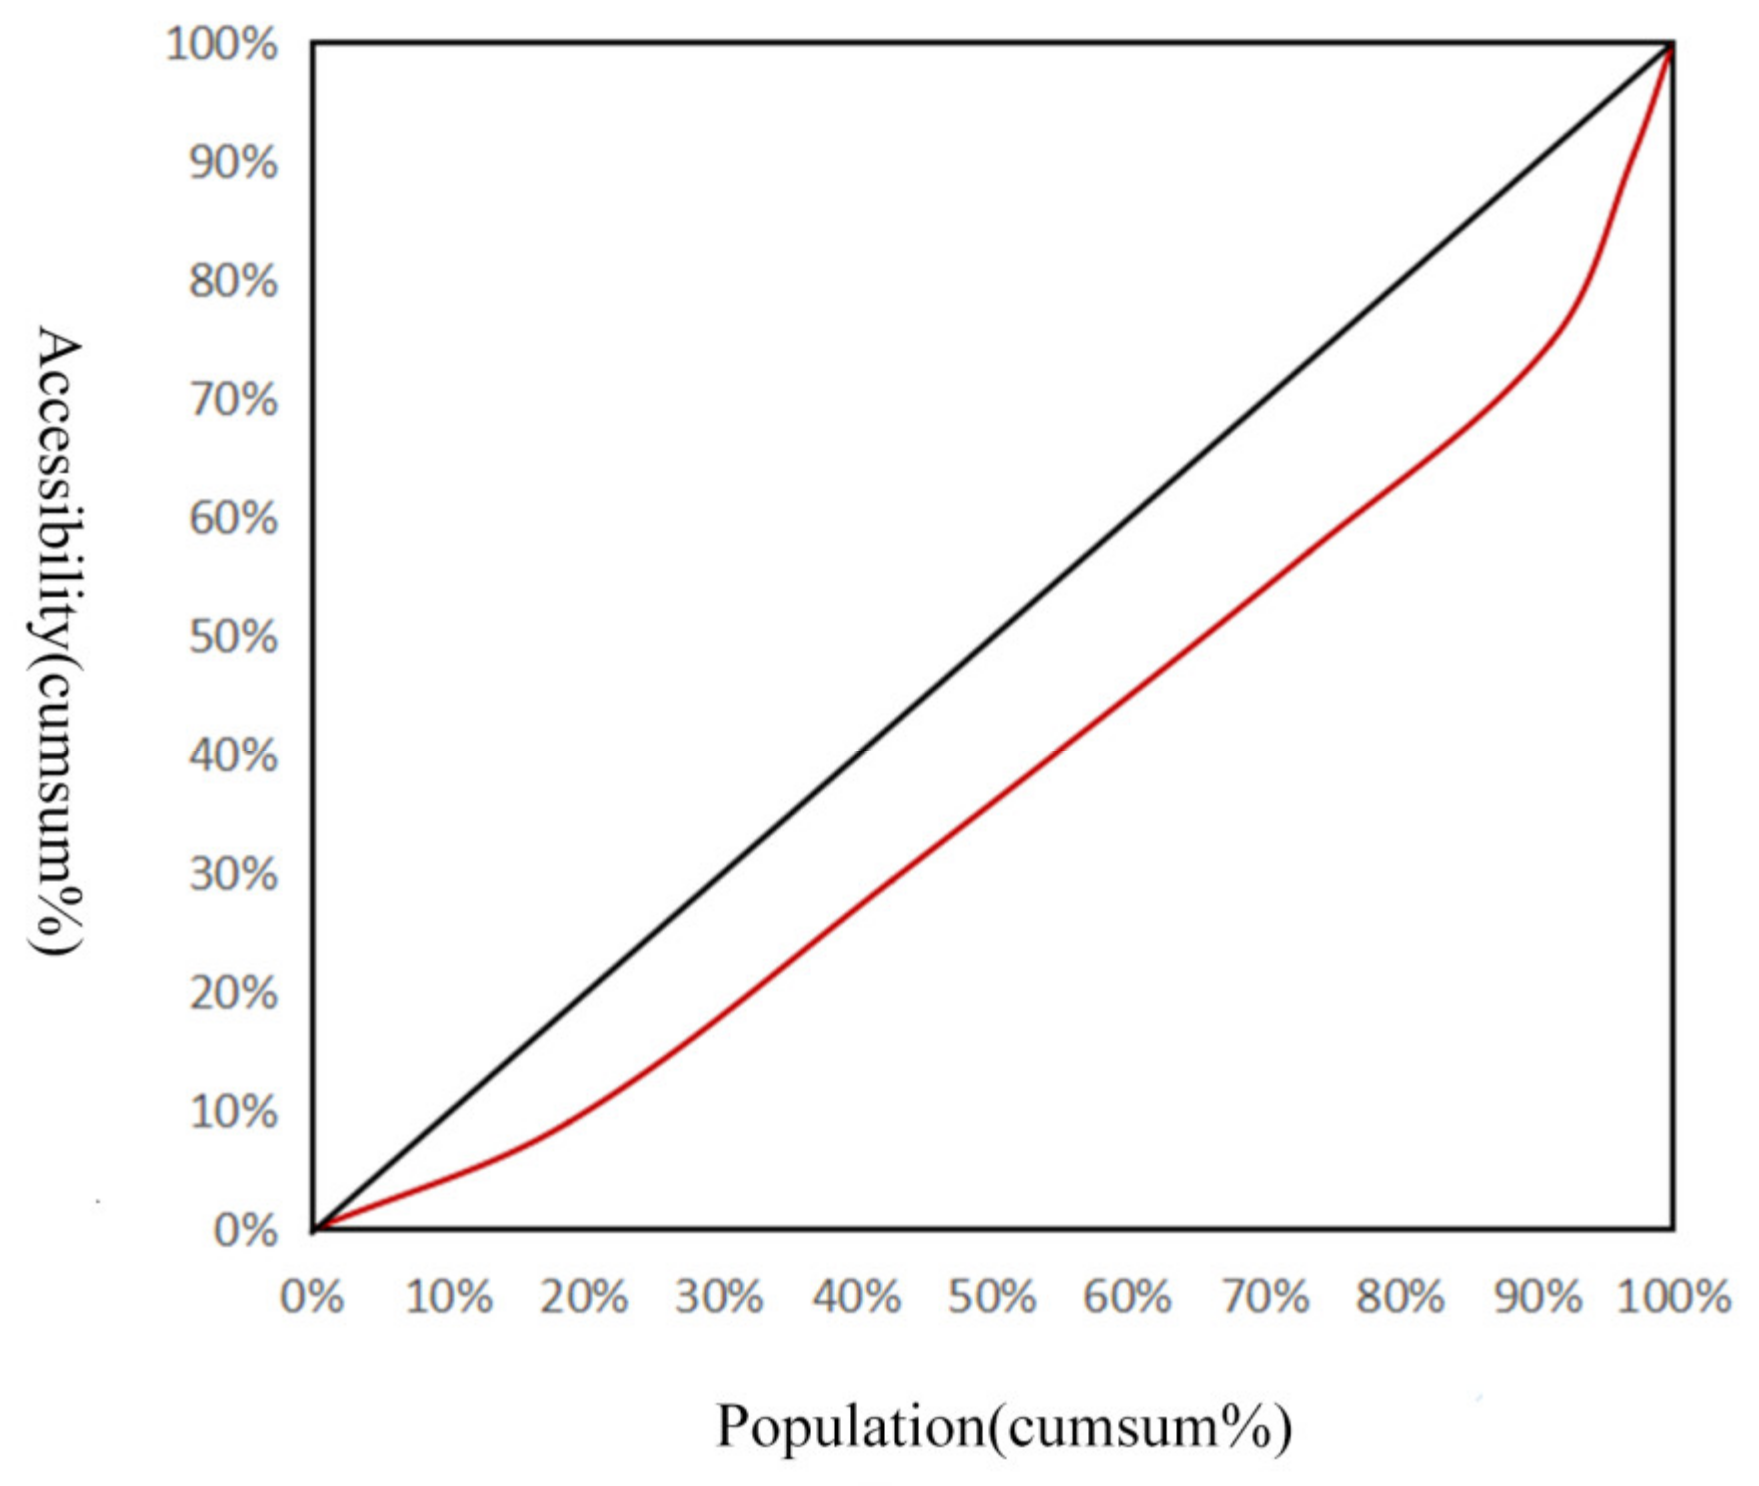
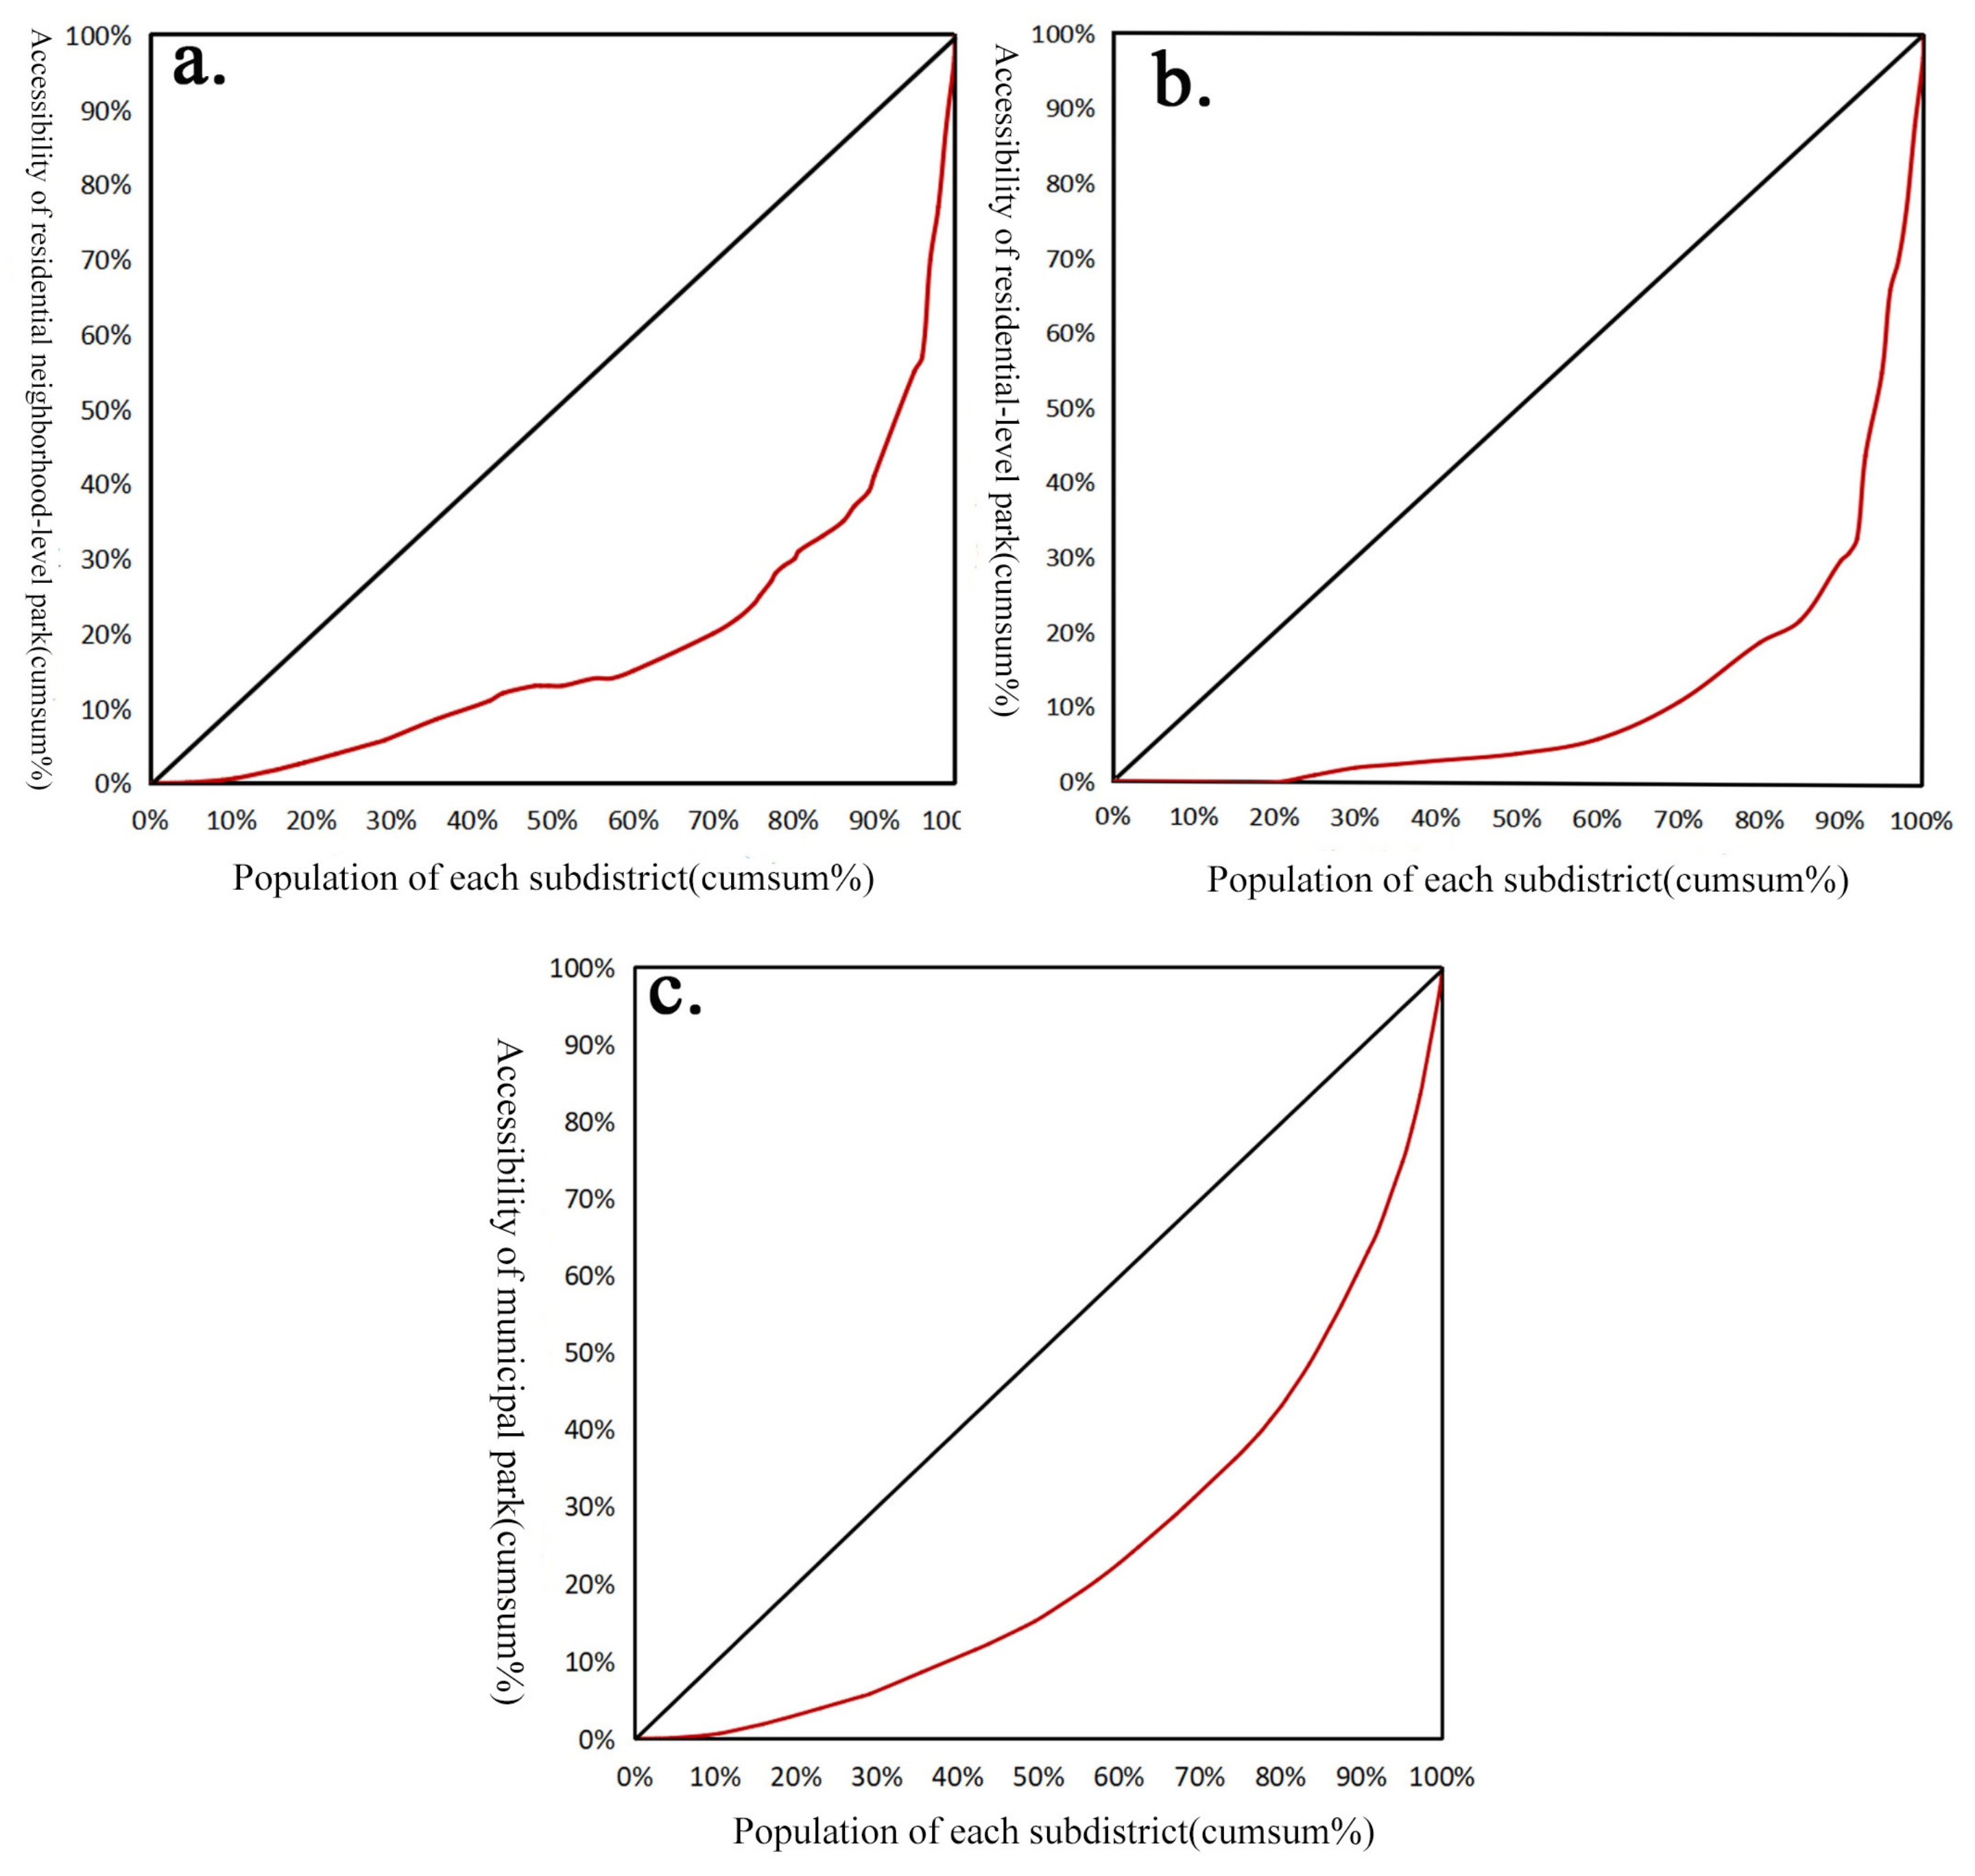
2.6. Lorentz Curve and Gini Coefficient

The Lorentz curve and Gini coefficient are frequently utilized to analyze social resource equity [43,66,67]. In this study, we defined the Lorentz curve as the functional relationship between the cumulative proportion of the residential population and the percentage of PGS resources owned by the corresponding population. The formula for calculating the Gini coefficient was as follows:
G = 1 i = 1 n X i X i 1 Y i + Y i 1
where G is the Gini coefficient; X i is the cumulative proportion of the population, X 0 = 0, X n = 1; Y i is the cumulative proportion of the accessibility score, Y 0 = 0, Y n = 1; and n is the total number of districts or subdistricts.
The Gini coefficient ranges between 0 and 1. According to internationally accepted standards, a Gini coefficient below 0.2 indicates an absolute average, while a Gini value between 0.2 and 0.3 suggests an average level of comparison. A coefficient of 0.3 to 0.4 is considered reasonable, while a range of 0.4 to 0.5 indicates a large gap between the rich and the poor. If the Gini coefficient exceeds 0.5, it signals a wide gap and reflects high inequity [66].

2.7. Bivariate Correlation Analysis

In order to investigate the equity in the distribution of PGS accessibility among diverse social groups, built upon existing equity research [68], this study employed the SPSS correlation analysis tool and utilized the Kendall correlation coefficient and Spearman correlation coefficient to examine the association between PGS accessibility and urban housing prices at the residential compound level.

2.8. Determining the Number of New PGSs Based on k-Means Clustering Algorithm

Given the scarcity of urban land and the need to maximize the benefits of resource use, we used the k-means clustering algorithm and the elbow rule to determine the optimal number of newly planned PGSs [53]. The basic concept behind k-means is to randomly initialize cluster centers, segment the data based on these centers by considering the minimum distance or maximum similarity, and then iteratively recalculate each center until inter-cluster differences are maximized while intra-cluster differences are minimized [69]. The elbow rule has been used to evaluate the results of K-means clustering and determine the ideal number of clusters. The accessibility values for various types of PGSs were combined to determine the overall accessibility of the PGS. Then, the grid points with the worst and bad accessibility grades were extracted, and their projection coordinates were extracted as the XY coordinates of each point. These algorithmic steps were executed using Python programming.

2.9. Particle Swarm Optimization Algorithm

In this study, the particle swarm optimization (PSO) algorithm was employed to identify the optimal site for a newly planned urban PGS. PSO, also known as the bird swarm foraging algorithm, was initially proposed by Eberhart and Kennedy in 1995 and has gained extensive applications in facility location optimization [70,71]. The fundamental concept of PSO is derived from the investigation of bird flock foraging behavior. When a group of birds search for food in a forest, each bird relies on its own sensing abilities and flies in the direction it deems most promising, as the location of the food is initially unknown. Throughout the search process, each bird constantly shares the coordinates of the highest food concentration with its peers, enabling other birds to compare their search data and adjust their search directions. Over time, the entire flock ultimately locates the maximum food source in the forest.
Based on identifying the optimal number of location points for PGSs in the target area, the PSO algorithm was employed to address the problem of placing new PGSs and attaining visualization. Before utilizing the PSO algorithm, it was imperative to establish the objective function for the multi-objective optimization problem. For this paper, the objective function was articulated as the aggregate distance between the bad and worst grid points of PGSs and all particles existing within the particle swarm. This permitted the conversion of the issue at hand to a question regarding the attainment of the minimum of this objective function. The main implementation steps of the PSO algorithm were as follows:
In the initial step, we must determine the size of the particle swarm N and simultaneously initialize the speed and position of all individuals (particles). We set an individual’s historical optimal position Pbest to its current position and designated the best individual in the group as Pbest . Subsequently, we established a maximum number of iterations and calculated the fitness of each particle.
In the second step, the i th particle was iterated k + 1 times using the following formula to update the particle’s velocity and position, while verifying the obtained particle position to ensure that it falls within the explored region.
v i d k + 1 = v i d k + c 1 r 1 Pbest i d k x i d k + c 2 r 2 Gbest i d k x i d k
x i d k + 1 = x i d k + v i d k + 1
where v i d k + 1 is the velocity of the i t h particle in the d dimension in the k + 1 iteration; v i d k is the velocity of the i t h particle in the d dimension in the k iteration; c 1 and c 2 represent learning factors, and generally, c 1 = c 2 = 2; r 1 and r 2 are random numbers in the range [0, 1]; Pbest i d k is the individual optimal solution when the i th particle is in d dimension at the k th iteration; Gbest i d k is the global optimal solution of the i th particle in d dimension at the k th iteration; x i d k + 1 and x i d k are the positions of the i th particle in d dimension at k + 1 and k iterations, respectively.
In the third step, it was ensured that the algorithm terminated upon reaching the maximum number of iterations. Additionally, the reduction in the optimization objective function value was constrained to be less than 10−25, which also served as a termination criterion for the algorithm. If the termination condition was not met, the algorithm proceeded to perform step 2 and continued iterating until it satisfied the termination condition. Ultimately, this PSO algorithm enabled the determination of the precise location for constructing a PGS.
The PSO algorithm was implemented using the PSO toolbox integrated in MATLAB R2021a software, in which new planned PGSs were introduced as particles. Subsequently, PSO could acquire the location diagram for the desired site selection points.

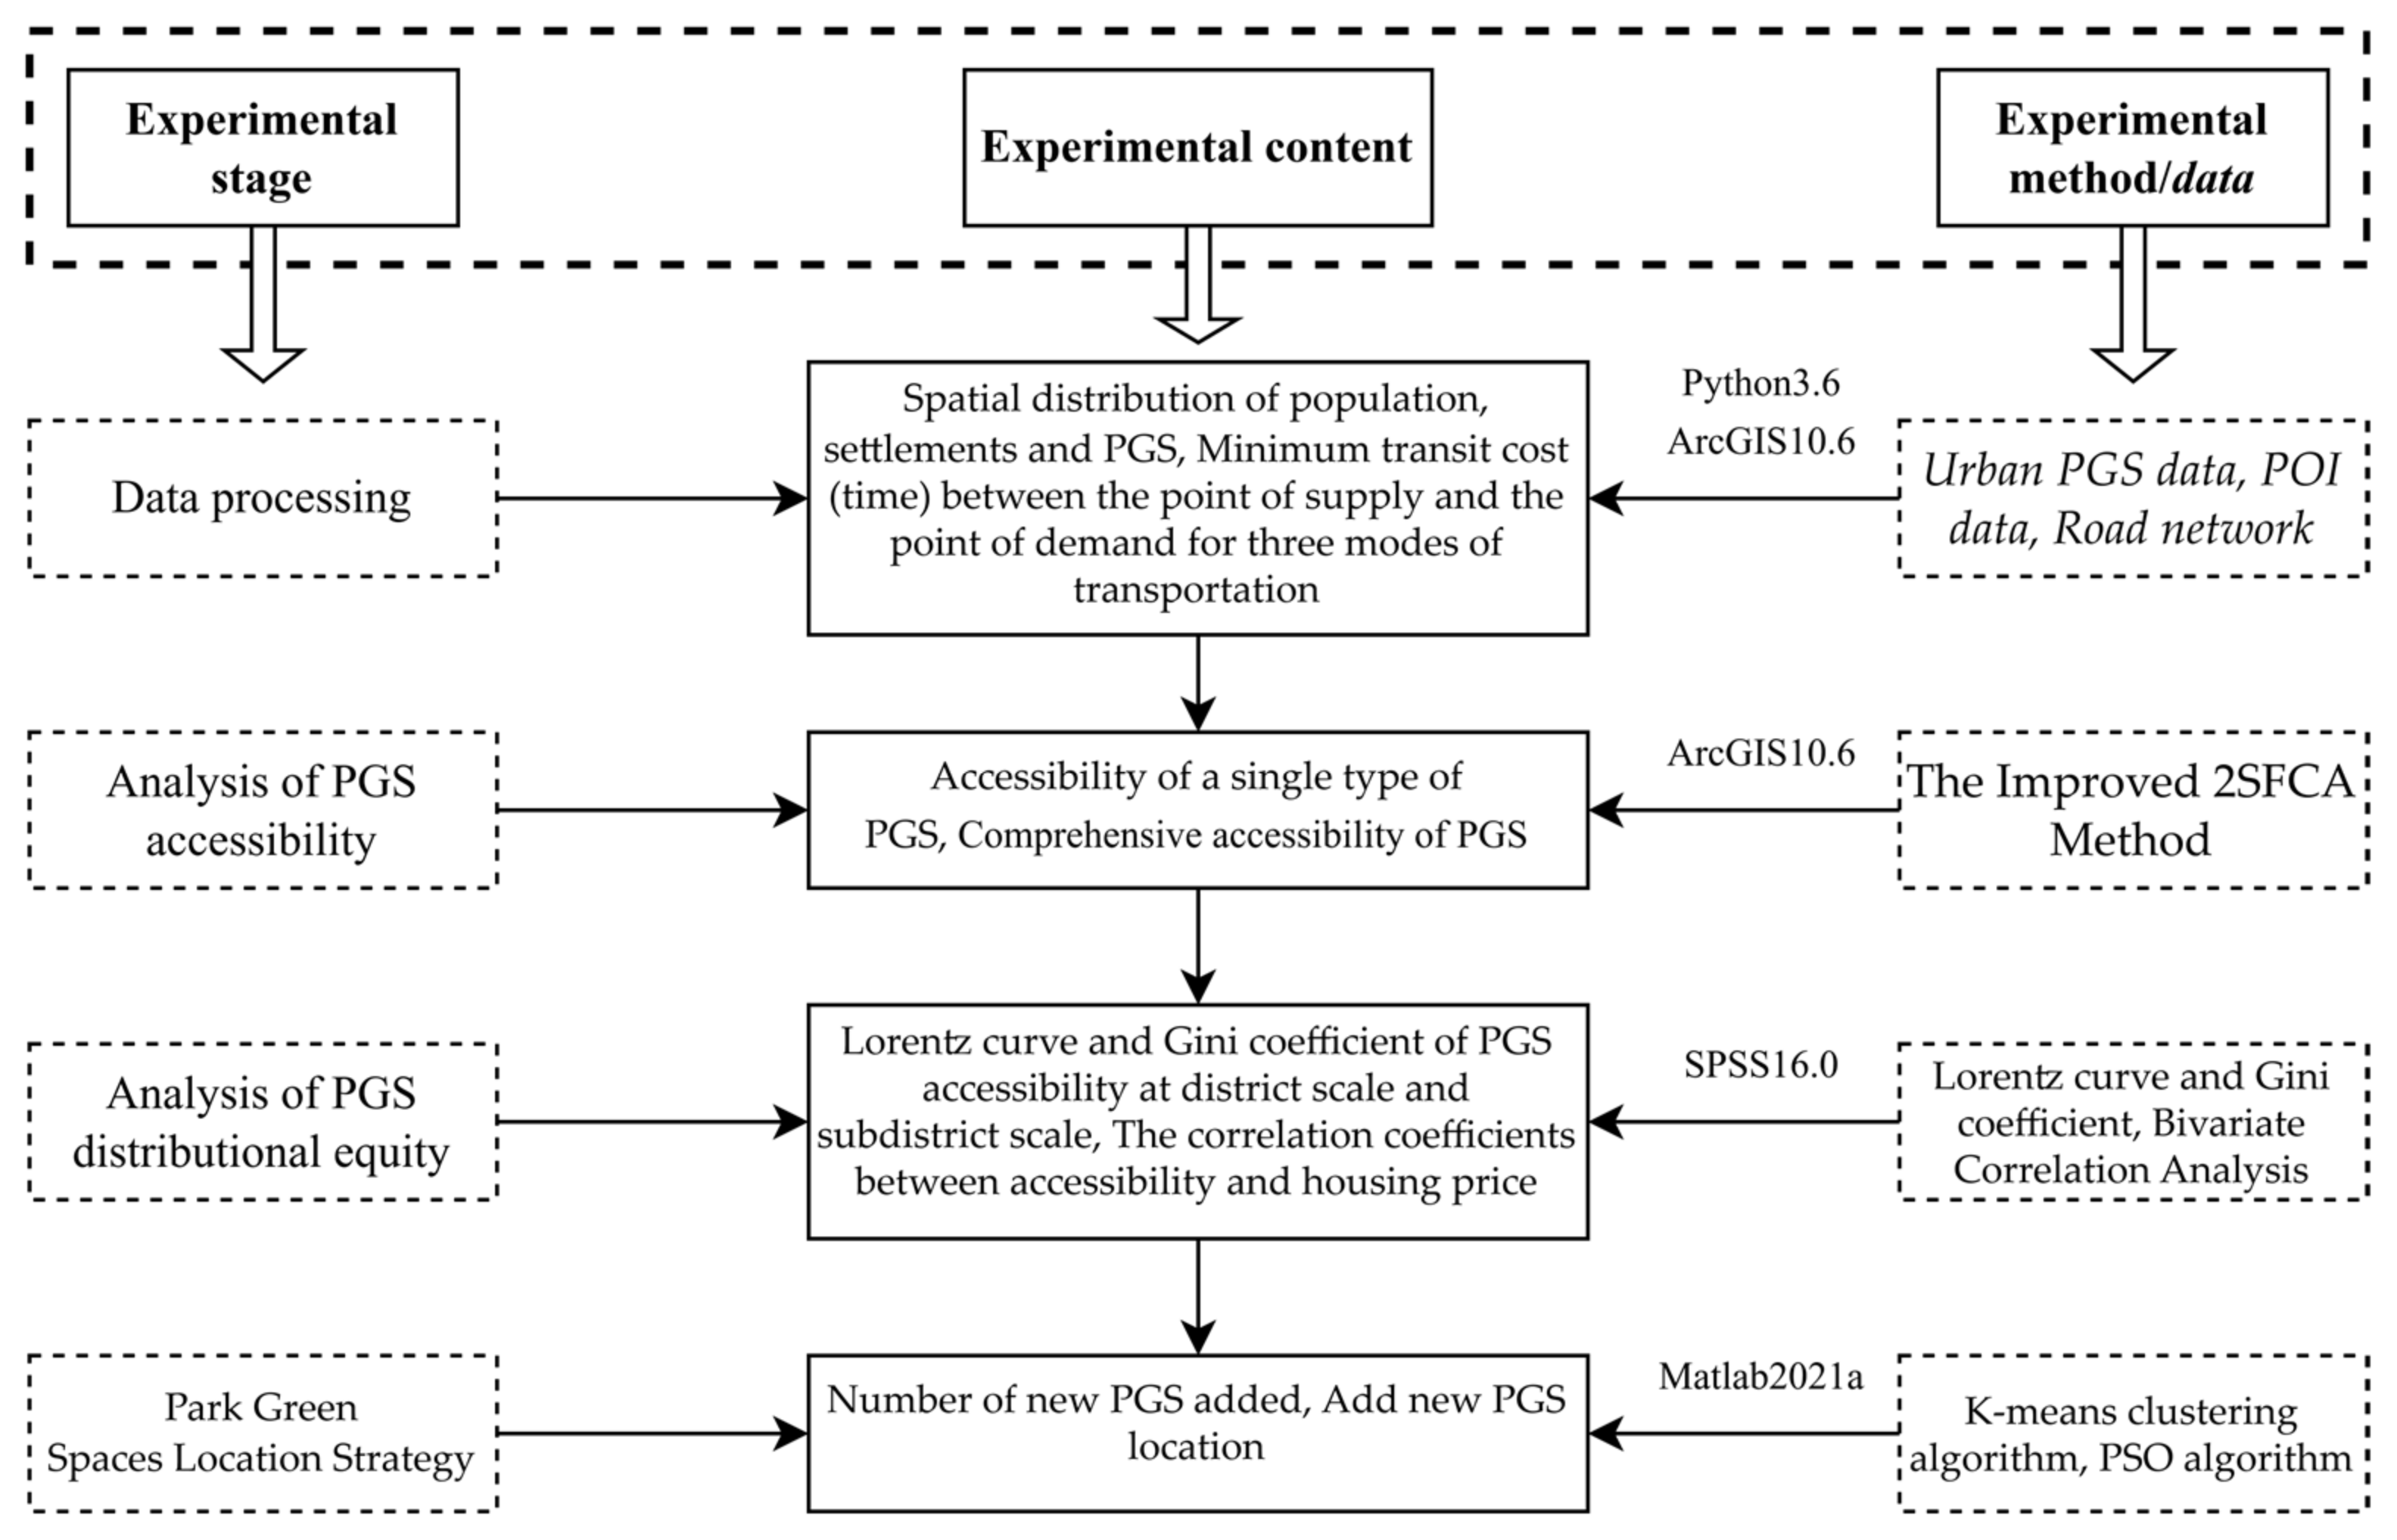
2.10. Framework of the Analysis

Figure 3 shows the detailed workflow of the current analysis.

3. Results

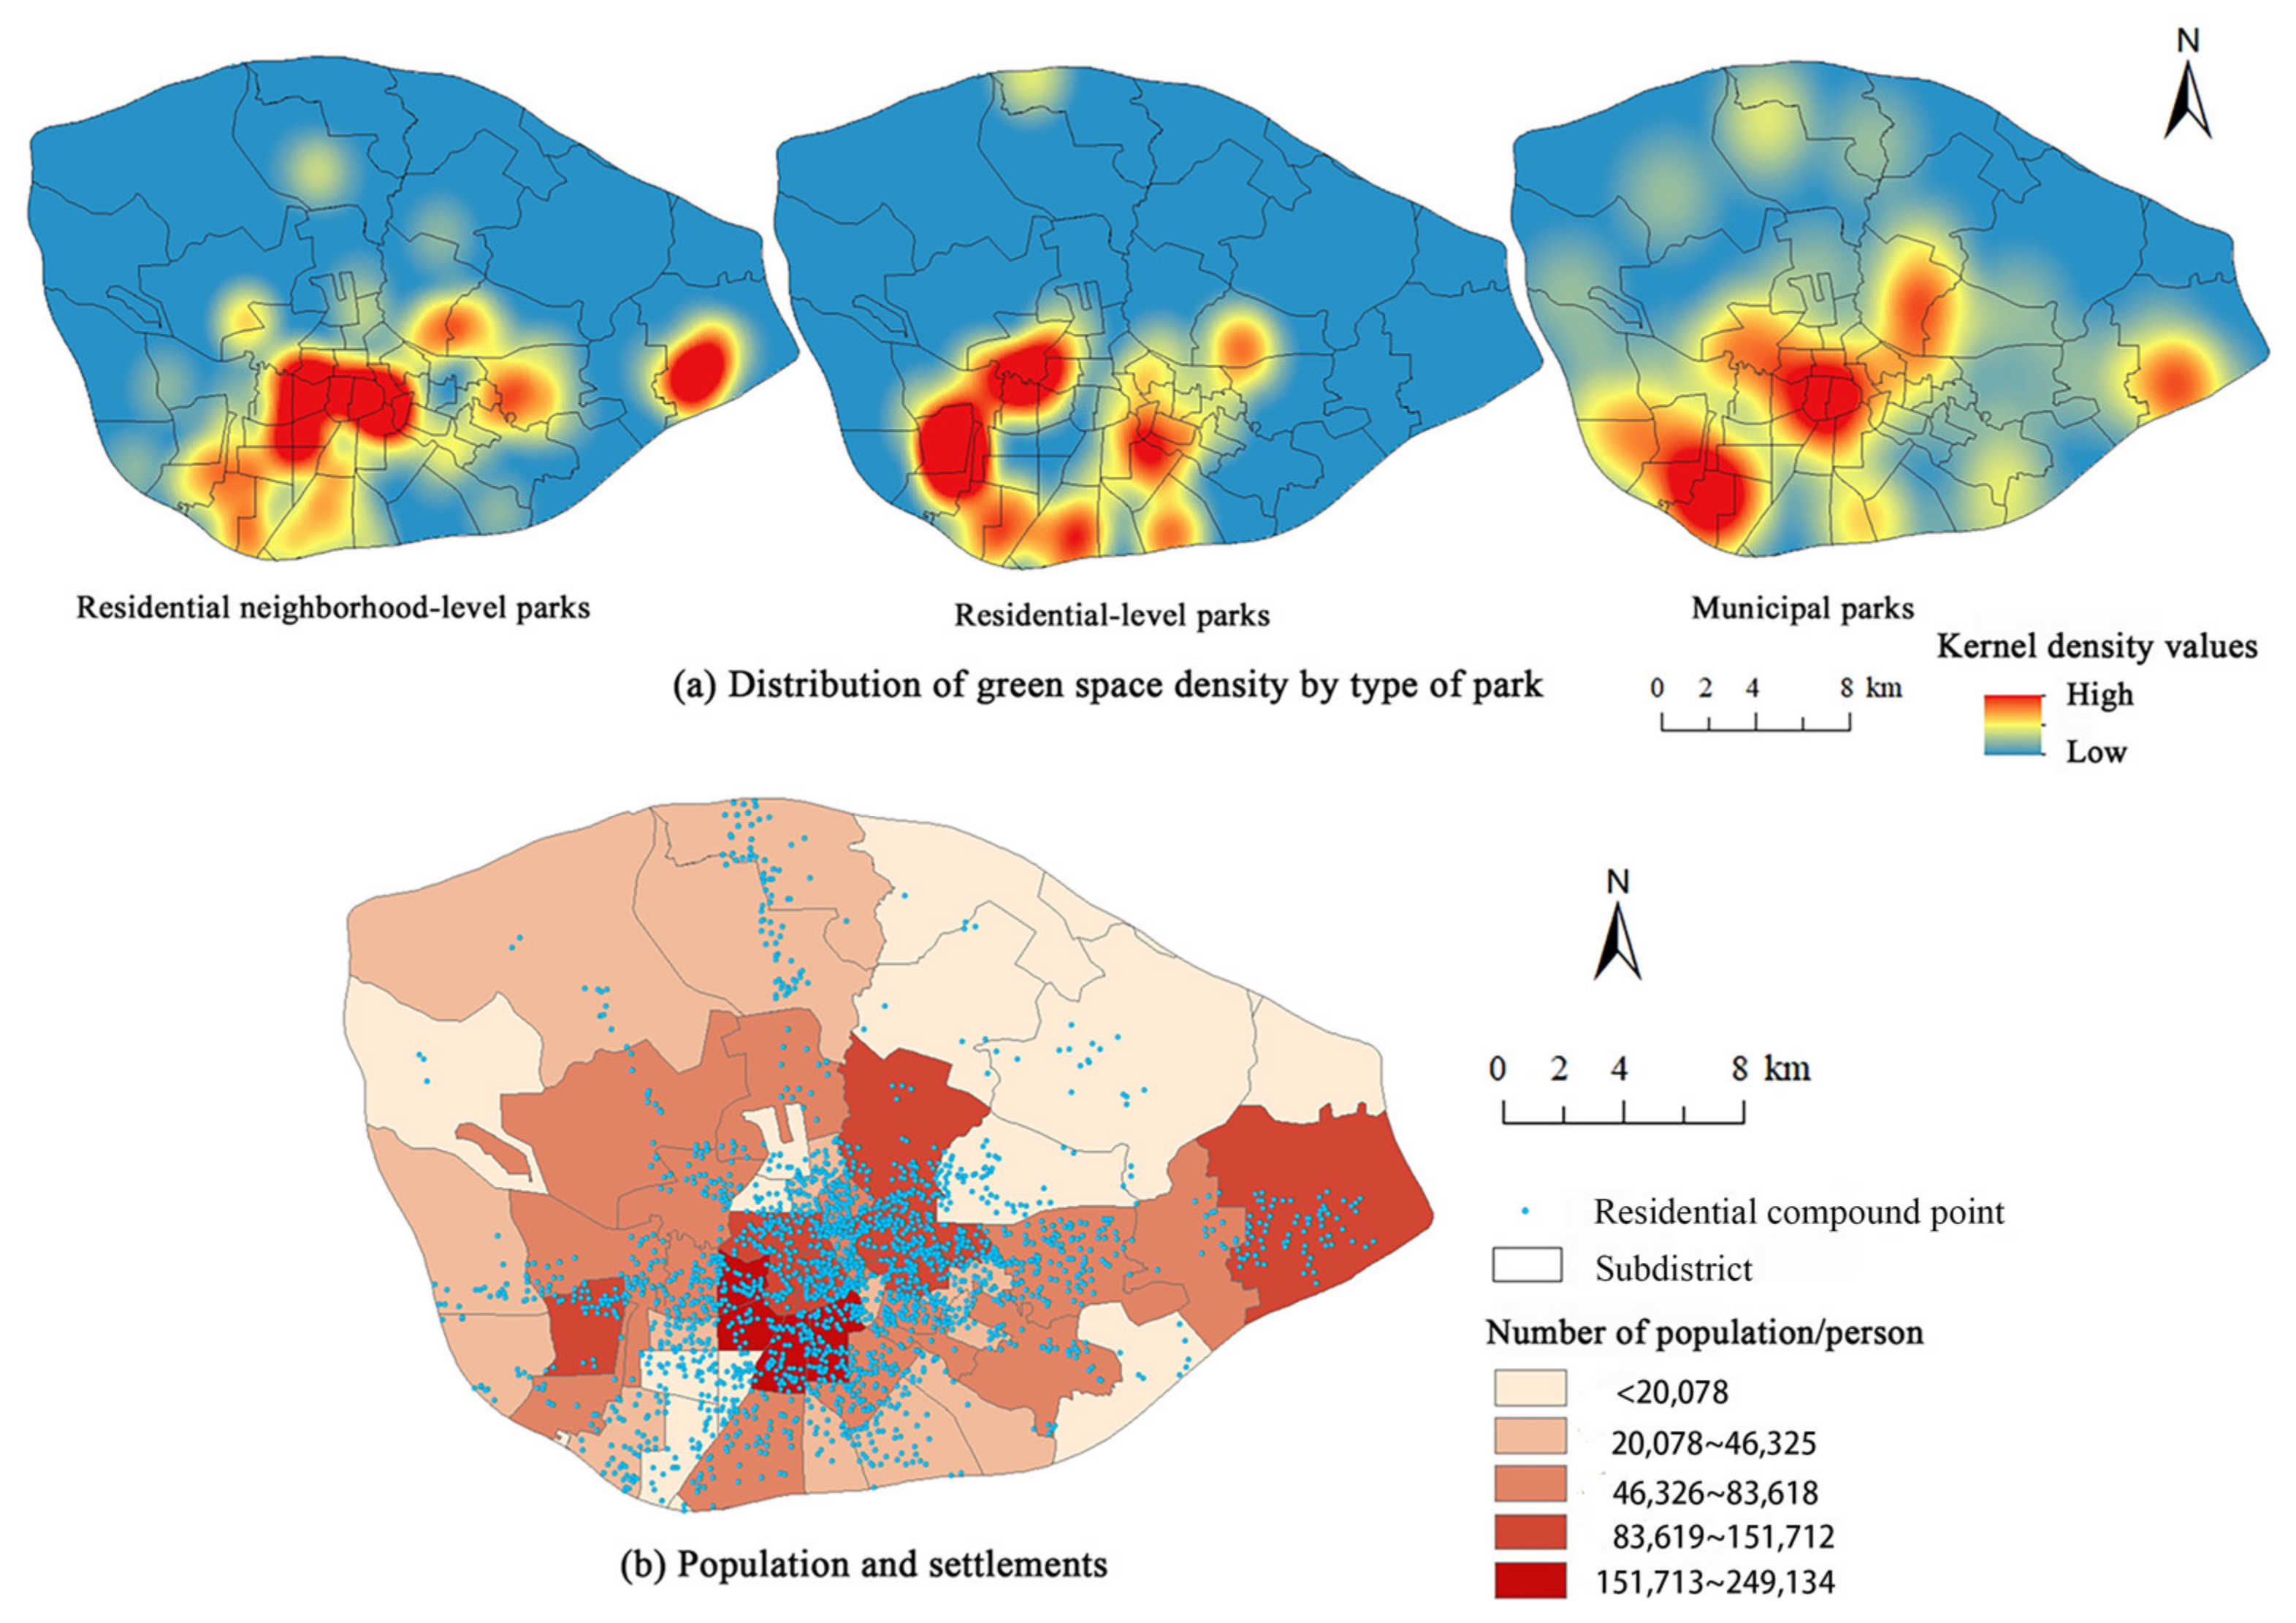
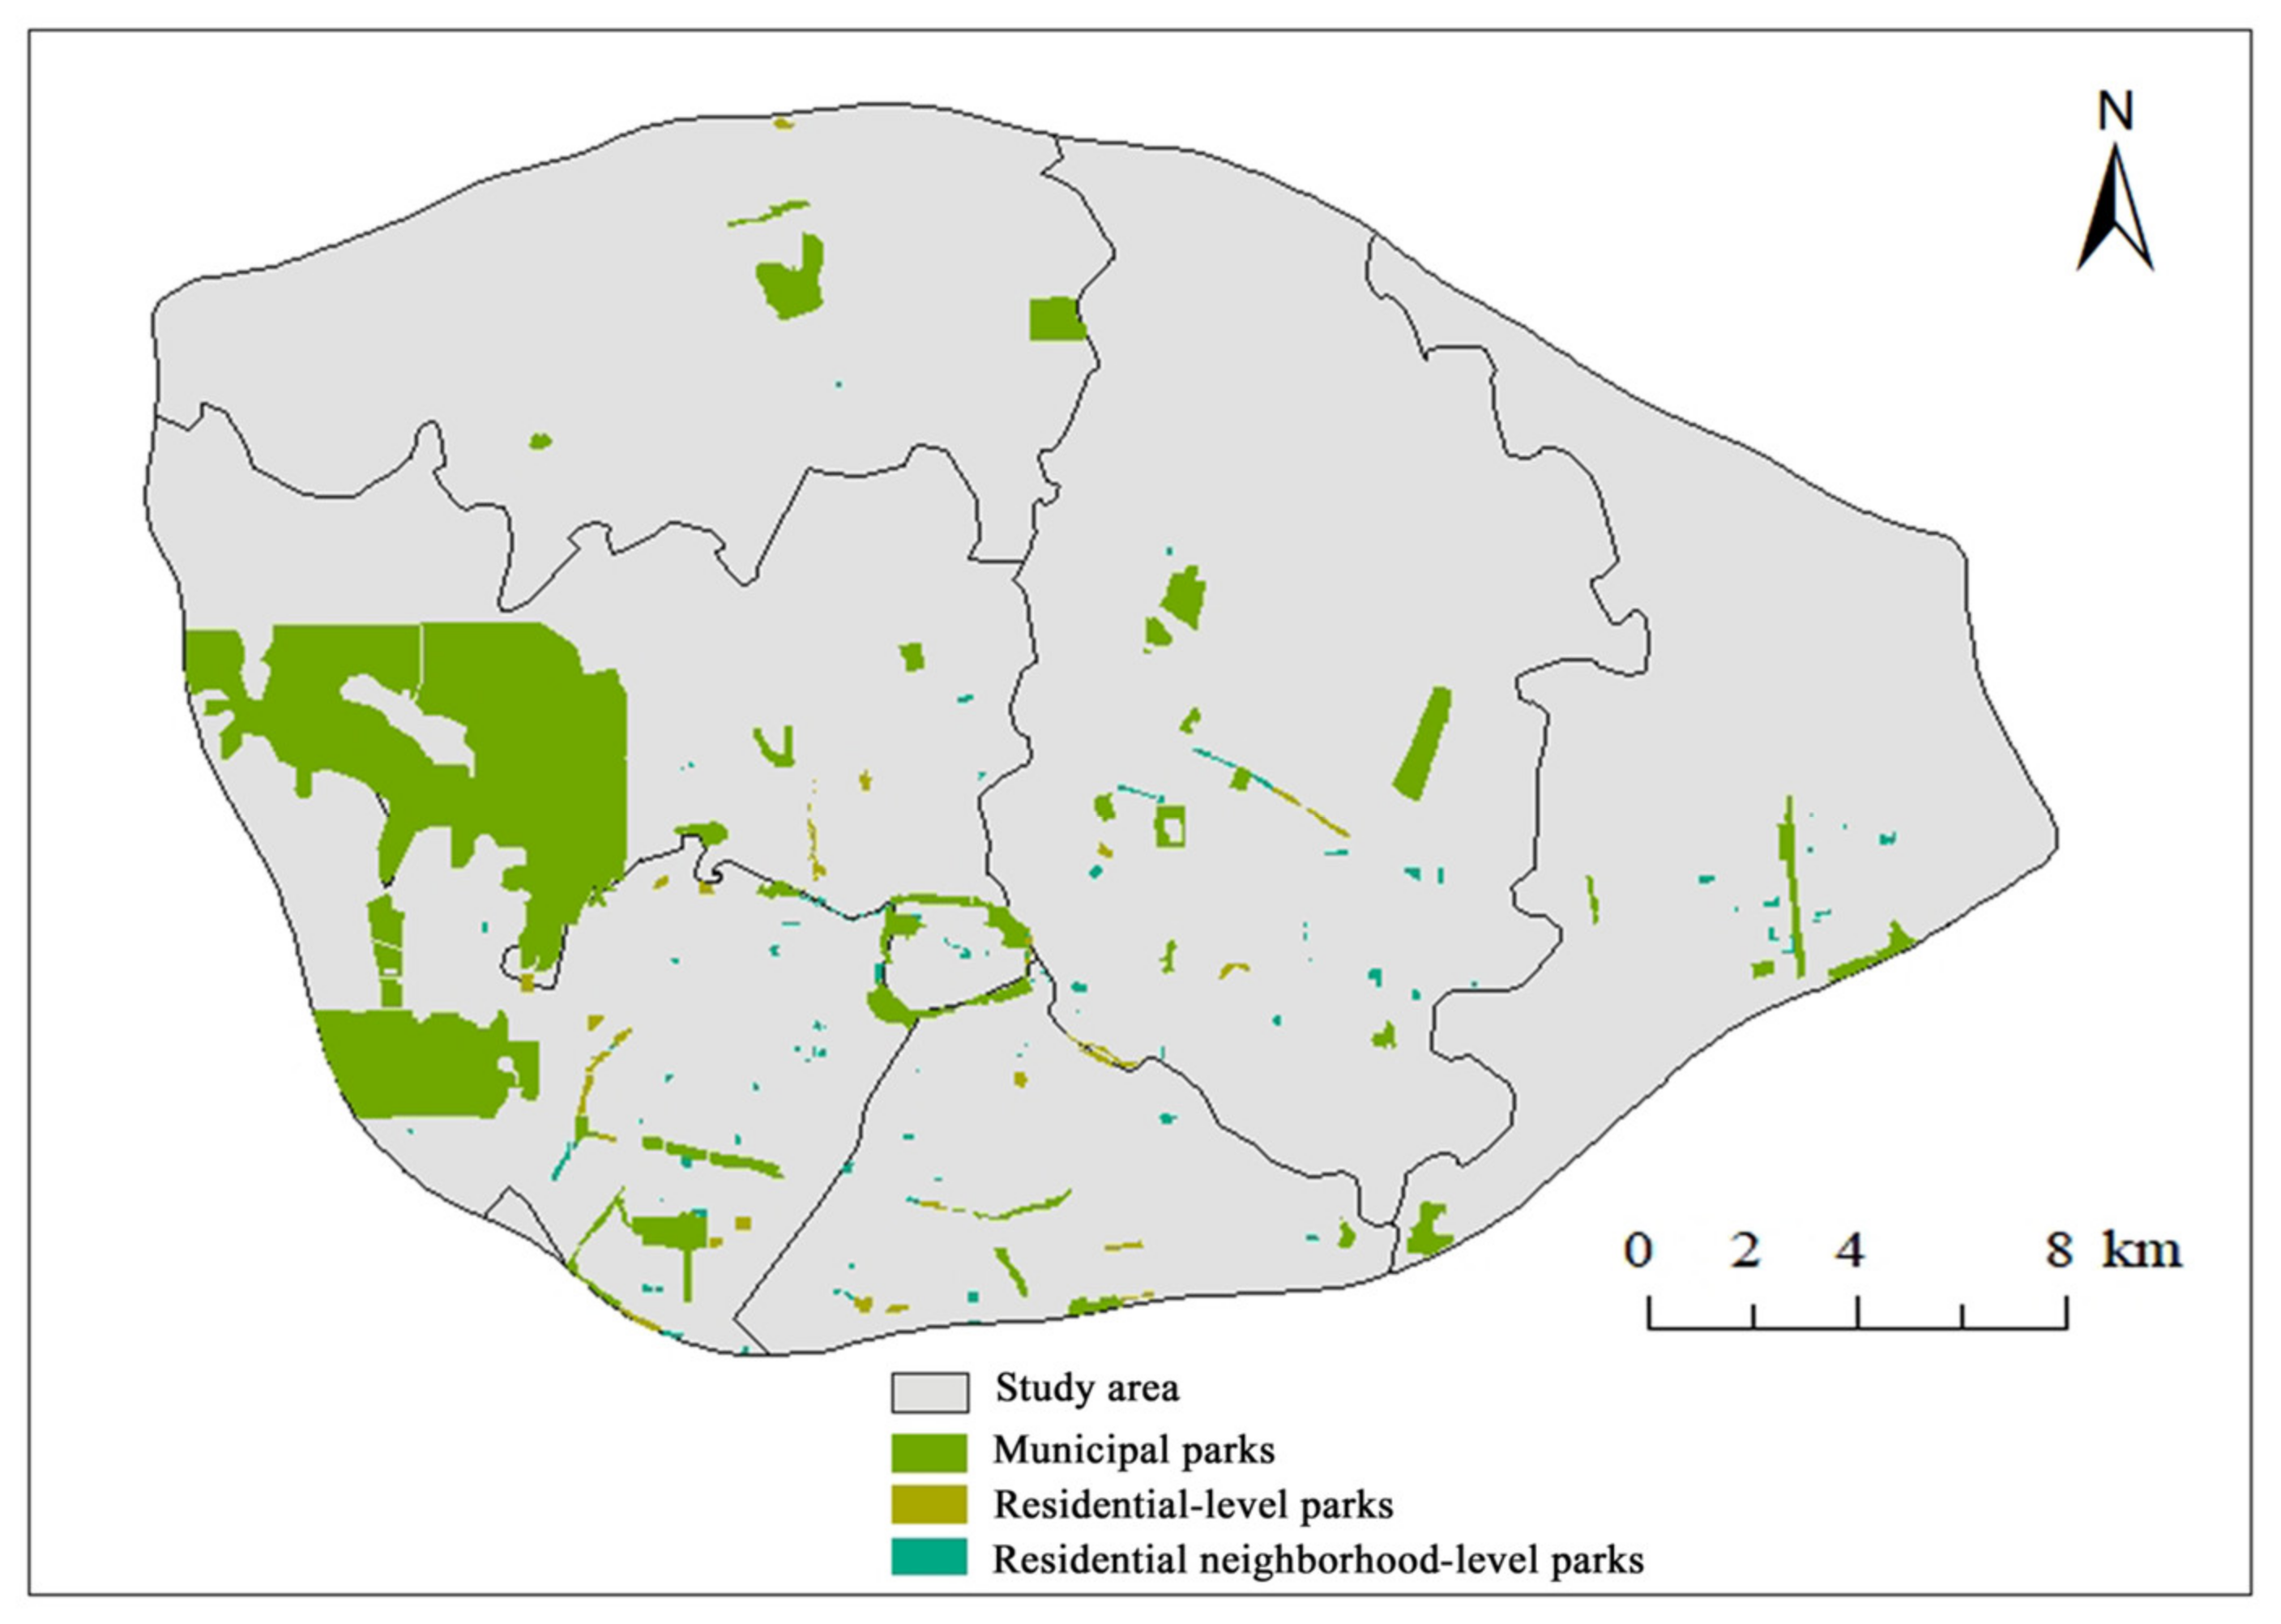
3.1. Spatial Distribution of Population, Settlements, and PGSs

Figure 4a shows the spatial distribution patterns of the three types of PGSs within the ring road, derived from the kernel density analysis. Obviously, there were two high-value areas distributed in the Ring Park around Hefei City and Hefei Second Ring Road green belt, and their spatial aggregation effects were noticeable. Furthermore, the high-density area of the PGS was concentrated in the central and southern portions of the study area, and the low-density area was the north portion. In addition, it can be seen from Figure 4b that the areas with high population density were mainly concentrated in the areas near the Ring Park around Hefei City and the southeastern subdistricts, while the northern subdistricts located in low hills and hills had larger areas with lower population density. Except for those large subdistricts, the distribution characteristics of residential areas were basically consistent with the population. The concentration distribution pattern of PGS in the study area was highly coexistent with the population density, mainly because Luyang, Shushan, Baohe, and Yaohai districts, as the core areas of urban development, were committed to serving different types of urban people, improving the quality of life of urban residents and relieving psychological pressure with high standards and high quality in the construction process. From the core area of PGS distribution to the periphery, the population density gradually reduced. The peripheral areas possessed a more extensive area for construction, and the level and scale of PGS in these regions often surpassed those in the core areas. This compensated for the deficiency of green spaces in the core areas and provided a good guarantee for the establishment of an environmentally friendly urban green space system.

3.2. Accessibility Analysis of PGS

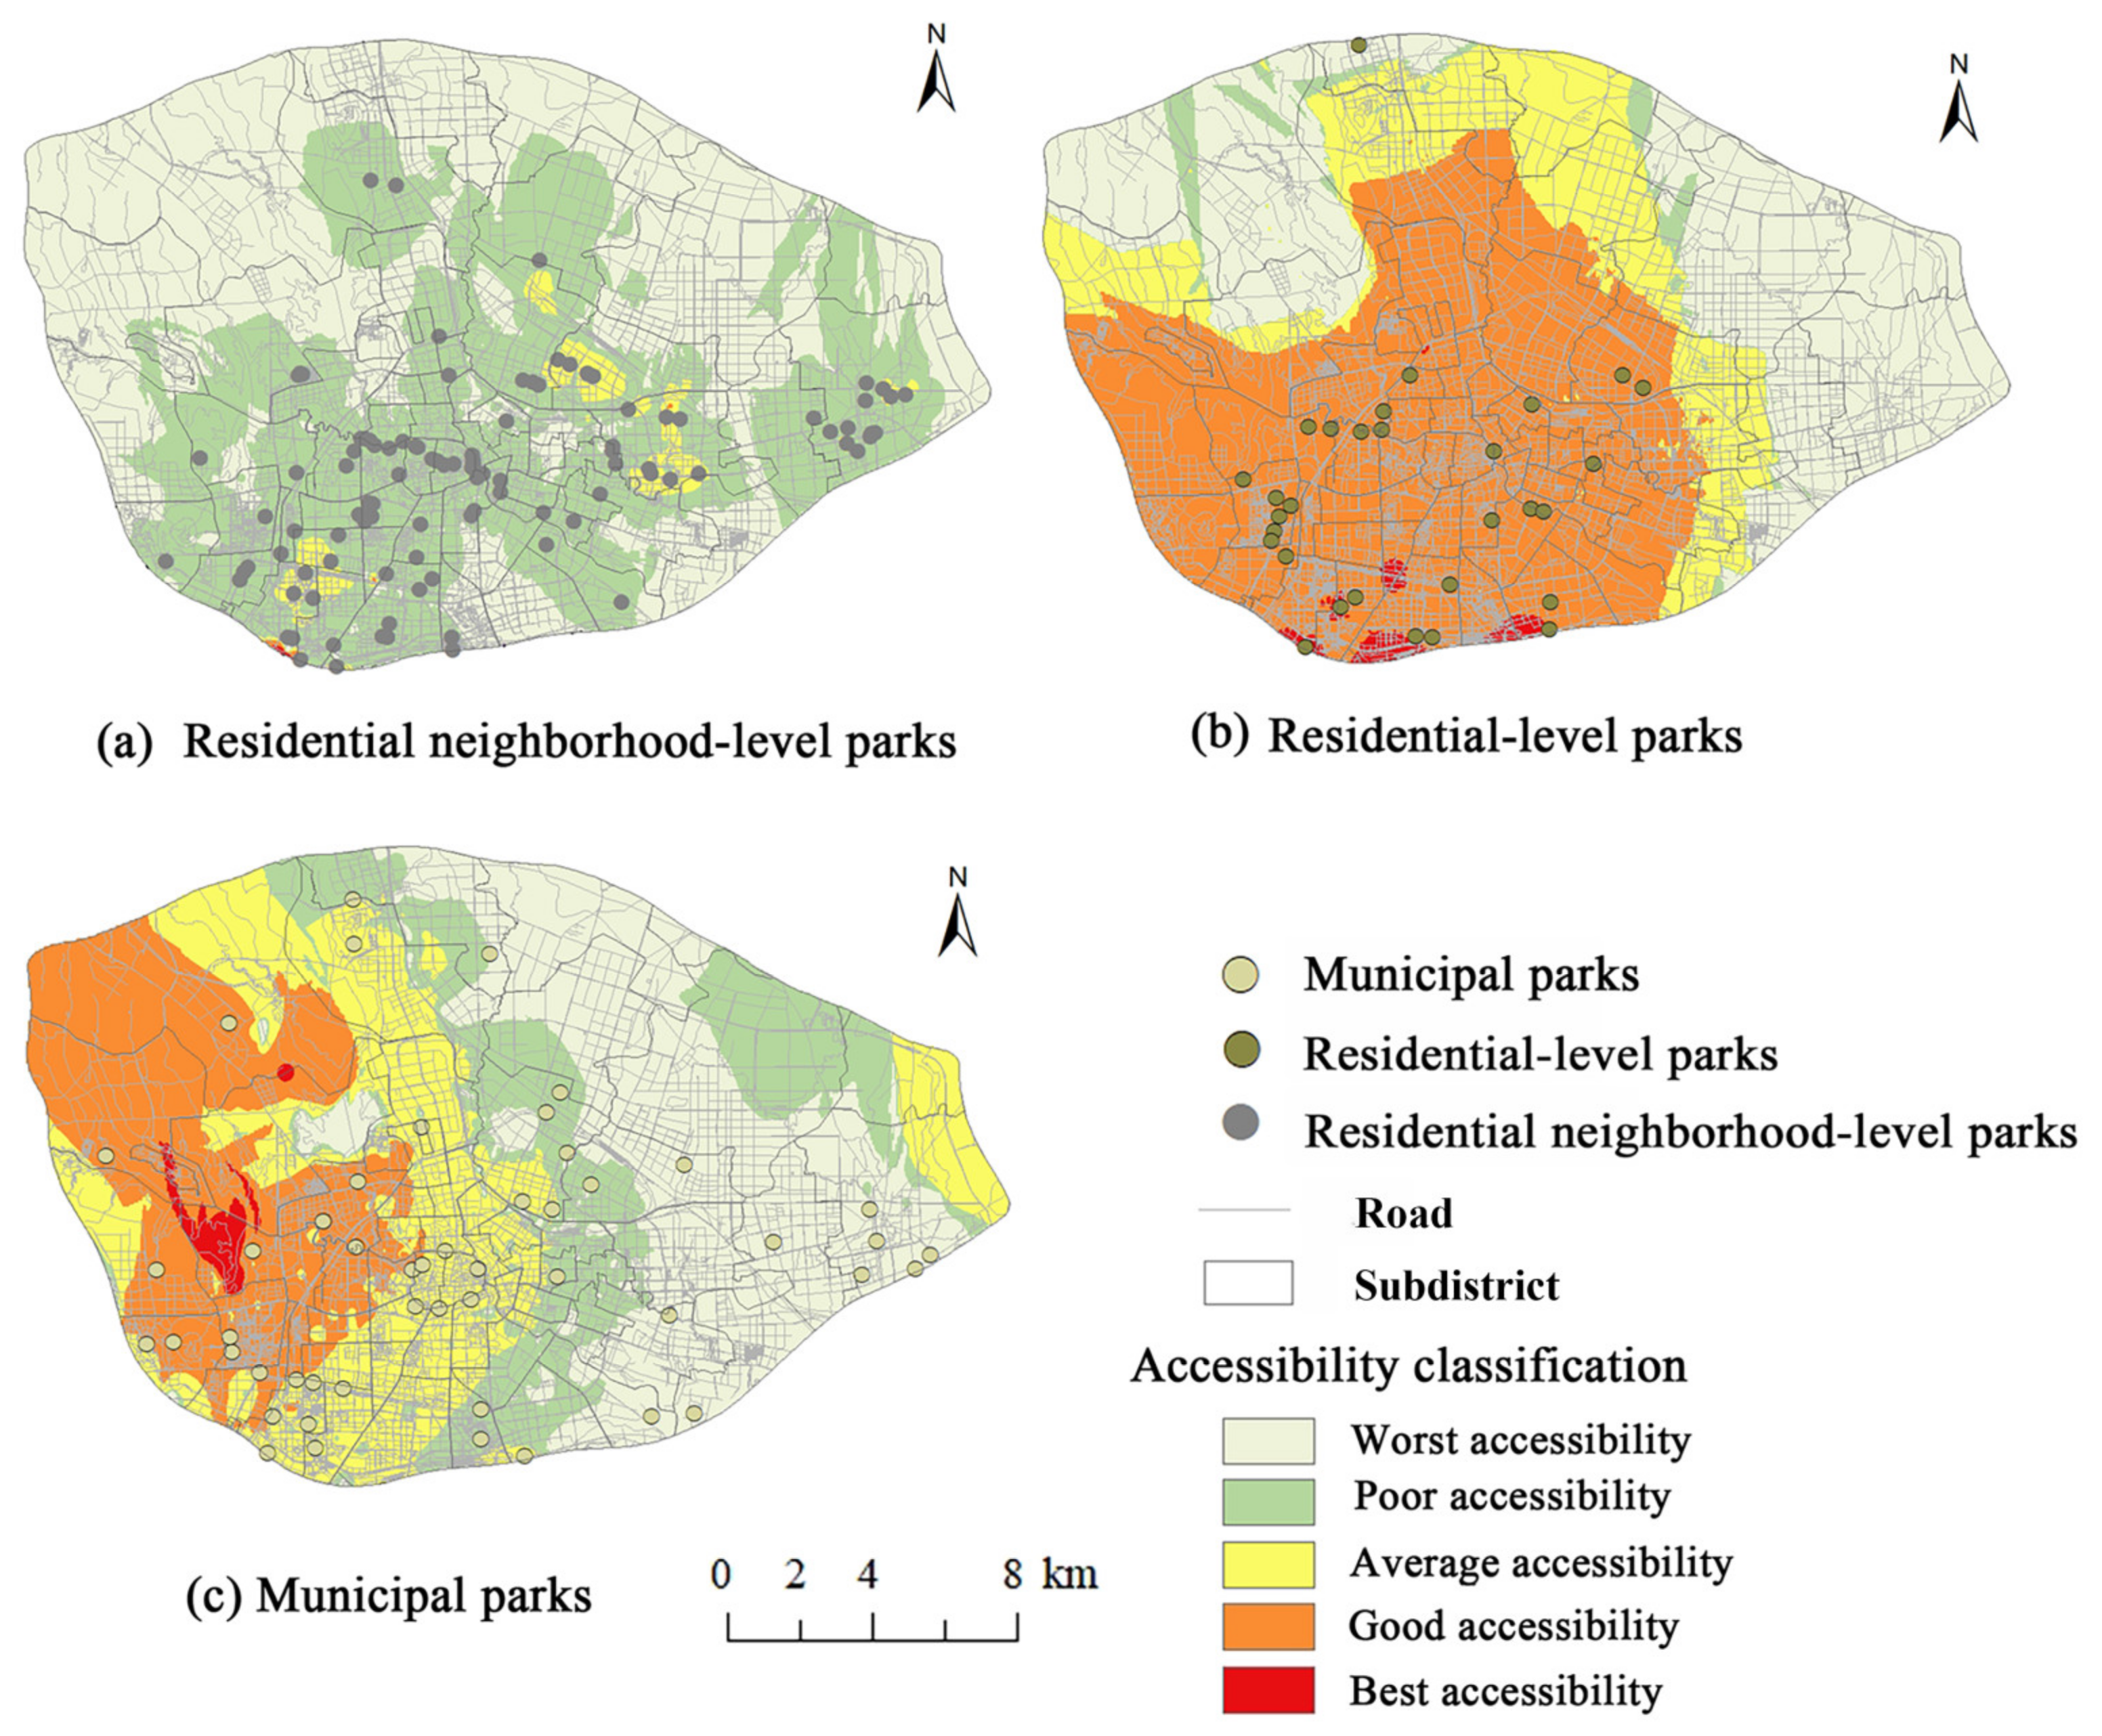
3.2.1. Accessibility Spatial Distribution of Different PGS Types

From a spatial distribution perspective (Figure 5), the accessibility of different PGS types displays significant discrepancies. The accessibility of residential neighborhood-level parks and residential-level parks showed a “polarization” phenomenon in space. The accessibility of residential neighborhood-level parks and residential-level parks in the south was higher than that in the north, and the areas with the best accessibility accounted for 2% and 11.67% of the total residential areas, respectively. The accessibility of municipal parks exhibited a spatial pattern of high accessibility in western areas and low accessibility in eastern areas. The regions with the highest accessibility made up only 5% of the entire residential areas. The observed accessibility patterns in residential-level and municipal parks were consistent with those observed in larger-scale parks, such as Dongpu National Wetland Park, Dashu Mountain National Forest Park, and Meichong Lake Park, suggesting that these locations provide residents with more extensive green spaces available for use. Furthermore, regarding the municipal parks specifically, their spatial distribution indicated a notably higher percentage of areas with great accessibility in comparison to other forms of parks. This implies municipal park systems can effectively fulfill the needs of the majority of urban residents within their service scopes. Obviously, the type of parks had a significantly different impact on the spatial distribution of residential area accessibility. Large and high-level parks often had high accessibility values for those residential subdistricts that surround them (Figure 5).
From an administrative district perspective, the majority of areas with limited accessibility were concentrated within former industrial zones and newly developed zones. Examples include the northern sector of Yaohai District, the eastern sector of Baohe District, and the western sector of Feidong County. Due to the high population density in these areas and the limited amount of PGS at both the residential neighborhood level and residential level, the available PGS resources were insufficient to meet the needs of the population, resulting in poor overall green space accessibility (Figure 5a,b).

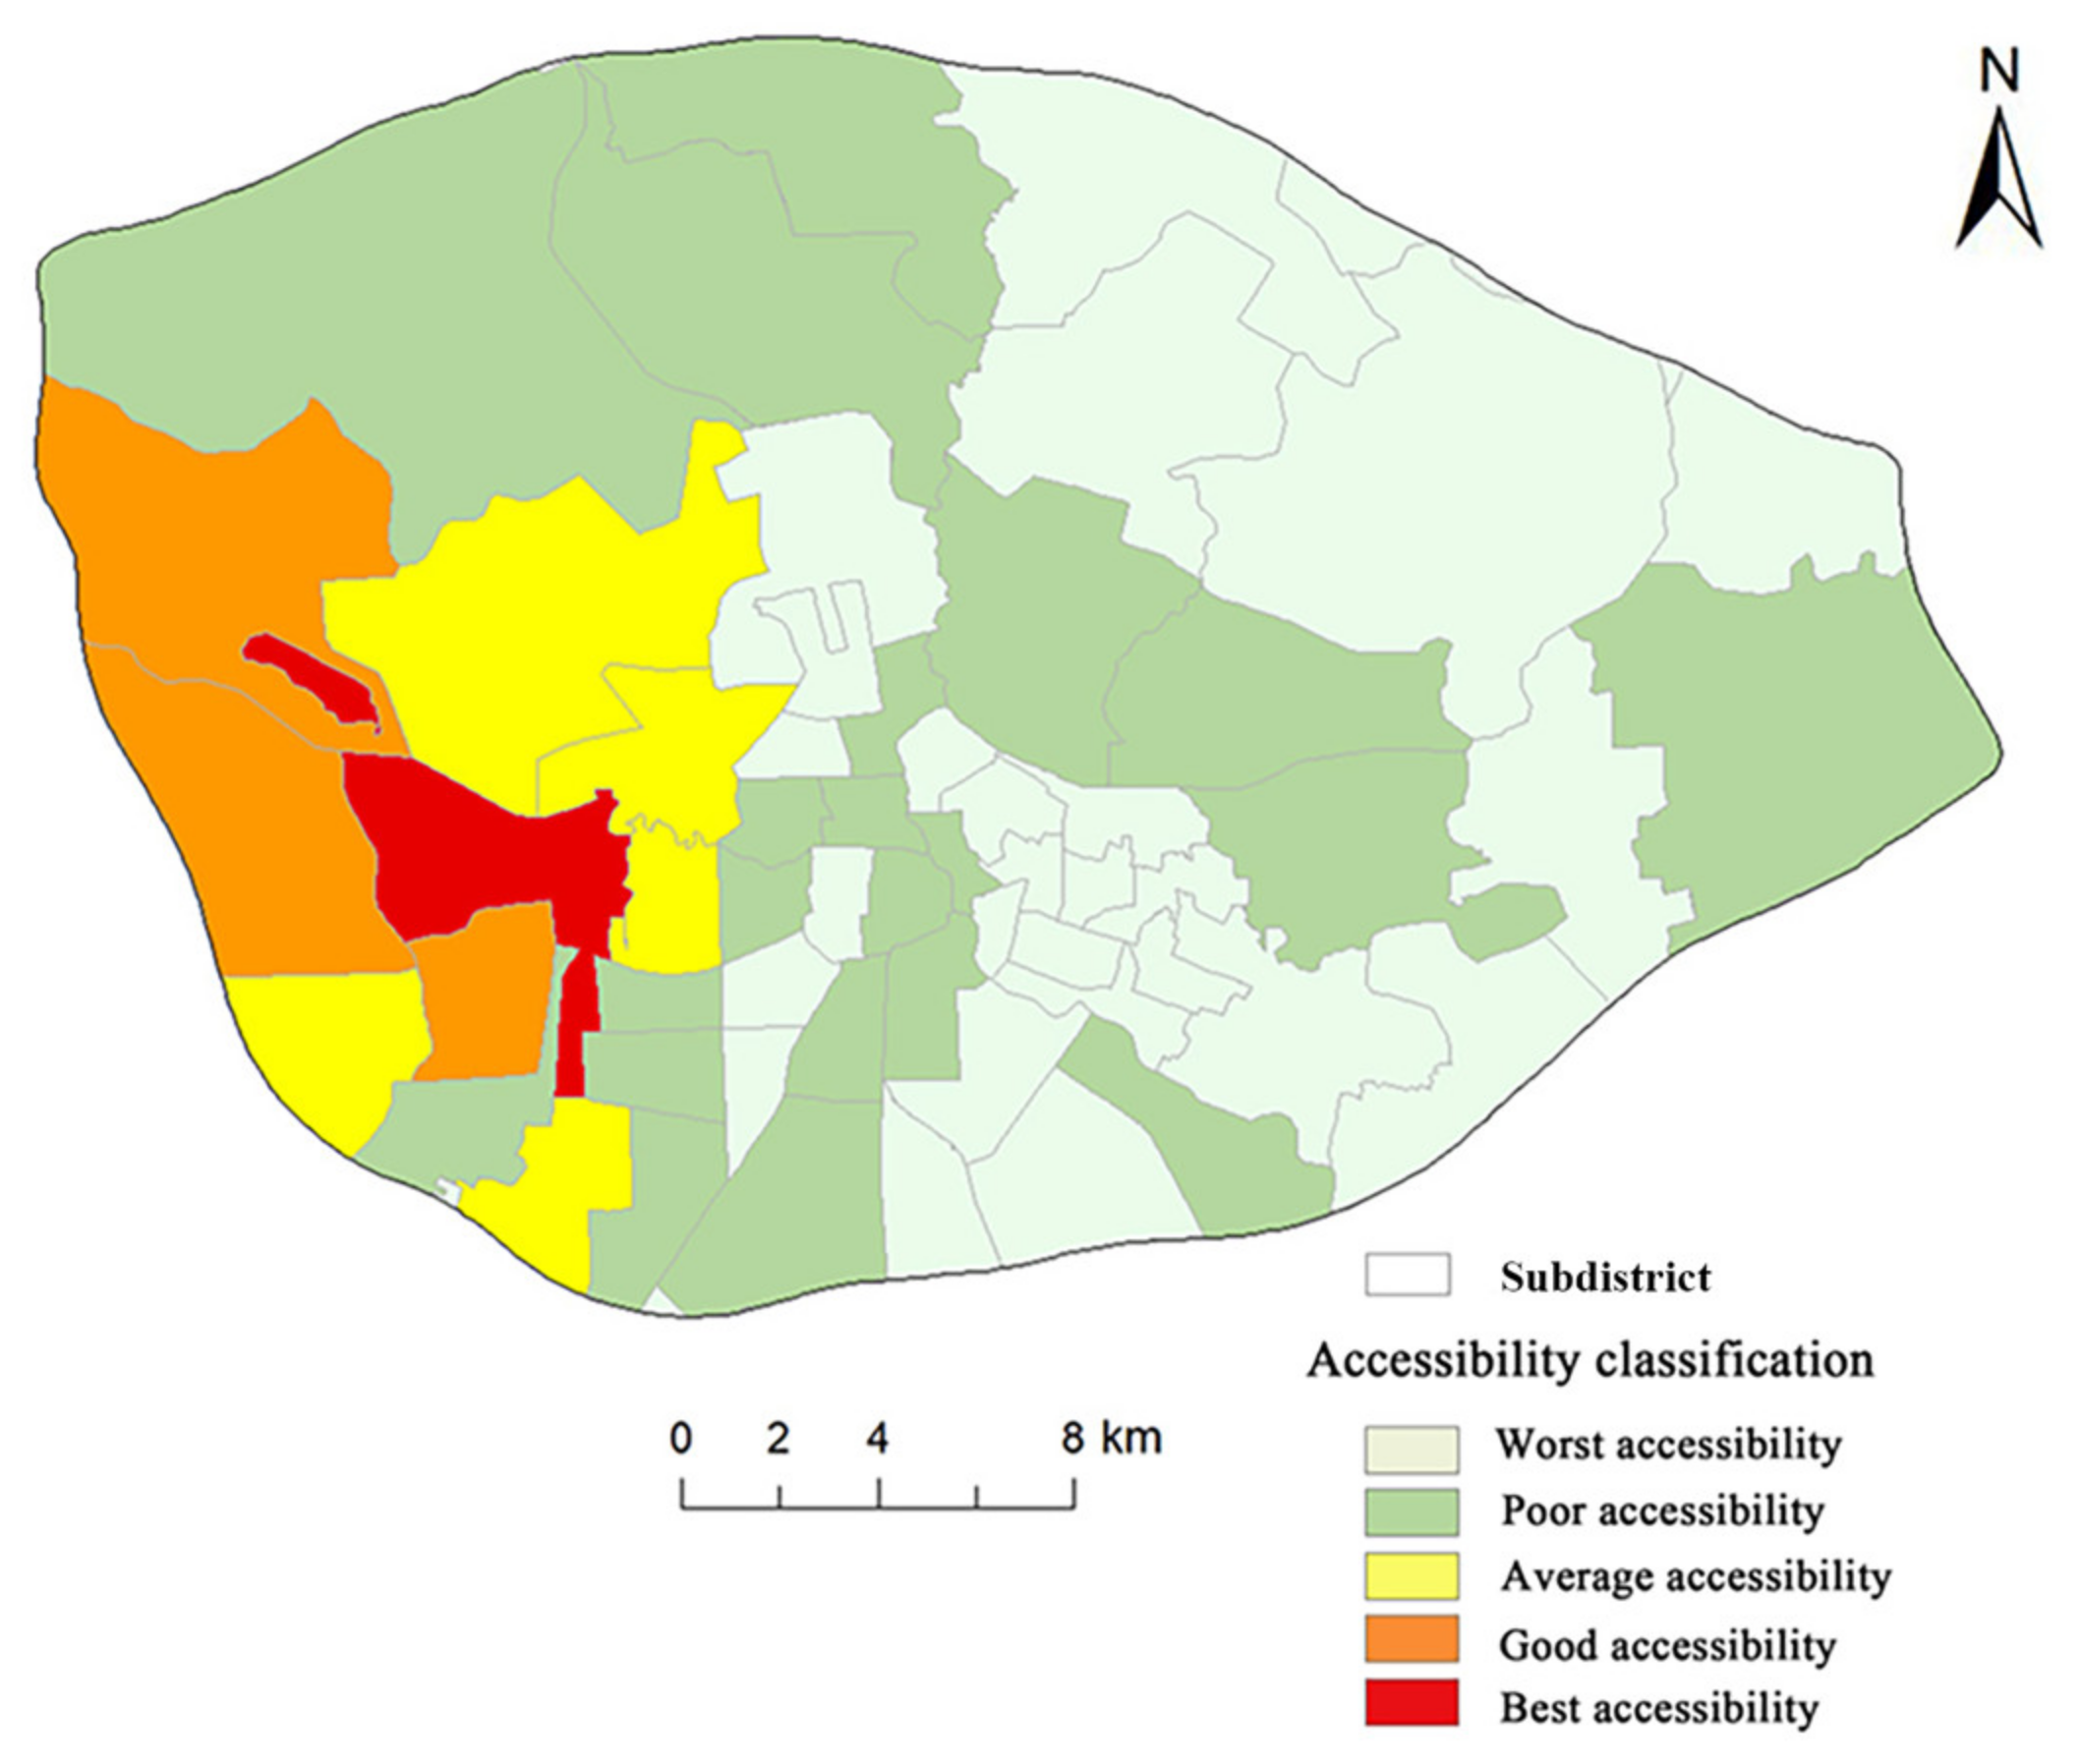
3.2.2. Accessibility Analysis of PGS in Subdistricts

Out of these subdistricts, 30 had the worst accessibility (<1.61), 21 had poor accessibility (1.62~16.94), 5 had average accessibility (16.95~52.23), 3 had good accessibility (52.24~94.78), and only 1 had best accessibility (94.79~283.58) (Figure 6). In 2021, the per capita green area in Hefei was 10.41 m2, which suggested that over half of the subdistricts had a per capita available park green space area lower than the city’s average level, with only a few subdistricts offering high accessibility. Overall, the spatial distribution of PGS accessibility within Hefei’s ring road was uneven (Figure 6).
The global Moran’s I value was estimated at 0.17 based on the accessibility grade of each subdistrict, with a Z score of 4.79 and a p value of less than 0.001, indicating a significant spatial clustering and autocorrelation pattern in the accessibility of PGS in Hefei City (Figure 7). The local Moran’s I index was used to further quantitatively verify the spatial agglomeration. Figure 7 shows that the subdistricts with low accessibility to PGS (low–low) were concentrated primarily within Yaohai District, eastern Baohe District, and western Feidong County. Conversely, subdistricts having high accessibility to PGS (high–high) were predominantly clustered in western Shushan District and western Luyang District. Statistical insignificance was observed among 51.67% of subdistricts, indicating no significant spatial clustering or anomalies. On the whole, the accessibility of PGS in Hefei City displayed a clear spatial difference of “east–west polarization”.

3.3. Equity Evaluation of PGS

3.3.1. Lorentz Curve and Gini Coefficient Result Analysis

In this study, we utilized the Gini coefficient and Lorentz curve method to examine the social equity of PGS resource allocation within the ring road of Hefei City at both the district and subdistrict scales. Figure 8 shows that 19% of the urban population within the ring road of Hefei City had access to only 9% of the PGS, while 43% of the urban population had access to 29% of the PGS. Moreover, 73% of the urban population had access to 57% of the PGS resources, and 91% of the urban residents enjoyed 75% of the PGS resources. Based on the calculation of the proportion of residents accessing park resources, the Gini coefficient for the accessible PGS within the ring road of Hefei City was 0.25, which was within the range of 0.2 and 0.3, suggesting that the level of accessibility to the PGS in the six administrative districts of the study area was reasonably equitable in meeting urban residents’ recreational needs.
Figure 9 shows the derived Lorentz curves at the subdistrict scale, which were based on the cumulative proportion of the accessible area for various PGS types that were used by every subdistrict within the ring road of Hefei City. Thus, the curves provided a more precise depiction of the impartiality of the allocation of accessibility to PGS among the population. Figure 9 indicates that the three Lorentz curves differed notably from the diagonal line depicting complete impartiality. The Gini coefficients of the accessible areas of the three types of PGSs at the subdistrict scale in the study area were 0.76, 0.65, and 0.53, respectively, surpassing the internationally recognized Gini coefficient warning line of 0.4. The Lorentz curves and corresponding Gini coefficients indicated a significant inequity in the distribution of PGS resources within the ring road of Hefei City. Few individuals had access to an excessive amount of PGS resources, while the majority had limited access or could not enjoy these resources.

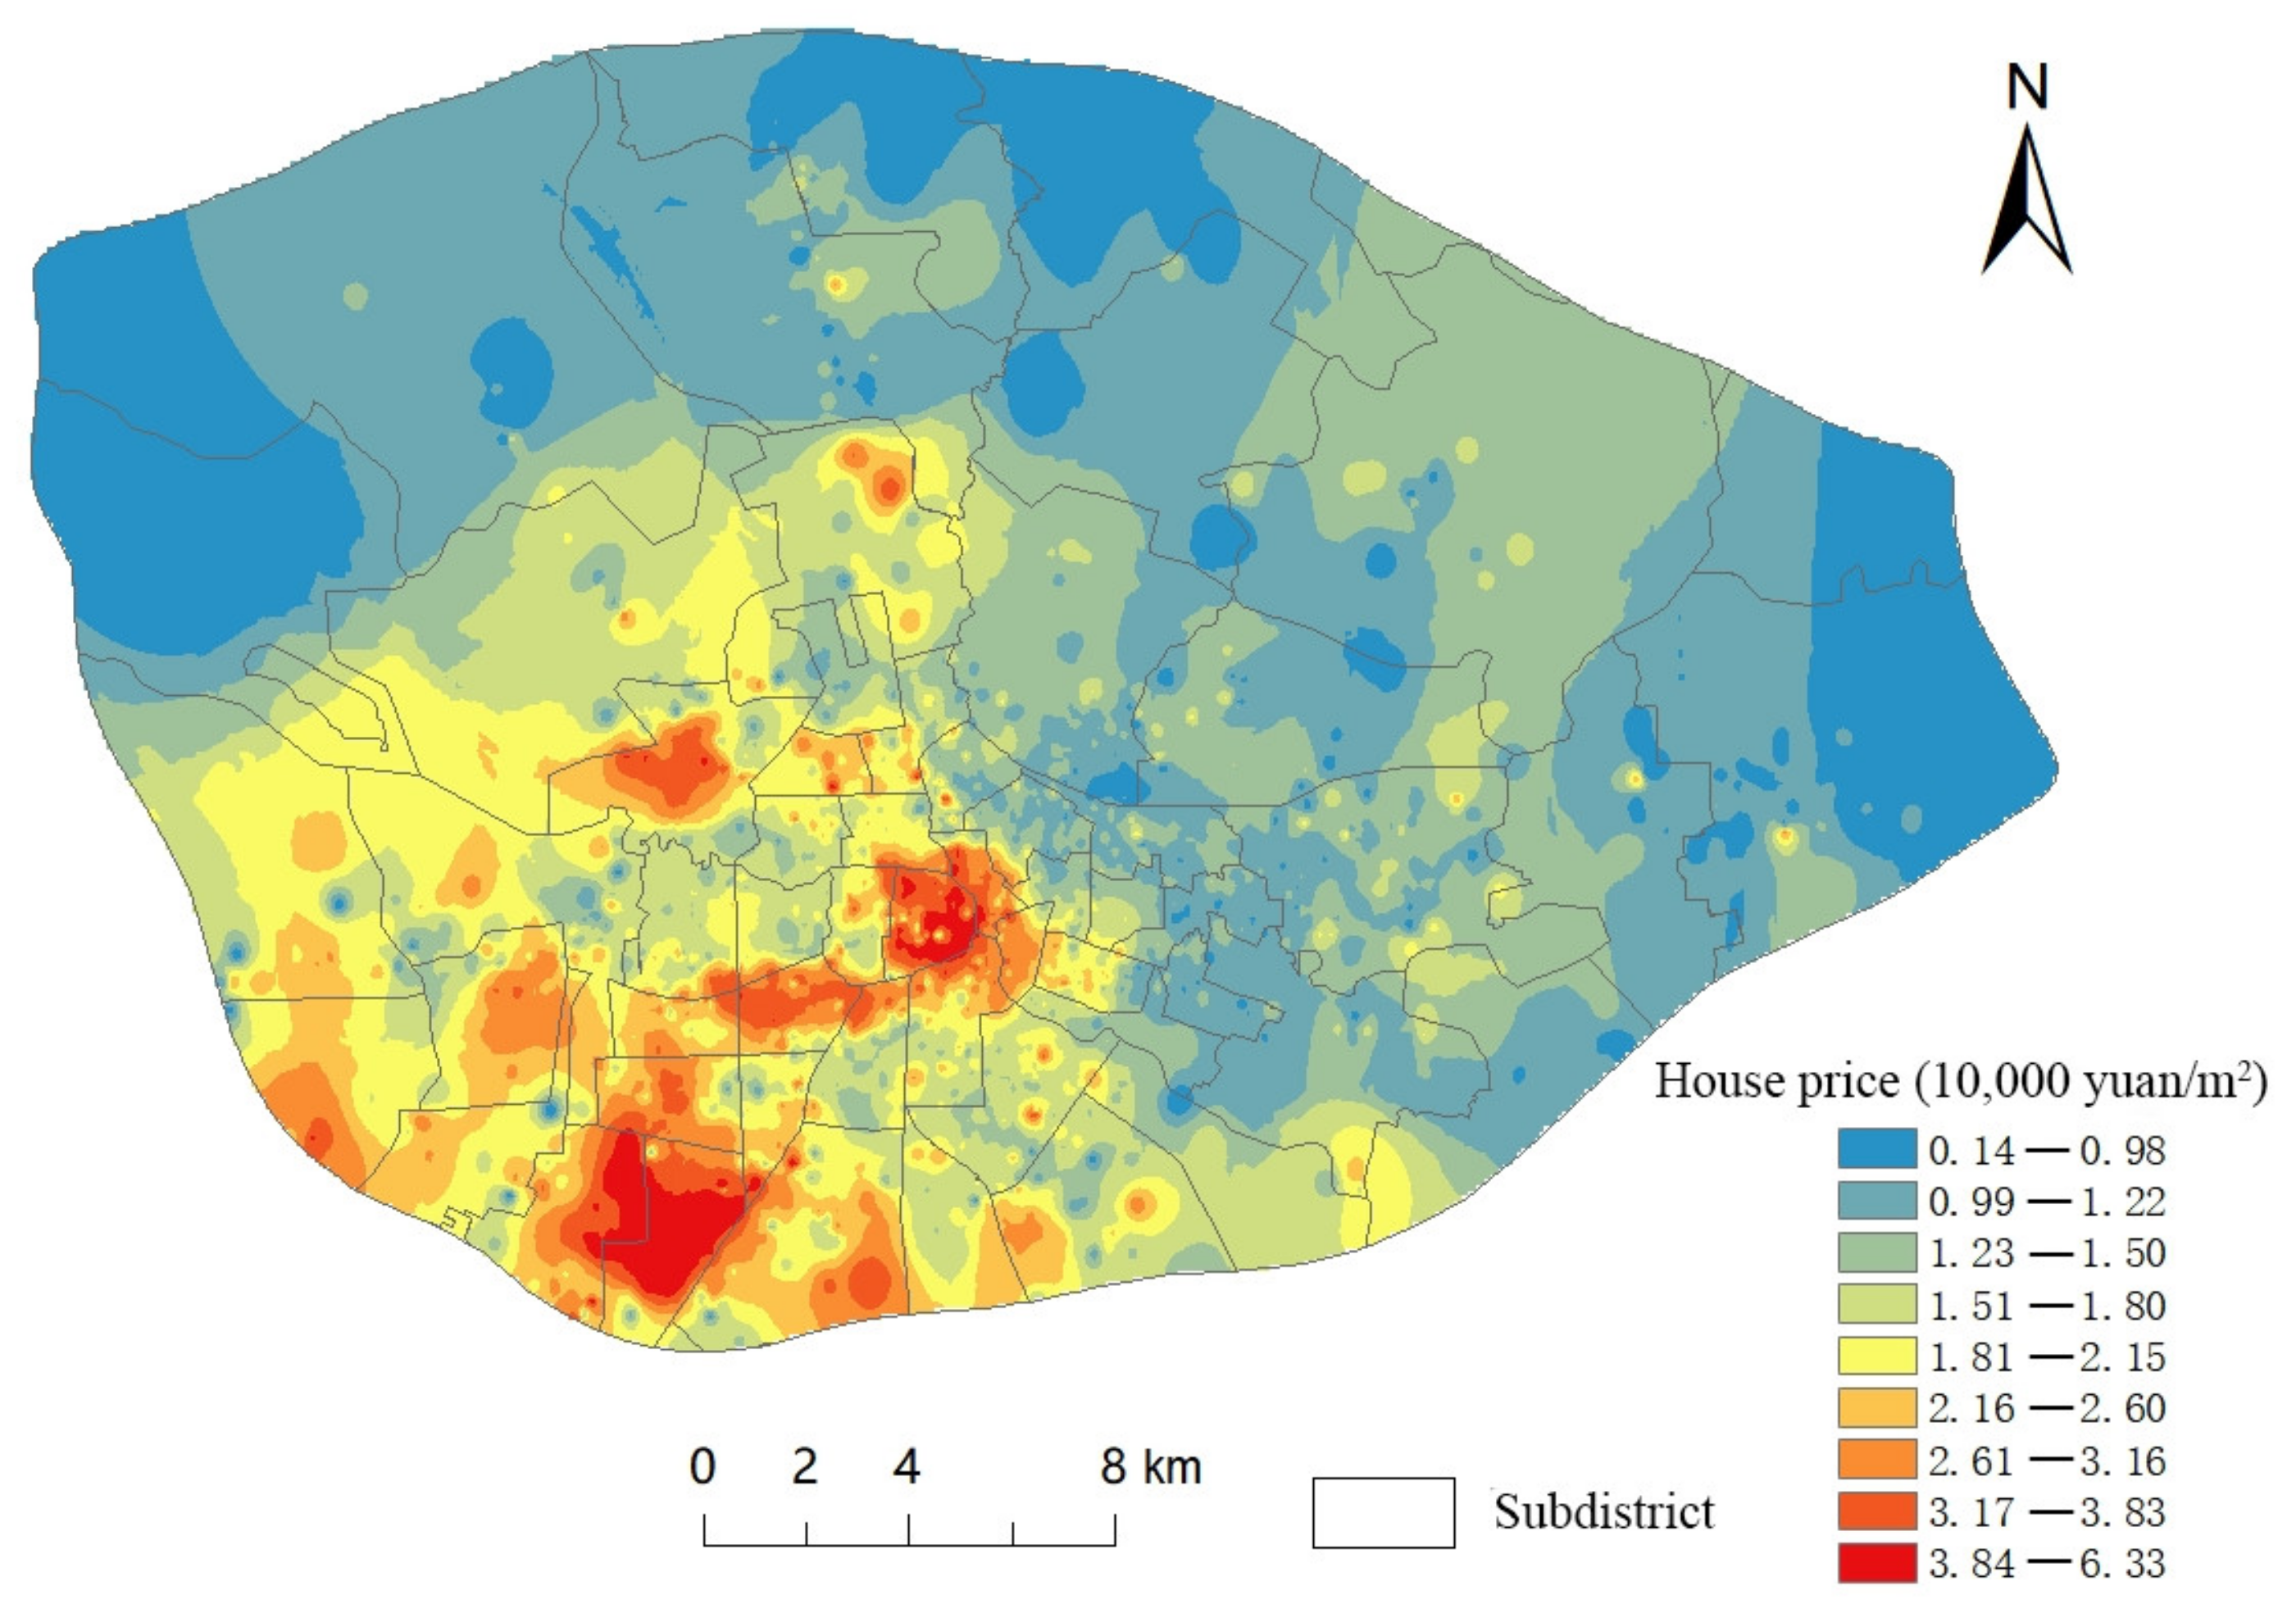
3.3.2. Correlation Analysis between Accessibility and Housing Price

To further examine the unequal distribution characteristics of the PGS resources, the relationship between PGS accessibility and urban housing prices was explored. As depicted in Figure 10, housing prices in residential areas within the ring road of Hefei City varied from 1400 CNY/m2 to 63,300 CNY/m2. In this region, housing prices also displayed clear polarization characteristics and decreased gradually from the urban center to the outskirts. The areas with the highest property values (317,000–63,300 CNY/m2) were located in the first ring near the lake park, the southwest government district, and the southern Binhu New District, which could be attributed to their thriving economies, dense populations, and high-quality infrastructure as the administrative center. The median value regions (12,300~26,600 CNY/m2) occupied more than 50% of the area and were mainly distributed in the periphery of the high-value regions. The areas with low-value prices (less than 12,200 CNY/m2) were mainly scattered in a few locations in the north, northeast, and southwest of the study area.
A bivariate correlation analysis was conducted on the accessibility and housing prices of 2372 residential compounds within the ring road of Hefei City using the SPSS analysis platform. As shown in Table 1, the correlation analysis revealed a significant positive correlation between the housing price attribute and the accessibility to residential-level parks and municipal parks. The correlation coefficient between the housing price attribute and the accessibility to the municipal parks was higher than those between the housing price attribute and the accessibility to the residential-level parks, and these correlation coefficients were 0.305 and 0.404, respectively, implying that the increase in housing price coincided with the increase in PGS supply. This relationship was significant at the level of 0.01. However, there was no significant correlation between the accessibility to the residential neighborhood-level parks and housing price attributes. The study revealed that there was notable inequity in the distribution of PGSs within the ring road of Hefei City based on the residential areas of varying prices. In summary, individuals from higher socioeconomic backgrounds had greater access to PGS compared to those from lower socioeconomic groups. Conversely, the urban disadvantaged within the lower economic groups experienced a lack of PGS.

3.4. Park Green Space Location Strategy

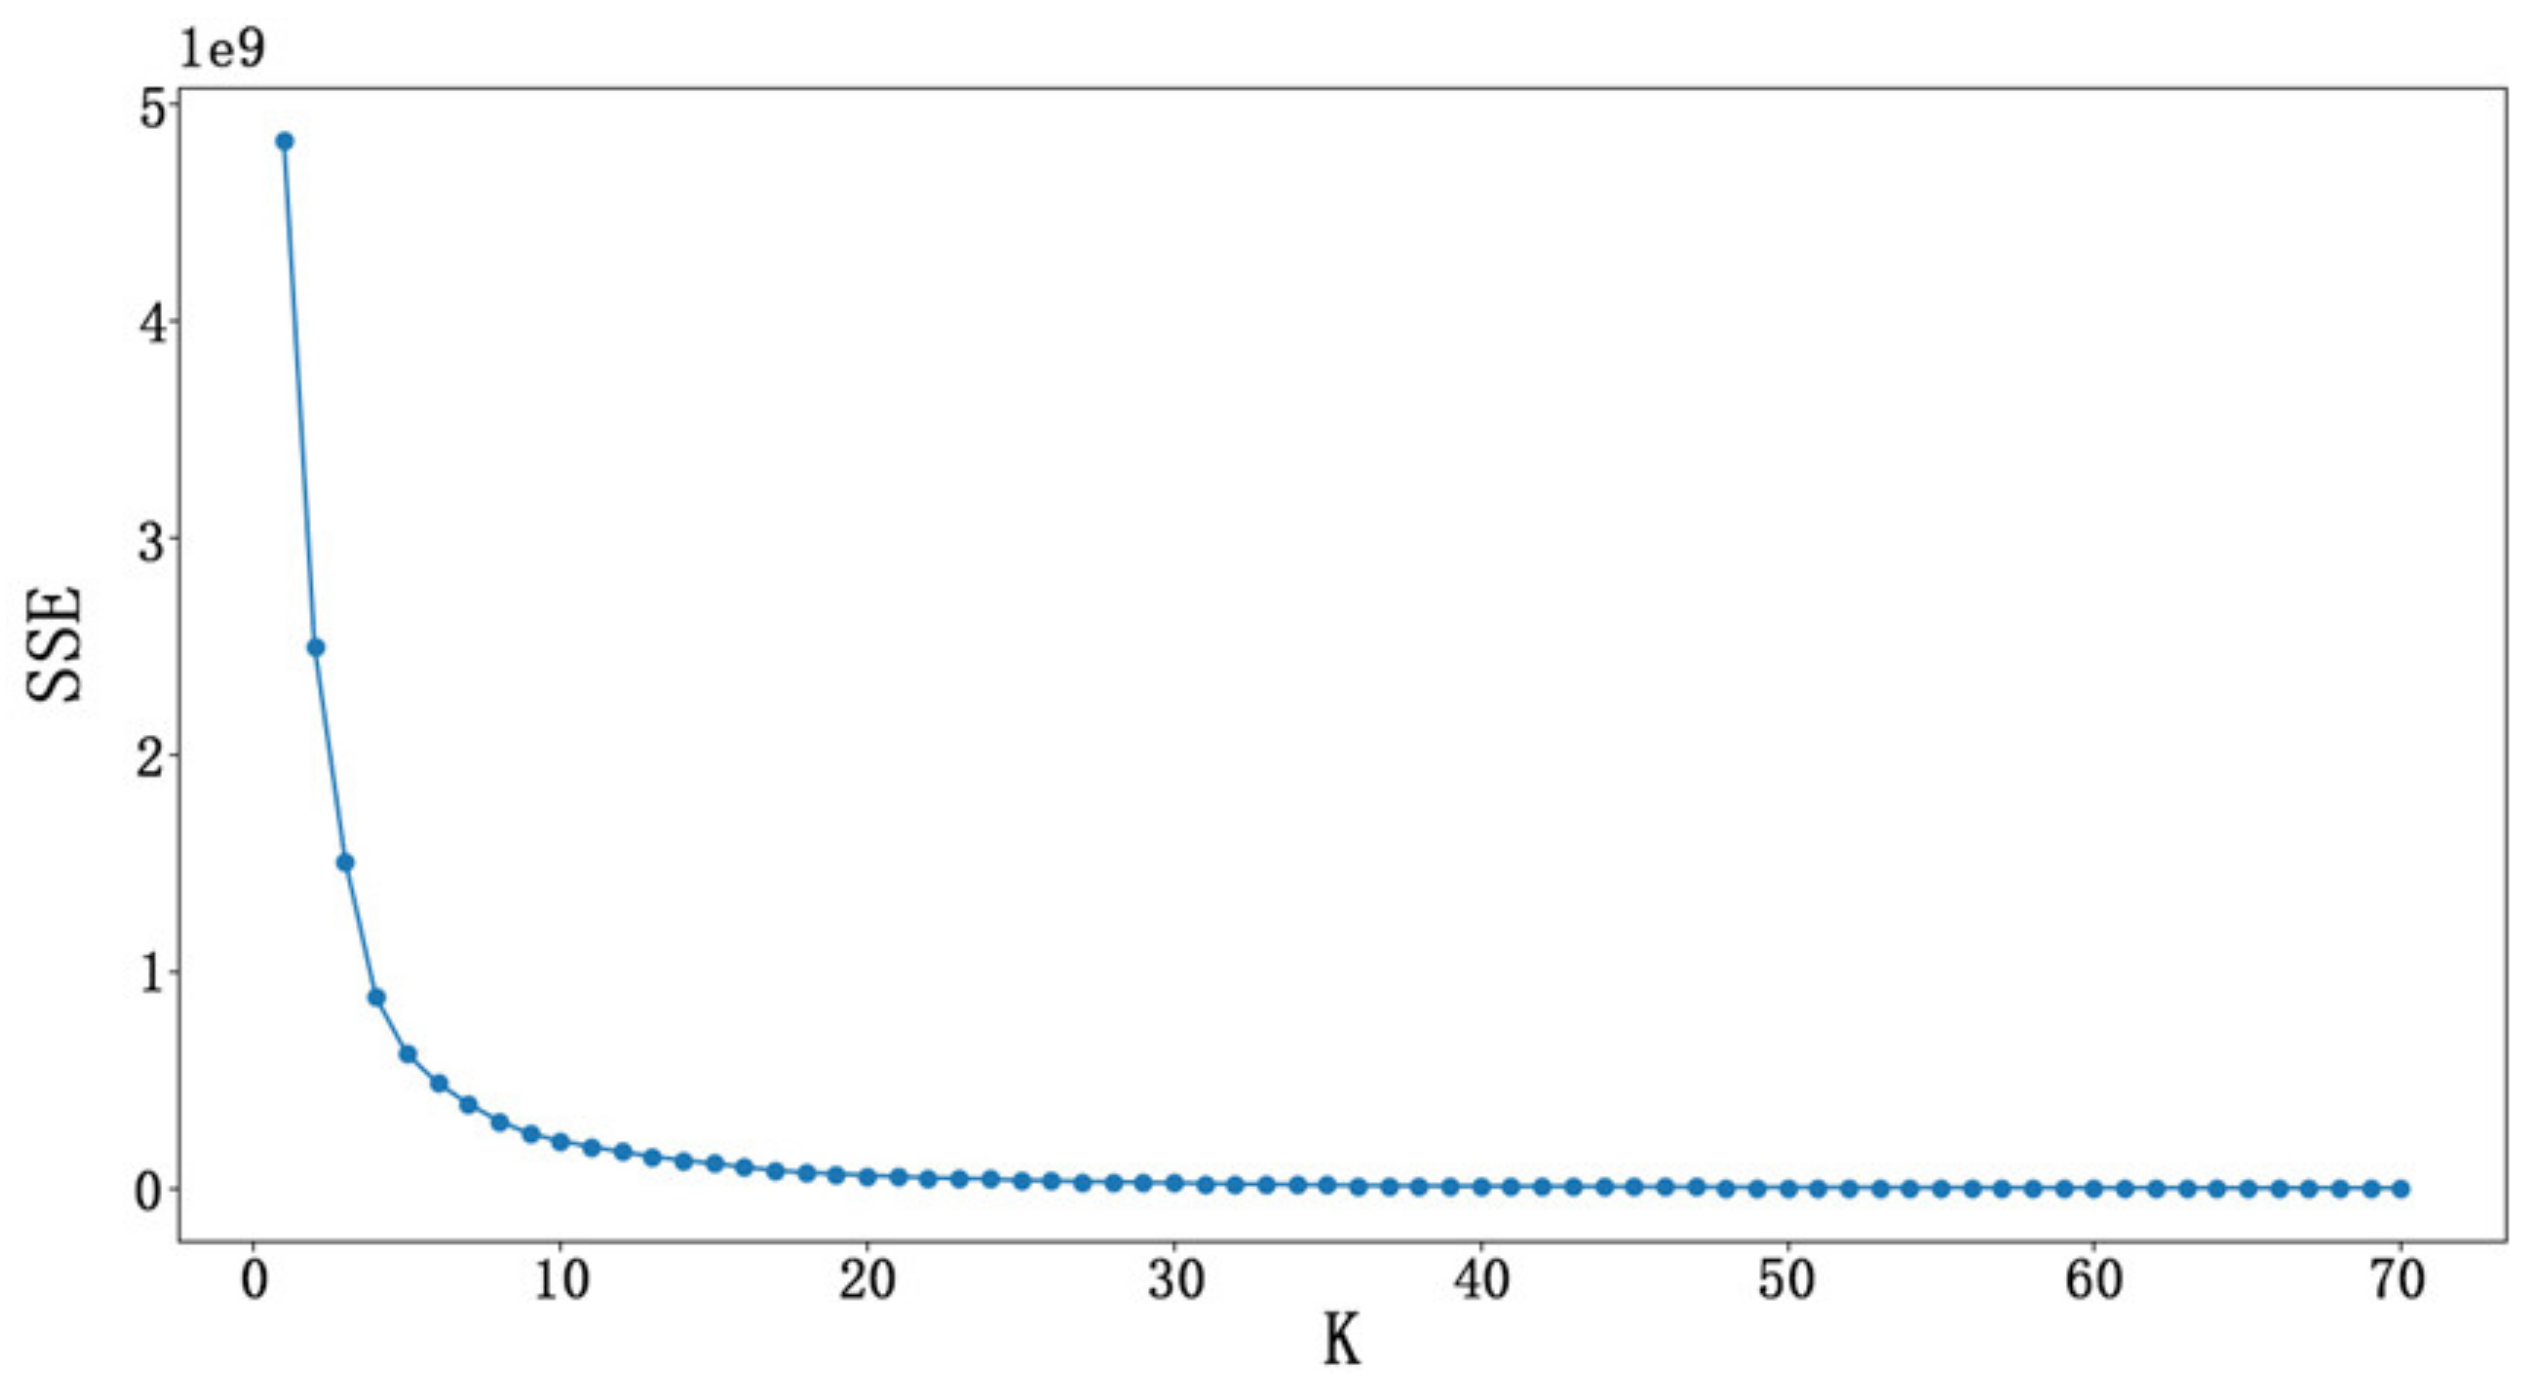
3.4.1. The Optimal Number and Location of Site Selection Points

The optimal number of clusters, representing the required number of new location points for PGSs, could be determined by analyzing the relationship between the sum of squared errors (SSE) within each cluster and the k value (Figure 11). From Figure 11, it is evident that when the k value was at 8, the position of an elbow point was identified; thus, the optimal number of clusters was determined to be eight.
Figure 12 displays the newly planned PGS locations recommended by the PSO algorithm. The eight locations were scattered in the areas with poor and worst accessibility in the central and eastern parts of the study area.

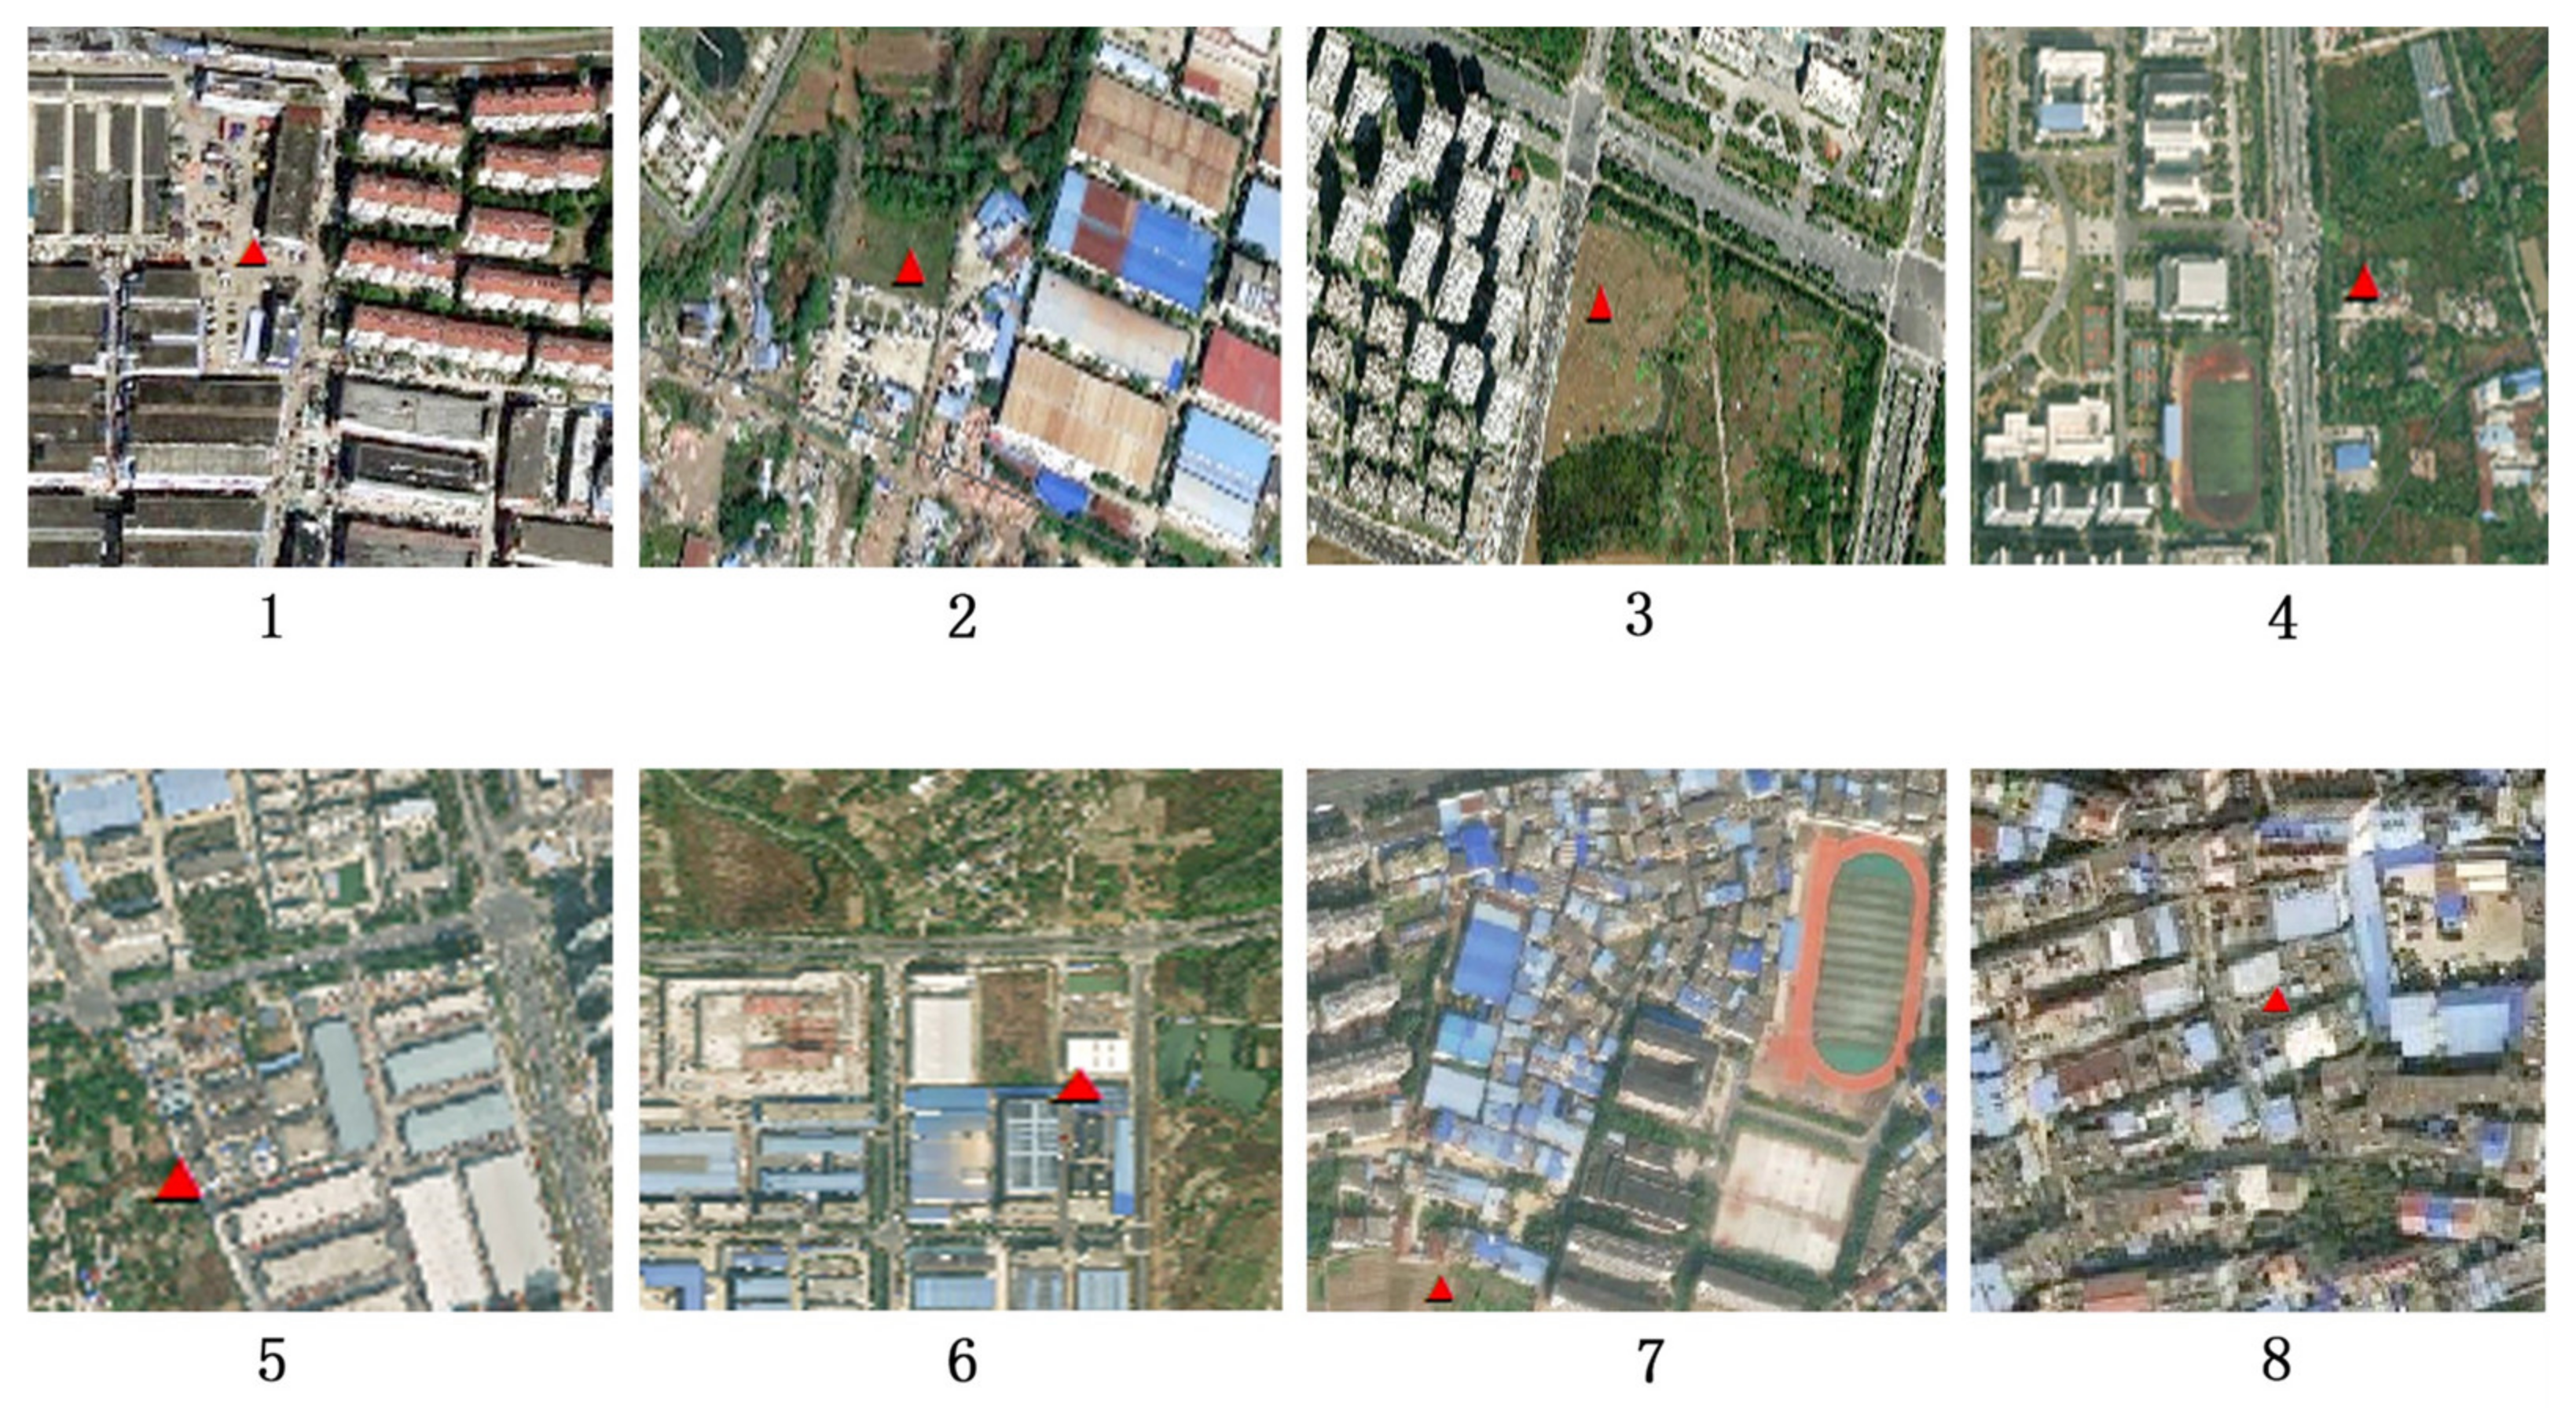
3.4.2. Location Feasibility Verification

To determine the feasibility of new location points for PGSs, this study analyzed remote sensing images. A 1.19 m resolution Google Earth true color image was utilized for the manual visual interpretation of the environmental conditions surrounding the particular PGS locations (Figure 13).
By visually interpreting the data, it was evident that the K-means algorithm and PSO algorithm yielded credible results. The newly identified locations were predominantly situated in an area with a high population density and limited PGS resources. Location 1 was situated on the eastern side of Linquan Road in Yaohai District, encompassed by residential areas and wholesale markets; Location 8 was positioned between Shitang Road and Renmin Road in Feidong County, with relatively dense urban villages nearby. The land resources surrounding these two locations were scarce, imposing limitations on available land resources for PGS construction. Locations 2, 3, 4, 5, 6, and 7 were surrounded by abundant available land resources that render them suitable for establishing new PGSs. Among them, Location 2 was situated on the north side of Guanjing Road, between Xuelin Road and Sishui Road in Yaohai District. The surrounding area was mainly composed of industrial factories and low-rise rural residential buildings, providing greater amounts of spare land for new park green space development. Location 3 was situated near the high-tech development zone, adjacent to a large shopping center on the west side and Shaoquan Lake on the north side. The buildings mainly consisted of sparsely distributed high-rise residential compounds, with ample land resources available for new park establishment. Location 4 was situated near a university town, with a well-connected road network and abundant vegetation, making it a suitable location for a new park. Location 5 was situated on East Changjiang Road in Feidong County, adjacent to Hongxing Logistics Park, providing ample idle land. Location 6 was situated on the southern side of Yaogang Road in Feidong County. The structures consisted primarily of low-rise residential buildings with limited density and more open land surrounding them. Location 7, adjacent to a middle school, was situated between Changjiang East Road and Longquan Road and was conveniently accessible by transportation. It featured an assortment of modern and traditional structures, primarily composed of low-floor residential buildings and a small number of high-rise residential compounds, with an ample supply of available land resources.

4. Discussion

4.1. Effectiveness of PGS Accessibility Evaluation

From the perspective of the measurement method, the improved 2SFCA model comprehensively considered the competition among different PGS types, the service capacity of each PGS type, the population size, the traffic network, and other related factors to produce more reasonable and realistic accessibility evaluation results. Additionally, the evaluation also took into account various travel manners to satisfy different residents’ travel needs to access different PGSs. For the demographic data used in the evaluation, the subdistrict-level population data were more detailed than the district-level data used in previous research [42]. From the perspective of research objects, previous similar studies have typically used the per capita area index as the capacity standard for all PGSs, without distinguishing PGS types [72,73]. Obviously, our current evaluation considered the scale and competition of different types of PGSs to depict their accessibility and comprehensively determine differences in urban PGS services, making the accessibility evaluation results more accurate and more useful when planning our urban construction and life.
Our analysis indicated that the accessibility of PGS within the ring road of Hefei City exhibited a distinct polarization pattern, with high accessibility in the west and low accessibility in the east. This pattern was primarily attributable to factors such as the effects of the natural environment and mountainous topography in the western region, which resulted in the availability of a large number of widely distributed PGS resources there. These parks were concentrated mainly in Shushan and Luyang districts, which were part of the ecological control and restricted development zone with a relatively small resident population. This situation allowed residents to enjoy more PGS resources, resulting in high accessibility. However, the limited land resources and large population in the eastern region prevented citizens from satisfying the demand for PGS resources, leading to an uneven allocation of PGS resources in this area and a shortage of supply. Based on previous studies on PGS in Hefei, it was apparent that there existed a mismatch between population density and accessibility in some areas of the old urban region [53]. Similarly, while the population density and accessibility in the central urban area did not completely match, the population density and accessibility in the newly developed area were relatively adaptable [53,74]. These results were consistent with the findings of the spatial accessibility analysis presented in this paper.

4.2. Significance of Urban PGS Equity Evaluation

By utilizing the Lorentz curve, Gini coefficient, and bivariate correlation analysis to assess accessibility and housing prices, this study provided a thorough evaluation of equity in urban PGS. It revealed both spatial and social equity among diverse social groups in accessing various PGS types, offering significant implications for the optimization of urban PGS distribution.
The unbalanced and polarized spatial distribution of housing prices resulted in the formation of homogeneous communities where residents with similar consumption power and class characteristics tended to concentrate. Consequently, social isolation between the high-income and low-income groups was intensified. Numerous studies have confirmed that this spatial segregation is often linked to inequitable allocation of public resources among different social strata [1,75,76,77]. Groups with higher socioeconomic status had greater access to high-quality PGS compared to those with lower socioeconomic status. The reason for this phenomenon may be the ability of these social groups to select residences with higher-quality living conditions [78].
After evaluating the spatial and social equity of PGS owned by various social groups, PGS planning can be based on core considerations to promote a just and equitable living environment [79]. The current study revealed an inequity in the distribution of PGS resources across social dimensions including regions, populations, and different economic and income groups (Figure 9 and Table 1), which poses a significant challenge for urban planning. Henceforth, urban PGS layout planning should entail the careful consideration of population, land, transportation, economy, and other relevant factors to ensure equal access opportunities and convenient accessibility of urban residents and to promote the construction of ecologically friendly and livable cities.

4.3. PGS Construction Suggestions

By analyzing the evaluation results of accessibility and equity of urban PGS within the study area and integrating them with the findings of the optimal location selection for PGS layout, two categories of location strategies can be identified: one for areas with limited land resources and another for areas possessing abundant available land resources.
For the areas with scarce land resources, the compact and intricate layout of urban construction further exacerbates the challenges presented by scarce land availability [80]. Furthermore, due to the exorbitant costs associated with reconstruction and relocation, these areas lack the necessary capacity for deploying PGS and recreational facilities. Due to limited land resources, certain areas, predominantly located in the old city, experience high population densities and low service capacity (Figure 13). In light of these issues, this paper suggests several optimization strategies. Firstly, the demolition and reconstruction of old residential areas and seriously damaged buildings can transform them into small and medium-sized PGSs, alleviating the shortage of green space facilities in regional parks. Additionally, increasing small roadside green spaces, constructing compound facilities and user-friendly spaces, and enhancing facility efficiency are also recommended. Secondly, the accessibility between residential areas and PGSs can be enhanced by transforming the enclosed walls of existing urban PGSs, increasing the number of entrances and exits, and constructing connected express lanes. Finally, in planning the layout of residential compounds, it is crucial to fully assess the convenience of transportation near residential areas and the accessibility to PGS [81]. As per local conditions, it is necessary to comprehensively coordinate the planning and layout of residential areas and park green spaces to address the problem of mismatch between the supply and demand of PGS resources.
Most of the areas with plentiful land resources are largely situated on the outskirts of the city or in the transitional zone between the periphery and the urban core area. This zone includes high-tech development zones, economic development zones, new cities under development, and large parks and green spaces (Figure 13). These regions are presently in the early stages of development and do not have a fully mature urban facility support system, but they offer ample space for construction. More attention should be given to improving and enhancing the quality of the living environment for the surrounding residents during the planning stage. Firstly, corresponding PGSs should be set up in peripheral areas such as industrial parks and logistics parks to play a dual role of ecological barrier and recreational leisure. Secondly, it is important to focus on building high-quality large-scale PGSs to attract urban residents and alleviate the problem of insufficient capacity for urban PGS services. Lastly, pocket parks and strip-shaped green spaces should be added to establish connecting roads between various types of parks to enhance the overall connectivity of regional PGSs.

4.4. Limitations and Future Improvements

Due to limited data access and other constraints, the accessibility analysis in this study did not encompass additional transportation modes, such as public buses and subways, nor did it account for individual activity–travel patterns aligned with specific travel goals, which could potentially impact the final research outcomes [82]. Future investigations should therefore delve into residents’ movement trajectories and their diverse needs. The determination of the scope of green space accessibility and equity in urban parks was relatively simplistic in this study, relying on values widely acknowledged in previous literature [60,62,63,66,82]. However, it failed to acknowledge that urban PGSs offer varying benefits due to factors such as size, water area presence, and natural vegetation composition, among others. To better evaluate accessibility and equity aspects, future studies should conduct quantitative analyses to comprehensively assess the overall benefit coverage provided by urban PGS. In addition, in setting the service supply level of different PGS types, the attractiveness of the infrastructure inside the park to residents was not considered. In future research, it is necessary to combine the specific needs of residents and different types of PGSs and their service quality. Poor accessibility and inequitable resource allocation are not limited to urban PGSs as public facilities. This study proposed an integrated framework that can be applied to the planning and construction of various public facilities beyond urban PGS, including hospitals, schools, and other types of public facilities. Future research can expand the application of this framework to other public facilities.

5. Conclusions

This study aimed to propose an integrated framework that considers accessibility and equity simultaneously to optimize the planning and layout of urban PGS within the ring road of Hefei City. Using the improved 2SFCA model, we accurately assessed the accessibility of PGS in the study area. Based on this analysis, we conducted an equity assessment and finally identified the precise locations for eight newly planned PGSs. Given the complex land use situation of the locations, we recommend timely adjustments to the PGS construction plan to align it with the actual land use. The proposed research framework effectively addressed the issue of poor accessibility and unequal distribution of PGSs within the ring road of Hefei City. It also has reference significance for the planning and construction of other types of public facilities in high-speed urbanization.

Author Contributions

Conceptualization, M.L. and D.X.; methodology, Z.C. and Q.L.; software, Z.C. and Q.L.; validation, Z.C. and Q.L.; formal analysis, Z.C.; investigation, Z.C. and Q.L.; resources, M.L. and D.X.; data curation, M.L.; writing—original draft preparation, Z.C.; writing—review and editing, Z.C. and M.L.; visualization, Z.C.; supervision, M.L.; project administration, M.L. and D.X.; funding acquisition, M.L. All authors have read and agreed to the published version of the manuscript.

Funding

This work was jointly funded by the National Natural Science Foundation of China, grant number 31971577, and the Priority Academic Program Development of Jiangsu Higher Education Institutions (PAPD).

Data Availability Statement

The data presented in this study are available on request from the corresponding author.

Conflicts of Interest

Author Da Xu was employed by the Zhejiang Forestry Survey Planning and Design Company Limited. The remaining authors declare that the research was conducted in the absence of any commercial or financial relationships that could be construed as a potential conflict of interest.

References

  1. Wolch, J.R.; Byrne, J.; Newell, J.P. Urban green space, public health, and environmental justice: The challenge of making cities ‘just green enough’. Landsc. Urban Plan. 2014, 125, 234–244. [Google Scholar] [CrossRef]
  2. Ayala-Azcárraga, C.; Diaz, D.; Zambrano, L. Characteristics of urban parks and their relation to user well-being. Landsc. Urban Plan. 2019, 189, 27–35. [Google Scholar] [CrossRef]
  3. Shams, S.R.; Jahani, A.; Kalantary, S.; Moeinaddini, M.; Khorasani, N. The evaluation on artificial neural networks (ANN) and multiple linear regressions (MLR) models for predicting SO concentration. Urban Clim. 2021, 37, 100837. [Google Scholar] [CrossRef]
  4. Wang, Y.F.; Ni, Z.B.; Chen, S.Q.; Xia, B.C. Microclimate regulation and energy saving potential from different urban green infrastructures in a subtropical city. J. Clean. Prod. 2019, 226, 913–927. [Google Scholar] [CrossRef]
  5. Lin, B.S.; Lin, C.T. Preliminary study of the influence of the spatial arrangement of urban parks on local temperature reduction. Urban For. Urban Green. 2016, 20, 348–357. [Google Scholar] [CrossRef]
  6. Chang, C.R.; Li, M.H.; Chang, S.D. A preliminary study on the local cool-island intensity of Taipei city parks. Landsc. Urban Plan. 2007, 80, 386–395. [Google Scholar] [CrossRef]
  7. Bowler, D.E.; Buyung-Ali, L.; Knight, T.M.; Pullin, A.S. Urban greening to cool towns and cities: A systematic review of the empirical evidence. Landsc. Urban Plan. 2010, 97, 147–155. [Google Scholar] [CrossRef]
  8. Dennis, M.; James, P. User participation in urban green commons: Exploring the links between access, voluntarism, biodiversity and well being. Urban For. Urban Green. 2016, 15, 22–31. [Google Scholar] [CrossRef]
  9. Carrus, G.; Scopelliti, M.; Lafortezza, R.; Colangelo, G.; Ferrini, F.; Salbitano, F.; Agrimi, M.; Portoghesi, L.; Sernenzato, P.; Sanesi, G. Go greener, feel better? The positive effects of biodiversity on the well-being of individuals visiting, urban and peri-urban green areas. Landsc. Urban Plan. 2015, 134, 221–228. [Google Scholar] [CrossRef]
  10. Jeong, D.; Kim, M.; Song, K.; Lee, J. Planning a Green Infrastructure Network to Integrate Potential Evacuation Routes and the Urban Green Space in a Coastal City: The Case Study of Haeundae District, Busan, South Korea. Sci. Total Environ. 2021, 761, 143179. [Google Scholar] [CrossRef]
  11. Coombes, E.; Jones, A.P.; Hillsdon, M. The relationship of physical activity and overweight to objectively measured green space accessibility and use. Soc. Sci. Med. 2010, 70, 816–822. [Google Scholar] [CrossRef] [PubMed]
  12. Remmers, T.; Thijs, C.; Ettema, D.; de Vries, S.; Slingerland, M.; Kremers, S. Critical Hours and Important Environments: Relationships between Afterschool Physical Activity and the Physical Environment Using GPS, GIS and Accelerometers in 10-12-Year-Old Children. Int. J. Environ. Res. Public Health 2019, 16, 3116. [Google Scholar] [CrossRef] [PubMed]
  13. Venter, Z.S.; Barton, D.N.; Gundersen, V.; Figari, H.; Nowell, M. Urban nature in a time of crisis: Recreational use of green space increases during the COVID-19 outbreak in Oslo, Norway. Environ. Res. Lett. 2020, 15, 104075. [Google Scholar] [CrossRef]
  14. Wang, S.Q.; Yung, E.H.K.; Sun, Y. Effects of open space accessibility and quality on older adults’ visit: Planning towards equal right to the city. Cities 2022, 125, 103611. [Google Scholar] [CrossRef]
  15. Reinwald, F.; Haluza, D.; Pitha, U.; Stangl, R. Urban Green Infrastructure and Green Open Spaces: An Issue of Social Fairness in Times of COVID-19 Crisis. Sustainability 2021, 13, 10606. [Google Scholar] [CrossRef]
  16. Wang, X.K.; Meng, Q.Y.; Liu, X.Z.; Allam, M.; Zhang, L.L.; Hu, X.L.; Bi, Y.X.; Jancsó, T. Evaluation of Fairness of Urban Park Green Space Based on an Improved Supply Model of Green Space: A Case Study of Beijing Central City. Remote Sens. 2023, 15, 244. [Google Scholar] [CrossRef]
  17. Kim, J.W.; Lee, K.J.; Thapa, B. Visualizing fairness: Distributional equity of urban green spaces for marginalized groups. J. Environ. Plan. Manag. 2022, 65, 833–851. [Google Scholar] [CrossRef]
  18. Hansen, W.G. How Accessibility Shapes Land Use. J. Am. Inst. Plan. 1959, 25, 73–76. [Google Scholar] [CrossRef]
  19. Zlender, V.; Thompson, C.W. Accessibility and use of peri-urban green space for inner-city dwellers: A comparative study. Landsc. Urban Plan. 2017, 165, 193–205. [Google Scholar] [CrossRef]
  20. Cetin, M. Using GIS analysis to assess urban green space in terms of accessibility: Case study in Kutahya. Int. J. Sustain. Dev. 2015, 22, 420–424. [Google Scholar] [CrossRef]
  21. Comber, A.; Brunsdon, C.; Green, E. Using a GIS-based network analysis to determine urban greenspace accessibility for different ethnic and religious groups. Landsc. Urban Plan. 2008, 86, 103–114. [Google Scholar] [CrossRef]
  22. Zhang, R.Y.; Huang, L.; Wang, H. Accessibility Improvement and Renewal of Urban Park Green Space for the Elderly and the Disabled. Forests 2023, 14, 1801. [Google Scholar] [CrossRef]
  23. Goh, S.; Lee, K.; Choi, M.; Fortin, J.Y. Emergence of Criticality in the Transportation Passenger Flow: Scaling and Renormalization in the Seoul Bus System. PLoS ONE 2014, 9, e89980. [Google Scholar] [CrossRef] [PubMed]
  24. Goh, S.; Lee, K.; Park, J.S.; Choi, M.Y. Modification of the gravity model and application to the metropolitan Seoul subway system. Phys. Rev. E 2012, 86, 026102. [Google Scholar] [CrossRef] [PubMed]
  25. Dony, C.C.; Delmelle, E.M.; Delmelle, E.C. Re-conceptualizing accessibility to parks in multi-modal cities: A Variable-width Floating Catchment Area (VFCA) method. Landsc. Urban Plan. 2015, 143, 90–99. [Google Scholar] [CrossRef]
  26. Shi, L.; Halik, Ü.; Abliz, A.; Mamat, Z.; Welp, M. Urban Green Space Accessibility and Distribution Equity in an Arid Oasis City: Urumqi, China. Forests 2020, 11, 690. [Google Scholar] [CrossRef]
  27. Rong, P.; Zheng, Z.; Kwan, M.P.; Qin, Y. Evaluation of the spatial equity of medical facilities based on improved potential model and map service API: A case study in Zhengzhou, China. Appl. Geogr. 2020, 119, 102192. [Google Scholar] [CrossRef]
  28. Wang, X.L.; Yang, H.Z.; Duan, Z.Q.; Pan, J. Spatial accessibility of primary health care in China: A case study in Sichuan Province. Soc. Sci. Med. 2018, 209, 14–24. [Google Scholar] [CrossRef]
  29. Xia, T.Q.; Song, X.; Zhang, H.R.; Song, X.Y.; Kanasugi, H.; Shibasaki, R. Measuring spatio-temporal accessibility to emergency medical services through big GPS data. Health Place 2019, 56, 53–62. [Google Scholar] [CrossRef]
  30. Dai, D.J.; Wang, F.H. Geographic disparities in accessibility to food stores in southwest Mississippi. Environ. Plan. B 2011, 38, 659–677. [Google Scholar] [CrossRef]
  31. Cheng, G.; Zeng, X.K.; Duan, L.; Lu, X.P.; Sun, H.C.; Jiang, T.; Li, Y.L. Spatial difference analysis for accessibility to high level hospitals based on travel time in Shenzhen, China. Habitat Int. 2016, 53, 485–494. [Google Scholar] [CrossRef]
  32. Polzin, P.; Borges, J.; Coelho, A. An extended kernel density two-step floating catchment area method to analyze access to health care. Environ. Plan. B 2014, 41, 717–735. [Google Scholar] [CrossRef]
  33. Li, L.J.; Du, Q.Y.; Ren, F.; Ma, X.Y. Assessing Spatial Accessibility to Hierarchical Urban Parks by Multi-Types of Travel Distance in Shenzhen, China. Int. J. Environ. Res. Public Health 2019, 16, 1038. [Google Scholar] [CrossRef]
  34. Hu, S.J.; Song, W.; Li, C.G.; Lu, J. A multi-mode Gaussian-based two-step floating catchment area method for measuring accessibility of urban parks. Cities 2020, 105, 102815. [Google Scholar] [CrossRef]
  35. Zhang, F.; Li, D.Z.; Ahrentzen, S.; Zhang, J.K. Assessing spatial disparities of accessibility to community-based service resources for Chinese older adults based on travel behavior: A city-wide study of Nanjing, China. Habitat Int. 2019, 88, 101984. [Google Scholar] [CrossRef]
  36. Haaland, C.; van den Bosch, C.K. Challenges and strategies for urban green-space planning in cities undergoing densification: A review. Urban For. Urban Green. 2015, 14, 760–771. [Google Scholar] [CrossRef]
  37. Kerishnan, P.B.; Maruthaveeran, S.; Maulan, S. Investigating the usability pattern and constraints of pocket parks in Kuala Lumpur, Malaysia. Urban For. Urban Green. 2020, 50, 126647. [Google Scholar] [CrossRef]
  38. Li, Z.M.; Fan, Z.X.; Song, Y.; Chai, Y.B. Assessing equity in park accessibility using a travel behavior-based G2SFCA method in Nanjing, China. J. Transp. Geogr. 2021, 96, 103179. [Google Scholar] [CrossRef]
  39. Zhang, D.L.; Ma, S.F.; Fan, J.H.; Xie, D.X.; Jiang, H.Y.; Wang, G.W. Assessing spatial equity in urban park accessibility: An improve two-step catchment area method from the perspective of 15-mintue city concept. Sustain. Cities Soc. 2023, 98, 104824. [Google Scholar] [CrossRef]
  40. Kong, L.Q.; Liu, Z.F.; Pan, X.H.; Wang, Y.H.; Guo, X.; Wu, J.G. How do different types and landscape attributes of urban parks affect visitors? positive emotions? Landsc. Urban Plan. 2022, 226, 104482. [Google Scholar] [CrossRef]
  41. Ren, X.Y.; Guan, C.H. Evaluating geographic and social inequity of urban parks in Shanghai through mobile phone-derived human activities. Urban For. Urban Green. 2022, 76, 127709. [Google Scholar] [CrossRef]
  42. Kong, X.Q.; Sun, Y.; Xu, C.Y. Effects of Urbanization on the Dynamics and Equity of Access to Urban Parks from 2000 to 2015 in Beijing, China. Forests 2021, 12, 1796. [Google Scholar] [CrossRef]
  43. Wüstemann, H.; Kalisch, D.; Kolbe, J. Access to urban green space and environmental inequalities in Germany. Landsc. Urban Plan. 2017, 164, 124–131. [Google Scholar] [CrossRef]
  44. Yu, H.; Yu, S.; He, D.; Lu, Y. Equity analysis of Chinese physician allocation based on Gini coefficient and Theil index. BMC Health Serv. Res. 2021, 21, 455. [Google Scholar] [CrossRef] [PubMed]
  45. Wen, C.; Albert, C.; Haaren, C.v. Equality in access to urban green spaces: A case study in Hannover, Germany, with a focus on the elderly population. Urban For. Urban Green. 2020, 55, 126820. [Google Scholar] [CrossRef]
  46. Wu, J.; He, Q.; Chen, Y.; Lin, J.; Wang, S. Dismantling the fence for social justice? Evidence based on the inequity of urban green space accessibility in the central urban area of Beijing. Environ. Plan. B Urban Anal. City Sci. 2018, 47, 626–644. [Google Scholar] [CrossRef]
  47. Guan, X.; Wei, H.; Lu, S.; Dai, Q.; Su, H. Assessment on the urbanization strategy in China: Achievements, challenges and reflections. Habitat Int. 2018, 71, 97–109. [Google Scholar] [CrossRef]
  48. Ha, J.; Kim, H.J.; With, K.A. Urban green space alone is not enough: A landscape analysis linking the spatial distribution of urban green space to mental health in the city of Chicago. Landsc. Urban Plan. 2022, 218, 104309. [Google Scholar] [CrossRef]
  49. Yao, X.; Yu, K.Y.; Zeng, X.J.; Lin, Y.B.; Ye, B.J.; Shen, X.B.; Liu, J. How can urban parks be planned to mitigate urban heat island effect in “Furnace cities”? An accumulation perspective. J. Clean. Prod. 2022, 330, 129852. [Google Scholar] [CrossRef]
  50. Wu, W.; Ding, K.W. Optimization Strategy for Parks and Green Spaces in Shenyang City: Improving the Supply Quality and Accessibility. Int. J. Environ. Res. Public Health 2022, 19, 4443. [Google Scholar] [CrossRef]
  51. Li, C.Y.; Zhang, T.T.; Wang, X.; Lian, Z.F. Site Selection of Urban Parks Based on Fuzzy-Analytic Hierarchy Process (F-AHP): A Case Study of Nanjing, China. Int. J. Environ. Res. Public Health 2022, 19, 13159. [Google Scholar] [CrossRef] [PubMed]
  52. Eberhart, R.; Kennedy, J. A new optimizer using particle swarm theory. In Proceedings of the MHS’95—Sixth International Symposium on Micro Machine and Human Science, Nagoya, Japan, 4–6 October 1995; pp. 39–43. [Google Scholar]
  53. Huang, Y.F.; Yu, P.C.; Xie, P. Analysis and Optimized Location Selection of Comprehensive Green Space Supply in the Central Urban Area of Hefei Based on GIS. Buildings 2023, 13, 2731. [Google Scholar] [CrossRef]
  54. Wu, S.W.; Yao, X.J.; Qu, Y.Q.; Chen, Y.W. Ecological Benefits and Plant Landscape Creation in Urban Parks: A Study of Nanhu Park, Hefei, China. Sustainability 2023, 15, 16553. [Google Scholar] [CrossRef]
  55. Li, Y.Y.; Ren, B.T.; Chen, Y.S.; Huang, L.C.; Sun, C.G. Multiscale spatiotemporal dynamics analysis of urban green space: Implications for green space planning in the rapid urbanizing Hefei City, China. Front. Ecol. Evol. 2022, 10, 998111. [Google Scholar] [CrossRef]
  56. GBT51346-2019; Standard for Planning of Urban Green Space. China Architecture & Building Press: Beijing, China, 2019.
  57. Millward, H.; Spinney, J.; Scott, D. Active-transport walking behavior: Destinations, durations, distances. J. Transp. Geogr. 2013, 28, 101–110. [Google Scholar] [CrossRef]
  58. Gong, F.-Y. Modeling walking accessibility to urban parks using Google Maps crowdsourcing database in the high-density urban environments of Hong Kong. Sci. Rep. 2023, 13, 20798. [Google Scholar] [CrossRef]
  59. GB50180-2018; Standard for Urban Residential Area Planning and Design. CAUPD: Beijing, China, 2018.
  60. Liu, Z.; Yang, H.; Xiong, W.; Chen, G. Spatial Accessibilities of Medical Services at County Level Based on Optimized Two-step Floating Catchment Area Method. Sci. Geogr. Sin. 2017, 37, 728–737. [Google Scholar] [CrossRef]
  61. Dai, D. Racial/ethnic and socioeconomic disparities in urban green space accessibility: Where to intervene? Landsc. Urban Plan. 2011, 102, 234–244. [Google Scholar] [CrossRef]
  62. Zhang, S.J.; Yu, P.H.; Chen, Y.Y.; Jing, Y.; Zeng, F.N. Accessibility of Park Green Space in Wuhan, China: Implications for Spatial Equity in the Post-COVID-19 Era. Int. J. Environ. Res. Public Health 2022, 19, 5440. [Google Scholar] [CrossRef]
  63. Sun, Y.; Tian, D.W.; Zhang, M.; Hou, Y. Spatial Green Space Accessibility in Hongkou District of Shanghai Based on Gaussian Two-Step Floating Catchment Area Method. Buildings 2023, 13, 2477. [Google Scholar] [CrossRef]
  64. Anselin, L. Local Indicators of Spatial Association—LISA. Geogr. Anal. 2010, 27, 93–115. [Google Scholar] [CrossRef]
  65. Tiefelsdorf, M.; Boots, B. The Exact Distribution of Moran’s I. Environ. Plan. A 1995, 27, 985–999. [Google Scholar] [CrossRef]
  66. Delbosc, A.; Currie, G. Using Lorenz curves to assess public transport equity. J. Transp. Geogr. 2011, 19, 1252–1259. [Google Scholar] [CrossRef]
  67. Feng, S.; Chen, L.D.; Sun, R.H.; Feng, Z.Q.; Li, J.R.; Khan, M.S.; Jing, Y.C. The Distribution and Accessibility of Urban Parks in Beijing, China: Implications of Social Equity. Int. J. Environ. Res. Public Health 2019, 16, 4894. [Google Scholar] [CrossRef] [PubMed]
  68. Xiao, Y.; Wang, Z.; Li, Z.G.; Tang, Z.L. An assessment of urban park access in Shanghai—Implications for the social equity in urban China. Landsc. Urban Plan. 2017, 157, 383–393. [Google Scholar] [CrossRef]
  69. Jain, A.K. Data clustering: 50 years beyond K-means. Pattern Recognit. Lett. 2010, 31, 651–666. [Google Scholar] [CrossRef]
  70. Deng, W.; Zhao, H.M.; Yang, X.H.; Xiong, J.X.; Sun, M.; Li, B. Study on an improved adaptive PSO algorithm for solving multi-objective gate assignment. Appl. Soft Comput. 2017, 59, 288–302. [Google Scholar] [CrossRef]
  71. Niu, Y.Y.; Yu, J.; Lu, D.W.; Mu, R.W.; Wen, J.H. Spatial Allocation Method of Evacuation Guiders in Urban Open Public Spaces: A Case Study of Binjiang Green Space in Xuhui District, Shanghai, China. Int. J. Environ. Res. Public Health 2022, 19, 12293. [Google Scholar] [CrossRef]
  72. Pei, X.R.; Guo, P.; Chen, Q.Y.; Li, J.R.; Liu, Z.F.; Sun, Y.L.; Zhang, X.K. An Improved Multi-Mode Two-Step Floating Catchment Area Method for Measuring Accessibility of Urban Park in Tianjin, China. Sustainability 2022, 14, 11592. [Google Scholar] [CrossRef]
  73. Li, Y.M.; Xie, Y.L.; Sun, S.Q.; Hu, L.F. Evaluation of Park Accessibility Based on Improved Gaussian Two-Step Floating Catchment Area Method: A Case Study of Xi’an City. Buildings 2022, 12, 871. [Google Scholar] [CrossRef]
  74. Chen, Y.-S.; Huang, Q.-F.; Zhang, Y.-C.; Li, Y.-Y. GIS-based analysis and evaluation for the accessibility of urban green in the central city of Hefei. J. China Agric. Univ. 2015, 20, 220–236. [Google Scholar] [CrossRef]
  75. Wu, Q.Y.; Zhang, X.L.; Waley, P. Jiaoyufication: When gentrification goes to school in the Chinese inner city. Urban Stud. 2016, 53, 3510–3526. [Google Scholar] [CrossRef]
  76. Almohamad, H.; Knaack, A.L.; Habib, B.M. Assessing Spatial Equity and Accessibility of Public Green Spaces in Aleppo City, Syria. Forests 2018, 9, 706. [Google Scholar] [CrossRef]
  77. Zhang, Y.; Tarrant, M.A.; Green, G.T. The importance of differentiating urban and rural phenomena in examining the unequal distribution of locally desirable land. J. Environ. Manag. 2008, 88, 1314–1319. [Google Scholar] [CrossRef] [PubMed]
  78. Xu, M.Y.; Xin, J.; Su, S.L.; Weng, M.; Cai, Z.L. Social inequalities of park accessibility in Shenzhen, China: The role of park quality, transport modes, and hierarchical socioeconomic characteristics. J. Transp. Geogr. 2017, 62, 38–50. [Google Scholar] [CrossRef]
  79. Chen, Y.Y.; Men, H.; Ke, X.L. Optimizing urban green space patterns to improve spatial equity using location-allocation model: A case study in Wuhan. Urban For. Urban Green. 2023, 84, 127922. [Google Scholar] [CrossRef]
  80. Yu, J.Q.; Zhou, K.L.; Yang, S.L. Land use efficiency and influencing factors of urban agglomerations in China. Land Use Policy 2019, 88, 104143. [Google Scholar] [CrossRef]
  81. Chang, Z.; Chen, J.Y.; Li, W.F.; Li, X. Public transportation and the spatial inequality of urban park accessibility: New evidence from Hong Kong. Transp. Res. D Transp. Environ. 2019, 76, 111–122. [Google Scholar] [CrossRef]
  82. Kurowska, K.; Adamska-Kmiec, D.; Kowalczyk, C.; Len, P. Communication value of urban space in the urban planning process on the example of a Polish city. Cities 2021, 116, 103282. [Google Scholar] [CrossRef]
Figure 1. Map of the study area. (a) The administrative districts of Hefei City; (b) the topography of the study area.
Forests 15 00570 g001
Figure 2. Spatial distribution of different types of PGSs in the study area.
Forests 15 00570 g002
Figure 3. Technical flow chart.
Forests 15 00570 g003
Figure 4. The distribution characteristics of the PGS (a), population (b), and settlements (b) in the study area.
Forests 15 00570 g004
Figure 5. Spatial accessibility differences graded for different PGS types.
Forests 15 00570 g005
Figure 6. Overall accessibility distribution of PGSs at subdistrict scale.
Forests 15 00570 g006
Figure 7. Spatial distribution of the clusters of PGS accessibility.
Forests 15 00570 g007
Figure 8. Lorentz curve of the accessibility of PGS at district scale (red line). Black line represents absolute equity of distribution.
Forests 15 00570 g008
Figure 9. Lorentz curves of the accessibility to different types of PGSs at the subdistrict scale (red lines). (a) represents the Lorentz curve of the accessibility to residential neighborhood-level parks, (b) represents the Lorentz curve of the accessibility to residential-level parks, and (c) represents the Lorentz curve of the accessibility to municipal parks. Black lines represent absolute equity of distribution.
Forests 15 00570 g009
Figure 10. Map of the spatially divergent patterns of average house prices in residential compounds in the study area.
Forests 15 00570 g010
Figure 11. Plot of the sum of squares of errors (SSE) versus the k value for the number of clusters.
Forests 15 00570 g011
Figure 12. Location of the newly recommended PGSs from implementing PSO algorithm.
Forests 15 00570 g012
Figure 13. The feasibility validation of the newly planned PGSs via Google Earth high-resolution images.
Forests 15 00570 g013
Table 1. Results of the correlation analysis between house price and accessibility.
TypesDescriptionCorrelation CoefficientValue
Accessibilityaccessibility of residential neighborhood-level parkKendall0.017
Spearman0.042
accessibility of residential-level parkKendall0.287 **
Spearman0.317 **
accessibility of municipal parkKendall0.305 **
Spearman0.404 **
** means significant at 1% confidence level.
Disclaimer/Publisher’s Note: The statements, opinions and data contained in all publications are solely those of the individual author(s) and contributor(s) and not of MDPI and/or the editor(s). MDPI and/or the editor(s) disclaim responsibility for any injury to people or property resulting from any ideas, methods, instructions or products referred to in the content.

