Article

Spatio-Temporal Dynamics of Normalized Difference Vegetation Index and Its Response to Climate Change in Xinjiang, 2000–2022

1
College of Geography and Remote Sensing Sciences, Xinjiang University, Urumqi 830046, China
2
Key Laboratory of Oasis Ecology, Xinjiang University, Urumqi 830046, China
*
Author to whom correspondence should be addressed.
Forests 2024, 15(2), 370; https://doi.org/10.3390/f15020370
Submission received: 6 January 2024 / Revised: 11 February 2024 / Accepted: 14 February 2024 / Published: 16 February 2024
(This article belongs to the Special Issue Application of Remote Sensing in Vegetation Dynamic and Ecology)

Abstract

:
Based on the NDVI and climate data from 2000 to 2022, this study systematically investigated the spatial and temporal patterns, trend characteristics, and stability of the NDVI in Xinjiang using the one-way linear regression method, Theil–Sen Median trend analysis, the Mann–Kendall significance test, and the coefficient of variation. Meanwhile, the persistence of the NDVI distribution was analyzed by combining the trend results and Hurst index. Finally, partial correlation analysis was used to deeply explore the response mechanisms of interannual and seasonal-scale NDVI and climatic factors in Xinjiang, and the characteristics of multi-year vegetation distribution were comprehensively analyzed with the help of human footprint data. The findings indicate the following: (1) The NDVI of interannual and seasonal vegetation in Xinjiang showed a significant increasing trend during the 23-year period, but the spatial distribution was heterogeneous, and the improvement of the vegetation condition in the southern part of the region was remarkable. (2) The NDVI is relatively stable across the region. Unlike in other regions, in general, it is difficult to maintain the existing trend in NDVI in the study area for a long period of time, and the reverse trend is more persistent. (3) On the interannual scale, both precipitation and temperature are positively correlated with the NDVI, and the influence of temperature (80.94%) is greater than that of precipitation (63.82%). Precipitation was dominantly positively correlated with the NDVI in spring, summer, and the growing season, while it was negatively correlated with it in autumn. Temperature and NDVI were positively correlated, with the greatest influence in the spring. (4) Human activities had the greatest impact on the areas with low vegetation cover and areas with medium–low vegetation cover, and there was a high degree of overlap between the areas where the interannual human footprints and NDVI showed an increasing trend. The percentage of human footprints that significantly correlated with interannual NDVI was 34.79%. In the future, the protection and management of ecologically fragile areas should be increased to increase desert-vegetation cover.

1. Introduction

The Normalized Difference Vegetation Index (NDVI) holds significance as a crucial indicator that reflects essential details regarding surface vegetation cover and growth conditions [1,2]. Its widespread utilization extends to the examination of extensive alterations in vegetation cover and their environmental repercussions. Moreover, it serves the purpose of monitoring fluctuations in vegetation and elucidating the influences of diverse weather events on the human habitat [3]. Within the present realm of global vegetation change and ecological environmental protection research, the surveillance of extensive and prolonged vegetation alterations, coupled with the analysis of diverse causative factors, has evolved into a crucial component [4]. The extensive time series of NDVI data can illuminate the climatic attributes and cyclical fluctuations in vegetation over time, offering insights into the impacts of both climate and human activities on vegetation [5,6,7]. Climate change is recognized as the main driver influencing changes in the NDVI, and at the same time, vegetation provides important feedback on the extent of climate change impacts. Prior research has indicated the heightened sensitivity of vegetation growth to climate variations [8]. Consequently, monitoring vegetation dynamics and assessing the response of vegetation to climatic conditions has become a key area of interest for global research [9,10,11]. In addition, the exploration of the intricate connections between the NDVI and climate change has emerged as a pivotal focus in global vegetation research [12].
In recent years, there has been a notable surge of interest in the study of the NDVI, particularly in the realm of vegetation dynamics and the intricate interplay between vegetation and climatic factors [13]. The correlation between NDVI and precipitation, as well as temperature, exhibits pronounced geographical variations. Climate, directly or indirectly, governs the availability of heat, water, and nutrients, thereby influencing the growth and coverage of vegetation and shaping living conditions for plants [14].
Precipitation and temperature are recognized as the two primary climatic elements that exert a substantial impact on the dynamics of vegetation. As an illustration, studies on central Eurasia have found that the accelerated growth of vegetation in the spring is due to rapid warming, while precipitation is the main influence during the growing season and in summer [15]. Grasslands in North America are more sensitive to precipitation than shrublands [16]. A study of NDVI changes in the northern foothills of Tianshan between 1982 and 2000, and the drivers of these changes, concluded that localized increases in the NDVI resulted from increased precipitation slowing local drought stress [17]. A previous study was carried out to evaluate the correlation between seasonal changes in the NDVI of Asian vegetation and factors such as temperature, precipitation, and evapotranspiration between 1982 and 2014. The results demonstrated that changes in temperature were the most important factor causing changes in the NDVI [18]. Temperature plays a crucial role in plant growth, and suitable temperatures can promote plant growth. In the Northern Hemisphere, the NDVI in spring and summer is significantly correlated with temperature in middle and high latitudes [19]. However, it has also been pointed out that the NDVI in northern China is more strongly correlated with temperature than with precipitation [20]. Furthermore, in the arid and semi-arid regions of inland northwest China, the lack of precipitation can greatly hinder the growth of vegetation and is the main factor affecting vegetation [21].
While many studies have concentrated on assessing the interannual trends in the NDVI and its determinants, it becomes essential to conduct a more comprehensive examination of the seasonal variations in vegetation-cover changes and their influencing factors. In Xinjiang, however, due to the snow-covered or non-vegetated winter conditions, it is necessary to more systematically research the trend in changes in vegetation cover and the factors affecting this on a quarter-by-quarter basis.
The arid regions of northwest China have been affected by many changes in the global climate in recent decades, especially the obvious trend of increasing temperature [22]. This transformation has notably influenced the local vegetation conditions, indicating a distinct trend in enhancement. Human activities also affect vegetation changes. In the process of urban development, a large amount of natural surface vegetation has been converted to living space, resulting in the localized degradation of vegetation [23]. In recent years, China has undertaken a series of ecological initiatives, including projects such as reforesting farmlands and establishing ecological protection forests. These endeavors have played a proactive role in rejuvenating regional vegetation [24,25,26]. For example, since 1978, the Chinese government has launched various ecological restoration programs in many places, including the Three-North Protective Forest Project, the Return of Farmland to Forest Project, and the Natural Forest Protection Project. Through ecological restoration in the past decades, the local protective forest system has been established with the main objective of preventing wind and fixing sand, and the vegetation cover has increased significantly. However, this has been accompanied by a rise in water consumption in some areas, which has hindered the development of vegetation.
In light of this, the primary goal of this study is to scrutinize the spatial and temporal variations in the NDVI and its responsiveness to climate fluctuations in Xinjiang from 2000 to 2022. This research focusses on the following periods in order to gain a more nuanced understanding of the NDVI’s seasonal dynamics and its interaction with climate shifts: the interannual growing season (May–October), spring (March–May), summer (June–August), and autumn (September–November). The purpose of this study is as follows: (1) to examine the spatial and temporal patterns of the NDVI and climate trends on the interannual, growing season, and seasonal scales spanning the last 23 years in Xinjiang; (2) to assess the stability and prospective sustainability of the NDVI; (3) to study the response relationship and spatial distribution of the NDVI with climatic factors; and (4) to analyze the spatial correlation between human footprint data and the NDVI.

2. Materials and Methods
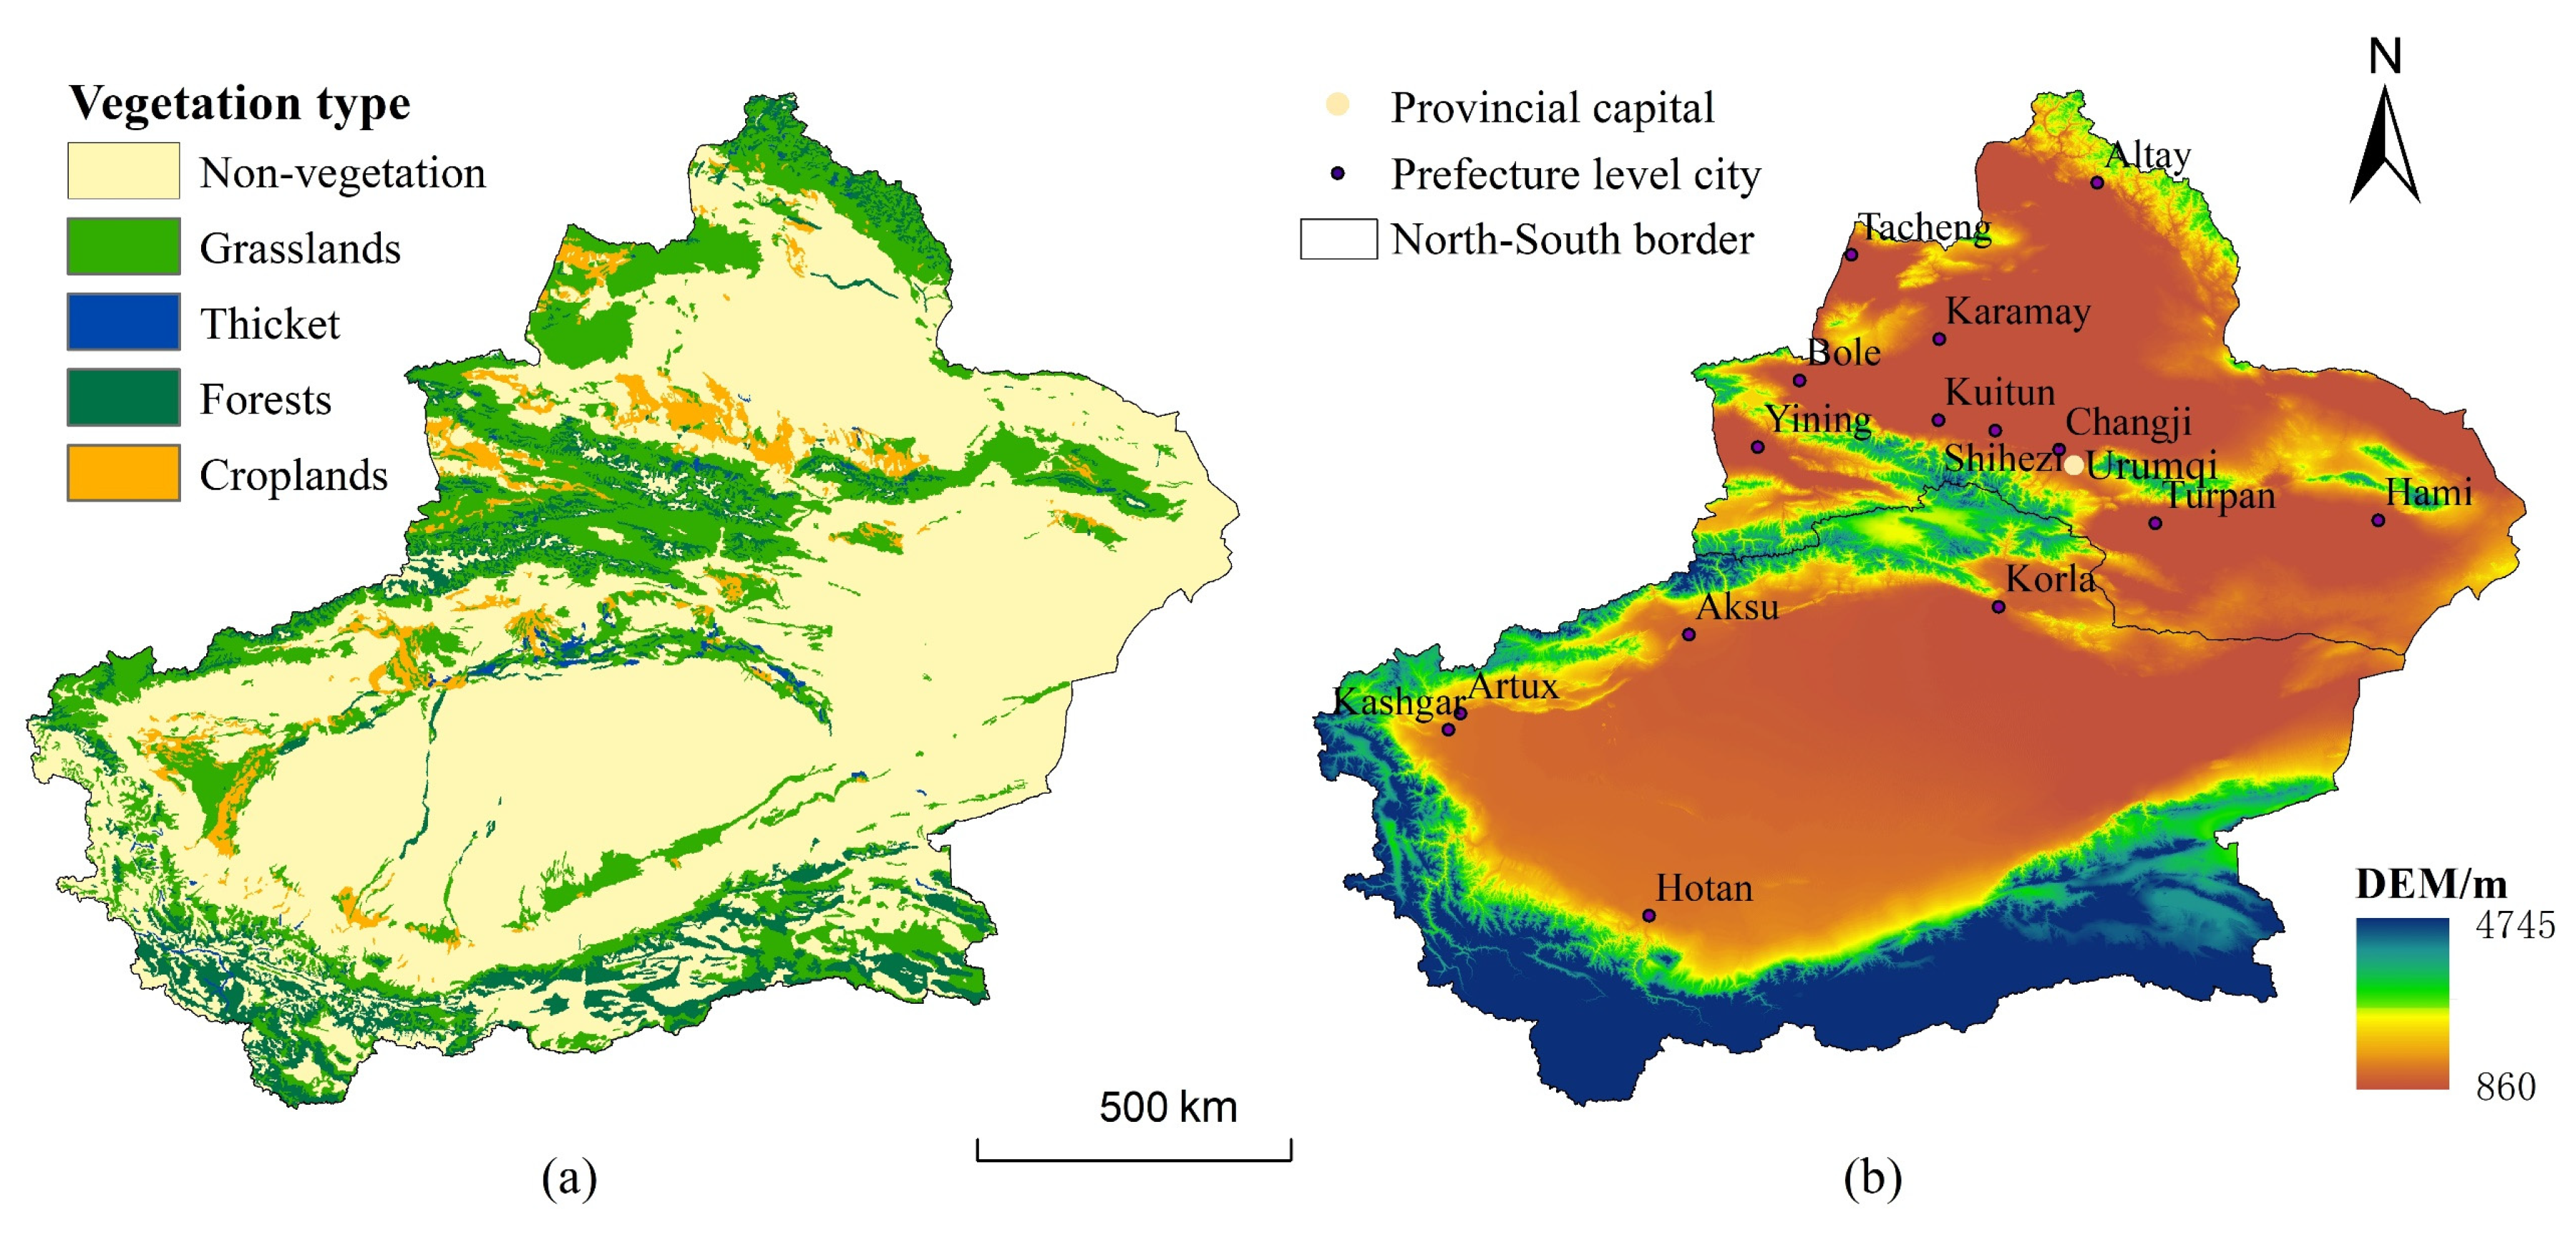
2.1. Study Area

The Xinjiang Uygur Autonomous Region (XUAR), located on the northwestern border of China, has geographic coordinates ranging from 73°40′ to 96°18′ east longitude and 34°25′ to 48°10′ north latitude, with a total area of 1.66 million square kilometers. The region’s topography and landforms are diverse, showing an overall distribution of “three mountains and two basins”, including the Kunlun Mountains, Tianshan Mountains, Taklamakan Desert, and other geographic features. In particular, the Tianshan Mountains divide the area into two regions, north and south, with the Tarim Basin in the south and the Junggar Basin in the north [27]. Xinjiang belongs to the temperate continental climate region, and because of its vast geographical extent, its climate varies significantly across diverse regions. The northern area primarily experiences a continental climate characterized by chilly and arid winters, along with brief, warm summers. In the southern part, the prevailing climate is mostly characterized by a temperate arid condition, featuring hot and dry summers alongside relatively mild winters. Xinjiang has a variety of vegetation types, with coniferous forests and alpine meadows predominating in the mountainous regions, grasslands mostly in the northern and northern basins, and only a very small amount of desert plants in the desert regions. Meanwhile, the river valleys are usually characterized by scrub and riverine vegetation (Figure 1). Most of Xinjiang is in an arid region with scant precipitation and water scarcity, especially in places such as the Taklamakan Desert and the Kumtag Desert, where the degree of aridity is particularly severe. In general, Xinjiang is characterized by serious land desertification, the gradual expansion of bare land, and a very fragile ecological environment.

2.2. Data Preparation

The data for the Normalized Difference Vegetation Index (NDVI) were sourced from the China Regional 250 m NDVI dataset provided by the National Tibetan Plateau Science Data Center (https://cstr.cn/18406.11.Terre.tpdc.300328, accessed on 9 July 2023), using monthly maximum value synthesis. This was based on the MOD13Q1 product of the Aqua/Terra MODIS satellite sensors as well as the land-use data. The data were generated by the processes of the preliminary reconstruction of noise pixels of the same type of features from single-period images, long-time sequence image S-G filtering, retaining high-quality pixels, the 16-day synthesis of monthly products, and China-wide splicing, etc. [28]. The spring (3–5), summer (6–8), autumn (9–11), growing season (4–10), and interannual NDVI data were acquired using the mean value synthesis method [29,30]. In prior investigations [31,32], the NDVI of the site was categorized into areas with low vegetation cover (less than 0.1), areas with medium–low vegetation cover (0.1–0.2), areas with medium vegetation cover (0.2–0.3), areas with medium–high vegetation cover (0.3–0.4), and areas with high vegetation cover (0.4–0.7).
The month-by-month precipitation and temperature dataset with a 1 km resolution, employed in this study, was acquired from the National Geosystems Science Data Center (NGSDC) (http://www.geodata.cn, accessed on 26 September 2023). This dataset was created through delta spatial downscaling techniques, utilizing the global 0.5° climate data provided by CRU and the high-resolution global climate data from WorldClim. To ensure the reliability of the results, the dataset underwent validation using data from 496 independent meteorological observations.
The spatial distribution of 1 million vegetation types in China was obtained from the Center for Resource and Environmental Science and Data, Chinese Academy of Sciences (CAS) (http://www.resdc.cn, accessed on 11 October 2023). This study categorizes the vegetation types into five groups based on the first-level classification, namely crops, forests, thickets, grasslands, and non-vegetated areas. The elevation data for China’s topography (DEM) is derived from the shuttle radar topography mission (SRTM) data collected by the U.S. space shuttle Endeavour, with a data accuracy of 250 m.
The global human footprint data use eight variables (accessed on 20 October 2023), including nighttime lights, agricultural land, pasture land, the built environment, roads, population density, railroads, and navigable waterways. The dataset reflects human pressures and allows for a better understanding of the scope and intensity of the impacts of human activities. Values range from 0 to 50, where values from 0 to 1 indicate that the site is not affected by human activities, values from 1 to 4 indicate that the site is slightly affected by human activities, and values from 4 to 50 indicate that the site is highly affected by human activities [33].
In this paper, ArcGIS10.8 (Redlands, CA, USA), MATLAB R2021a (Natick, MA, USA), and ENVI5.6 (Melbourne, FL, USA) are utilized to perform format conversion, projection transformation, resampling, and cropping operations on the above data to obtain data with uniform projection and spatial resolution.

2.3. Research Methods

2.3.1. Trend Analysis and Testing

The calculation of long-time-series vegetation trends in the study area were carried out using the Theil–Sen Median trend analysis [34]. The calculation formula is as follows:
β = M e d i a n ( N D V I j N D V I i j i ) , j > i
In the formula, β denotes the direction of vegetation change, where N D V I i and N D V I j stand for the NDVI values at time points i and j, respectively. A positive β > 0 indicates an increase in NDVI, whereas a negative β implies a decrease in the NDVI trend.
The Mann–Kendall (M–K) test serves as a nonparametric statistical technique designed for analyzing trends in time-series data. One of its key strengths lies in its independence from the assumption of normal distribution or linearity in trends. Moreover, the M–K test remains unaffected by missing values and outliers. This method is frequently employed to identify trends in precipitation and the frequency of drought occurrences, particularly in the context of climate change impact [35].
The process unfolds as follows: Begin with the sequence x t = x 1 ,   x 2 , x n and initially establish the correlation between the magnitude of x i and x j (designated as S) for all pairs of values ( x i , x j , j > i). Operate under the following assumptions: H0, positing that the data in the series are arranged randomly, indicating an absence of a significant trend; and H1, suggesting the presence of an upward or downward trend in the series. The test statistic S is computed as follows (in the formula for Z, when S > 0, the numerator becomes S-1):
S = i 1 n 1 j = i + 1 n s i g n ( x j x i )
where s i g n () is the sign function, calculated as follows:
s i g n ( x j x i ) = { 1 ( x j x i > 0 ) 0 ( x j x i = 0 ) 1 ( x j x i < 0 )
Trend tests were performed using the test statistic Z. The Z value was calculated as follows:
Z = { S 1 V a r ( S ) ( S > 0 ) 0 ( S = 0 ) S + 1 V a r ( S ) ( S < 0 )
where Var is calculated via the following formula:
V a r ( S ) = n ( n 1 ) ( 2 n + 5 ) 18
Here, n is the number of data in the sequence and V a r ( S ) is the variance of S.
The same bilateral trend test is used, and the critical value Z 1 α / 2 is located within the normal distribution table at the specified significance level. If | Z | Z 1 α / 2 , the initial hypothesis is accepted, signifying that the trend lacks significance. Conversely, if Z > Z 1 α / 2 , the original hypothesis is rejected, indicating a significant trend. In this study, with a significance level α of 0.05, the critical value Z 1 α / 2 is ±1.96. When the absolute value of Z surpasses 1.65, 1.96, and 2.58, it signifies that the trend successfully passes the significance test with confidence levels of 90%, 95%, and 99%, respectively.
In this study, the NDVI trends in vegetation in Xinjiang were categorized into nine groups, including extremely significant degradation, significant degradation, slightly significant degradation, no significant degradation, no significant change, no significant improvement, slightly significant improvement, significant improvement and extremely significant improvement.

2.3.2. Coefficient of Variation

This study used the coefficient of variation to assess the fluctuation characteristics of the NDVI between 2000 and 2022 [36,37]. The formula is as follows:
C V = σ N D V I ¯
Here, C V represents the coefficient of variation, where σ is the standard deviation, and N D V I ¯ is the mean value.

2.3.3. Hurst Index

This study utilized the Hurst index to forecast the future trajectory of the NDVI in Xinjiang across various seasons. The Hurst index, assessed through rescaled range analysis (R/S), proves to be an effective method for gauging the long-term dependence or persistence within a time series [38,39,40]. Specifically, a Hurst index greater than 0.5 signifies positive long-term correlation in the NDVI series. When the Hurst index equals 0.5, it suggests that NDVI changes follow a random pattern, lacking correlation with the past. Conversely, a Hurst index of less than 0.5 indicates a reverse long-term correlation characteristic in the NDVI series [41].

2.3.4. Partial Correlation Analysis

The image-by-image meta-correlation analysis of vegetation with climatic factors (e.g., annual cumulative precipitation and annual mean temperature) using the partial correlation coefficient method is a common method used to characterize the response of vegetation change to climatic factors.
The partial correlation coefficients range from −1 to 1, where −1 signifies a perfect negative correlation, 1 denotes a perfect positive correlation, and 0 indicates no correlation. Given that both temperature and precipitation impact NDVI, partial correlation analysis can mitigate the influence of a third variable, allowing for a separate examination of the correlation between the initial two variables [42]. The calculation formula is as follows:
r x y · z = r x y r x z   ·   r y z ( 1 r x z 2 ) ( 1 r y z 2 ) r x z · y = r x z r x y   ·   r y z ( 1 r x y 2 ) ( 1 r y z 2 )
Here, r x y · z represents the partial correlation coefficient between NDVI and y after excluding the effect of z, r x z · y denotes the partial correlation coefficient between NDVI and z after excluding the effect of y, while r x y , r x z , and r y z represents the ordinary correlation coefficients between x and y, x and z, and y and z, respectively.
The partial correlation coefficients were tested for significance, and the significance was judged according to the magnitude of the coefficients. The critical value of significance was obtained from the correlation coefficients’ significance t-test table (when the number of samples was 23, and the critical value r at the α = 0.05 and α = 0.01 significance levels were 2.08 and 2.831, respectively).
The outcomes were categorized into six groups according to the test results: extremely significant negative correlation (min ≤ r < −2.831), significant negative correlation (−2.831 < r < −2.08), non-significant negative correlation (−2.08 < r < 0), non-significant positive correlation (0 < r < 2.08), significant positive correlation (2.08 < r < 2.831), and extremely significant positive correlation (2.831 < r ≤ max).

3. Results

3.1. Trend Analysis of the NDVI and Climatic Factors

3.1.1. Analysis of Interannual Temporal and Spatial Variations

Over the period of 2000 to 2022, the annual mean NDVI in Xinjiang exhibited a fluctuating upward trajectory. The overall growth rate stood at 0.4656 per annum, with a multi-year average of 0.148. The peak annual average, recorded in 2019, reached 0.1756, while the lowest annual average, observed in 2000, was 0.1575. This trend underscores the effectiveness of vegetation restoration efforts in the region. Throughout this timeframe, the average annual precipitation in Xinjiang demonstrated a fluctuating downward trend, with an overall decreasing rate of 0.279 mm/a, and a multi-year average value of 110.94 mm, with the highest average annual precipitation of 143.77 mm (2016) and the lowest of 92.93 mm (2022). The mean annual temperature showed a fluctuating increasing trend and insignificant warming, with a cumulative increase rate of 0.0158 °C per annum, and a multi-year average of 6.08 °C. The mean annual temperature rose to a maximum of 6.67 °C in 2007 and declined to a minimum of 5.27 °C in 2012 (Figure 2).
On a spatial scale, the distribution of the NDVI in Xinjiang is spatially heterogeneous. As is depicted in Figure 3, the spatial distribution of the NDVI is predominantly shaped by topography and landscape, with an overall pattern that exhibits higher values in the north compared to the south and higher values in the west compared to the east. Among the regions with an elevated annual mean NDVI were the Ili Valley area, the Tianshan Mountains, the Altai Mountains, and the Kunlun Mountains. Additionally, the oases surrounding the Junggar Basin and Tarim Basin exhibited the second-highest mean annual NDVI values. Desert areas such as the Taklamakan Desert, Kumutag Desert, Gurbantunggut Desert, Turpan Basin, and Hami Basin are sparsely vegetated, and only the Tarim River and its tributaries, the Kashgar, Yarkand, and Hotan Rivers, have a small amount of desert vegetation along them. These places have the lowest annual average NDVI values, mostly less than 0.1, so they will not be studied in detail in this paper.
Due to the special geographic location of the study area, coupled with the arid and low rainfall climatic characteristics and the geomorphological features of high deserts, it has the largest proportion of both areas with low vegetation cover and those with medium–low vegetation cover, with a total of 85.72%. The study area is characterized mainly by non-vegetated areas, i.e., deserts, saline, and alkaline soils, etc., and sparse grasslands. The areas with medium vegetation cover represent 7.80%, of which 4.69% is grassland and 1.36% represents crops. The proportion of areas with medium–high vegetation cover is 4.99%, mainly comprising grassland (2.53%) and crops (1.54%). However, areas with high vegetation cover, mostly grassland and forests, occupy only 1.49% of the total study area.
Analyzing the trend in the interannual NDVI reveals that the average annual NDVI across the entire region exhibited a decreasing trend, with a rate of change ranging between −0.19 and 0.25 per 10 years (Figure 4a). Notably, 88.95% of these trends indicated an increasing pattern. Moreover, this increase was predominantly characterized by an extremely significant improvement, signifying a noteworthy enhancement in vegetation-cover conditions within the Xinjiang region over the past 23 years.
The spatial distribution of precipitation in the study area ranged from −9.70 to 7.76 mm/a, with 0.2% of the area indicating an increasing trend in precipitation, predominantly observed in the Kunlun Mountains and the hinterland of the Taklamakan Desert. Conversely, 99.8% of the area exhibited a decreasing trend in precipitation. Regarding temperature, the spatial trend ranged from −0.12 to 0.17 °C/a, with 89.25% of the areas showing an increasing temperature trend and 10.75% indicating a decreasing trend, primarily observed in the Taklamakan Desert. Overall, areas with higher levels of urbanization and more frequent human activities may experience vegetation degradation as a result of urban sprawl.

3.1.2. Analysis of Seasonal Temporal Variations

The trend results of the NDVI and climatic factors in various seasons from 2000 to 2022 in the Xinjiang region exhibited distinct temporal and spatial differentiation patterns. From the time scale, the NDVI in Figure 5 showed a fluctuating upward trend in spring, summer, autumn, and the growing season, with the highest annual average value (0.25) occurring in summer, with an increase rate of about 7.0662/a. The fluctuation in the NDVI in summer was very similar to that of the entire growing season.
Precipitation exhibited a decreasing trend in summer, autumn, and the growing season, with an increasing trend in spring. The highest precipitation value was recorded in spring at 110.94 mm, while the lowest value occurred in autumn at 20.44 mm. Conversely, temperature displayed an increasing trend in spring, summer, and the growing season, with a decreasing trend in autumn. The highest average temperature value was observed in summer at 19.76 °C, while the lowest value occurred in autumn at 6.2 °C.
On the spatial scale, as depicted in Figure 6a–h, the NDVI mainly increased in spring (88.16%), with the exception of the Junggar Basin and the Yili Valley, where the NDVI showed a decreasing trend (11.84%). Excluding the areas with no significant changes, the overall vegetation cover of the study area improved significantly. The greatest improvement in vegetation cover (32.37%) occurred in the spring. This was followed by the second-largest percentage of non-significant improvement (31.47%), while the proportion of areas showing extremely significant degradation accounted for only 0.63% of the total area.
In summer, 74.92% of the areas exhibited an increasing trend, while 25.08% displayed a decreasing trend. The areas with decreasing trends were predominantly distributed in the north of Xinjiang, whereas the NDVI in the south of Xinjiang showed an overall positive trend. During summer, the largest proportion of areas exhibited an insignificant and extremely significant improvement, accounting for 30.56% and 28.78%, respectively.
In autumn, 77.37% of the area displayed increasing trends, while 22.63% showed decreasing trends. The degraded areas were predominantly located along the northern border, mainly featuring grassland vegetation. Similarly, the percentage of the area showing an extremely significant improvement or non-significant improvement in autumn was substantial, at 24.58% and 19.20%, respectively. The area demonstrating extremely significant degradation accounted for 1.10%.
During the growing season, 84.29% of the areas exhibited increasing trends, while 15.71% showed decreasing trends. A large proportion of the study area, 36.55%, showed extremely significant improvement, distributed throughout the entire territory. Meanwhile, only 1.08% showed extremely significant degradation. The degraded areas primarily comprised grassland and shrubs around the Tarim Basin.
The spatial distribution of climatic factors exhibits distinct regional characteristics. Regarding the long time series of spring precipitation in the study area, 41.47% of the area showed increasing trends, while 58.53% showed decreasing trends. The areas with increasing trends are primarily concentrated in the central and western parts of Xinjiang, as well as in the southwestern prefectures. The area exhibiting an increasing trend in summer precipitation constitutes 18.08% of the total area, and is primarily located in the southern part of Xinjiang. Regions with an increasing trend in autumn precipitation were identified at the southern end of the Yarkant River, near the Erqis River, and in the Tacheng area, accounting for 15.05% of the total area. Growing season precipitation displayed an increasing trend in areas covering 18.20% of the total area, predominantly in the eastern part of the Aksu region and the southern part of Xinjiang.
Additionally, temperature demonstrated an increasing trend in spring, summer, and the growing season across a significant area, accounting for 92.84%, 62.43%, and 80.60% of the total area, respectively. Among them, spring temperatures showed a warming trend, except in the southwestern part of the study area, i.e., the localized area near the Kunlun Mountains, where temperatures decreased. There was a cooling trend in summer temperatures in Bazhou and Turpan. Growing season temperatures also showed a cooling trend in localized areas of the Taklamakan Desert and a warming trend in other areas. Autumn temperatures indicated an increasing trend in the eastern and southeastern parts of the study area, accounting for 24.67%, while the remaining areas showed a decreasing trend. Due to its unique geographic location, Xinjiang has been frequently affected by extreme weather in recent years, with significant cooling starting in autumn and snowfall commencing in many parts near the northern border. This has led to a gradual advancement in the timing of temperature reductions (Figure 6i–p).

3.2. Stability Analysis

Through an investigation into the stability of Xinjiang’s interannual NDVI from 2000 to 2022, we acquired insights into the distribution of vegetation fluctuation states in Xinjiang (Figure 7), where fluctuation changes in the vegetation were mainly caused by the fluctuation in the climate. The coefficients of variation ranged from 0.01 to 0.83, and the variation values were categorized into five levels. The results showed that the 23-year NDVI time series of this site is relatively stable.
Among them, the proportion of lower fluctuation change is the largest (39.30%), followed by medium fluctuation change (35.84%) (Table 2). Both are mainly distributed in the Ili River Valley and the intertwined oasis and desert zones around the Tarim Basin, and are less affected by temperature and precipitation. The proportion of higher fluctuation change and high fluctuation change areas is 12.26% and 8.69%, respectively. These areas are significantly influenced by both climate and human activities. They are mainly affected by climatic conditions and human activities and are found in low- and medium-altitude areas such as the northern slopes of Tianshan and the oases of the Tarim River Basin.

3.3. Sustainability Analysis

The preceding analysis primarily elucidated the spatial and temporal evolution patterns of the NDVI. However, the forthcoming trend characteristics of the NDVI remained ambiguous. To address this gap, we employed the image-by-image metric Hurst index (H) through R/S analysis to gauge the sustainability of the future trend in Xinjiang’s NDVI. As is depicted in Figure 8, the Hurst index unveiled notable spatial disparities within the study area, suggesting that the future trajectory of the NDVI in many regions might deviate from the present trend. The study showed that the mean value of the Hurst index of the NDVI was 0.46, which is a strong reverse persistence, and the ecological restoration and protection of vegetation needs to be further strengthened in the future. A total of 32.61% of the areas with H > 0.5 and 67.39% of the areas with H < 0.5 indicated that the reverse persistence of vegetation changes in Xinjiang is stronger than the positive persistence.
To delve deeper into the prospective trajectory of the NDVI, we overlaid the Hurst index with the NDVI trend to discern the future pattern [43]. Anticipated changes in Xinjiang’s NDVI predominantly exhibit a shift from an increasing to a decreasing trend, constituting 59.99% of the total (Table 3). Notably impacted vegetation types encompass grassland, crops, and forests. Conversely, areas characterized by a continuous increase represent 28.97%, with grassland and crops standing out as the primary vegetation types in this category. The percentages of areas that changed from decreasing to increasing and continuously decreasing were 7.40% and 3.65%, respectively. The areas that changed from decreasing to increasing were dominated by grasslands, mainly distributed in the northern part of the Xinjiang province. Furthermore, those that continued to decrease were dominated by grasslands and crops, distributed in the northern part of the Bazhou, the Ili River Valley, and the western part of the Tacheng Region. In general, there is a certain degree of risk of future vegetation degradation in areas with a high intensity of human activities and ecologically sensitive desert and alpine areas, and more efforts are needed for vegetation protection.

3.4. Impact of Climatic Factors on Annual NDVI

In this study, an image-by-image meta-partial correlation analysis was conducted to examine the relationship between NDVI and temperature and precipitation in Xinjiang. Significance was assessed using t-tests, aiming to comprehensively investigate the response of vegetation dynamics to climate change in the region.
As is shown in Figure 9, the majority of regions in Xinjiang exhibited a positive correlation between interannual NDVI and interannual temperature and precipitation. The partial correlation coefficients between precipitation and NDVI ranged from −0.79 to 0.81, with 63.82% of the areas showing a positive correlation. Among them, areas with an extremely significant positive correlation (5.25%, p < 0.01) were primarily situated in the Altai Mountains in the north, the Tianshan Mountain Range in the center, and the Kunlun Mountain Range in the south (Table 4). Areas with a significant positive correlation (6.61%, p < 0.05) were mainly located in the lower-elevation areas near the regions with extremely significant positive correlations. The proportion of negatively correlated areas was 36.18%, with areas exhibiting an extremely significant negative correlation (0.25%, p < 0.01) being primarily concentrated in Altay and Bazhou, among other areas. Areas with a significant negative correlation (1.21%, p < 0.05) were mainly located in Hami City.
The partial correlation coefficients between temperature and NDVI ranged from −0.88 to 0.91, with 80.94% of the areas showing a positive correlation. Among these, areas with an extremely significant positive correlation (5.15%, p < 0.01) were concentrated in the northwestern part of the Tianshan Mountain Range, Altay Mountain Range, and Tacheng City area. Areas with a significant positive correlation (9.53%, p< 0.05) were mainly in the northern part of the study area. The proportion of areas showing a negative correlation was 19.06%, with areas exhibiting an extremely significant negative correlation (0.29%, p < 0.01) and a significant negative correlation (0.63%, p < 0.05) primarily distributed along the Kunlun Mountains.

3.5. Impact of Climatic Factors on Seasonal NDVI

The NDVI in Xinjiang in all seasons showed a positive correlation with precipitation in spring, summer, and the growing season, accounting for 71.87%, 73.87%, and 78.59%, respectively. Meanwhile, the NDVI in autumn showed a negative correlation with precipitation during the same period, accounting for a large proportion of 58.48%, and a positive correlation accounting for 41.52%.
The partial correlation coefficients between spring precipitation and NDVI ranged from −0.75 to 0.89. There was an extremely significant positive correlation observed in 4.57% of the area, primarily in the northern part of Changji Prefecture, the Yili Valley, and the northern part of the Tacheng area. The percentage of negatively correlated areas was 28.13%, including 0.22% of extremely significant-negative-correlation areas, mainly in the northern part of Bazhou.
The partial correlation coefficient between summer precipitation and NDVI ranged from −0.78 to 0.81. Areas with a positive correlation were primarily distributed in the Kunlun Mountains, near the Aksu River, the North Tianshan Mountains, and the East Tianshan Mountains, accounting for 7.87% in areas with an extremely significant positive correlation and 9.75% in areas with a significant positive correlation. Negatively correlated areas constituted 26.13%, with a sporadic distribution of 0.11% in the northern and southeastern parts of Bavaria, and 0.51% in significantly negatively correlated areas.
In terms of autumn precipitation and NDVI, partial correlation coefficients ranged from −0.86 to 0.84. A total of 0.68% of the area had an extremely significant positive correlation, mainly around the Tarim Basin, while a significant positive correlation accounted for 1.39%, mainly around the Tarim Basin, Hami City, and the Ili River Valley. Negatively correlated areas made up 58.48%, with 0.90% in areas of extremely significant negative correlation, mainly in the central Tacheng. Moreover, a total of 2.61% represented significantly negatively correlated areas, primarily in the central Tacheng and the northern part of Kezhou.
In the growing season, the partial correlation coefficient between precipitation and NDVI ranged from −0.80 to 0.88. An extremely significant positive correlation was observed in 11.91% of the area, mainly in the localized areas of Tacheng, Tianshan Mountain, and Kunlun Mountain. A significant positive correlation covered 12.14% in the northern part of Kezhou and the Tianshan Mountain Range. Negatively correlated areas accounted for 21.41%. Furthermore, 0.14% represented areas of extremely significant negative correlation, mainly in southeastern Bazhou, with 0.52% being in significantly negatively correlated areas.
In contrast, a positive correlation between NDVI and temperature in Xinjiang was prevalent in different seasons, accounting for 82.22%, 62.88%, 54.25%, and 73.10% in the different seasons.
The partial correlation coefficients between the spring temperature and NDVI ranged from −0.78 to 0.92, with 15.99% of the area showing a highly significant positive correlation, mainly distributed in the Ili Valley, the Northern Tianshan Mountains, the Altai Mountains, etc. Moreover, 13.56% of the area showed a significant positive correlation, mainly around the Junggar Basin. The area of negative correlation was 17.78%, of which the area of highly significant negative correlation was 0.14%, sporadically distributed in the south of the Tarim Basin; the area of significant negative correlation was 0.60%.
The partial correlation coefficients between the summer temperature and the NDVI ranged from −0.82 to 0.92, with 1.39% of the area showing a highly significant positive correlation, mainly in the downstream area of the Tarim River; 4.36% of the area showed a significant positive correlation, mainly located in the downstream area of the Tarim River and the Bole area. The proportion of negatively correlated areas was 37.12%, of which 0.32% showed a highly significant negative correlation, mainly distributed in the eastern section of the Kunlun Mountains; the proportion of significantly negatively correlated areas was 1.15%, mainly located in the northwestern part of the Tacheng area and the eastern section of the Kunlun Mountains.
The partial correlation coefficients between the autumn temperature and the NDVI ranged from −0.83 to 0.83. An area covering 2.14% exhibited an extremely significant positive correlation, mainly located in the Altai Mountains and the northern part of the Tacheng area. An additional 3.56% of the area showed a significant positive correlation, mainly near the region demonstrating an extremely significant positive correlation. Areas showing a negative correlation accounted for 47.75%, with 0.62% exhibiting an extremely significant negative correlation and 2.45% showing a significant negative correlation, mainly distributed in the central part of the Tacheng region.
In terms of the correlation between growing season temperature and NDVI, partial correlation coefficients ranged from −0.92 to 0.90. A positive correlation predominated in the Tianshan and Altai Mountains, with 3.85% of the area exhibiting an extremely significant positive correlation and 7.89% showing a significant positive correlation. Areas with a negative correlation constituted 26.90%, with 0.28% showing an extremely significant negative correlation, primarily in the South Tianshan and Kunlun Mountain Range. In addition, 0.80% showed a significant negative correlation, mainly in the northern part of the Tacheng area, South Tianshan, and the Kunlun Mountain Range.

3.6. NDVI Response to Human Footprint Data

In this study, by analyzing the annual average human footprint data from 2000 to 2020, we found that the overall size of areas not affected by human activities is greater than that of areas more affected by human activities, which is, in turn, greater than that of areas slightly affected by human activities. This is mainly because the area unsuitable for human survival is larger in Xinjiang, so people gather in urban or rural areas in the form of clusters for survival, and most of the human impact area is in the area where water is available (Figure 10b).
Areas unaffected by human activities constitute 48.40% of the total area, primarily situated in the desert and Gobi regions, which are rarely visited by people, as well as in the plateau and glacier zone, including the Taklamakan Desert, Turpan Basin, Gurbantunggut Desert, Pamir Plateau, and Qiangtang Plateau. Areas slightly affected by human activities account for 23.61%, mainly in the mountains of the study area. The areas more affected by human activities (27.99%) are located in and around major cities, along the main stem and tributaries of the Tarim River, and in the Ili River Valley. The results of the trend analysis of the multi-year human footprint data showed that the percentage of areas with increasing and decreasing trends were 33.82% and 66.18%, respectively (Figure 10a).
Overall, there is a gradual concentration of people toward cities each year, and regions more significantly affected by human activities exhibit an increasing trend annually. This includes the economic radiation zones around Urumqi and Changji; Kashgar City, the largest city in the southern Xinjiang; and other areas with higher levels of economic development.
The present study quantitatively analyzed the relationship between multi-year NDVI means and multi-year human footprint data and concluded that the study area’s low-vegetation-cover region has the highest percentage of areas impacted by human activities (47.40%). This is followed by the medium- and low-vegetation-cover area of 29.48%. This trend is primarily attributed to recent technological advancements in developing unused land, coupled with a growing demand for land. Rapid activities such as large-scale farming and reforestation have been undertaken, supported by government investments aimed at enhancing the ecological environment. This concerted effort has facilitated the development and utilization of areas with low vegetation cover.
The analysis revealed that 69.60% of the total area shows an overlap between regions experiencing an increase in human footprints and those with a concurrent rise in NDVI. Within the areas exhibiting an increase in human footprints, 46.69% depict an extremely significant increase in NDVI, primarily concentrated around the periphery of the Tarim Basin and the central Tianshan Mountains. Additionally, areas with a significant increase are scattered throughout the study area, constituting 10.64% of the total area. As human footprints decrease, 41.52% of the total area in the study area experiences an extremely significant increase in NDVI. This increase is primarily observed on the periphery of the Tarim Basin, the central part of the Kunlun Mountain Range, and the Aksu region. The overlap between areas with decreasing human footprints and those exhibiting a degradation trend in NDVI comprises 11.09% of the total area. These areas are mainly distributed in the northern part of the country. Furthermore, areas with extremely significant degradation and significant degradation in NDVI account for 0.73% and 0.51% of the total area, respectively.
The correlation analysis between interannual NDVI data and human footprint data revealed correlation coefficients ranging from −0.978 to 0.986. The areas where the two variables were significantly correlated accounted for 34.79% of the total. These areas were primarily distributed in regions more affected by human activities, and the dominant vegetation types were mainly grassland, non-vegetation areas, and crops (Figure 11).
The study period was in the second and early third phases of the Three-North Protective Forest Project. During this project, a number of forestry ecological management projects have been implemented in Xinjiang, such as the greening project of the Kekeya Desert in the Aksu region, the greening project of the barren mountains in the city of Urumqi, the afforestation and greening project of the Old Windy Mouth in the Tacheng region, the greening project of the Dongshan Mountain in the city of Korla in Bazhou, and the project of constructing one million mu of ecological and economic forests in the Ili Kazakh Autonomous Prefecture. These projects have further improved the cover of forest and grass vegetation, and effectively curbed the tendency of desertification. In 2022, the living environment and production conditions in Xinjiang’s key sand and wind management areas were significantly improved. In fact, a “double reduction” in the extent of desertification and sandification, and a “double increase” in the vegetation cover and carbon sequestration capacity were realized, putting an end to the expansion of sandy land. This represents the only province and region to have achieved this in the country.

4. Discussion

In general, the dynamics of the NDVI in response to climate change and human activities constitute a highly intricate and complex process. As discussed in this study, the observed trend in Xinjiang’s NDVI closely aligns with the overall greening patterns observed in vegetation-cover changes across Eurasia [44] and China [45], including northwestern China [46].
Xinjiang is the province with the largest area of desertified (64.18%) and sandy (44.25%) land in China, and in recent years it has managed a cumulative total of 27,900 square kilometers of sandy land, accounting for 22.63% of the country’s management tasks. A total of 4.706 billion cubic meters of ecological water was to be delivered from 2019 to 2022, and the area of natural vegetation dominated by poplar forests will be protected in an area of 8400 square kilometers. Since the 13th Five-Year Plan, Xinjiang has completed a total of 5166 square kilometers of ecosystem protection and restoration projects in key areas, 3195.87 square kilometers of returning farmland to forest, 676.66 square kilometers of returning farmland to grassland, 4014 square kilometers of ecological restoration and management of degraded grasslands, and 61.8 square kilometers of integrated demonstration forests for preventing and treating sand. This series of ecological improvement measures has led to the continuous improvement of the ecological environment in the Xinjiang region.
The spatial distribution of changes in the NDVI revealed notable differences. In particular, this included the region experiencing vegetation improvement surpassing the area undergoing degradation in both northern and southern Xinjiang. The total extent of vegetation improvement in northern Xinjiang exceeded that in the southern part, attributed to the extensive distribution of the Gobi desert in the Tarim Basin of southern Xinjiang.
In this study, the NDVI trend analysis was conducted at seasonal and interannual scales. Firstly, in terms of the time scale, the NDVI growth rate was 6.5660/a in spring, 7.0662/a in summer, 4.7174/a in autumn, 6.6275/a in the growing season, and 0.4656/a interannually. The highest fluctuation was observed in summer and at the spatial scale. A total of 88.16% of the area improved in spring, 74.92% in summer, 77.37% in autumn, 84.29% in the growing season, and 88.95% interannually.
Regarding spatial distribution, the overall performance exhibits higher values in the northern region compared to the southern counterpart, and higher values in the western part than the eastern part. This pattern is closely associated with local climatic conditions and the unique topography and geomorphology. From 2000 to 2022, the NDVI in Xinjiang generally experienced a low fluctuation. Areas with a higher fluctuation and high fluctuation are proportionally low, mainly situated in the middle- and low-altitude regions, which are more susceptible to the influences of climatic conditions and human activities. The anticipated trajectory of the NDVI in the majority of the study area is expected to deviate from the current trend, displaying a robust reversal in the persistence of vegetation change. Regarding the impact of climatic factors and human footprints on NDVI, variations are observed across different seasons, and the correlation intensity also differs among various regions.
On an interannual scale, the NDVI exhibited a positive correlation with both precipitation and temperature. Furthermore, the human footprint data significantly correlated with the NDVI in 34.79% of the area. Of course, the transformation of vegetation cover is shaped not only by climatic factors but also by the impact of human activities, a factor that should not be overlooked. The widespread execution of national ecological protection and construction initiatives, such as the Three-North Protective Forests and the Return of Cultivated Land to Forests projects, have contributed to the enhancement of the regional ecological environment. Consequently, there has been an expansion in the area covered by vegetation, accompanied by the gradual manifestation of ecological benefits [47,48]. At the same time, urban expansion caused by social development has encroached on large areas of agricultural land and forests, and has also led to the serious degradation of regional vegetation [49]. Subsequently, especially in arid areas, the impact of human activities on the NDVI will be greater [50].
On a seasonal scale, precipitation in spring, summer, and the growing season was positively correlated with NDVI. In contrast, autumn precipitation was negatively correlated with the NDVI, and autumn precipitation resulted in high soil moisture at low temperatures, resulting in increased root respiration, nutrient loss, and disease growth. Temperature and the NDVI were positively correlated in all seasons, and the ratio of the influence was as follows: spring > growing season > summer > autumn.
In fact, the NDVI change is the result of many factors and is a very complicated process. There are several limitations to this study. The time series of climate data is not sufficient to reflect the most realistic climate trend, and other factors such as climate elements, topography, and soil conditions were not explored in depth. At the same time, we did not analyze the lag time of the influence of climatic factors on the vegetation changes in each season, and the final results may still have a certain degree of uncertainty.
As a next step, we will further explore the lag time of vegetation changes in response to climatic factors, and the effects of various factors on vegetation changes over a longer time series, in order to provide a scientific basis for the protection of vegetation and the improvement of the ecological environment in Xinjiang in the long term.

5. Conclusions

(1)
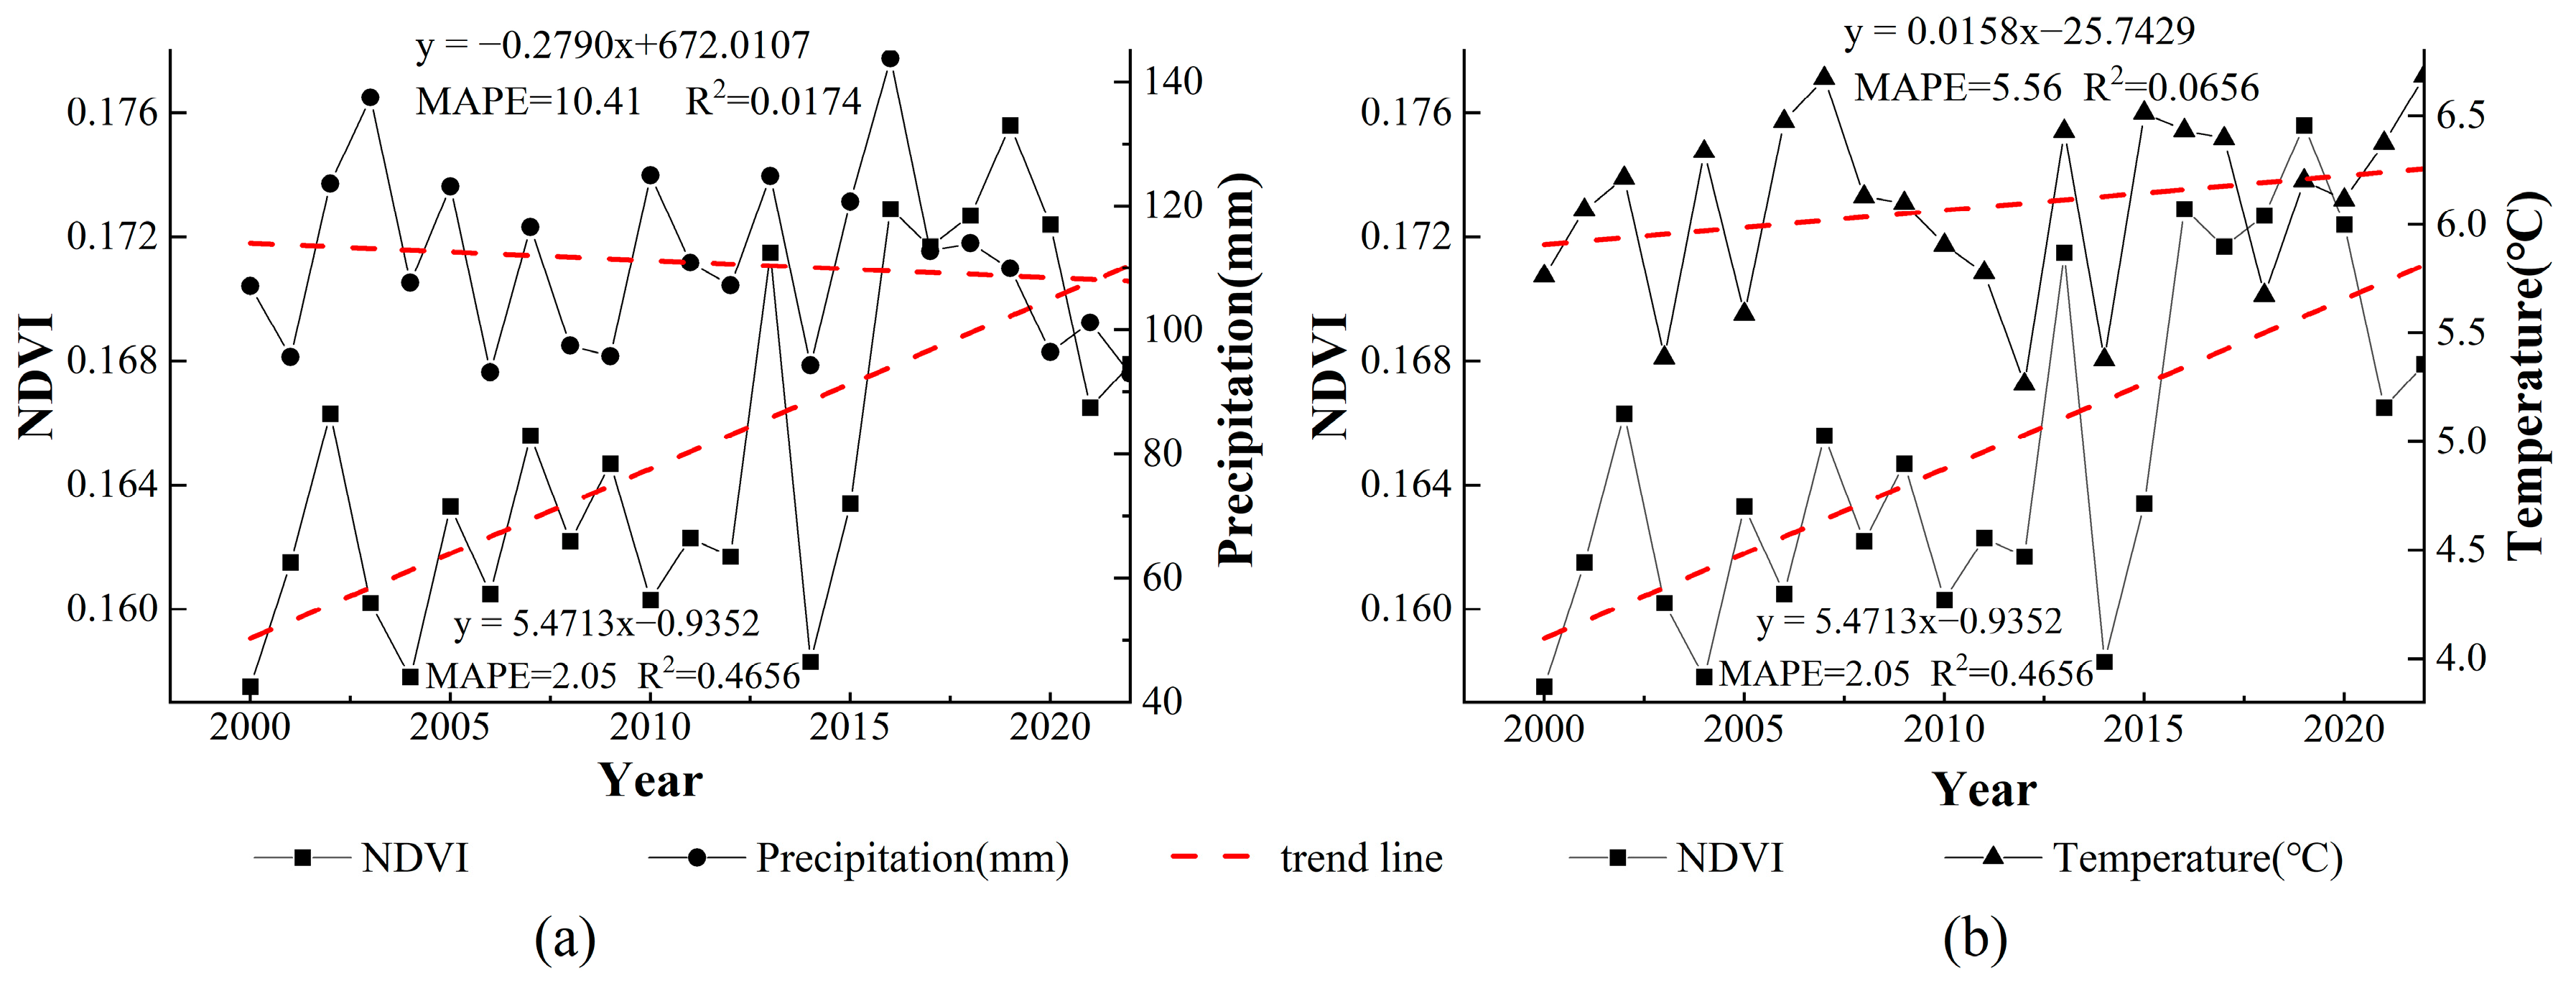
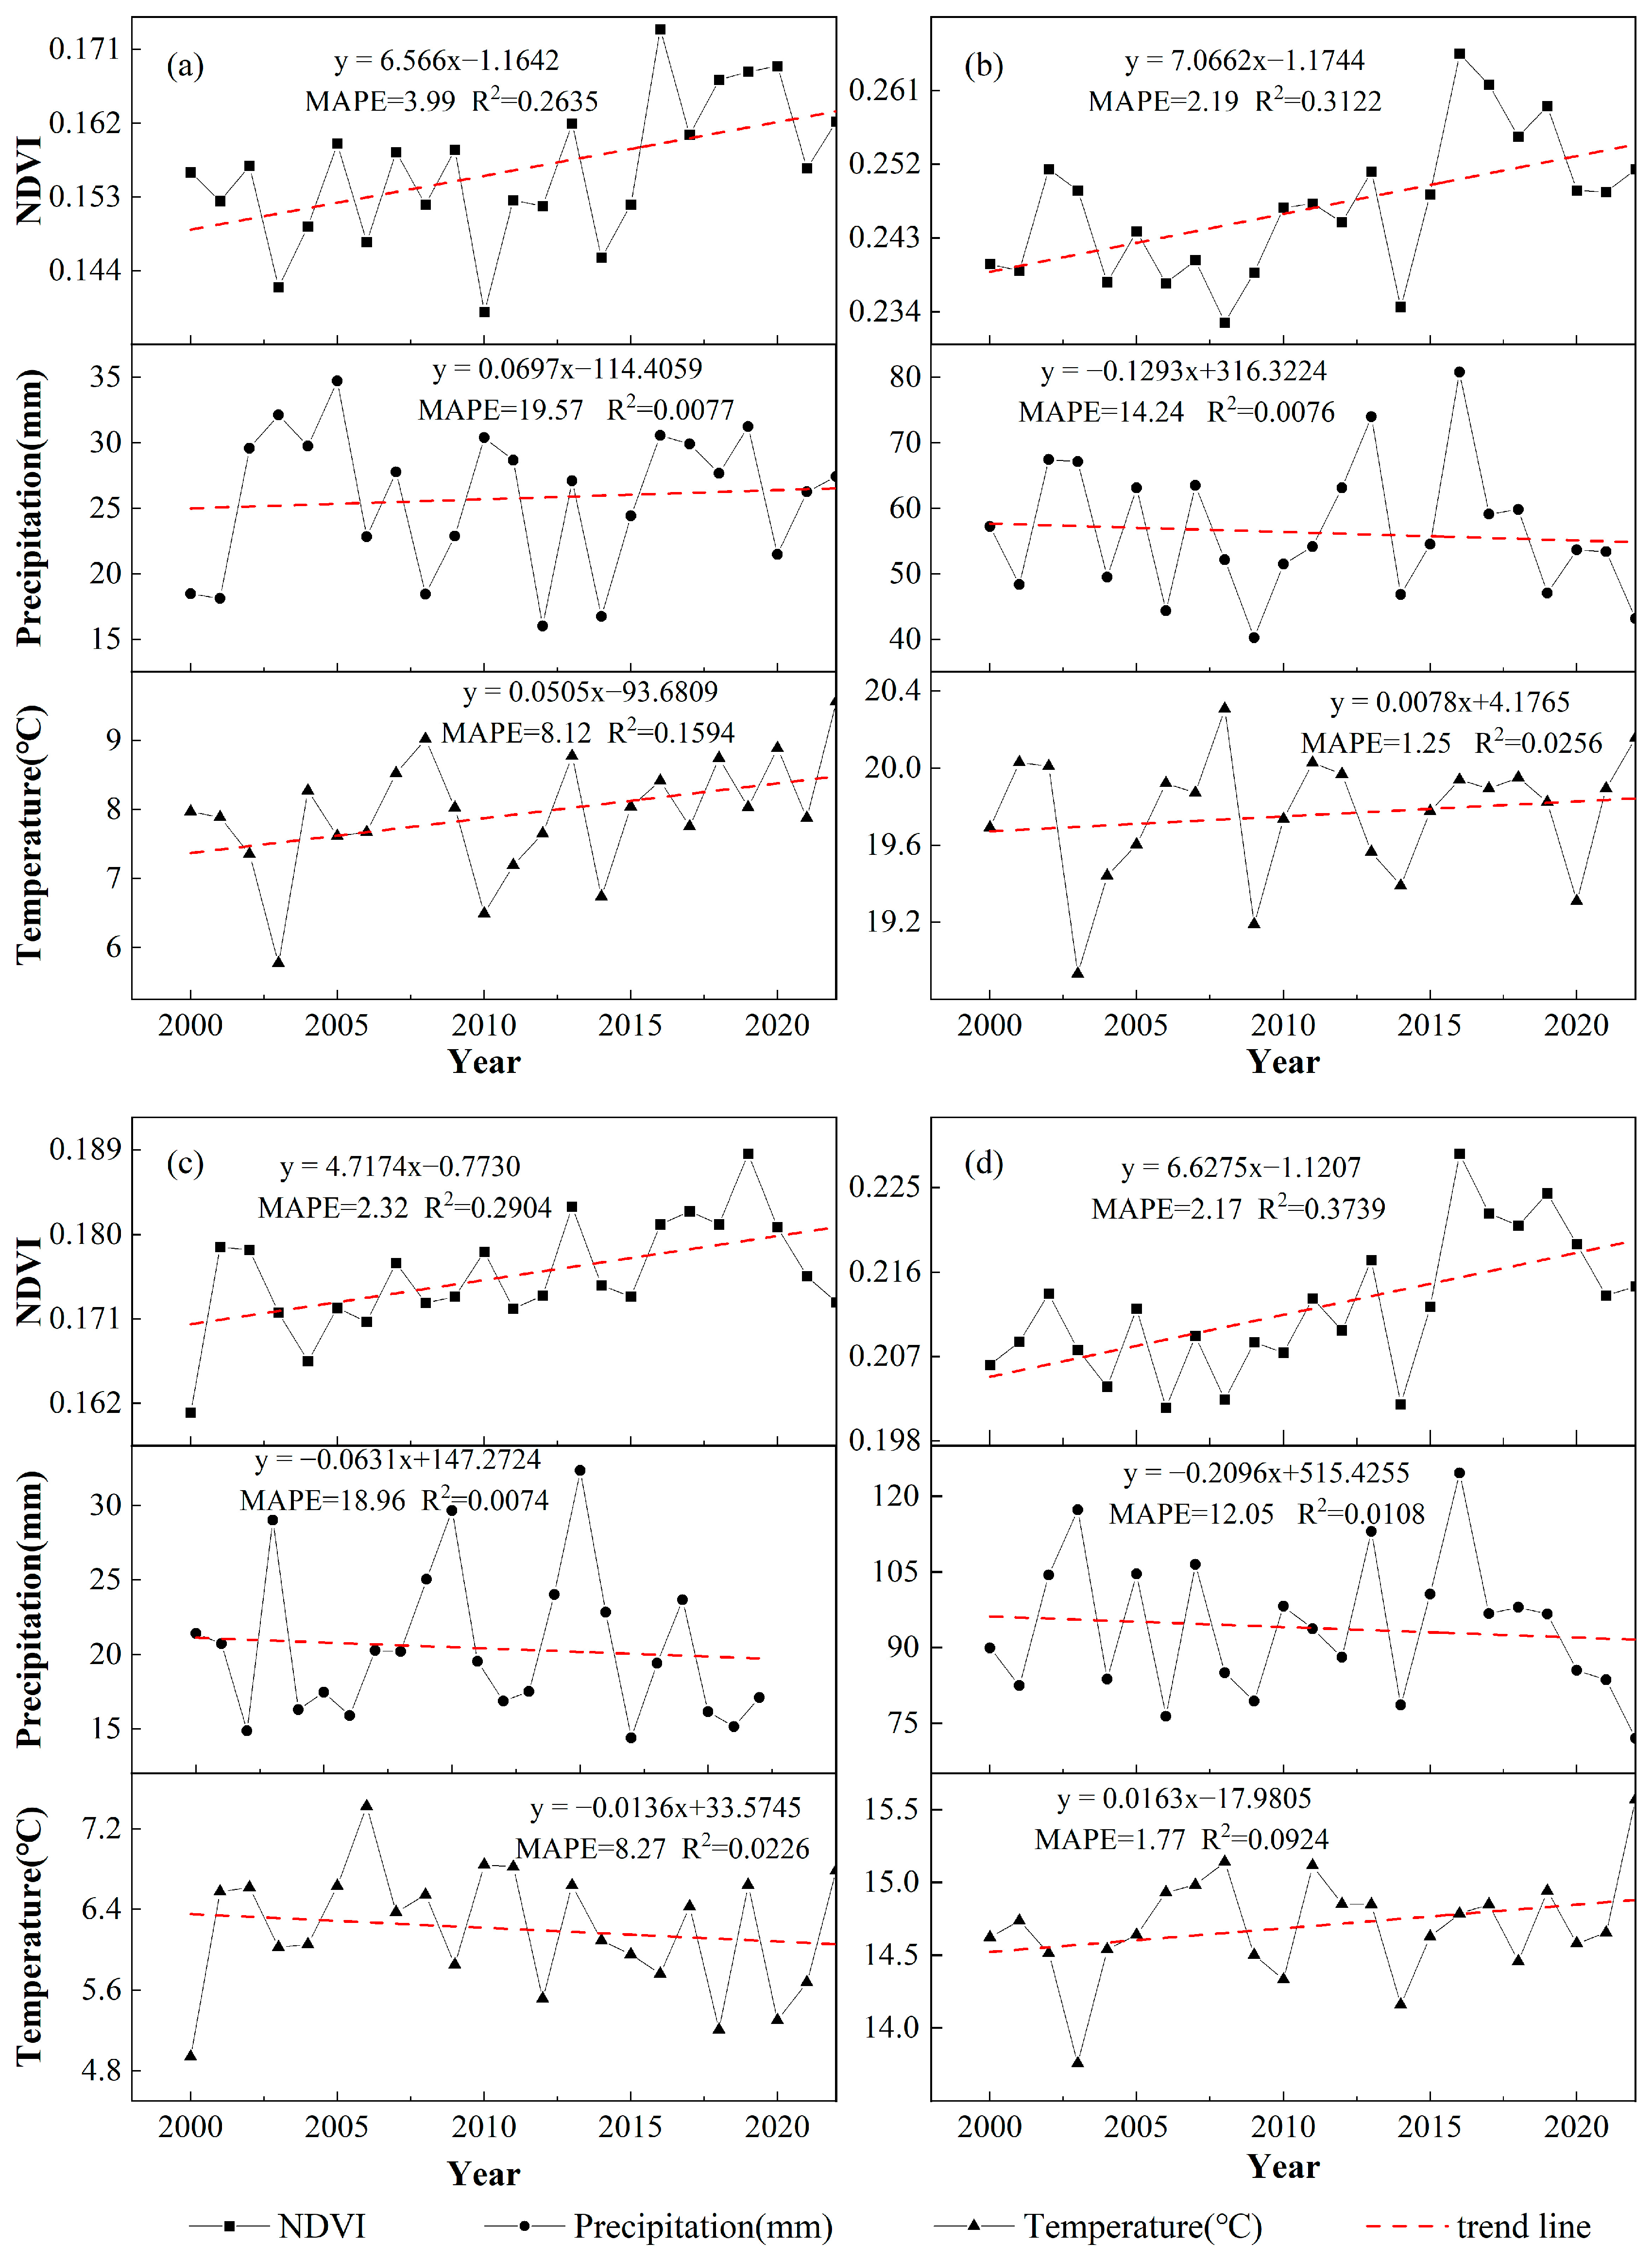
On the temporal scale, similar to the global NDVI trend in most regions, the interannual NDVI change in Xinjiang generally showed a fluctuating upward trend from 2000 to 2022, with an average growth rate of 0.4656/a. This period witnessed a noteworthy enhancement in the overall vegetation health within the region. The NDVI in the study area showed a fluctuating upward trend in all seasons, in which the average growth rate showed the following order: summer (7.0662/a) > growing season (6.6275/a) > spring (6.566/a) > autumn (4.7174/a). Overall, the highest (2019) and lowest (2000) NDVI values interannually and in the autumn occurred during the same period. The highest values for spring, summer, and the growing season all occurred simultaneously in 2016, and the interannual, summer, and growing season precipitation was also highest in 2016.
(2)
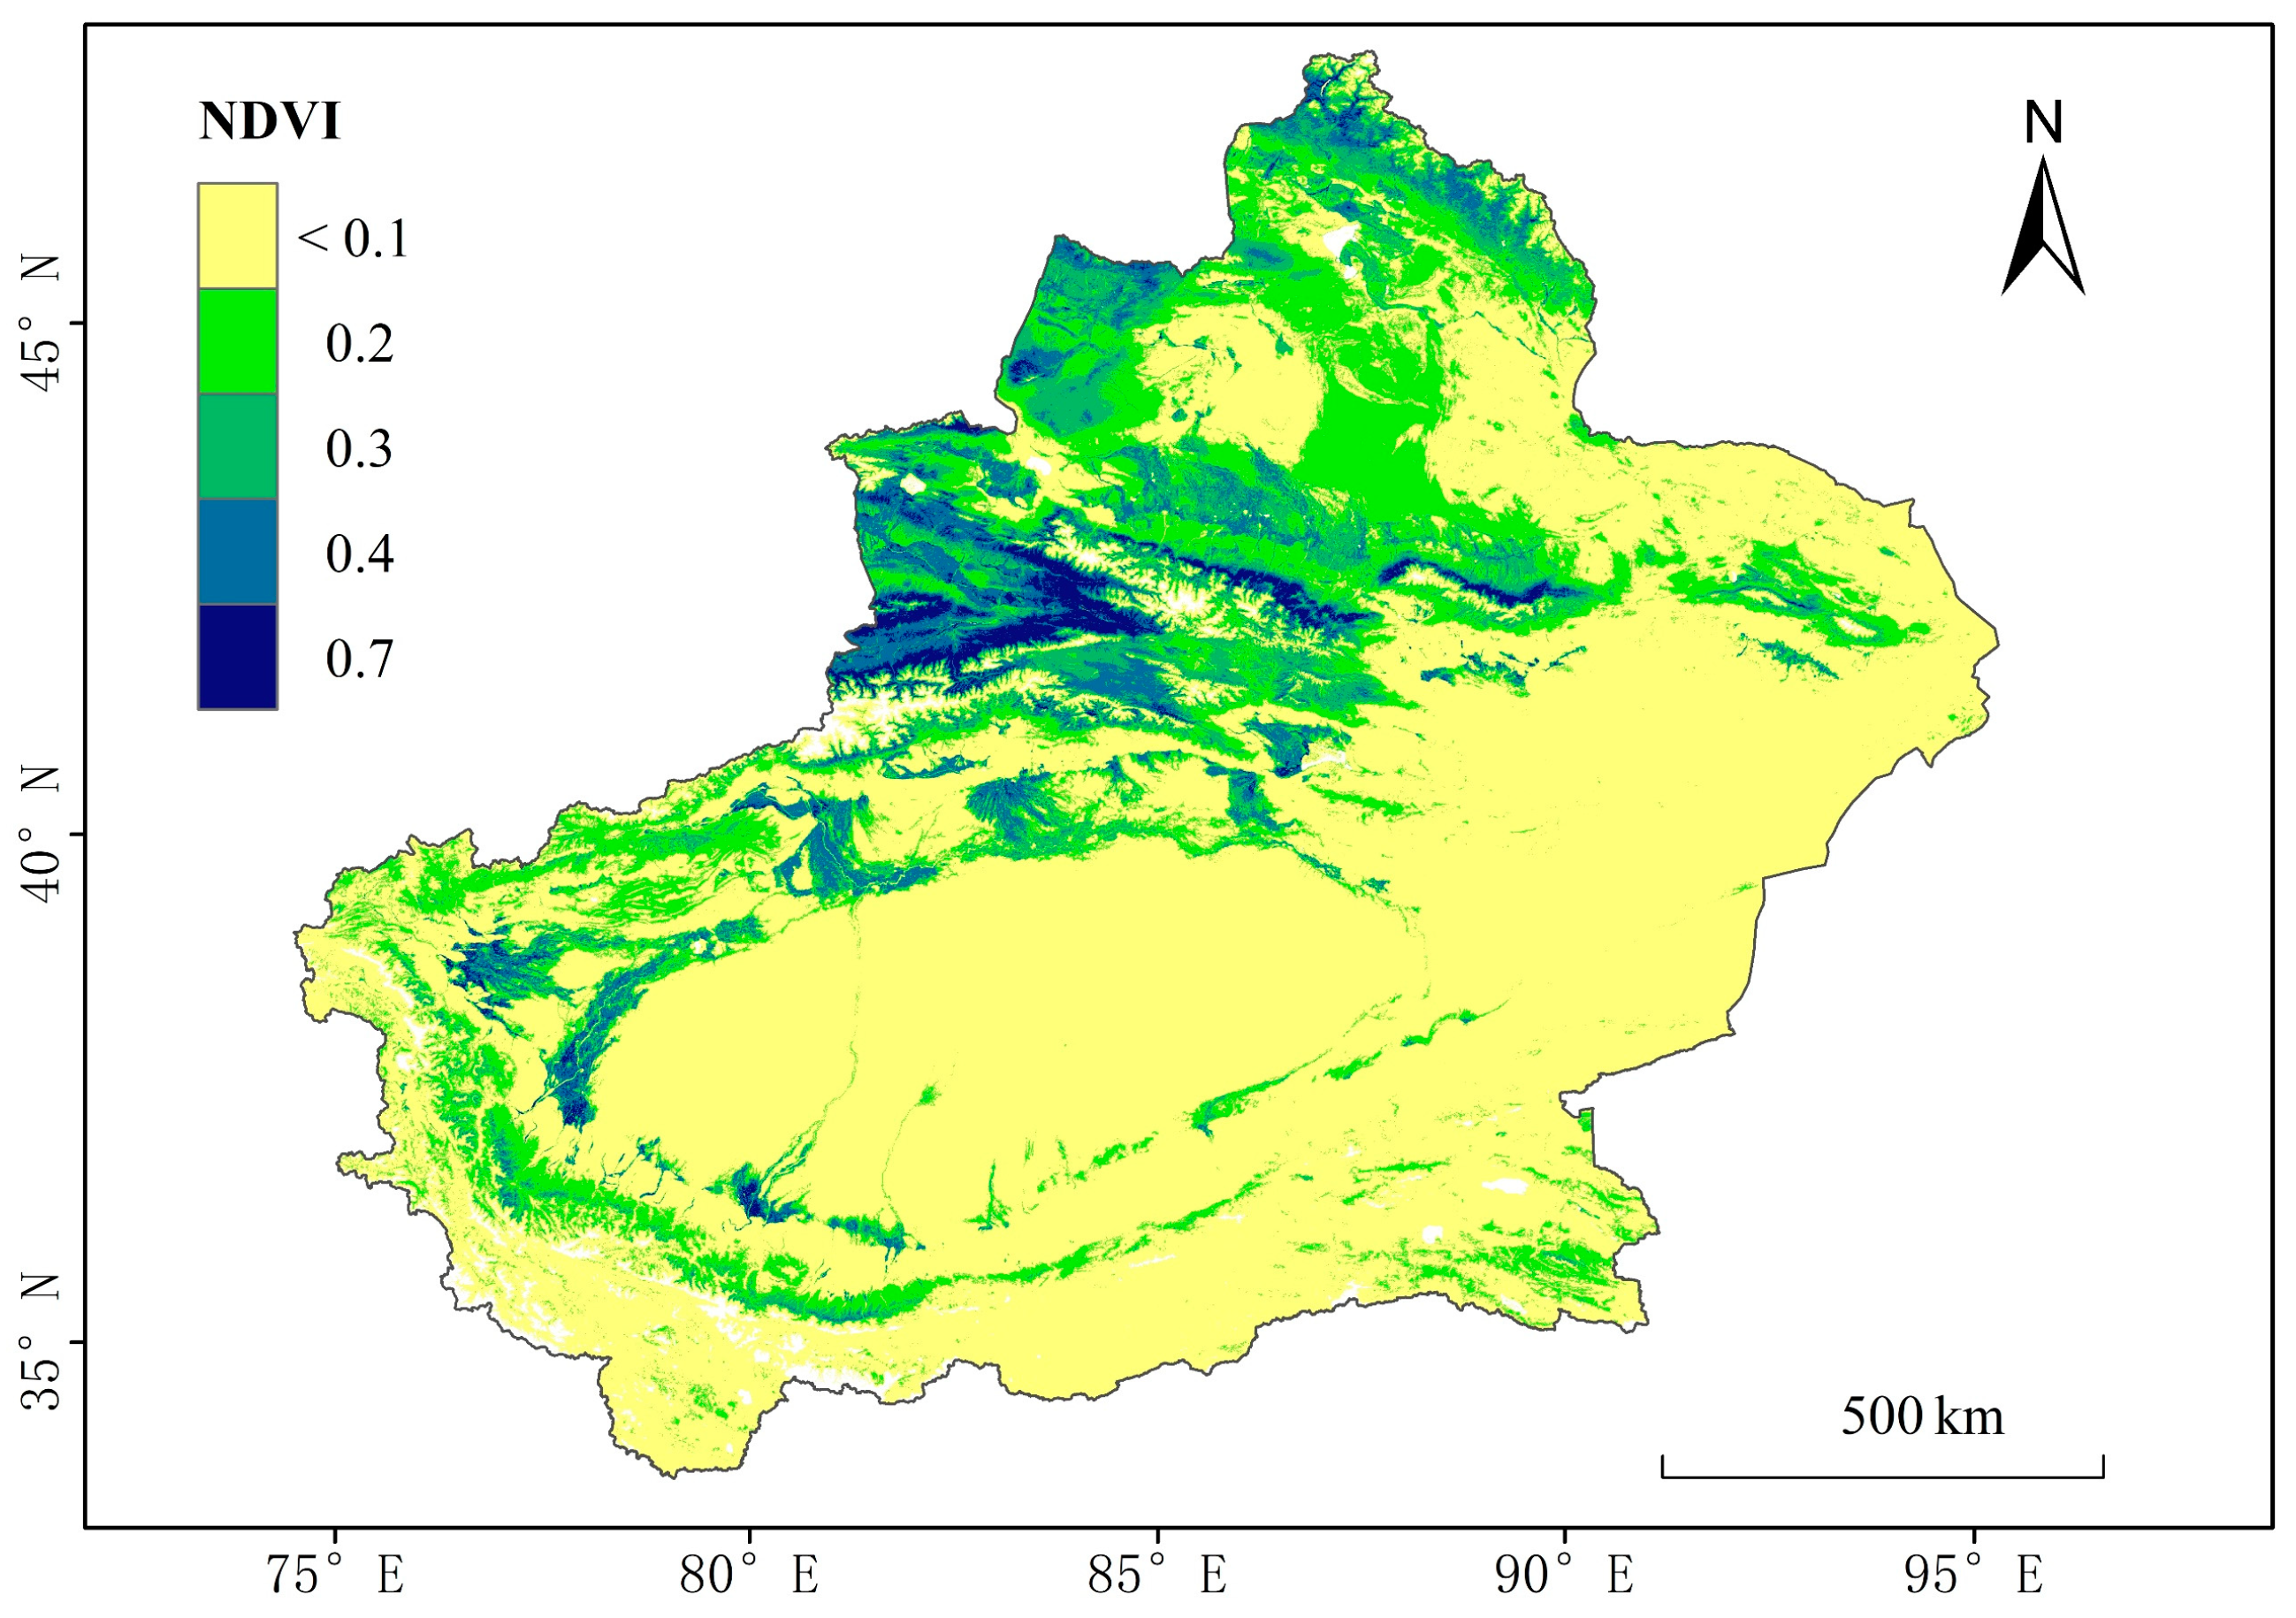
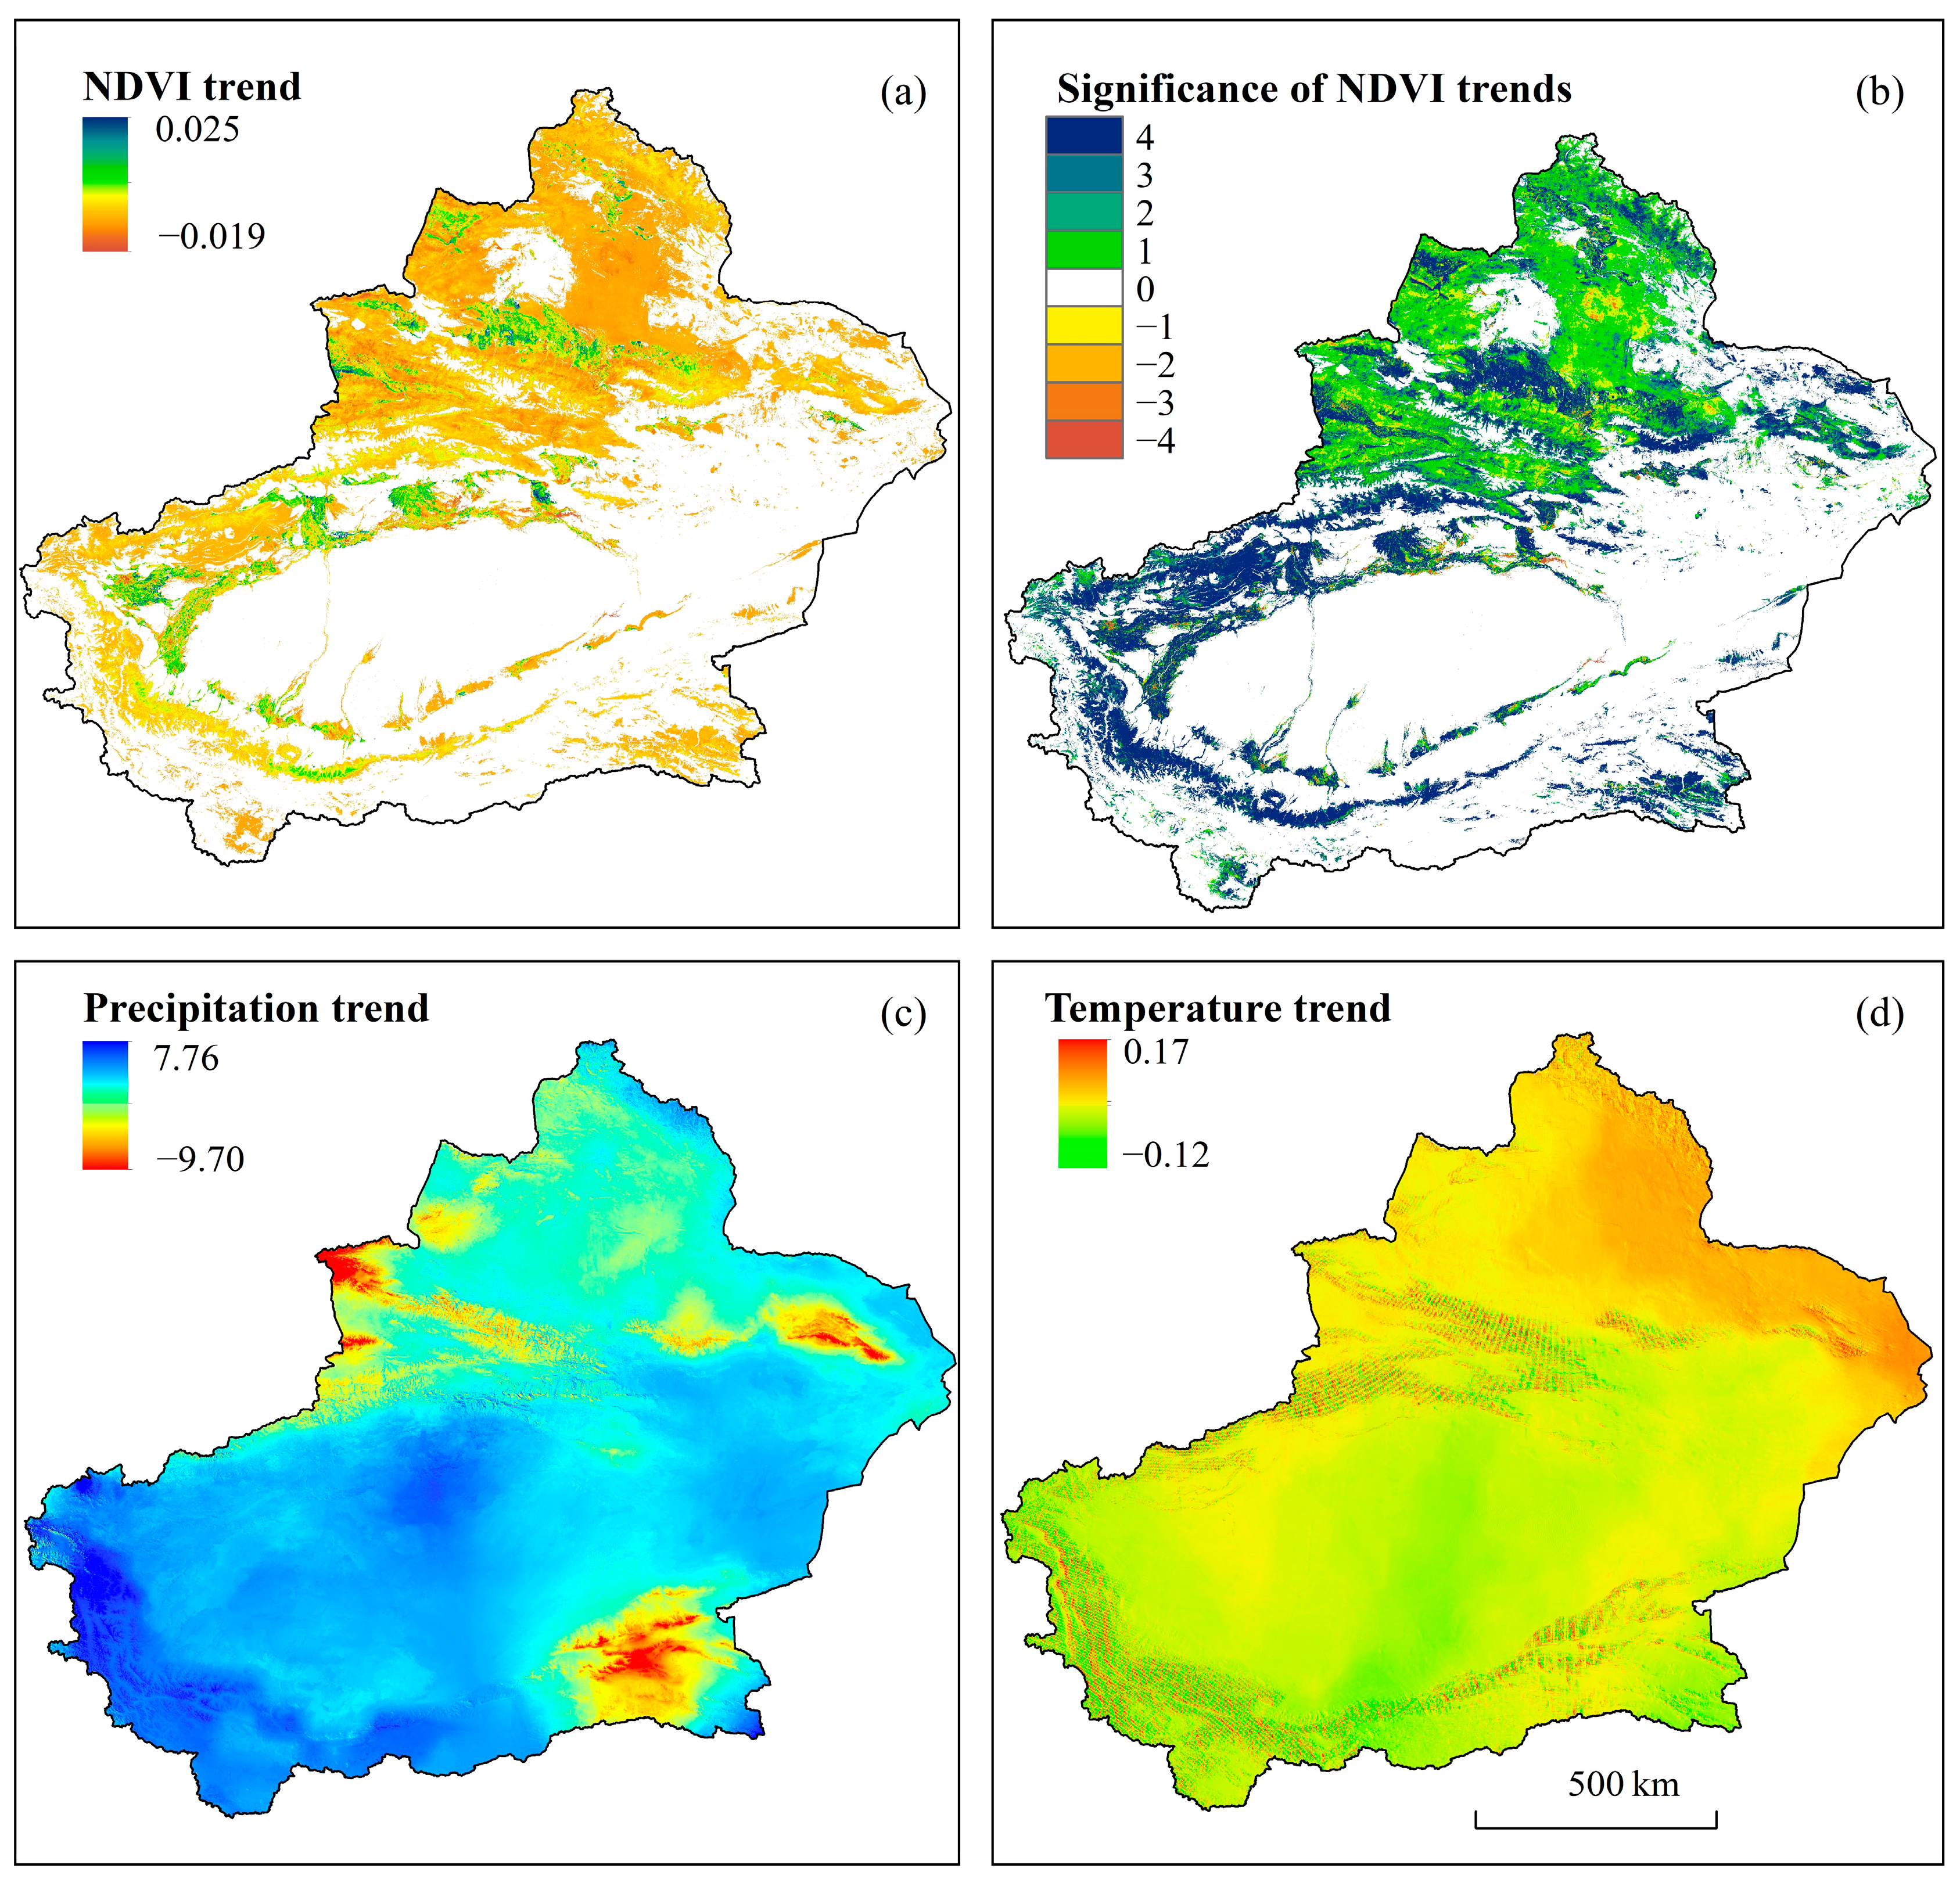
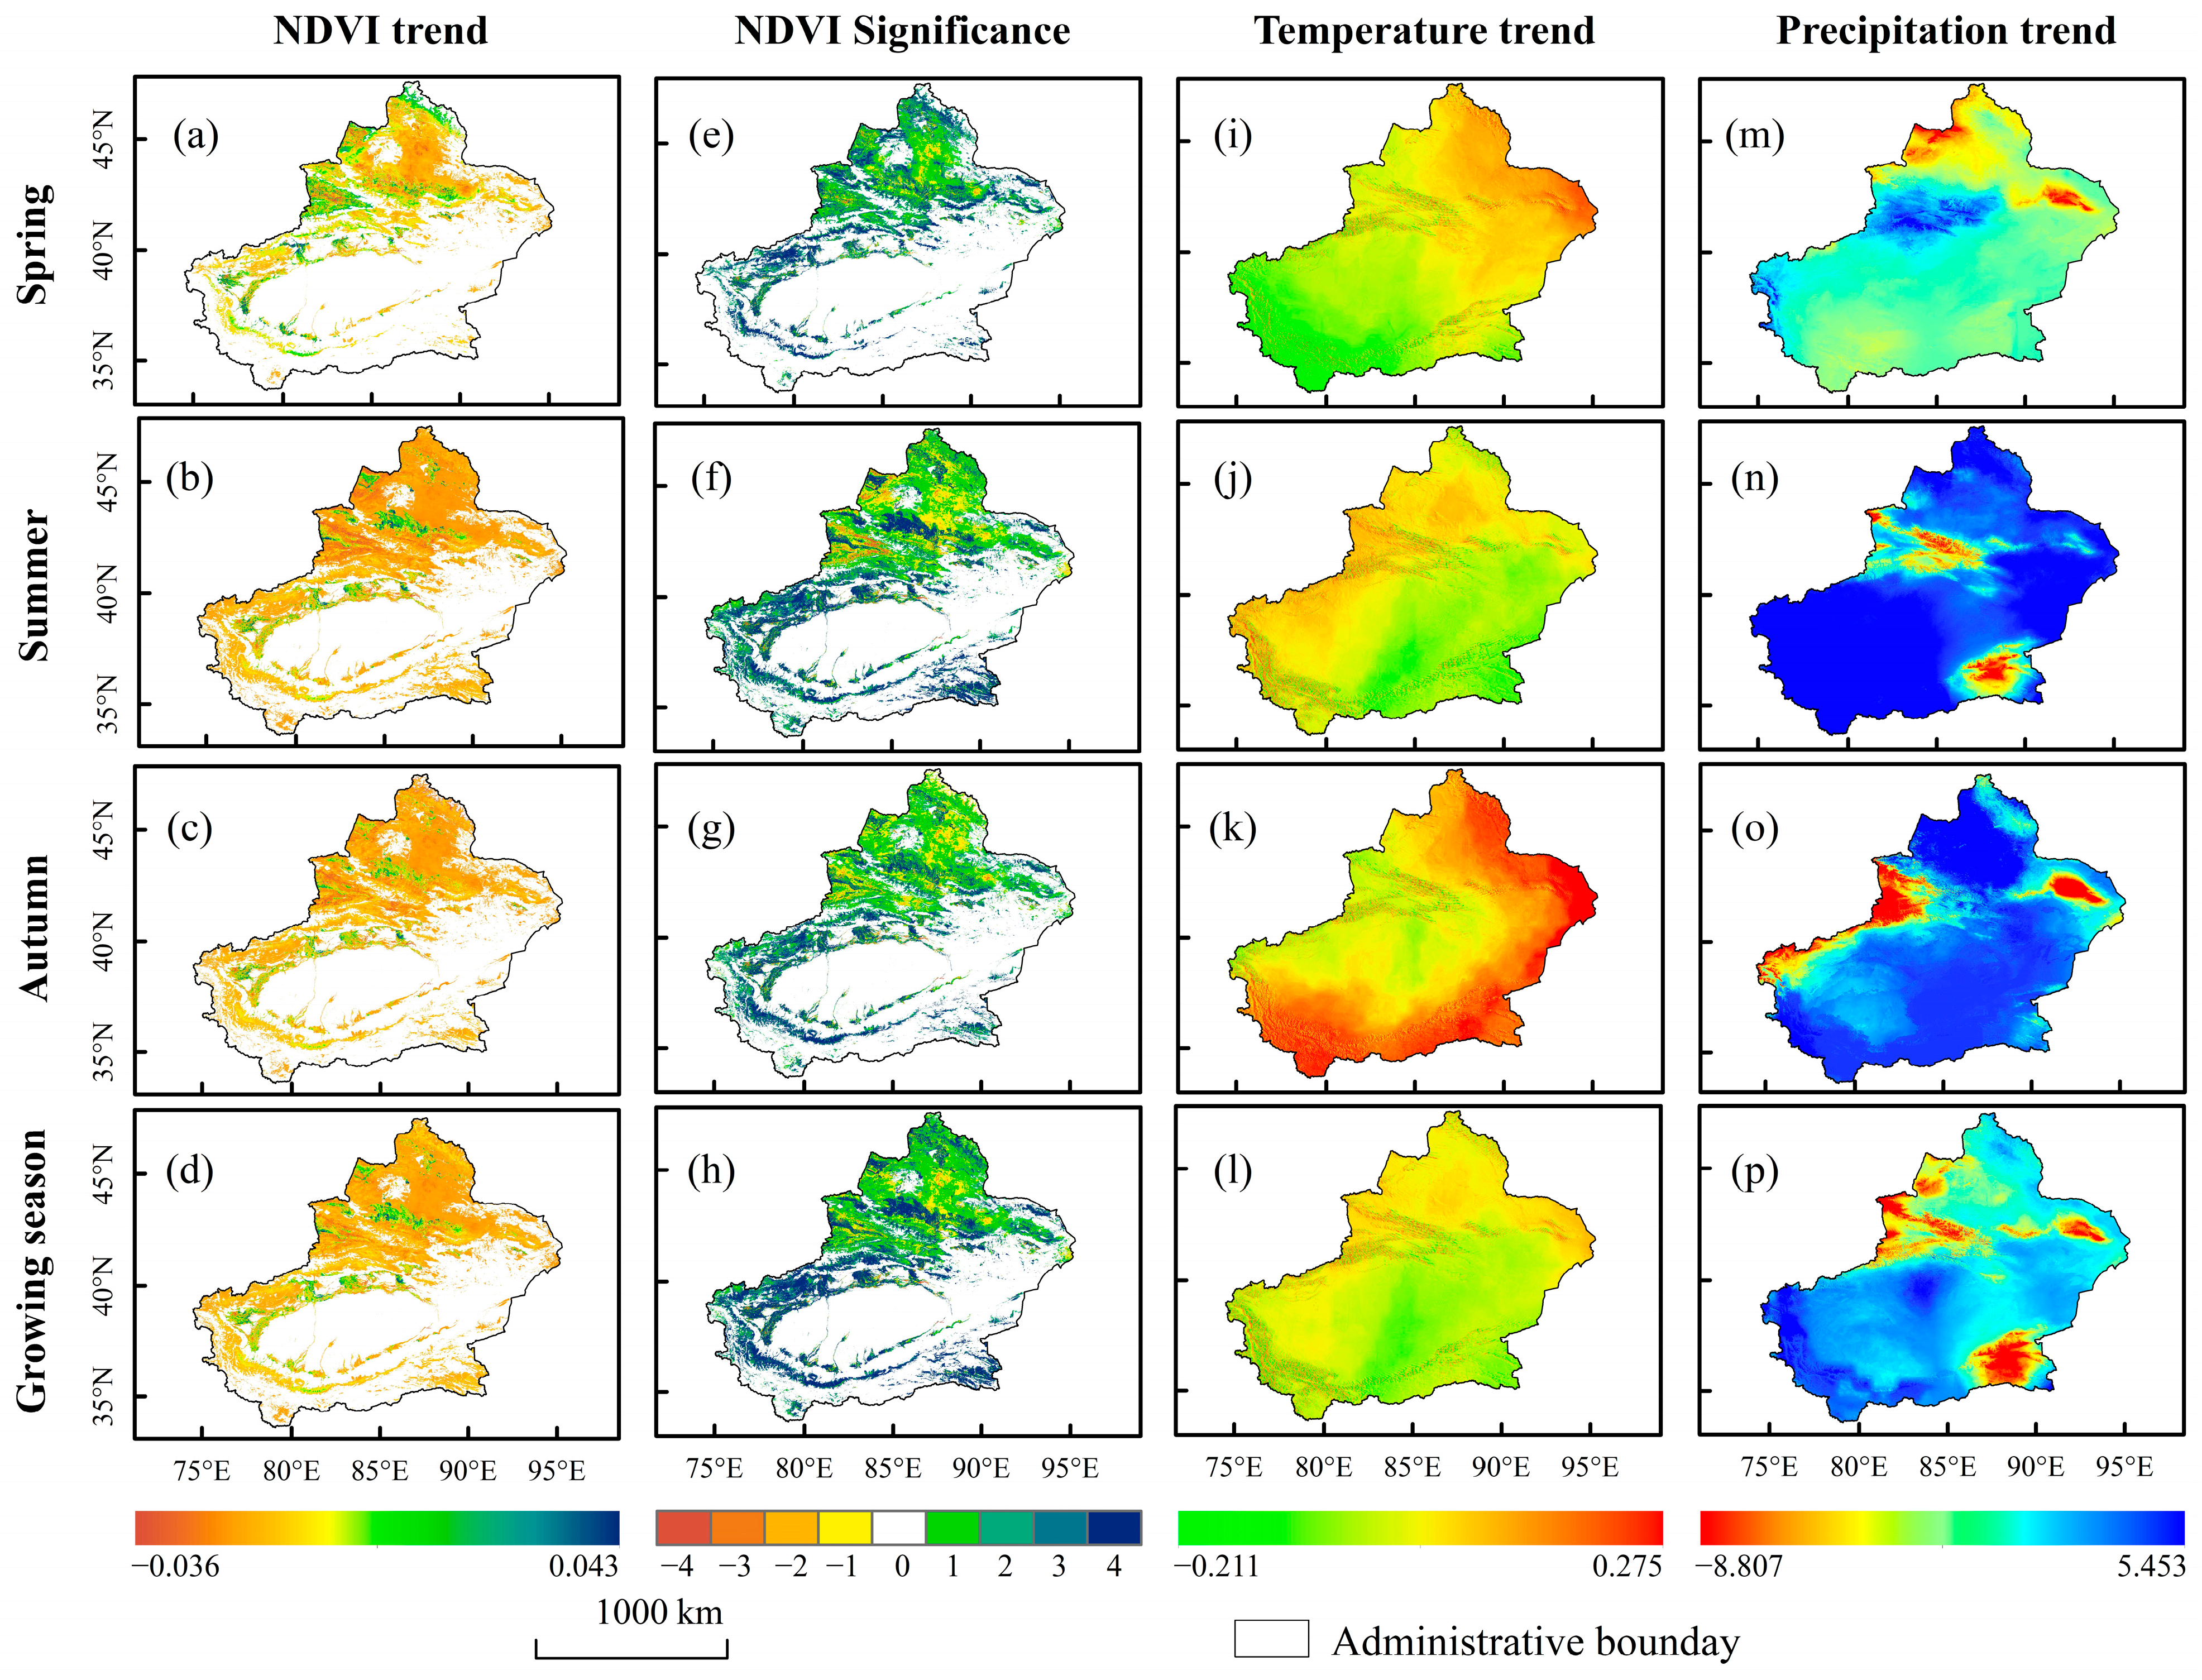
On the spatial scale, the proportion of areas with an increasing trend in the interannual NDVI was 88.95%, of which 0.33% showed an extremely significant improvement and 16.2% showed extremely significant degradation. During spring, approximately 88.16% of the region displayed an upward trend, with 9.94% experiencing an extremely significant improvement and 0.19% facing extreme degradation. In summer, the upward trend covered 74.92% of the area, with 12.93% showing an extremely significant improvement and 0.89% undergoing extreme degradation. During autumn, 77.37% of the area exhibited an increasing trend, of which 9.63% of the area was extremely significantly improved and 0.43% was extremely significantly degraded. A total of 84.29% of the area showed an increasing trend in the growing season.
(3)
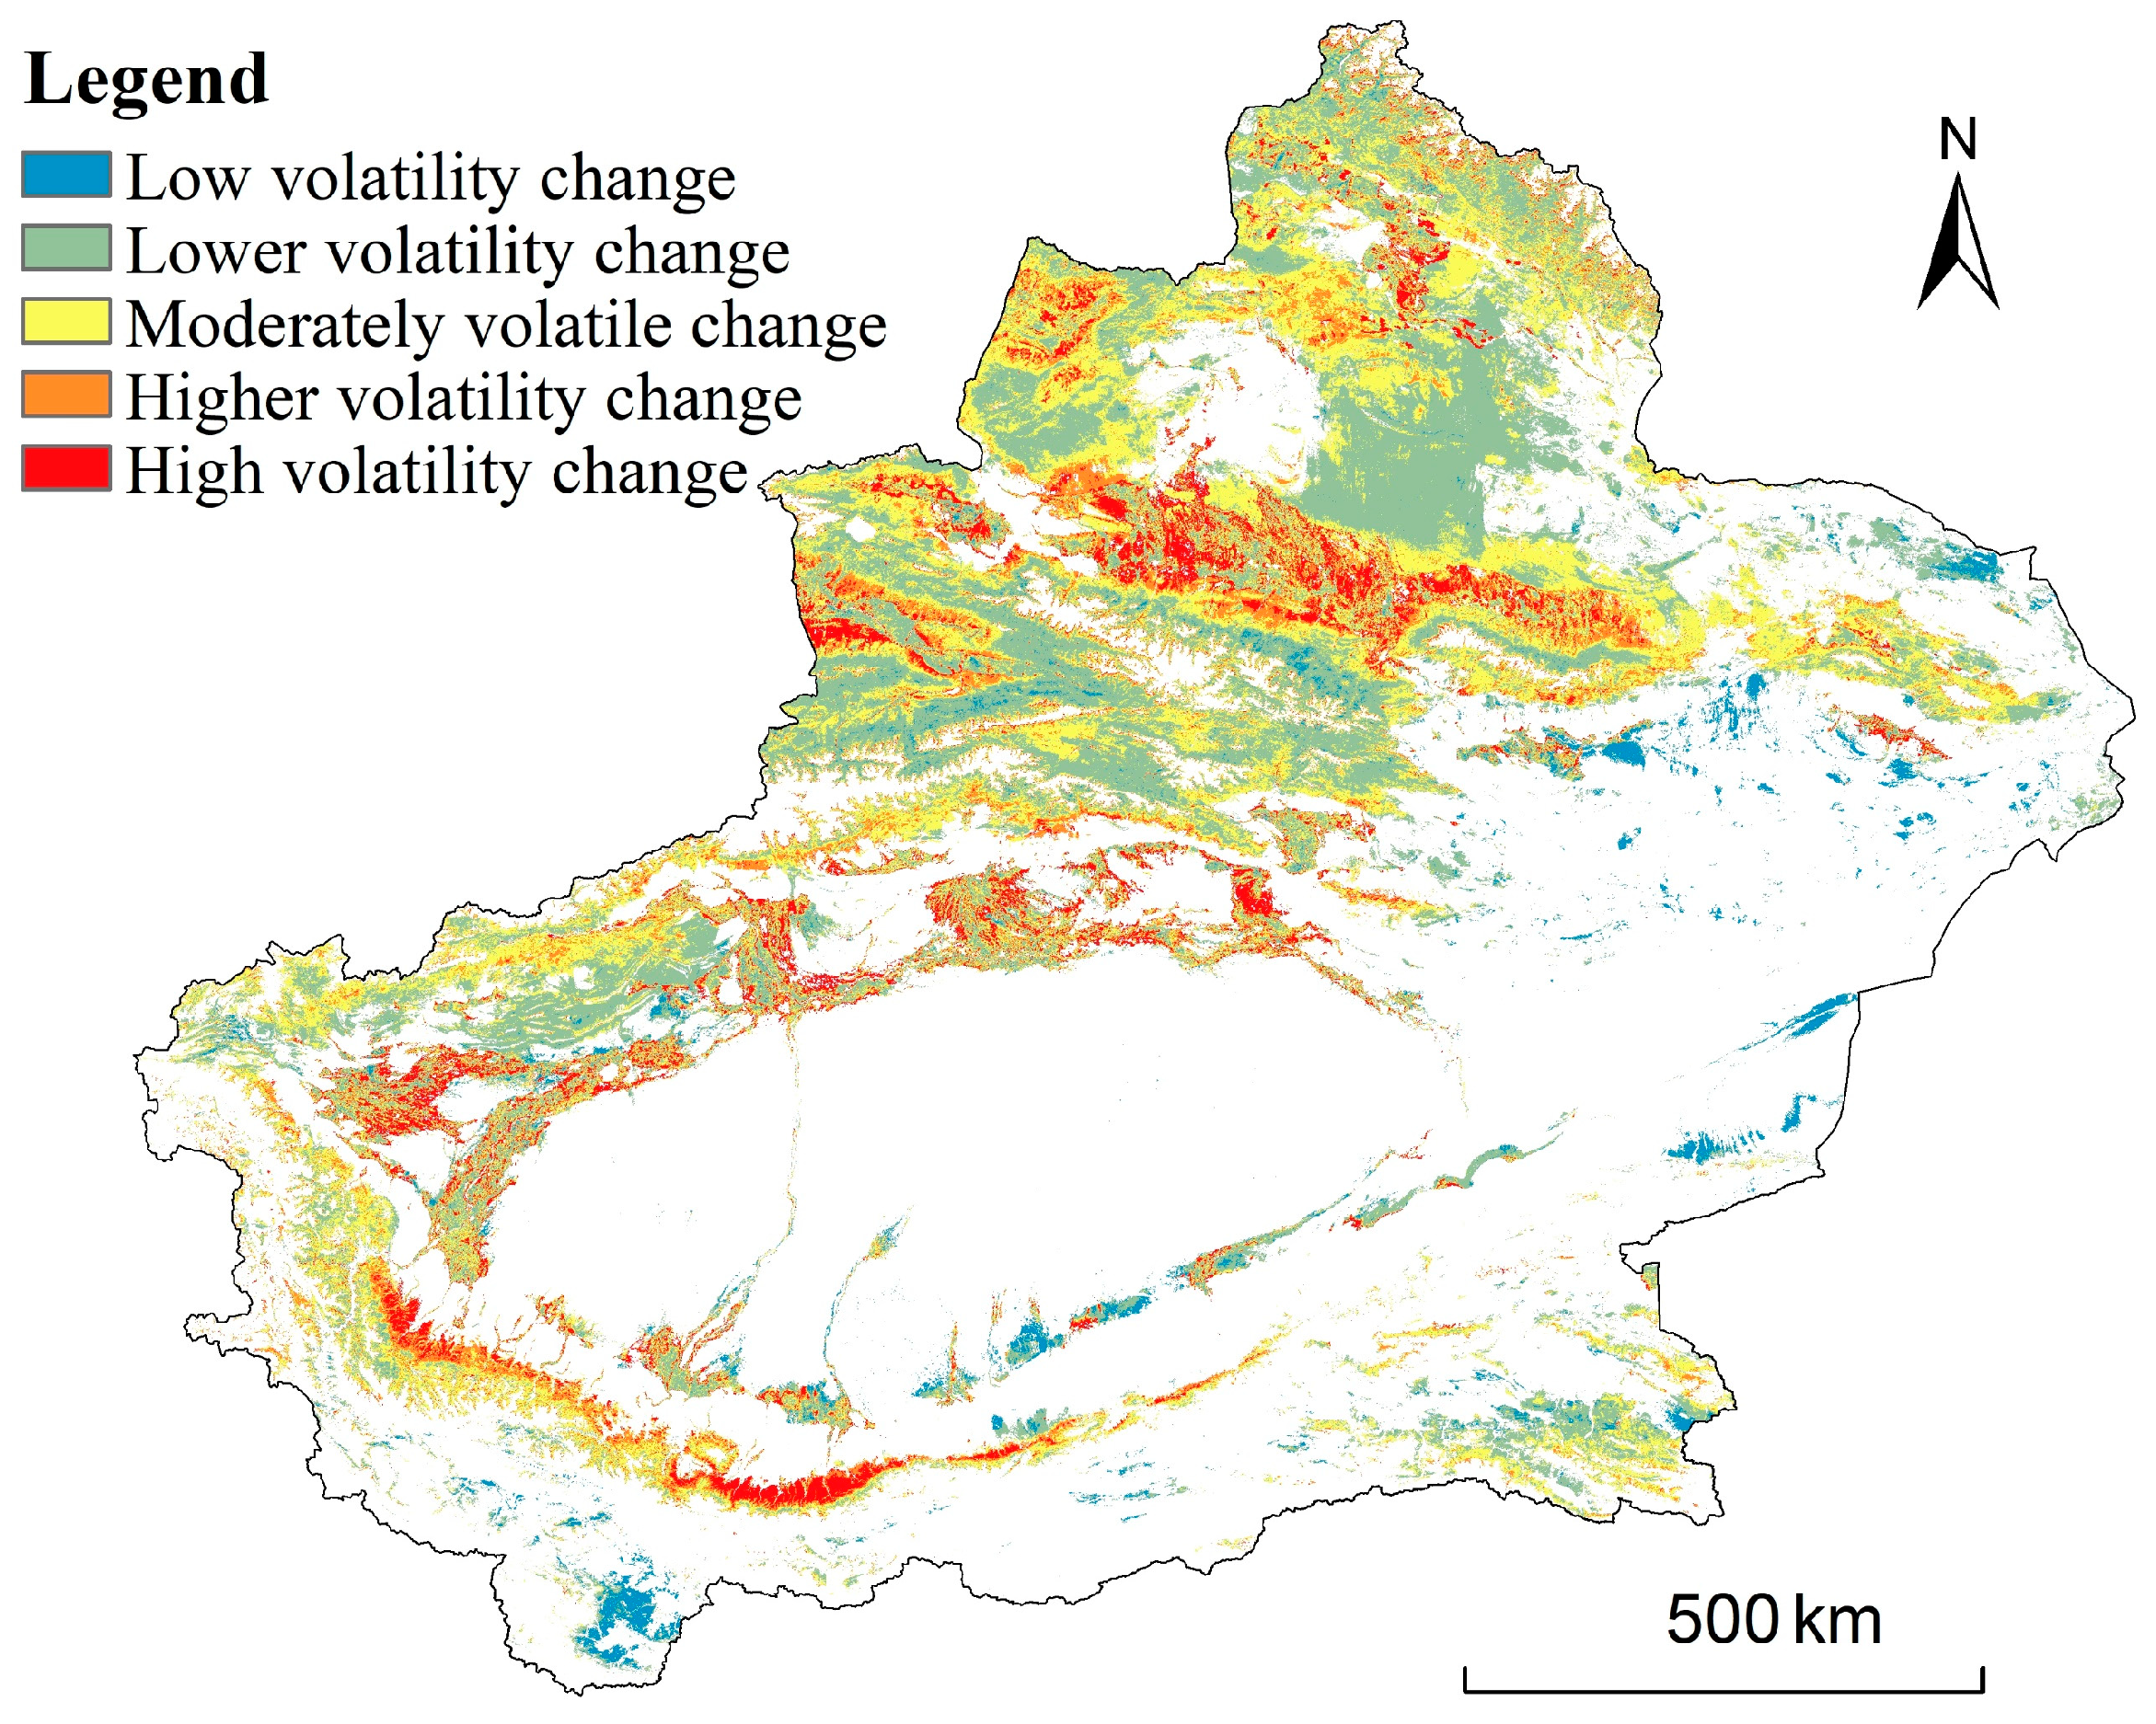
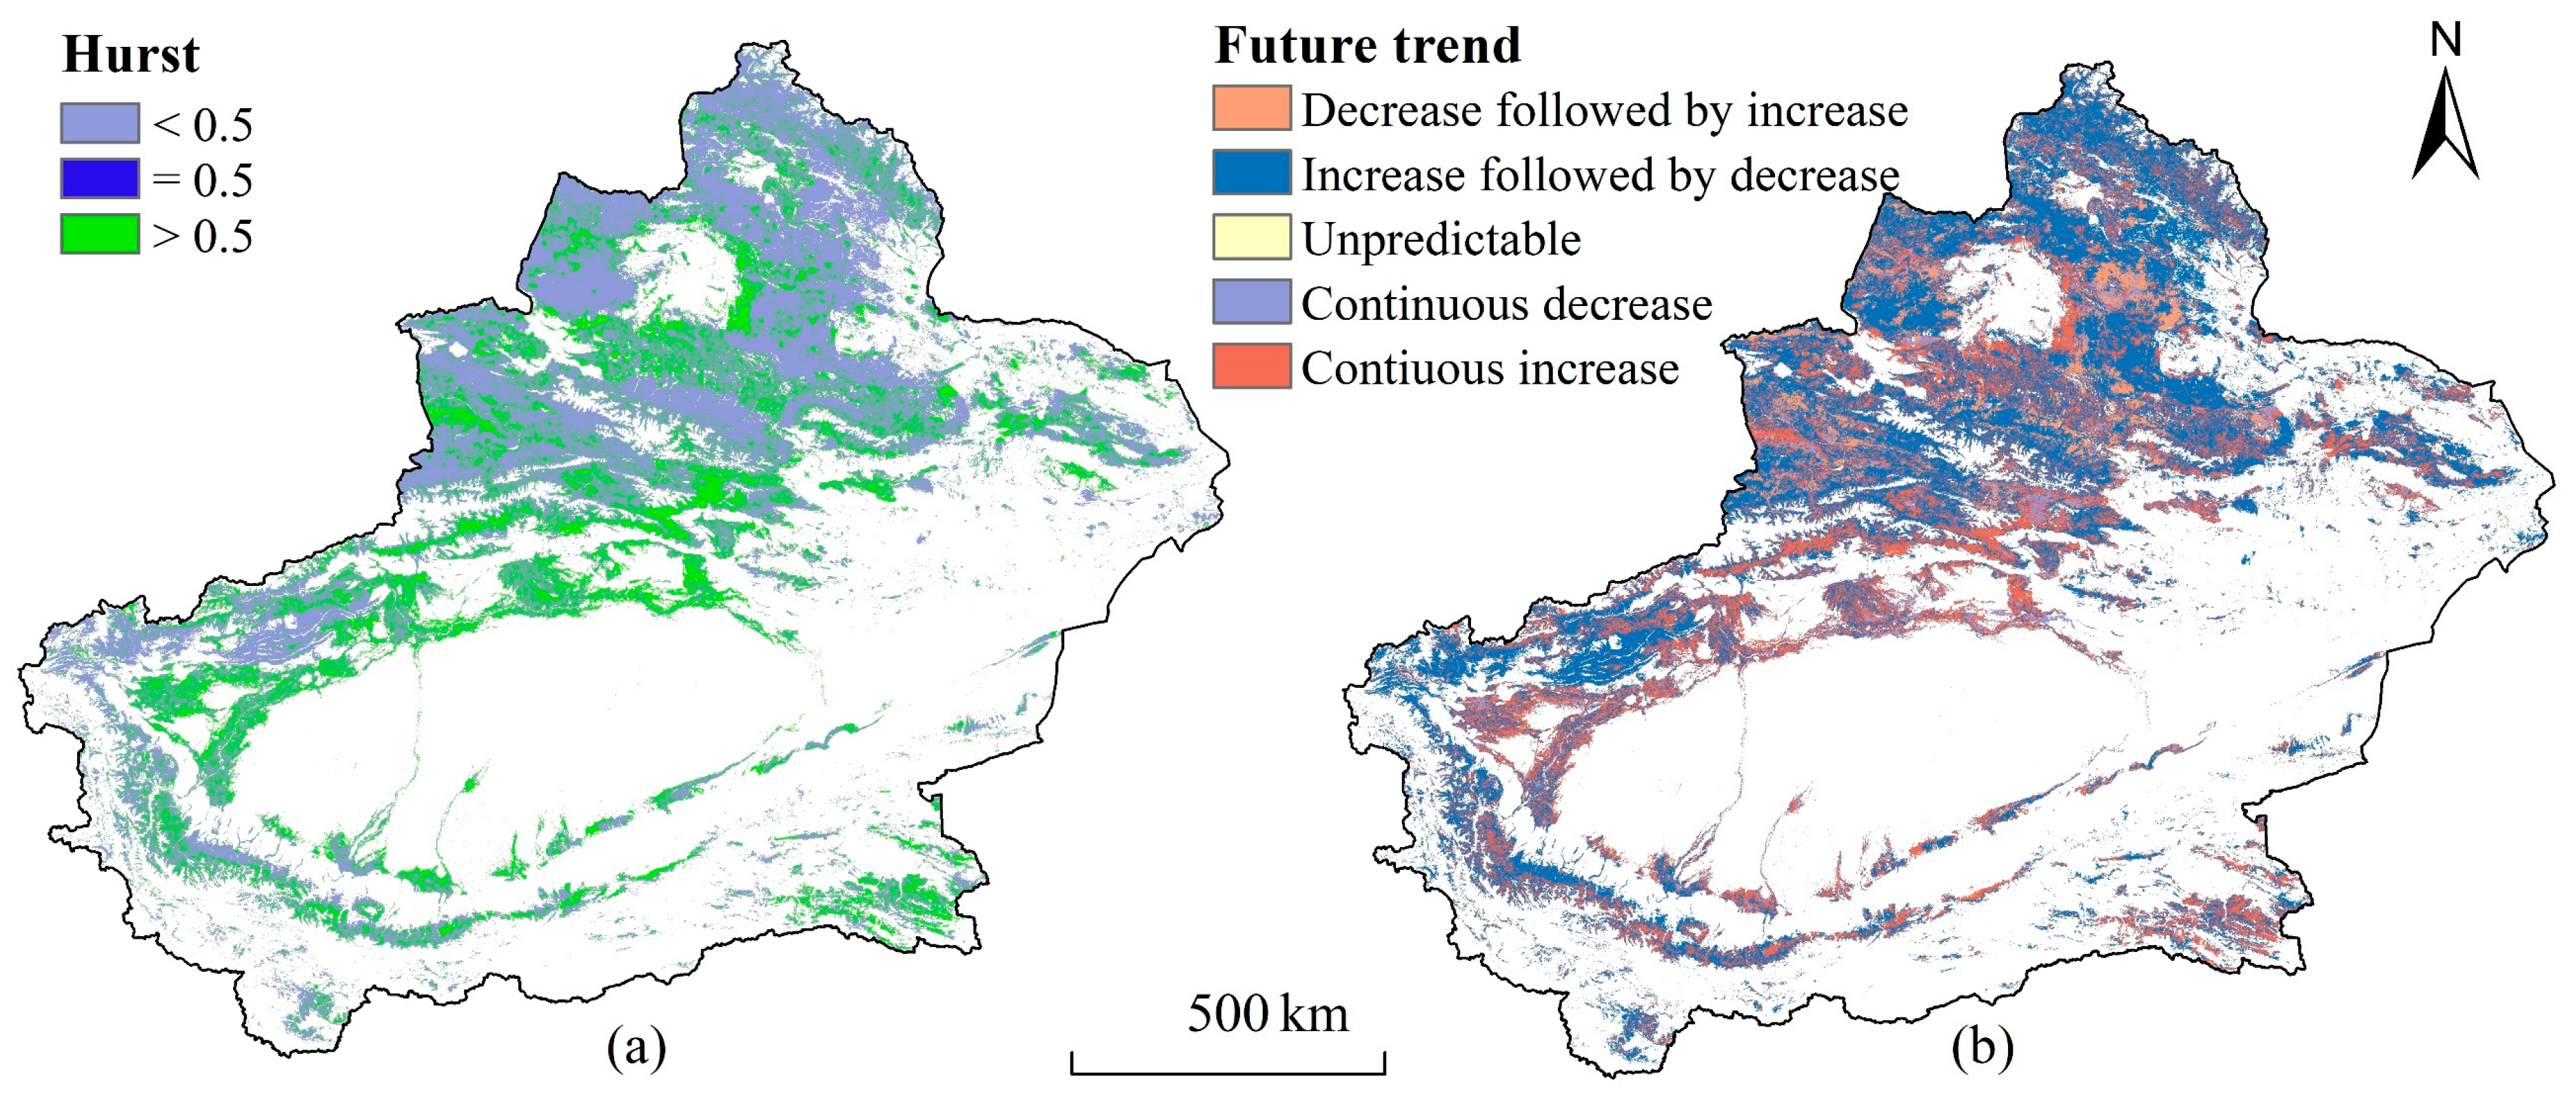
The NDVI in Xinjiang was generally more stable. However, the relatively high fluctuation area (12.26%) and the high fluctuation area (8.69) were more affected by climatic conditions and human activities. In the future, the reversal of vegetation changes in Xinjiang will be more persistent, and the protection of local vegetation should be further strengthened.
(4)
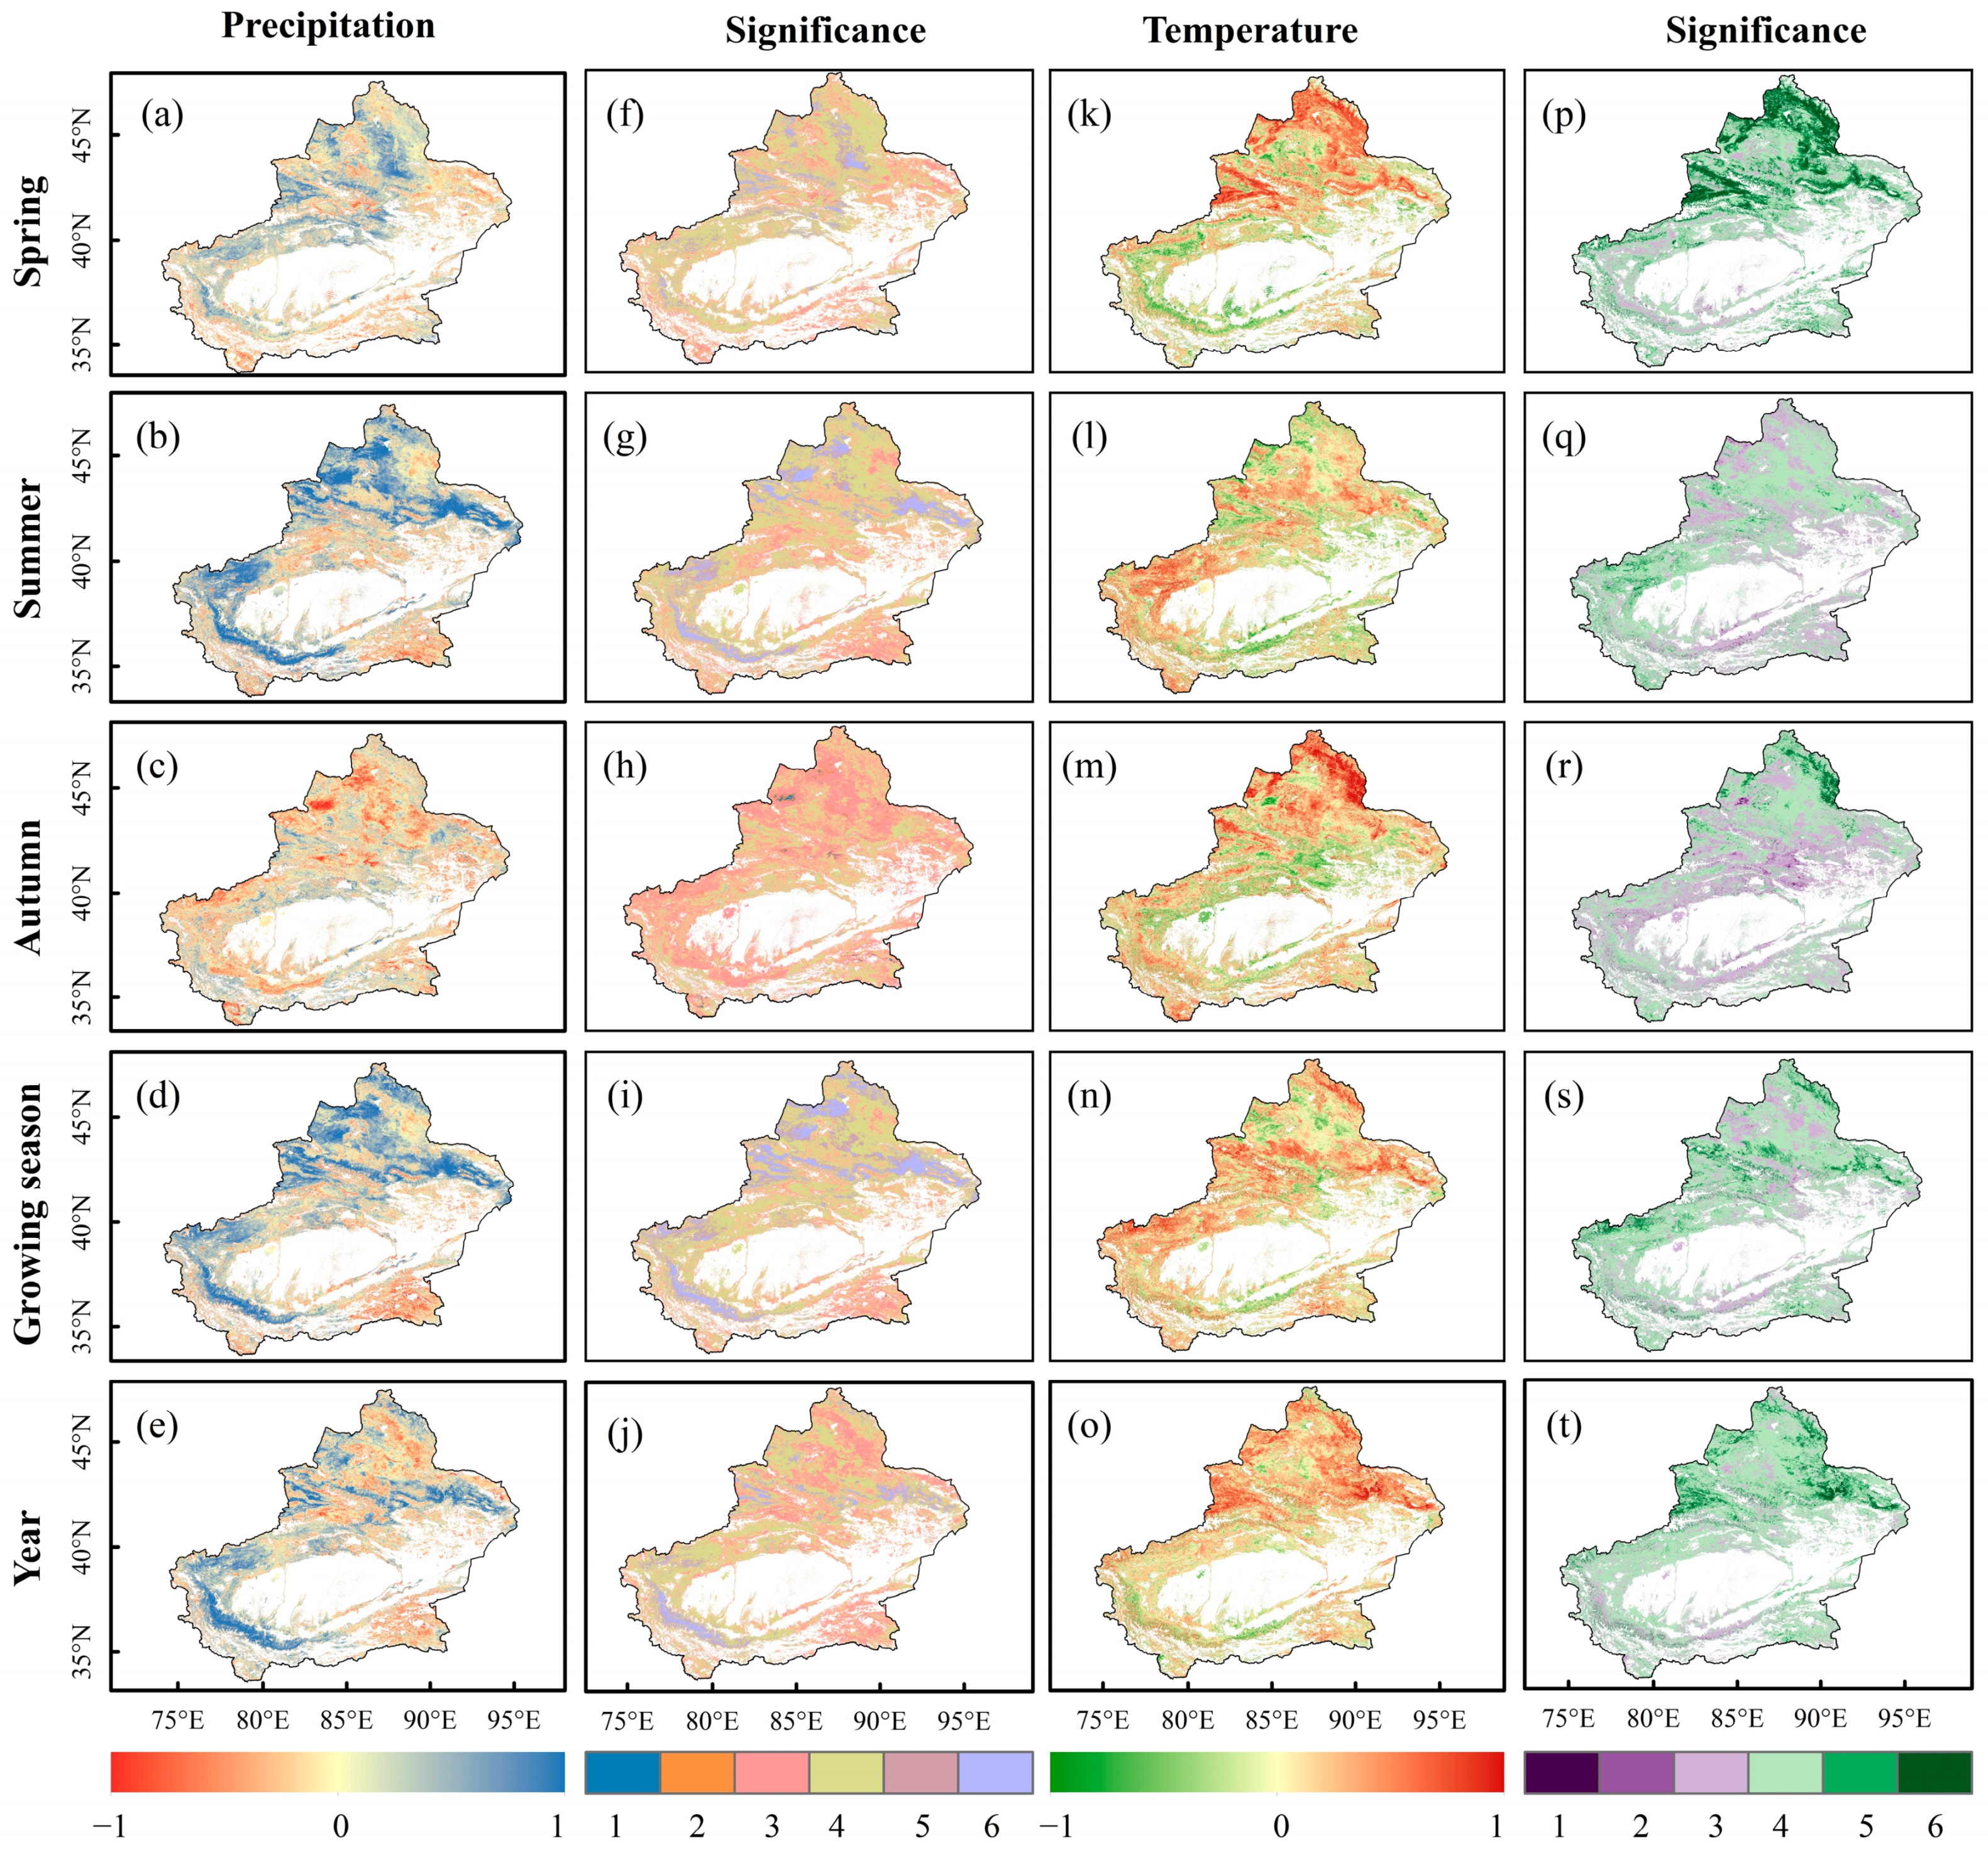
The response of the NDVI to various climatic factors exhibited variations, with a general positive correlation on an interannual scale. Notably, the impact of temperature on NDVI variation (80.94%) surpassed that of precipitation (63.82%) in the study area. Precipitation demonstrated a predominant positive correlation with NDVI in spring, summer, and the growing season. However, in autumn, there was a negative correlation, accounting for 58.48% of the area. Temperature was positively correlated with NDVI in all seasons, and the percentage of influence was in the order spring > growing season > summer > autumn.
(5)
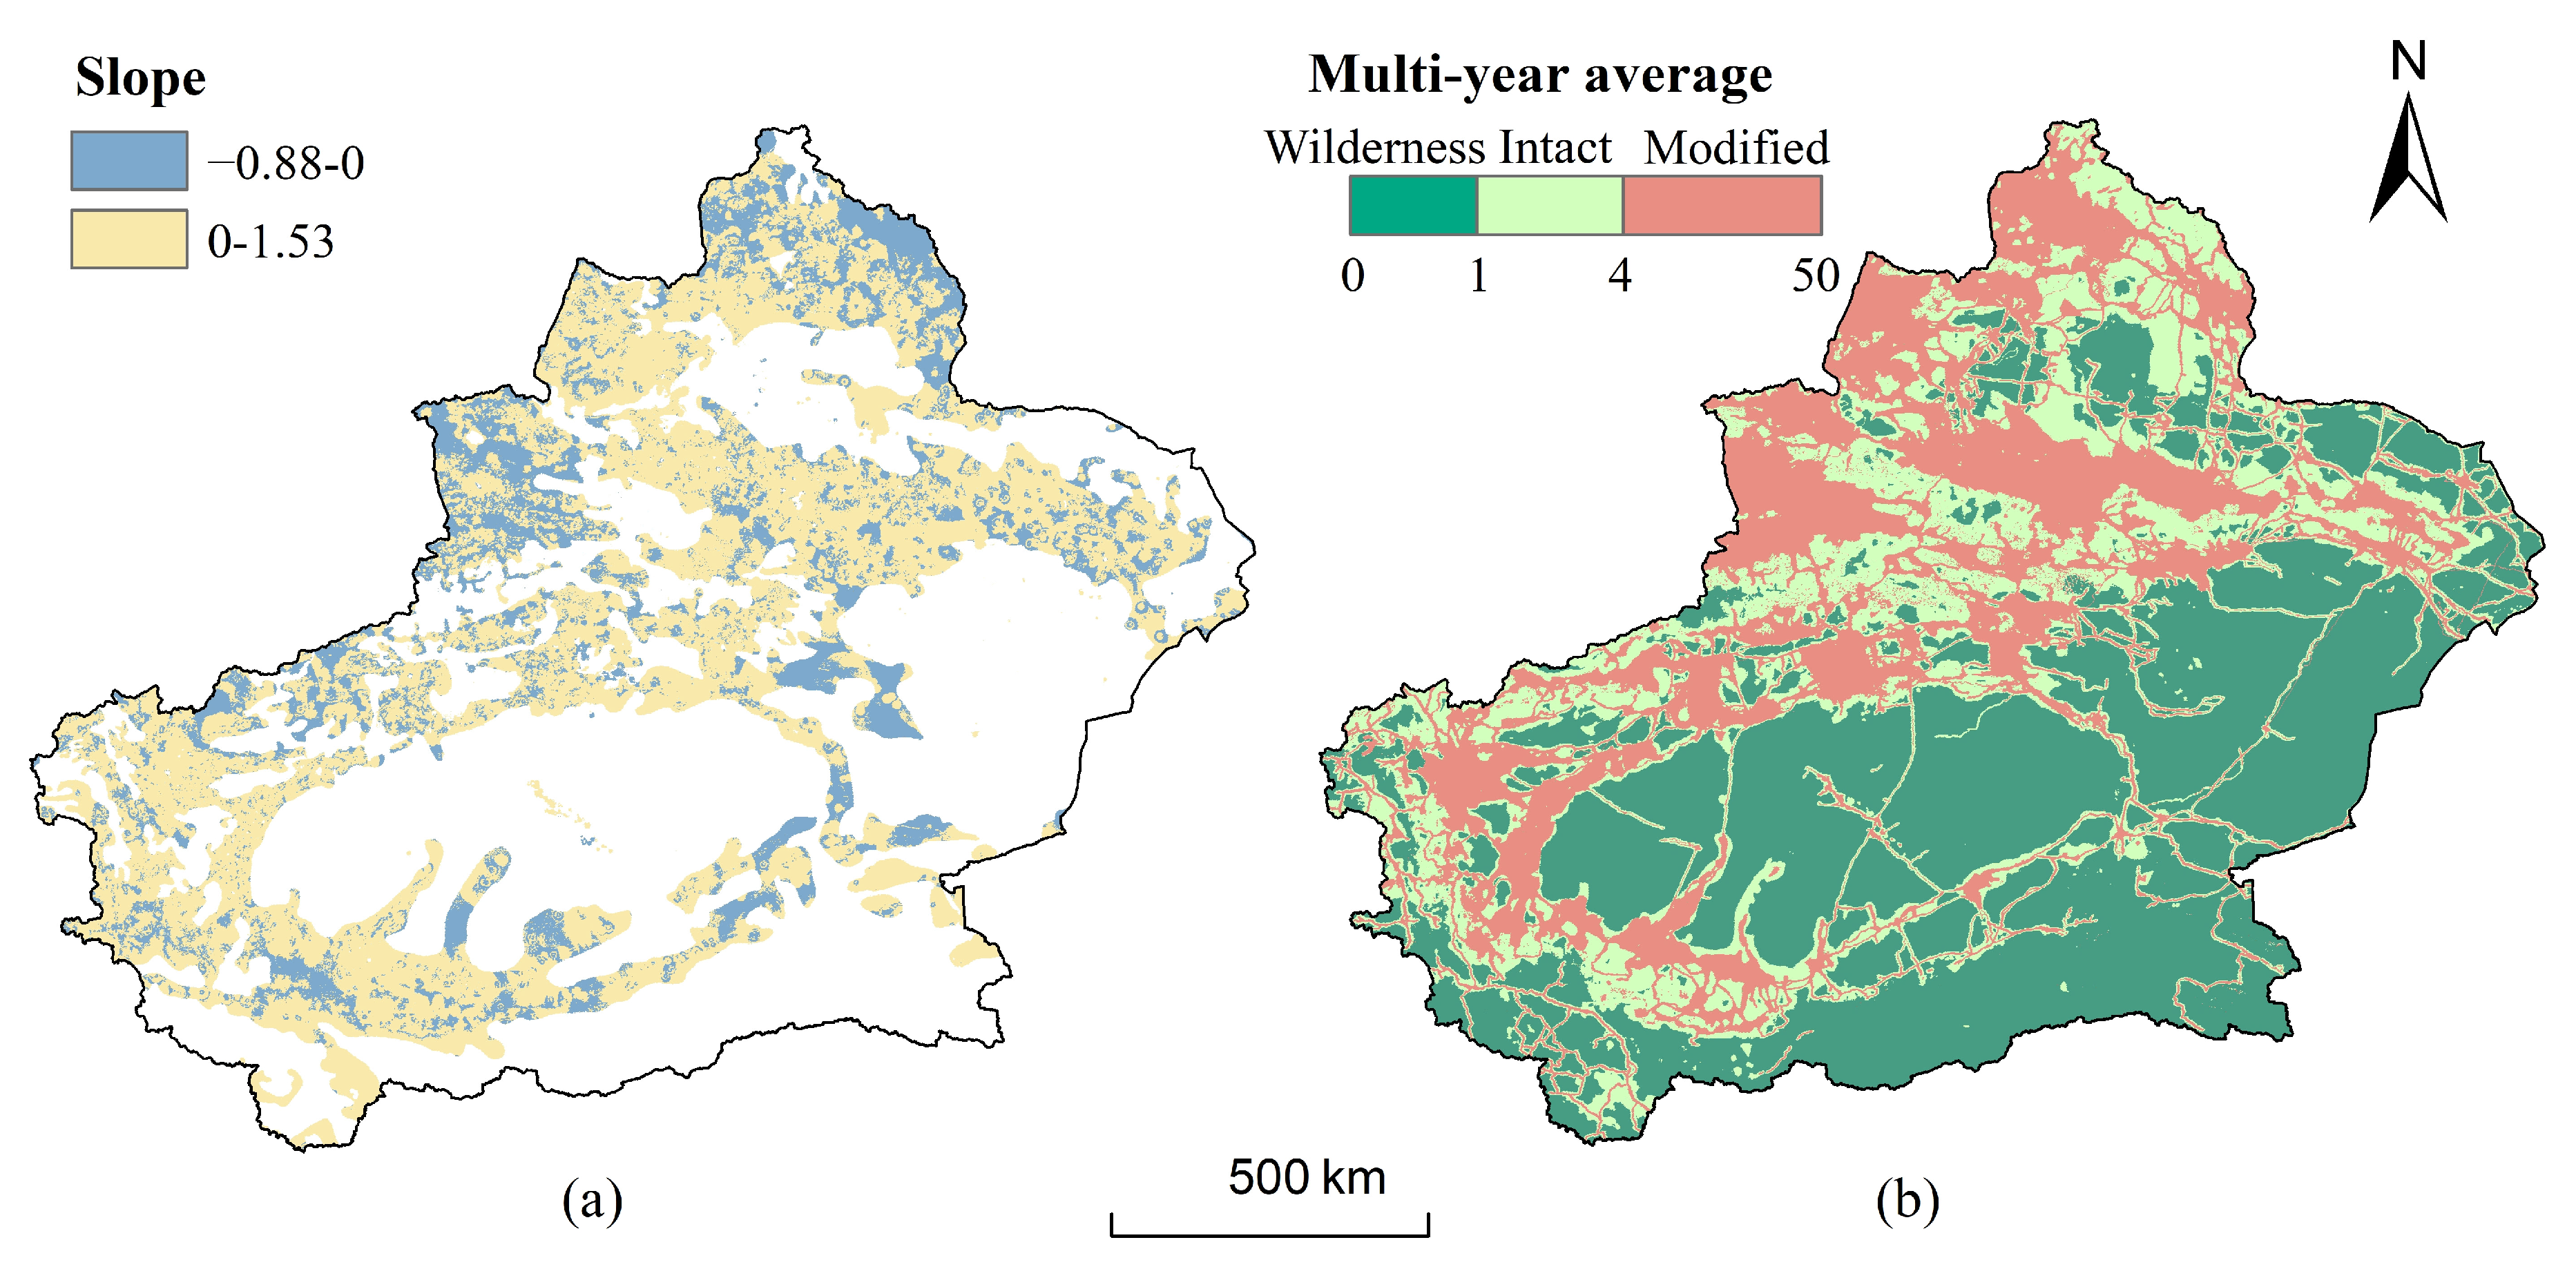
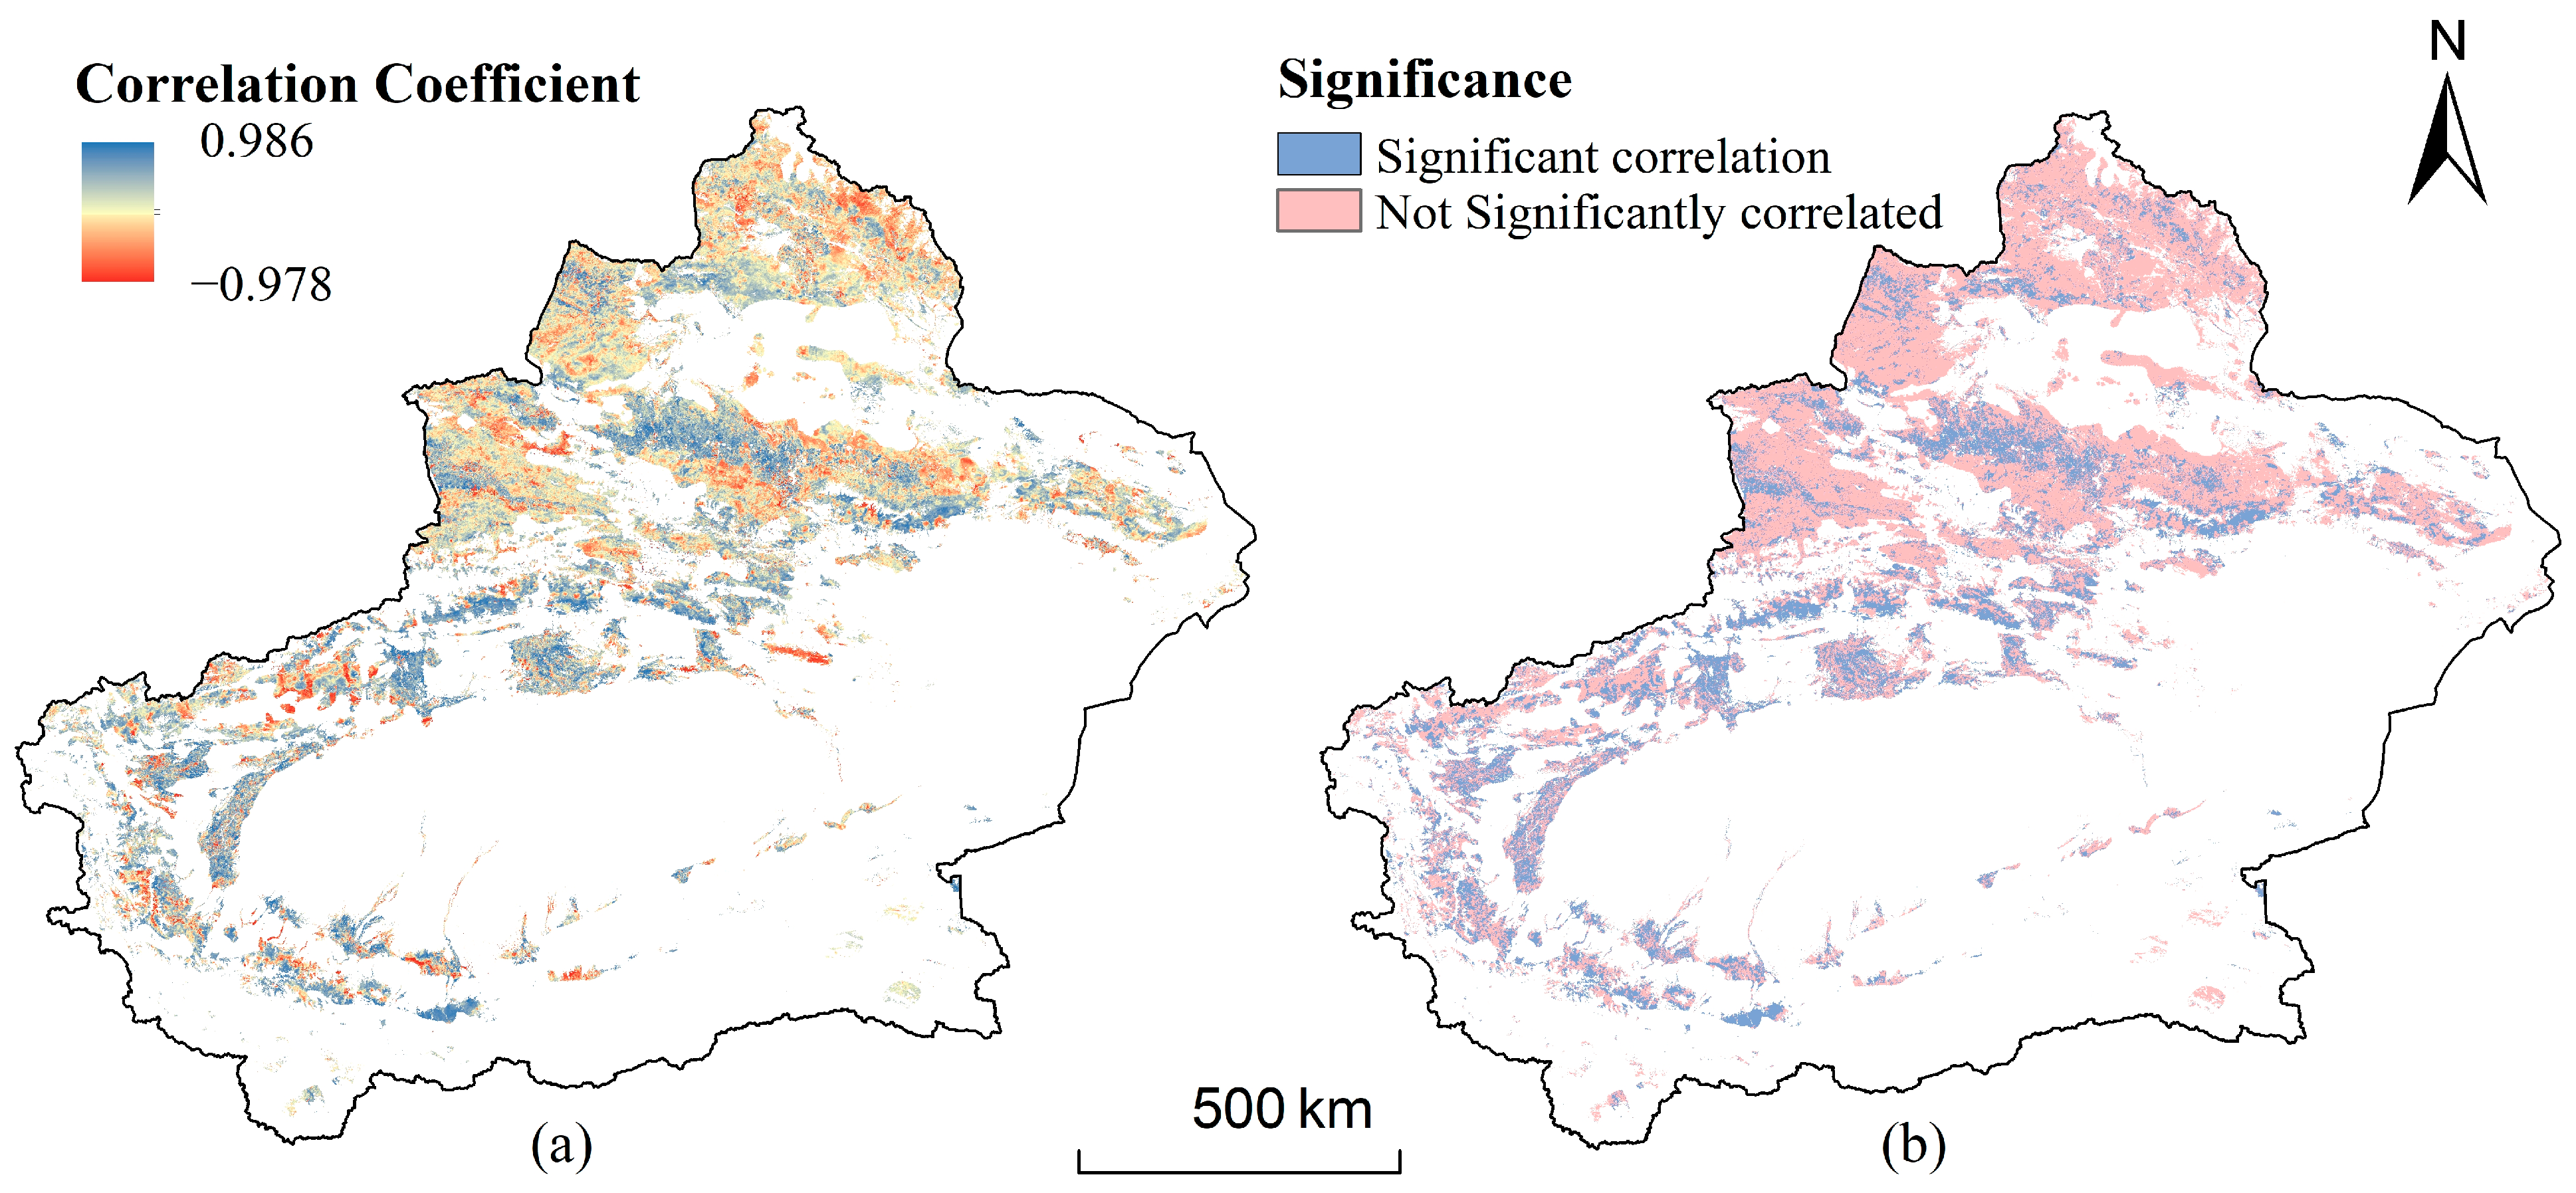
The impact of the human footprint on vegetation cover varied significantly across the study area, with the most pronounced effect observed in areas characterized by low and medium–low vegetation cover. The human footprint data were significantly correlated with the interannual NDVI in 34.79% of the area. In the future, the protection of ecologically fragile areas should be increased to increase the desert-vegetation cover.

Author Contributions

Conceptualization, Q.Z.; methodology, Q.Z. and L.G.; software, L.G.; validation, Q.Z. and Y.L.; formal analysis, L.G. and Y.Z.; investigation, Q.Z., L.G. and. Y.Z.; resources, Q.Z., Y.L. and Y.Z.; data curation, Q.Z. and L.G.; writing—original draft preparation, Q.Z.; writing—review and editing, Y.Z.; supervision, Y.Z. and L.G.; project administration, Y.L.; funding acquisition, Y.L. All authors have read and agreed to the published version of the manuscript.

Funding

This study was supported by the Basic Resource Investigate Project of the Ministry of Science and Technology: Land Resource Carrying Capacity and Ecological Agriculture Investigation and assessment of Turpan-Hami Basin (2022xjkk1100).

Data Availability Statement

All data, models, or code generated or used during the study are available from the author by request ([email protected]).

Acknowledgments

I would like to thank Y.Z., Y.L. and L.G. for their guidance on this paper and these programs for their support.

Conflicts of Interest

The authors declare no conflicts of interest.

References

  1. Wang, J.; Meng, J.J.; Cai, Y.L. Assessing vegetation dynamics impacted by climate change in the southwestern karst region of China with AVHRR NDVI and AVHRR NPP time-series. Environ. Geol. 2007, 54, 1185–1195. [Google Scholar] [CrossRef]
  2. Yang, L.; Guan, Q.; Lin, J.; Tian, J.; Tan, Z.; Li, H. Evolution of NDVI secular trends and responses to climate change: A perspective from nonlinearity and nonstationarity characteristics. Remote Sens. Environ. 2021, 254, 112247. [Google Scholar] [CrossRef]
  3. Xu, Z.; Cao, L.; Zhong, S.; Liu, G.; Yang, Y.; Zhu, S.; Luo, X.; Di, L. Trends in Global Vegetative Drought from Long-Term Satellite Remote Sensing Data. IEEE J. Sel. Top. Appl. Earth Obs. Remote Sens. 2020, 13, 815–826. [Google Scholar] [CrossRef]
  4. Yang, J.; Yang, Y.; Sun, D.; Jin, C.; Xiao, X. Influence of urban morphological characteristics on thermal environment. Sustain. Cities Soc. 2021, 72, 103045. [Google Scholar] [CrossRef]
  5. Yan, J.; Zhang, G.; Ling, H.; Han, F. Comparison of time-integrated NDVI and annual maximum NDVI for assessing grassland dynamics. Ecol. Indic. 2022, 136, 108611. [Google Scholar] [CrossRef]
  6. Ye, Z.-X.; Cheng, W.-M.; Zhao, Z.-Q.; Guo, J.-Y.; Ding, H.; Wang, N. Interannual and Seasonal Vegetation Changes and Influencing Factors in the Extra-High Mountainous Areas of Southern Tibet. Remote Sens. 2019, 11, 1392. [Google Scholar] [CrossRef]
  7. Zhang, Y.; Zhang, K.-C.; An, Z.-S.; Yu, Y.-P. Quantification of driving factors on NDVI in oasis-desert ecotone using geographical detector method. J. Mt. Sci. 2019, 16, 2615–2624. [Google Scholar] [CrossRef]
  8. Wang, M.; Fu, J.E.; Wu, Z.; Pang, Z. Spatiotemporal Variation of NDVI in the Vegetation Growing Season in the Source Region of the Yellow River, China. ISPRS Int. J. Geo-Inf. 2020, 9, 282. [Google Scholar] [CrossRef]
  9. Mo, K.; Chen, Q.; Chen, C.; Zhang, J.; Wang, L.; Bao, Z. Spatiotemporal variation of correlation between vegetation cover and precipitation in an arid mountain-oasis river basin in northwest China. J. Hydrol. 2019, 574, 138–147. [Google Scholar] [CrossRef]
  10. Zheng, Y.; Han, J.; Huang, Y.; Fassnacht, S.R.; Xie, S.; Lv, E.; Chen, M. Vegetation response to climate conditions based on NDVI simulations using stepwise cluster analysis for the Three-River Headwaters region of China. Ecol. Indic. 2018, 92, 18–29. [Google Scholar] [CrossRef]
  11. Li, P.; Wang, J.; Liu, M.; Xue, Z.; Bagherzadeh, A.; Liu, M. Spatio-temporal variation characteristics of NDVI and its response to climate on the Loess Plateau from 1985 to 2015. Catena 2021, 203, 105331. [Google Scholar] [CrossRef]
  12. Zhu, Y.; Zhao, J.; Lei, P.; Yang, K.; Zhang, S.; Yin, X.; Jiang, Y. Vegetation dynamics and their relationships with climatic factors in the “Golden Triangle” region. Environ. Sci. Pollut. Res. 2022, 29, 73029–73042. [Google Scholar] [CrossRef] [PubMed]
  13. Lu, C.; Hou, M.; Liu, Z.; Li, H.; Lu, C. Variation Characteristic of NDVI and its Response to Climate Change in the Middle and Upper Reaches of Yellow River Basin, China. IEEE J. Sel. Top. Appl. Earth Obs. Remote Sens. 2021, 14, 8484–8496. [Google Scholar] [CrossRef]
  14. Li, C.; Li, Y.; Tang, L.; Ikenaga, M.; Liu, R.; Xu, G. Soil microbial community shifts explain habitat heterogeneity in two Haloxylon species from a nutrient perspective. Ecol. Evol. 2023, 13, e9727. [Google Scholar] [CrossRef] [PubMed]
  15. Xu, H.-j.; Wang, X.-p.; Yang, T.-b. Trend shifts in satellite-derived vegetation growth in Central Eurasia, 1982–2013. Sci. Total Environ. 2017, 579, 1658–1674. [Google Scholar] [CrossRef] [PubMed]
  16. Paruelo, J.M.; Lauenroth, W.K. Regional Patterns of Normalized Difference Vegetation Index in North American Shrublands and Grasslands. Ecology 1995, 76, 1888–1898. [Google Scholar] [CrossRef]
  17. Du, J.; Gao, Y.; Jiaerheng, A.; Zhao, C.; Fang, G.; Yuan, X.; Yin, J.; Shu, J. Spatio-temporal patterns and driving factors of vegetation growth anomalies in Xinjiang over the last three decades. Acta Ecol. Sin. 2016, 36, 1915–1927. [Google Scholar]
  18. Lamchin, M.; Lee, W.-K.; Jeon, S.W.; Wang, S.W.; Lim, C.H.; Song, C.; Sung, M. Long-term trend and correlation between vegetation greenness and climate variables in Asia based on satellite data. Sci. Total Environ. 2018, 618, 1089–1095. [Google Scholar] [CrossRef] [PubMed]
  19. Ichii, K.; Yamaguchi, Y.; Kawabata, A. Global decadal changes in NDVI and its relationships to climate variables. In Proceedings of the IGARSS 2001. Scanning the Present and Resolving the Future. IEEE 2001 International Geoscience and Remote Sensing Symposium (Cat. No. 01CH37217); Sydney, NSW, Australia, 9–13 July 2001, pp. 1818–1819.
  20. Wang, S.; Ping, C.; Wang, N.; Wen, J.; Zhang, K.; Yuan, K.; Yang, J. Quantitatively determine the dominant driving factors of the spatial-temporal changes of vegetation-impacts of global change and human activity. Open Geosci. 2022, 14, 568–589. [Google Scholar] [CrossRef]
  21. Chen, L.; Halike, A.; Yao, K.; Wei, Q. Spatiotemporal variation in vegetation net primary productivity and its relationship with meteorological factors in the Tarim River Basin of China from 2001 to 2020 based on the Google Earth Engine. J. Arid. Land 2022, 14, 1377–1394. [Google Scholar] [CrossRef]
  22. Xu, C.; Li, J.; Zhao, J.; Gao, S.; Chen, Y. Climate variations in northern Xinjiang of China over the past 50 years under global warming. Quat. Int. 2015, 358, 83–92. [Google Scholar] [CrossRef]
  23. Guan, Q.; Yang, L.; Pan, N.; Lin, J.; Xu, C.; Wang, F.; Liu, Z. Greening and Browning of the Hexi Corridor in Northwest China: Spatial Patterns and Responses to Climatic Variability and Anthropogenic Drivers. Remote Sens. 2018, 10, 1270. [Google Scholar] [CrossRef]
  24. Ren, Z.; Tian, Z.; Wei, H.; Liu, Y.; Yu, Y. Spatiotemporal evolution and driving mechanisms of vegetation in the Yellow River Basin, China during 2000–2020. Ecol. Indic. 2022, 138, 108832. [Google Scholar] [CrossRef]
  25. Ning, T.; Liu, W.; Lin, W.; Song, X. NDVI Variation and Its Responses to Climate Change on the Northern Loess Plateau of China from 1998 to 2012. Adv. Meteorol. 2015, 2015, 725427. [Google Scholar] [CrossRef]
  26. Ma, Y.; Zuo, L.; Gao, J.; Liu, Q.; Liu, L. The karst NDVI correlation with climate and its BAS-BP prediction based on multiple factors. Ecol. Indic. 2021, 132, 108254. [Google Scholar] [CrossRef]
  27. Han, W.; Guan, J.; Zheng, J.; Liu, Y.; Ju, X.; Liu, L.; Li, J.; Mao, X.; Li, C. Probabilistic assessment of drought stress vulnerability in grasslands of Xinjiang, China. Front. Plant Sci. 2023, 14, 1143863. [Google Scholar]
  28. Gao, J.; Shi, Y.; Zhang, H.; Chen, X.; Zhang, W.; Shen, W.; Xiao, T.; Zhang, Y. China Regional 250 m Normalized Difference Vegetation Index Data Set (2000–2022); National Tibetan Plateau/Third Pole Environment Data Center: Beijing, China, 2023. [Google Scholar] [CrossRef]
  29. Xu, X.; Piao, S.; Wang, X.; Chen, A.; Ciais, P.; Myneni, R.B. Spatio-temporal patterns of the area experiencing negative vegetation growth anomalies in China over the last three decades. Environ. Res. Lett. 2012, 7, 035701. [Google Scholar] [CrossRef]
  30. Jia, B.Q. Driving factor analysis on the vegetation changes derived from the Landsat TM images in Beijing. Acta Ecol. Sin. 2013, 33, 1654–1666. [Google Scholar]
  31. Tao, S.; Kuang, T.; Peng, W.; Wang, G. Analyzing the spatio-temporal variation and drivers of NDVI in upper reaches of the Yangtze River from 2000 to 2015: A case study of Yibin City. Acta Ecol. Sin. 2020, 40, 5029–5043. [Google Scholar]
  32. Li, X.; Lei, S.; Cheng, W.; Liu, F.; Wang, W. Spatio-temporal dynamics of vegetation in Jungar Banner of China during 2000–2017. J. Arid Land 2019, 11, 837–854. [Google Scholar] [CrossRef]
  33. Mu, H.; Li, X.; Wen, Y.; Huang, J.; Du, P.; Su, W.; Miao, S.; Geng, M. A global record of annual terrestrial Human Footprint dataset from 2000 to 2018. Sci. Data 2022, 9, 176. [Google Scholar] [CrossRef]
  34. Lavagnini, I.; Badocco, D.; Pastore, P.; Magno, F. Theil–Sen nonparametric regression technique on univariate calibration, inverse regression and detection limits. Talanta 2011, 87, 180–188. [Google Scholar] [CrossRef] [PubMed]
  35. Gocic, M.; Trajkovic, S. Analysis of changes in meteorological variables using Mann-Kendall and Sen’s slope estimator statistical tests in Serbia. Glob. Planet. Change 2013, 100, 172–182. [Google Scholar] [CrossRef]
  36. Wessels, K.J.; Prince, S.D.; Malherbe, J.; Small, J.; Frost, P.E.; VanZyl, D. Can human-induced land degradation be distinguished from the effects of rainfall variability? A case study in South Africa. J. Arid Environ. 2007, 68, 271–297. [Google Scholar] [CrossRef]
  37. Milich, L.; Weiss, E. GAC NDVI interannual coefficient of variation (CoV) images: Ground truth sampling of the Sahel along north-south transects. Int. J. Remote Sens. 2000, 21, 235–260. [Google Scholar] [CrossRef]
  38. Hurst, H.E. Long-term storage capacity of reservoirs. Transactions of the American society of civil engineers. Trans. Am. Soc. Civ. Eng. 1951, 116, 770–799. [Google Scholar] [CrossRef]
  39. Mandelbrot, B.B.; Wallis, J.R. Robustness of the rescaled range R/S in the measurement of noncyclic long run statistical dependence. Water Resour. Res. 1969, 5, 967–988. [Google Scholar] [CrossRef]
  40. Zhang, L.; Li, X.; Feng, J.; Rao, R.; He, T.; Chen, Y. Spatial-temporal Changes of NDVI in Yellow River Basin and Its Dual Response to Climate Change and Human Activities During 2000–2018. Bull. Soil Water Conserv. 2021, 41, 276–286. [Google Scholar]
  41. Li, S.; Yang, S.; Liu, X.; Liu, Y.; Shi, M. NDVI-based analysis on the influence of climate change and human activities on vegetation restoration in the Shaanxi-Gansu-Ningxia Region, Central China. Remote Sens. 2015, 7, 11163–11182. [Google Scholar] [CrossRef]
  42. Zhong, R.; Wang, P.; Mao, G.; Chen, A.; Liu, J. Spatiotemporal variation of enhanced vegetation index in the Amazon Basin and its response to climate change. Phys. Chem. Earth Parts A/B/C 2021, 123, 103024. [Google Scholar] [CrossRef]
  43. Yuan, L.; Jiang, W.; Shen, W.; Liu, Y.; Wang, W.; Tao, L.; Zheng, H.; Liu, X. The spatio-temporal variations of vegetation cover in the Yellow River Basin from 2000 to 2010. Acta Ecol. Sin. 2013, 33, 7798–7806. [Google Scholar]
  44. Piao, S.; Wang, X.; Ciais, P.; Zhu, B.; Wang, T.; Liu, J. Changes in satellite-derived vegetation growth trend in temperate and boreal Eurasia from 1982 to 2006. Glob. Change Biol. 2011, 17, 3228–3239. [Google Scholar] [CrossRef]
  45. Wei, Y.; Sun, S.; Liang, D.; Jia, Z. Spatial–temporal variations of NDVI and its response to climate in China from 2001 to 2020. Int. J. Digit. Earth 2022, 15, 1463–1484. [Google Scholar] [CrossRef]
  46. Li, J.; Liu, H.; Li, L.; Li, C. Vegetation dynamic changes in northwest China based on multi-source remote sensing datasets in recent 30 years. Arid Land Geogr. 2016, 39, 387–394. [Google Scholar]
  47. Quanqin, S.; Jiangwen, F.; Jiyuan, L.; Fan, Y.; Hua, L.; Xiuchun, Y.; Mingxiang, X.; Peng, H.; Xingjian, G.; Lin, H. Approaches for Monitoring and Assessment of Ecological Benefits of National Key Ecological Projects. Adv. Earth Sci. 2017, 32, 1174. [Google Scholar]
  48. Cong, Z.; Xiaojun, Y.; Guoyu, W.; Huian, J.; Te, S.; Xinde, C.; Juan, Z.; Juan, C. Temporal and Spatial Variation of Land Use and Vegetation in the Three–North Shelter Forest Program Area from 2000 to 2020. Sustainability 2022, 14, 16489. [Google Scholar]
  49. Wang, H.; Liu, G.; Li, Z.; Ye, X.; Fu, B.; Lv, Y. Impacts of Drought and Human Activity on Vegetation Growth in the Grain for Green Program Region, China. Chin. Geogr. Sci. 2018, 28, 470–481. [Google Scholar] [CrossRef]
  50. Luo, X.; Yang, J.; Sun, W.; He, B. Suitability of human settlements in mountainous areas from the perspective of ventilation: A case study of the main urban area of Chongqing. J. Clean. Prod. 2021, 310, 127467. [Google Scholar] [CrossRef]
Figure 1. Spatial distribution of vegetation types (a) and elevation (b) in Xinjiang.
Forests 15 00370 g001
Figure 2. Interannual variations and trends in NDVI, precipitation, and temperature from 2000 to 2022. (a) Fluctuations in NDVI and precipitation; (b) fluctuations in NDVI and temperature.
Forests 15 00370 g002
Figure 3. Spatial distribution of mean NDVI values, 2000–2022.
Forests 15 00370 g003
Figure 4. Spatial distribution of interannual NDVI, precipitation, and temperature trends, and NDVI trend significance in Xinjiang, 2000–2022. (a) NDVI trend; (b) NDVI trend significance; (c) precipitation trend; (d) temperature trend. NDVI trend significance legends −4, −3, −2, −1, 0, 1, 2, 3, and 4 indicate extremely significant degradation, significant degradation, slightly significant degradation, no significant degradation, no significant change, no significant improvement, slightly significant improvement, significant improvement, and extremely significant improvement, respectively. Areas of extremely significant degradation (0.88%) are mainly located in the central part of the study area, and the degraded vegetation is mainly grassland (Table 1). There is also a small proportion of crops, mainly in the surrounding counties centered on Urumqi. This is probably due to the high level of human activity in these areas and the increase in land used for construction due to urban expansion, which has led to a decrease in agricultural land.
Forests 15 00370 g004
Figure 5. Changes and trends in NDVI, precipitation, and temperature in Xinjiang during (a) spring, (b) summer, (c) autumn, and (d) growing seasons for the period 2000–2022.
Forests 15 00370 g005
Figure 6. NDVI trend, NDVI trend significance, precipitation trend, and temperature trend in Xinjiang, 2000–2022: (ad) denote the types of NDVI trends in spring, summer, autumn, and growing season, respectively; (eh) denote the NDVI-trend significance for the four periods; and (il) and (mp) denote temperature trends and precipitation trends for the four periods, respectively. The −4, −3, −2, −1, 0, 1, 2, 3, and 4 in the NDVI trend significance legend are the same as those represented in Figure 4.
Forests 15 00370 g006
Figure 7. Spatial distribution of NDVI fluctuations.
Forests 15 00370 g007
Figure 8. Spatial distribution of Hurst index (a) and future trends in NDVI (b).
Forests 15 00370 g008
Figure 9. The correlation coefficients and significance tests of NDVI with precipitation and temperature in spring, summer, autumn, growing season, and interannually from 2000 to 2022 are shown in the figures. Panels (ae) represent the partial correlation coefficients of NDVI with precipitation. Panels (fj) depict the significance test results for the partial correlation between NDVI and precipitation. Panels (ko) display the coefficients of partial correlation between NDVI and temperature. Panels (pt) illustrate the significance test results for the partial correlation between NDVI and temperature. In the legend of the significance test, 1, 2, 3, 4, 5, and 6 denote extremely significant negative correlation, significant negative correlation, non-significant negative correlation, non-significant positive correlation, significant positive correlation and extremely significant positive correlation, respectively.
Forests 15 00370 g009
Figure 10. Spatial distribution of interannual trends and multi-year means of the human footprint data: (a) indicates the interannual trend in the human footprint data; (b) indicates the distribution of long-term average annual values of the human footprint data.
Forests 15 00370 g010
Figure 11. Correlation coefficients (a) and significance tests (b) between NDVI and human footprint data.
Forests 15 00370 g011
Table 1. Statistical results on the significance of spring, summer, autumn, growing season, and interannual trends in NDVI in Xinjiang.
Trends in NDVIPercentage (%)
SpringSummerAutumnGrowing SeasonInterannual
Extremely significant improvement32.3728.7824.5836.5543.83
Significant improvement16.0610.2510.8510.7211.36
Slightly significant improvement8.345.426.225.786.20
No significant improvement31.4730.5635.8231.2827.56
No significant degradation9.8420.0819.2013.049.07
Slightly significant degradation0.601.351.100.730.49
Significant degradation0.691.581.120.830.60
Extremely significant degradation0.631.981.101.080.88
Table 2. Interannual NDVI coefficient of variation statistics.
StabilityCoefficient of VariationPercentage (%)
Low fluctuation<0.053.90
Lower fluctuation0.05 ≤ CV < 0.139.30
Medium fluctuation0.1 ≤ CV < 0.1535.84
Higher fluctuation0.15 ≤ CV < 0.112.26
High fluctuation≥0.28.69
Table 3. NDVI future trends in vegetation in Xinjiang area.
Future Trends in NDVIPercentage of Area Occupied (%)
Decrease followed by increase7.40
Increase followed by decrease59.99
Continuous increase28.97
Continuous decrease3.65
Table 4. Significance test for partial correlation between precipitation, temperature, and NDVI.
Significance of Partial Correlation between Climatic
Factors and NDVI (%)
SpringSummerAutumnGrowing SeasonInterannual
Precipitation and NDVIExtremely significant negative correlation0.220.110.900.140.25
Significant negative correlation0.750.512.610.521.21
Non-significant negative correlation27.1625.5254.9720.7534.71
Non-significant positive correlation59.0756.2539.4554.5451.96
Significant positive correlation8.239.751.3912.146.61
Extremely significant positive correlation4.577.870.6811.915.25
Temperature and NDVIExtremely significant negative correlation0.140.320.620.280.29
Significant negative correlation0.601.152.450.800.63
Non-significant negative correlation17.0435.6442.6825.8218.13
Non-significant positive correlation52.6757.1248.5661.3666.26
Significant positive correlation13.564.363.567.899.53
Extremely significant positive correlation15.991.392.143.855.51
Disclaimer/Publisher’s Note: The statements, opinions and data contained in all publications are solely those of the individual author(s) and contributor(s) and not of MDPI and/or the editor(s). MDPI and/or the editor(s) disclaim responsibility for any injury to people or property resulting from any ideas, methods, instructions or products referred to in the content.

