Abstract
The past couple of decades have witnessed an increasing application of tree ring observations to assess forest carbon (C) balance and its historical dynamics. To address the growing need for understanding long-term forest C sequestration dynamics through tree rings, we developed a new desktop tool (TR-SNP v1.0) that estimates the annual aboveground biomass increment (AABI) of trees from tree ring width (TRW). Users can easily process and convert TRW into AABI using either the built-in dataset or by uploading local TRW data. TR-SNP offers methods for correcting potential bias from unmeasured initial core width, converting TRW to diameter at breast height (DBH), and estimating AABI using species-specific allometric relationships. We provide examples from specific sites to demonstrate how TR-SNP functions and its potential for identifying bias sources of AABI estimation. We anticipate that TR-SNP will streamline the analysis of tree ring data and advance our understanding of forest biomass increment dynamics.
1. Introduction
Tree ring datasets have been increasingly used over recent decades to investigate growth patterns in relation to forest carbon (C) balance [1]. In addition to traditional dendrological purposes like climate reconstruction, growth-oriented datasets are being developed to explore ecosystem-level growth from tree ring information [2]. Creating a user-friendly interface to link tree ring data with annual aboveground biomass increment (henceforth AABI) will facilitate the processing of large tree-ring datasets from diverse sources.
The general approach to linking tree ring width (henceforth TRW) with AABI is through accumulating annual ring width growth into radial diameter by doubling the sum of the annual ring widths. This value is then converted to diameter at breast height (henceforth DBH), which is subsequently used to estimate AABI at both the tree and stand levels, typically through allometric relationships [3,4,5]. The conversion process involves several potential biases related to tree ring sampling. First, increment cores—cylindrical wood samples extracted from trees to study their growth rings—do not always reach the tree’s pith, which can result in an underestimation of the full radial growth of the stem. For example, the mismeasurement of core width is believed to have caused consistent underestimations of DBH derived from TRW, compared to field measurements, as observed across three forest sites in North America [6]. Information such as missing initial width is often unavailable for existing datasets like the International Tree-Ring Data Bank (henceforth ITRDB) [7]. Second, asymmetrical TRW growth may cause the sum of the increment core measurements to deviate from actual conditions [8]. A recent study indicated that the conventional proportional approach does not fully address these biases and proposed an empirical correction model to improve the estimates of tree diameter and biomass from TRW datasets [9]. Carefully assessing and addressing potential biases in the process of translating TRW measurements into AABI estimates can enhance our understanding of long-term variations in biomass growth and C sequestration dynamics.
Here, we present a new desktop tool (henceforth TR-SNP) to perform data searching, conversion, bias assessment and plotting for the estimation of AABI from TRW. We illustrate how TR-SNP is developed, its general workflow and its application at specific sites to demonstrate its usage to identify the contribution of bias sources to biomass estimations. We aim to provide a user-friendly interface for researchers from the related communities to understand long-term variations in forest biomass increment and C sequestration, from the perspective of ring width growth.
2. Development of TR-SNP
TR-SNP was developed in a Python 3.7 environment, with its interface built using the python module “tkinter” [10]. The TRW dataset, in Tucson format (.rwl), either uploaded by the user or selected from the built-in dataset, is recognized and converted into the Pandas (Version 0.25.0) [11] dataframe using the “read.tucson” function from the R package ‘dplR’ (Version 1.7.2) [12]. Here, the Python module “rpy2” (Version 2.9.5) [13] is used to allow for the application of the R functions and the conversion of R-formatted dataframe into the Pandas-formatted dataframe that can be processed under a Python environment. After the input of the TRW dataset, two sources of potential bias during the conversion of TRW to AABI are considered in the current version of TR-SNP. For the initial width bias, TR-SNP provides options for users to input their measurements or estimations of the missing initial width, and then the missing width is added to the existing observed tree ring series for each individual tree at a site. For the bias from the conversion of TRW to DBH, TR-SNP offers two conversion models, an empirical model and a model with bark width being added into the DBH calculation. After the above bias terms are considered, the DBH estimated from raw TRW data or from bias corrected data will be converted into AABI using species-specific allometric relationships at the individual tree and site average levels. Finally, TR-SNP provides a visualization of the bias-corrected site averaged AABI estimations from the selected sites, using the python package “matplotlib” (Version 3.1.1) [14].
3. Overall Workflow of TR-SNP
The general workflow of TR-SNP to convert TRW into AABI is composed of four steps (Figure 1). In step 1, the TRW dataset can either be uploaded from users’ local environment or be searched and selected from the built-in dataset (Section 4). In step 2, users can choose the approach to estimate the missing initial width bias from TRW to DBH (Section 5). TR-SNP provides options to define the missing initial width bias from TRW observations. In step 3, users can select the method to convert the TRW-based radial growth into DBH (Section 6). In the final step, the estimated DBH is converted into AABI using species-specific allometric relationships, and the result will be saved to the local environment and then plotted (Section 7).
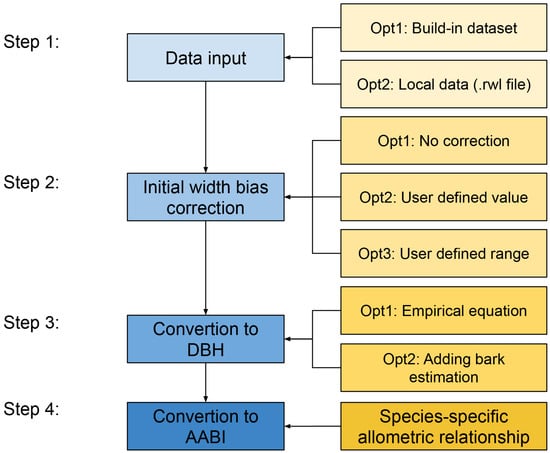
Figure 1.
The overall workflow of TR-SNP v1.0.
After finishing the above procedure, TR-SNP will output variables including the TRW-based total diameter, the total aboveground biomass accumulation, the annual diameter increment and the annual aboveground biomass increment at both the tree and site level, from the raw TRW dataset or with biases being corrected. A detailed description of the output variables is presented in the Supplementary Materials.
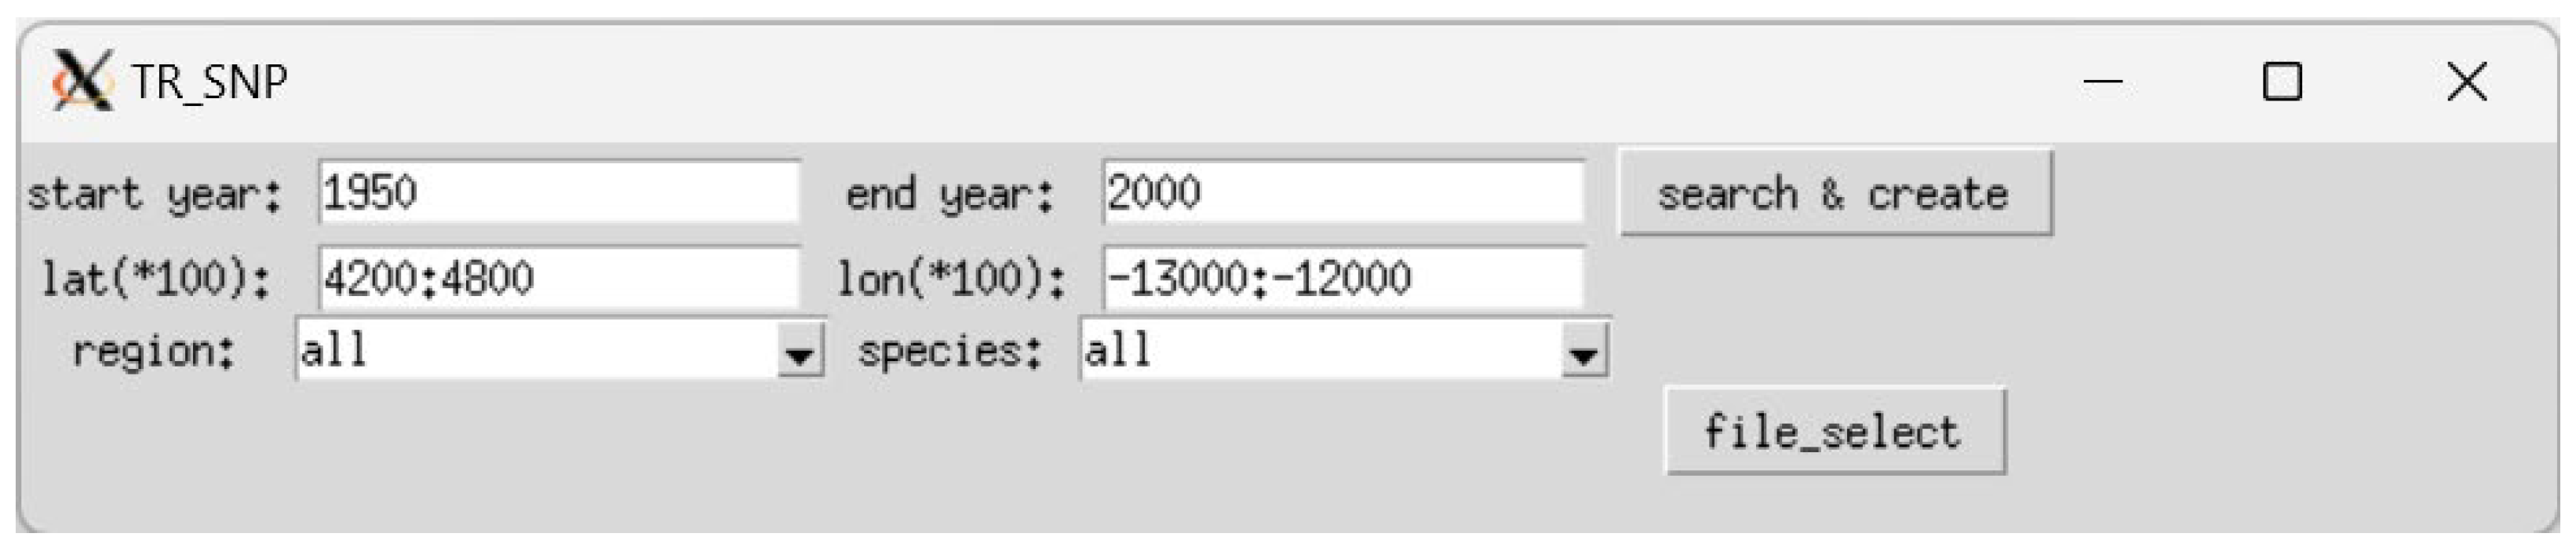
4. Data Input or Selection
Standard TRW data (.rwl) are required if users choose to upload local data to TR-SNP. Alternatively, users can select TRW data from the built-in ITRDB dataset by specifying the year range, geographical location, region, and species, or by selecting the input file directly from the built-in ITRDB using the “file_select” button (Figure 2). Currently in TR-SNP, the built-in dataset is a subset of ITRDB located in the United States with species-specific allometric relationships available.

Figure 2.
The main interface of TR-SNP v1.0. An example set of year, geographical location, region and species inputs is presented. The latitude and longitude coordinates are transformed into integers with a scaling factor of 100.
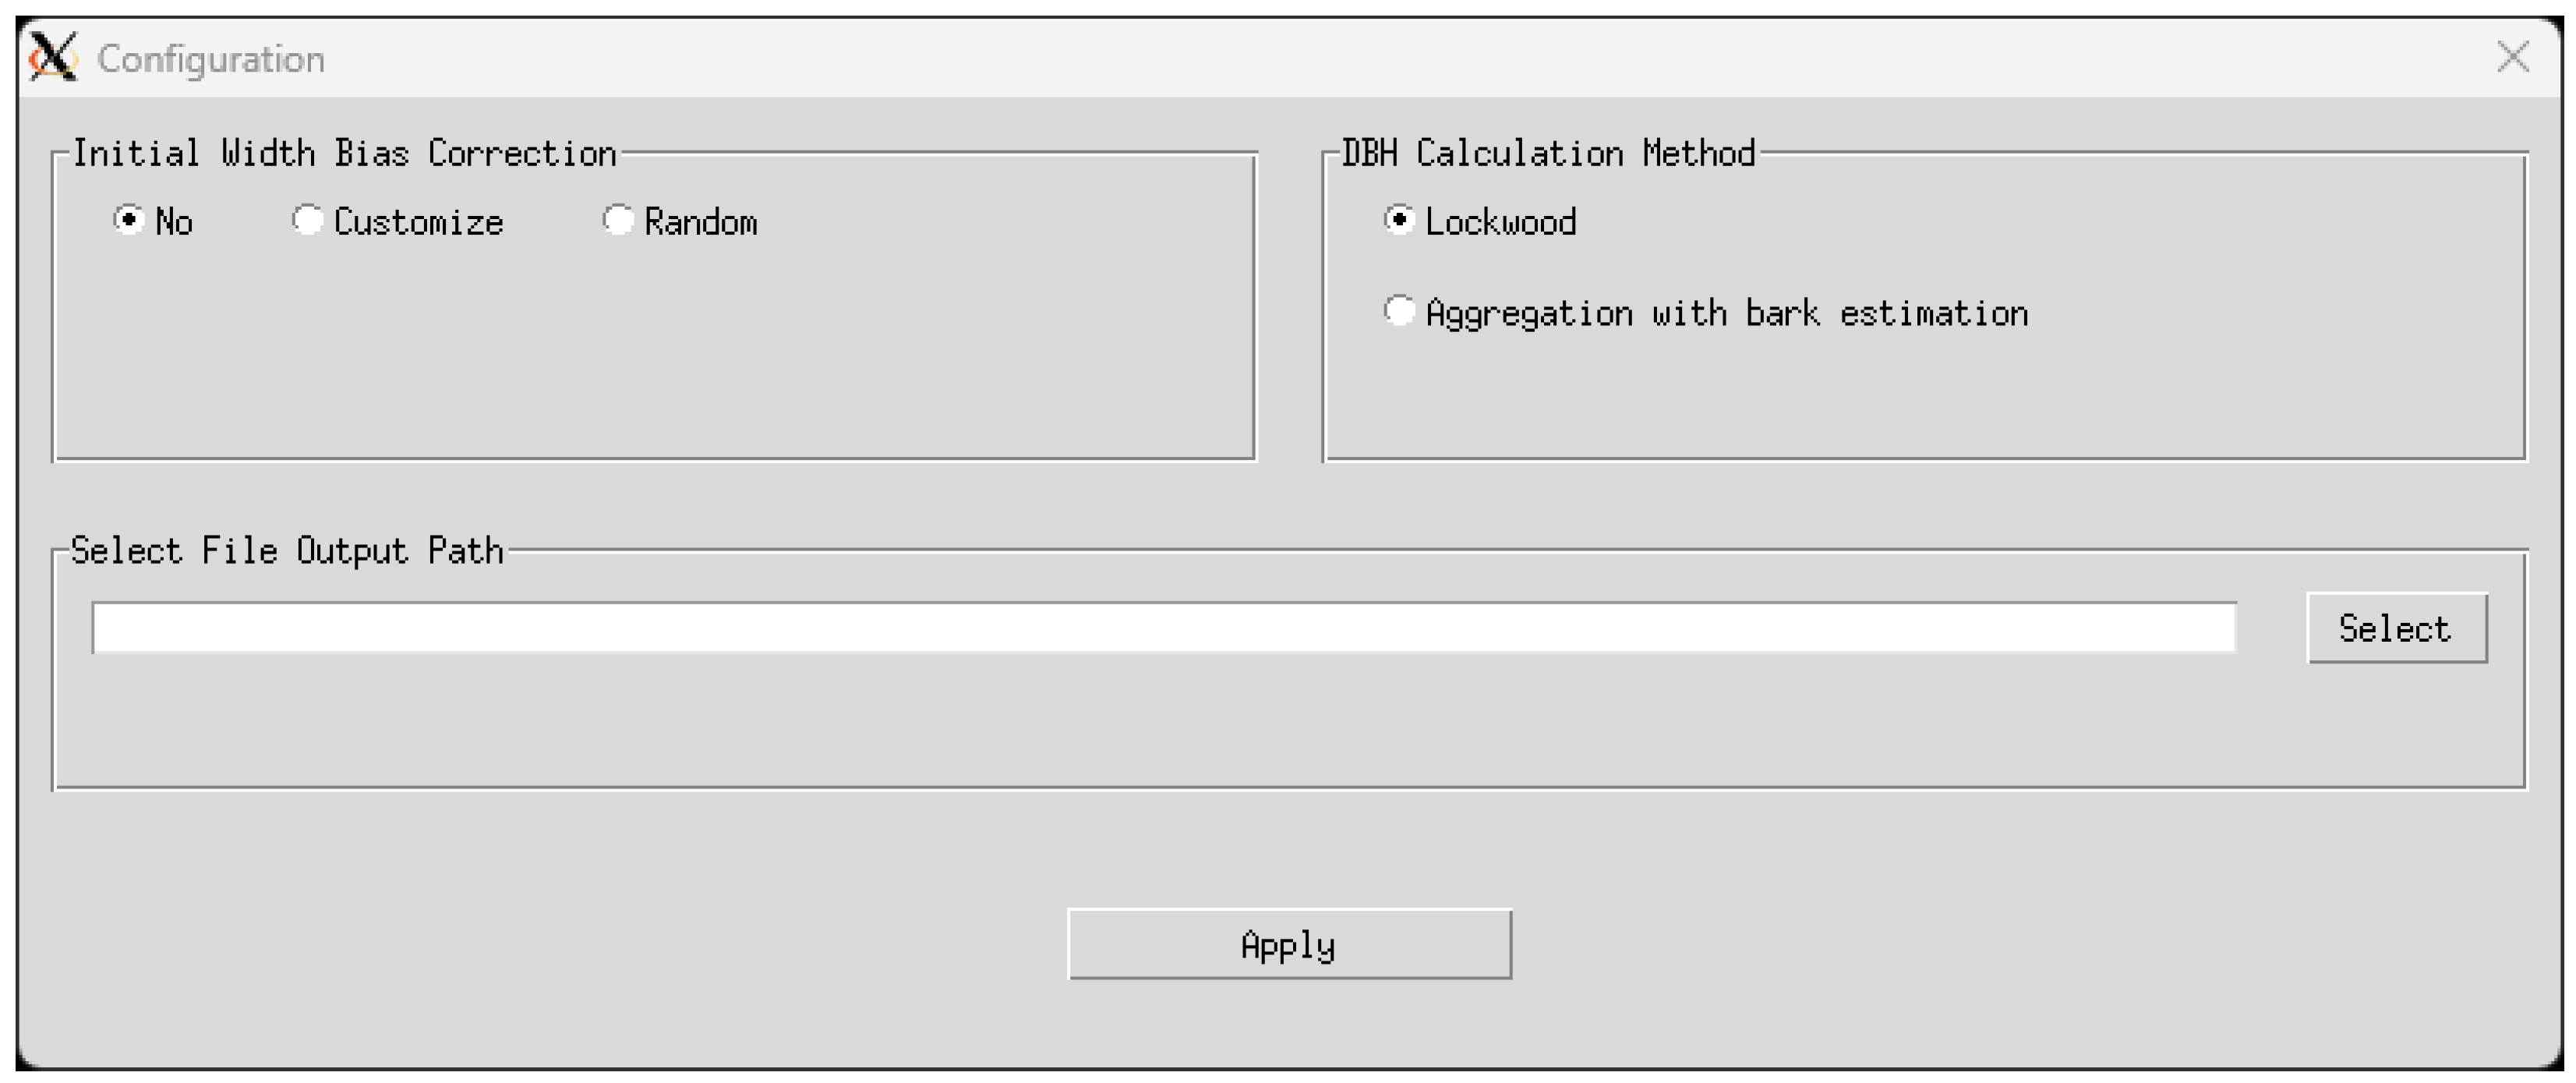
5. Initial Width Bias Correction
TR-SNP currently offers three options to account for a missing initial width in the measured TRW (Figure 3). Users can specify whether a missing initial width was included in the TRW measurement. If the missing initial width is estimated from an additional measurement, such as using estimations from a pith locator, users can input the value by selecting the “Customize” option in the “Initial Width Bias Correction” panel. Alternatively, by choosing the “Random” option, users can specify a range for the unmeasured initial width, and TR-SNP will randomly assign a value to each individual sample within the defined range.

Figure 3.
The configuration interface to select the method for initial width bias correction and DBH calculation method, respectively.
6. Converting Accumulation Ring Width Growth to DBH
TR-SNP provides two options to convert the TRW-based diameter to DBH (Figure 4). For option 1, “Empirical model”, an empirical model from Lockwood et al. [9], will be used to convert the accumulated TRW-based radial growth to DBH. For option 2, “Aggregation with bark estimation”, an estimated bark width will be added to the TRW-based radial diameter to calculate DBH, which simulates field measurements of DBH that include bark width. The model of bark width from Zeibig-Kichas et al. [15] is applied.

Figure 4.
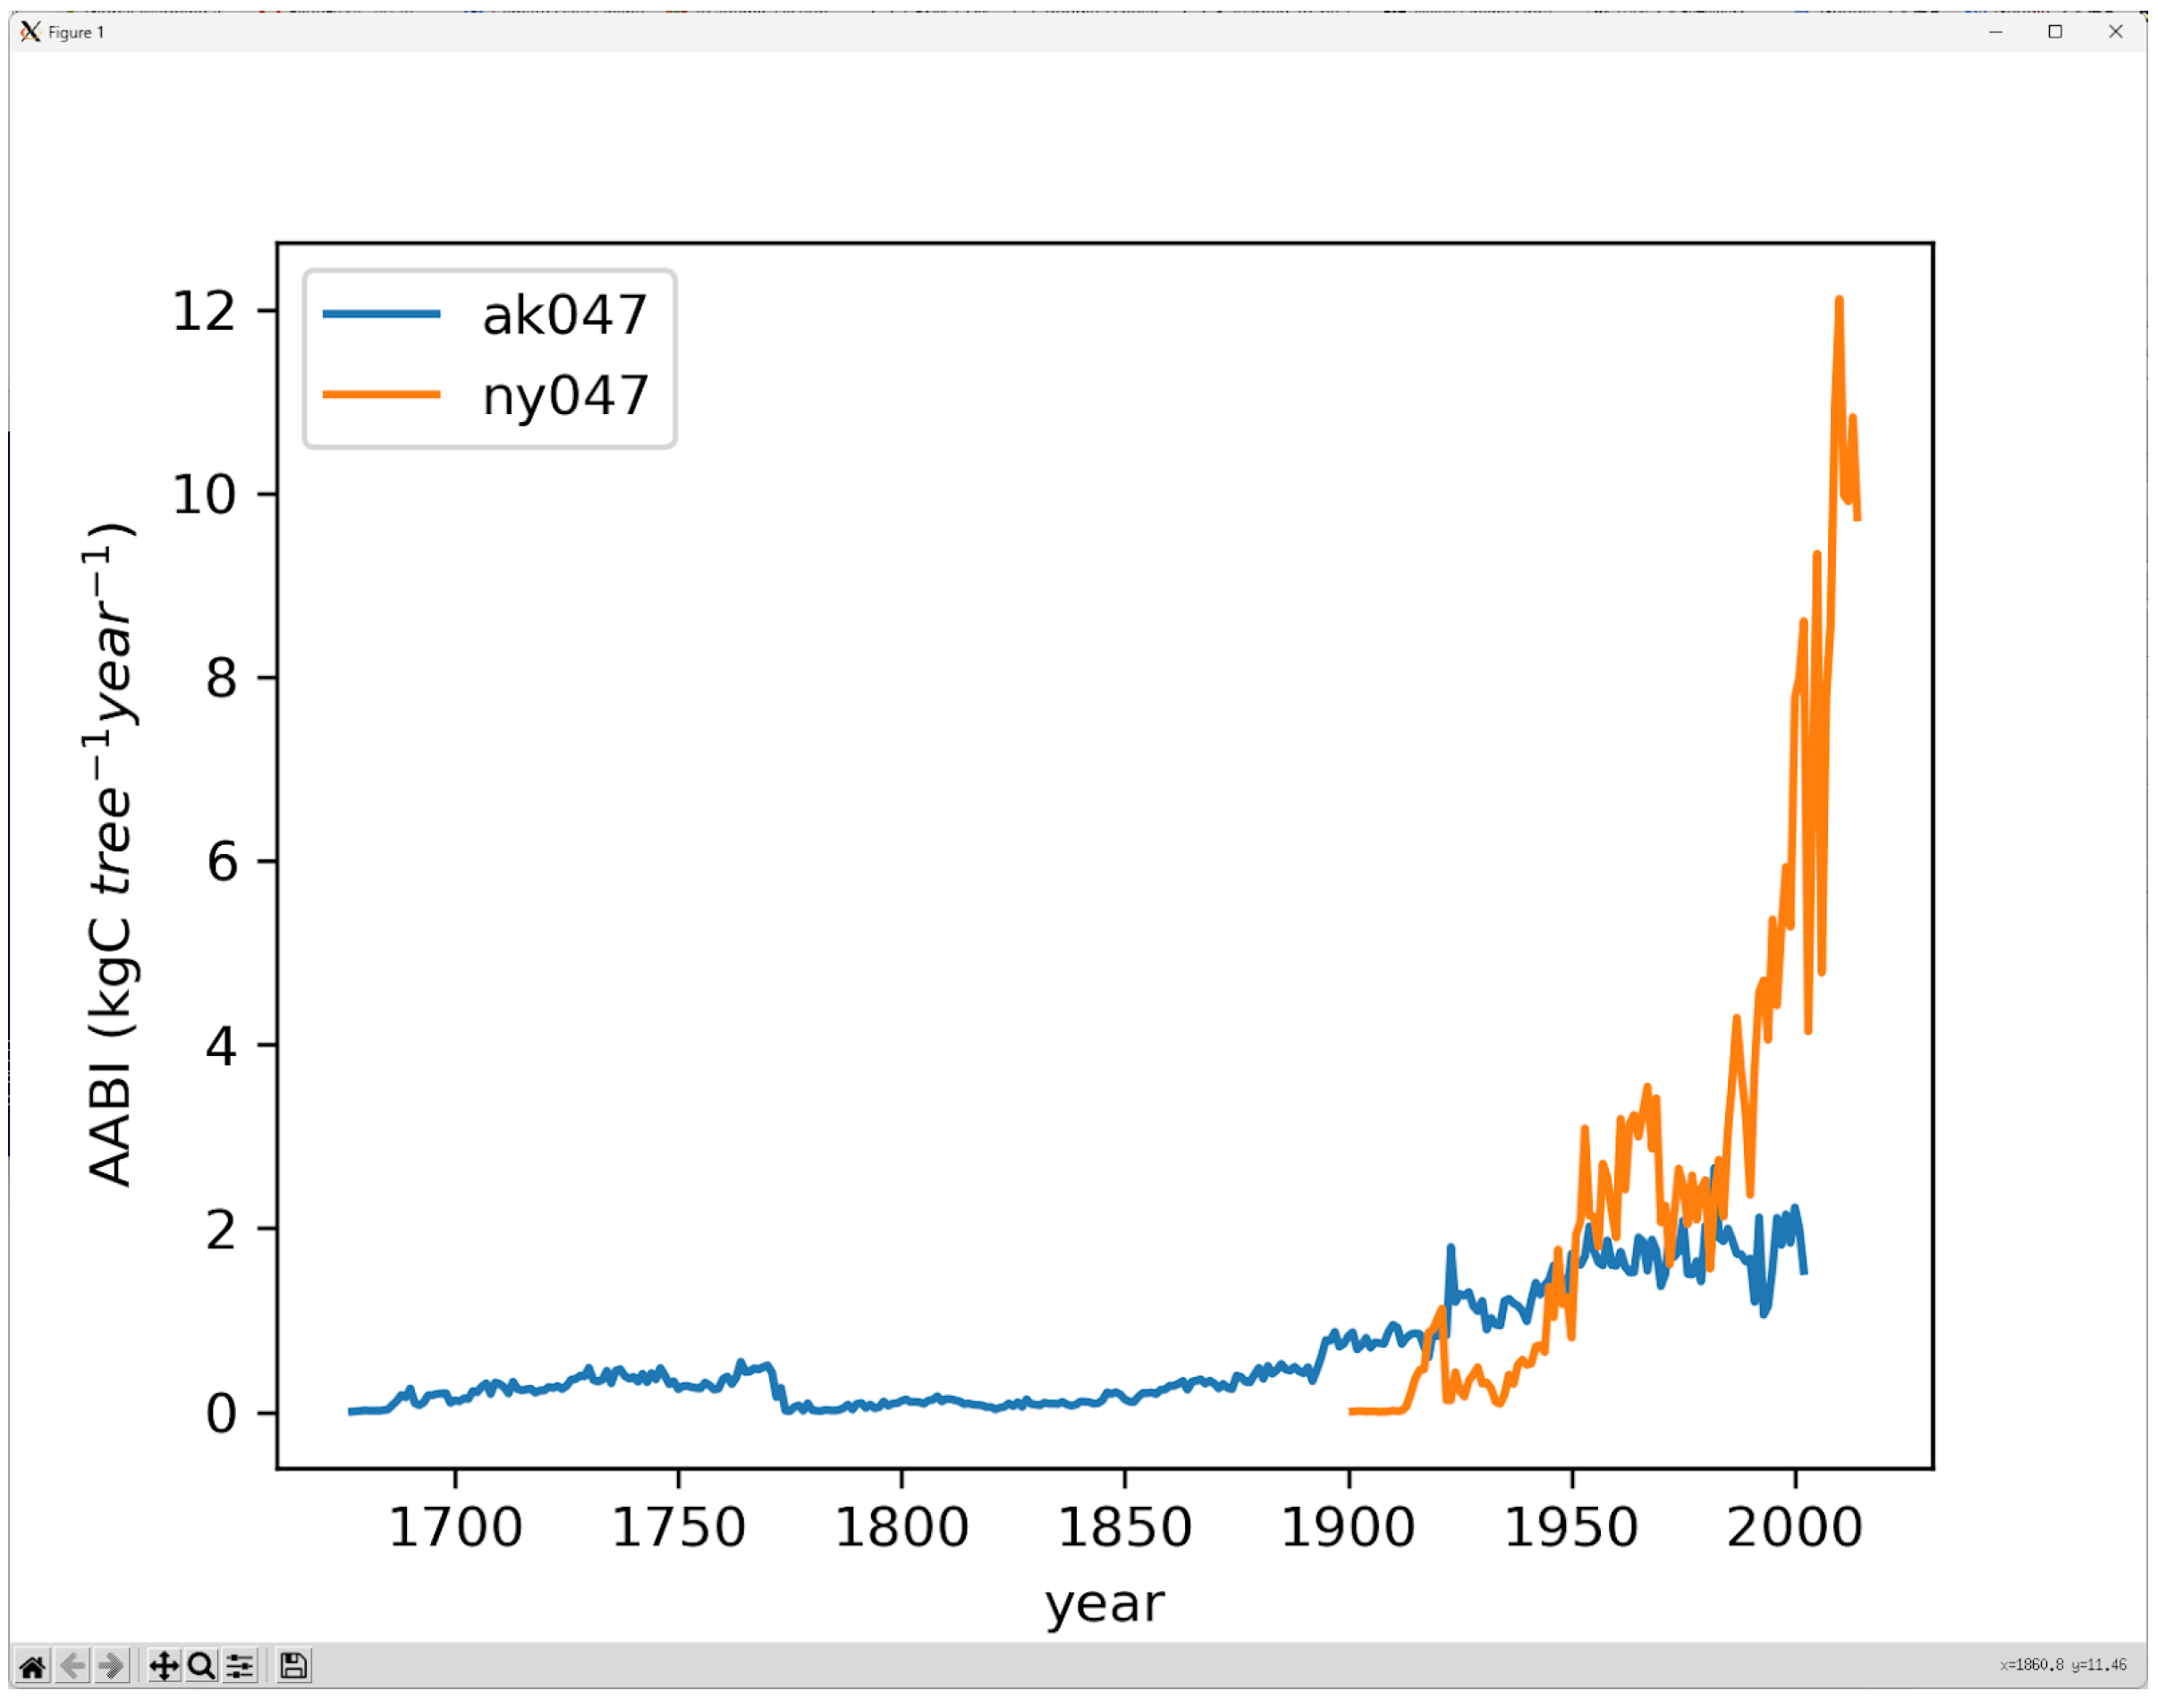
The example output plot of the site mean AABI from TR-SNP. The results presented are sites of ‘ak17’ and ‘ny047’ from ITRDB.
7. Converting DBH to AABI
In the final step, the TRW-based DBH will be converted into AABI using species-specific allometric equations. In the current version, TR-SNP incorporates an extensive library of allometric equations to account for regional differences in forest structure and species composition. Specifically, the tool includes equations from Jenkins et al. [16] and Chojnacky et al. [17] which are widely used for forests in North America (covering Canada, Mexico and the United States). These equations were developed to represent the biomass of a range of tree species across diverse forest types in the region. For European forests, the tool provides equations from Forrester et al. [18] which reflect the distinct species composition and environmental conditions of European ecosystems.
The use of region-specific allometric equations ensures that biomass estimates are tailored to the ecological context of each study site, thereby improving the accuracy and reliability of the results. For example, differences in tree growth forms, wood density, and environmental conditions between North America and Europe necessitate the use of distinct equations to avoid systematic biases in biomass estimates.
TR-SNP will output accumulated diameter and biomass, as well as diameter and biomass increments for each year, derived both from the raw tree ring dataset and the bias-corrected dataset. These outputs will be saved as .csv files in a user-specified repository. A detailed list of output variables and their explanations is provided in the Supplementary Materials. The AABI outputs for selected sites are visualized in graphical form, with Figure 4 serving as an example.
8. Application Examples
Here, we provide application examples of TR-SNP to illustrate how this tool works to convert TRW into diameter and biomass terms and how it can help with the identification of the potential bias sources. First, we performed an analysis using TRW datasets of two random sites from the build-in dataset. Site 1, named ‘ak17’, is a site from Alaska (57°36′ N, 152°19′ W), and the species is Picea sitchensis. Site 2, named ‘ny047’, is from New York (44°38′ N, 75°13′ W), and the species is Tsuga canadensis (L.) (Table 1). We selected the two sites through the “file_select” button from the TR-SNP main interface (Figure 1). Second, we performed an analysis by uploading an external TRW dataset and compared the biomass estimation derived from TRW and the one from the field DBH observation. The step-by-step procedure to perform the analysis is illustrated in the Supplementary Materials.

Table 1.
Information on the three sites used in this study.
For the first example, we run TR-SNP to obtain AABI estimations based on different missing initial width and DBH conversion methods. Here, we present the results for years with a constant sampling size for the two sites. We first tested how different sets of missing initial width affect AABI estimation. For each time, a prescribed missing radial increment of 5 mm, 10 mm, 15 mm, 20 mm, 25 mm or 30 mm was added to the raw TRW data for the two sites to estimate the impact of potential missing initial width on the calculation of AABI. The results indicated that for each missing millimeter (mm) of initial width, there is an average AABI difference of 2.51% for site ‘ak17’ and 2.63% for site ‘ny047’, respectively, comparing this to the result using the raw ring width. This impact gradually increases as more initial width is added (Figure 5a).
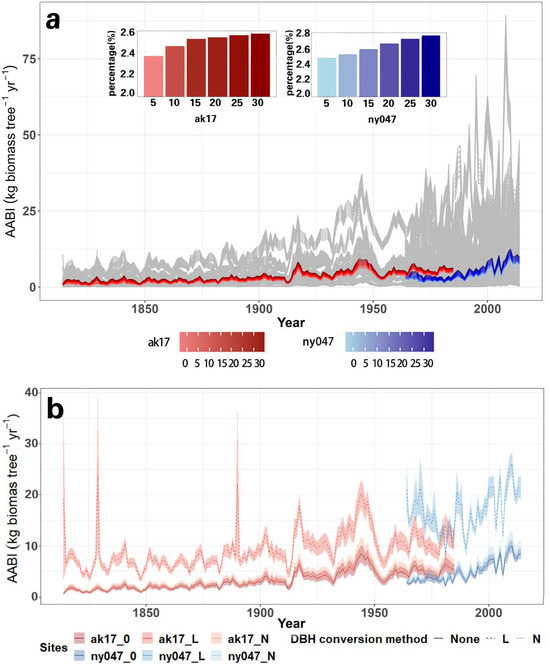
Figure 5.
Effects of the (a) initial width bias and (b) DBH conversion approach to AABI results from the two example sites (ak17 and ny047). The sub-plot in the panel a shows the percentage of AABI changed per mm initial width added to the calculation. The gray lines in the panel a show the AABI variations in individual trees from the two sites. The shaded areas in panel b show the CI 95% range.
Then, we tested how different DBH conversion methods affect the AABI outputs using the results from the two sites (Figure 5b). In these simulations, initial missing rings were not included. The empirical model predicted a significantly higher AABI, whereas incorporating bark width into the calculation resulted in minor changes to the AABI values.
For the second example, we uploaded a site of TRW observation from the Gen-tree dataset from the local environment. The site is located in Loire, France (45°34′ N, 3°56′ E), and the species is Pinus sylvestris (Table 1). For this site, the number of missing initial rings was minimal according to the data description. Therefore, we conducted the analysis without incorporating any additional initial ring width. Using TR-SNP, we outputted the tree ring-derived DBH for each individual tree of each observed year and compared the values of year 2015 to the corresponding field DBH observation. We also compared the biomass estimated from tree ring-derived DBH to the biomass estimated from field DBH observations. The results showed that DBH calculated directly from tree ring width accumulation was, on average, 25.0% lower than field-observed values (Figure 6). This underestimation resulted in an average biomass underestimation of approximately 47.1% for each individual tree. Incorporating bark width into the calculations reduced the underestimation by 5% for DBH and 8% for biomass. Using the empirical model to convert tree ring width to DBH effectively compensated for the underestimation, producing slightly higher DBH (7.5%) and biomass (16.8%) values compared to the observed data. The results corroborate the findings of Lockwood et al. [9], who also found that biomass accumulation was substantially underestimated using diameter estimation from TRW compared to the estimation using field-based DBH observations. It is suspected that the significant underestimation from TRW-based diameter was due to the internal decay of the trees, which prevents increment borers from reaching the pith [19,20]. Conducting more comprehensive comparisons between DBH and AABI estimations derived from TRW data and the conventional field observations will offer deeper insights into the underlying mechanisms driving the discrepancies in the biomass predictions.
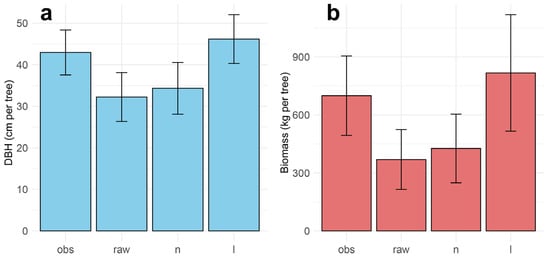
Figure 6.
Comparison of (a) tree ring-derived DBH with field-observed DBH and (b) biomass estimations derived from tree rings with one based on field-observed DBH at the “FRPS03” site. “obs”: results based on field-observed DBH, “raw”: results from the raw tree ring width observation, “n”: results from the tree ring width with bark width being incorporated, “l”: results from the tree ring width corrected by the empirical model from Lockwood et al. [9]. The error bar represents a range of ±1 sd.
9. Conclusions and Future Developments
In this study, we introduced TR-SNP, a desktop tool designed to convert TRW data into estimates of DBH and biomass, while accounting for initial width bias and incorporating various DBH conversion methods. The tool’s functionality was demonstrated through a detailed overview of its procedures and working examples, showcasing its potential to support the processing and evaluation of TRW-based AABI estimations. One potential application of TR-SNP is to compare DBH and AABI outputs with those derived from field observations to assess how different bias correction methods influence the variability of these estimates across approaches. The site-level comparison presented in this study serves as a working example of how such analyses can be conducted using TR-SNP.
While the primary focus of this specific study is to introduce the methodology and functionality of the tool, future research will involve broader comparisons across a wider range of tree species and environmental conditions to extensively validate and refine the applications of TR-SNP. Ongoing work involves a full analysis of the Gen-tree dataset using TR-SNP, offering a valuable opportunity to achieve this objective. We anticipate that TR-SNP and its continued development will contribute to the advancement of process-based models for estimating tree growth from TRW data, thereby enhancing the integration of tree ring research into ecological and forestry modeling.
Future development of TR-SNP will focus on the following aspects. First, allometric relationships from a broader range of regions and species will be incorporated into the next version. Secondly, we are working on adding more flexible options for users to define their own models for bias correction, in addition to the existing empirical model used in TR-SNP. Moreover, additional related metrics such as basal area increment estimations will be included, with error terms being directly calculated and plotted as part of the tool’s output. Finally, a batch mode will be introduced, allowing users to more easily assess the potential impact of different approaches to correct biases during the conversion of TRW to AABI.
Supplementary Materials
The following supporting information can be downloaded at https://www.mdpi.com/article/10.3390/f15122148/s1, Part S1: General procedures to use TR-SNP v1.0; Part S2: The outputs of TR-SNP.
Author Contributions
Conceptualization, Y.C.; methodology, Y.C., Z.L., Z.S. and Y.L.; data curation, Y.C., Z.L. and Z.S.; original draft preparation, Y.C.; review and editing, Y.C., Z.L., Z.S. and Y.L. All authors have read and agreed to the published version of the manuscript.
Funding
This research was funded by China Postdoctoral Science Foundation (2023M741430), Key Laboratory of National Geographic Census and Monitoring, Ministry of Natural Resources (2023NGCM04), the Fujian Provincial Financial Forestry Science and Technology Research Project (2023FKJ16) and the National Natural Science Foundation of China (41701227).
Data Availability Statement
All the research data used in the present work are freely available online or obtainable directly from the authors upon request. TR-SNP has been packed as a docker image with its affiliated environment, which can be pulled from the following repository: https://hub.docker.com/repository/docker/yumyumorz/tr_snp_image (accessed on 25 November 2024).
Acknowledgments
We acknowledge all the producers and providers of the datasets we used in this study. We thank Shaojun Ning at Human-bcrobot technology for the instructions and discussion on Docker setup and application packaging.
Conflicts of Interest
The authors declare no conflicts of interest.
References
- Babst, F.; Bodesheim, P.; Charney, N.; Friend, A.D.; Girardin, M.P.; Klesse, S.; Moore, D.J.; Seftigen, K.; Björklund, J.; Bouriaud, O.; et al. When tree rings go global: Challenges and opportunities for retro-and prospective insight. Quat. Sci. Rev. 2018, 197, 1–20. [Google Scholar] [CrossRef]
- Martínez-Sancho, E.; Slámová, L.; Morganti, S.; Grefen, C.; Carvalho, B.; Dauphin, B.; Rellstab, C.; Gugerli, F.; Opgenoorth, L.; Heer, K.; et al. The GenTree Dendroecological Collection, tree-ring and wood density data from seven tree species across Europe. Sci. Data 2020, 7, 1. [Google Scholar] [CrossRef] [PubMed]
- Belmecheri, S.; Maxwell, R.S.; Taylor, A.H.; Davis, K.J.; Freeman, K.H.; Munger, W.J. Tree-ring δ 13C tracks flux tower ecosystem productivity estimates in a NE temperate forest. Environ. Res. Lett. 2014, 9, 074011. [Google Scholar] [CrossRef]
- Babst, F.; Bouriaud, O.; Alexander, R.; Trouet, V.; Frank, D. Toward consistent measurements of carbon accumulation: A multi-site assessment of biomass and basal area increment across Europe. Dendrochronologia 2014, 32, 153–161. [Google Scholar] [CrossRef]
- Klesse, S.; Etzold, S.; Frank, D. Integrating tree-ring and inventory-based measurements of aboveground biomass growth: Research opportunities and carbon cycle consequences from a large snow breakage event in the Swiss Alps. Eur. J. For. Res. 2016, 135, 297–311. [Google Scholar] [CrossRef]
- Dannenberg, M.P.; Song, C.; Wise, E.K.; Pederson, N. Delineating environmental stresses to primary production of US forests from tree rings: Effects of climate seasonality, soil, and topography. J. Geophys. Res. Biogeosci. 2020, 125, e2019JG005499. [Google Scholar] [CrossRef]
- Grissino-Mayer, H.D.; Fritts, H.C. The International Tree-Ring Data Bank: An enhanced global database serving the global scientific community. Holocene 1997, 7, 235–238. [Google Scholar] [CrossRef]
- Bakker, J.D. A new, proportional method for reconstructing historical tree diameters. Can. J. For. Res. 2005, 35, 2515–2520. [Google Scholar] [CrossRef]
- Lockwood, B.R.; Maxwell, J.T.; Robeson, S.M.; Au, T.F. Assessing bias in diameter at breast height estimated from tree rings and its effects on basal area increment and biomass. Dendrochronologia 2021, 67, 125844. [Google Scholar] [CrossRef]
- Amos, D. Python Gui Programming with Tkinter. Tersedia. 2020. Available online: https://realpython.com/python-gui-tkinter (accessed on 25 November 2024).
- McKinney, W. Pandas: A foundational Python library for data analysis and statistics. Python High Perform. Sci. Comput. 2011, 14, 1–9. [Google Scholar]
- Bunn, A.G. A dendrochronology program library in R (dplR). Dendrochronologia 2008, 26, 115–124. [Google Scholar] [CrossRef]
- Rpy2. Available online: https://rpy2.github.io/ (accessed on 25 November 2024).
- Ari, N.; Ustazhanov, M. Matplotlib in python. In Proceedings of the 2014 11th International Conference on Electronics, Computer and Computation (ICECCO), Abuja, Nigeria, 29 September–1 October 2014; IEEE: Piscataway Township, NJ, USA, 2014; pp. 1–6. [Google Scholar] [CrossRef]
- Zeibig-Kichas, N.E.; Ardis, C.W.; Berrill, J.P.; King, J.P. Bark thickness equations for mixed-conifer forest type in Klamath and Sierra Nevada Mountains of California. Int. J. For. Res. 2016, 2016, 1864039. [Google Scholar] [CrossRef]
- Jenkins, J.C.; Chojnacky, D.C.; Heath, L.S.; Birdsey, R.A. Comprehensive Database of Diameter-Based Biomass Regressions for North American Tree Species; United States Department of Agriculture, Forest Service, Northeastern Research Station: Newtown Square, PA, USA, 2004. [CrossRef]
- Chojnacky, D.C.; Heath, L.S.; Jenkins, J.C. Updated generalized biomass equations for North American tree species. Forestry 2014, 87, 129–151. [Google Scholar] [CrossRef]
- Forrester, D.I.; Tachauer IH, H.; Annighoefer, P.; Barbeito, I.; Pretzsch, H.; Ruiz-Peinado, R.; Stark, H.; Vacchiano, G.; Zlatanov, T.; Chakraborty, T.; et al. Generalized biomass and leaf area allometric equations for European tree species incorporating stand structure, tree age and climate. For. Ecol. Manag. 2017, 396, 160–175. [Google Scholar] [CrossRef]
- Marra, R.E.; Brazee, N.J.; Fraver, S. Estimating carbon loss due to internal decay in living trees using tomography: Implications for forest carbon budgets. Environ. Res. Lett. 2018, 13, 105004. [Google Scholar] [CrossRef]
- Kazemi-Najafi, S.; Shalbafan, A.; Ebrahimi, G. Internal decay assessment in standing beech trees using ultrasonic velocity measurement. Eur. J. For. Res. 2009, 128, 345–350. [Google Scholar] [CrossRef]


Disclaimer/Publisher’s Note: The statements, opinions and data contained in all publications are solely those of the individual author(s) and contributor(s) and not of MDPI and/or the editor(s). MDPI and/or the editor(s) disclaim responsibility for any injury to people or property resulting from any ideas, methods, instructions or products referred to in the content. |
© 2024 by the authors. Licensee MDPI, Basel, Switzerland. This article is an open access article distributed under the terms and conditions of the Creative Commons Attribution (CC BY) license (https://creativecommons.org/licenses/by/4.0/).