Article

Building Urban Forest Resilience to Sea Level Rise: A GIS-Based Climate Adaptation Tool for New York City

1
Warnell School of Forestry and Natural Resources, University of Georgia, Athens, GA 30602, USA
2
USDA Forest Service, Northern Research Station, NYC Urban Field Station, New York, NY 11359, USA
3
NYC Department of Parks and Recreation, New York, NY 10065, USA
*
Author to whom correspondence should be addressed.
Forests 2024, 15(1), 92; https://doi.org/10.3390/f15010092
Submission received: 29 November 2023 / Revised: 26 December 2023 / Accepted: 1 January 2024 / Published: 3 January 2024
(This article belongs to the Special Issue Urban Forest Landscape Planning, Management and Evaluation)

Abstract

:
Urban forests in coastal regions are vulnerable to changing climate conditions, especially sea level rise (SLR). Such climate change impacts add complexity for urban forest managers as they make decisions related to tree species selection. The New York City (NYC) Parks Department manages over 660,000 street trees, many of which occupy sites that are susceptible to saltwater flooding. In order to build a resilient urban tree canopy in these flood-prone zones, we ranked tree species based on their overall tolerance to coastal vulnerability factors such as high winds, salt spray, and soil salinity. Our results revealed that 16 of the 44 species ranked high in overall tolerance to these factors. We also developed a GIS-based tool, specific to NYC, which delineates three coastal tiers based on their susceptibility to coastal vulnerability factors using SLR projections for the 2100s. The species list combined with the GIS tool provides urban forest managers a method to assign tree species to different coastal tiers based on their ability to withstand coastal climate change impacts into the future. We provide details on how this tool was developed for NYC so other coastal cities can replicate this approach to creating a more resilient future coastal urban forest.

1. Introduction

Sea level rise (SLR) is among the biggest concerns that coastal regions of the world face as a result of changing climate. Impacts of SLR threaten both human and plant populations in coastal regions. Trees in both planned and unplanned green spaces are managed for an array of reasons including recreation, biodiversity provisioning, stormwater regulation, and other ecosystem services [1]. Trees in coastal regions are subject to coastal flooding and storm gusts in addition to urban stressors such as polluted and compacted soils.
According to the 2018 Urban Climate Change Research Network report [2], 570 cities, globally, will be impacted by sea level rise, which includes increased exposure to coastal flooding and storm surge during the next 50 years [3]. Increased urban coastal flooding impacts our cities’ trees, yet little is known about the tolerance of urban street trees, park trees, and forests to saltwater inundation. In New York City (NYC), for example, hurricane Sandy caused coastal saltwater flooding that impacted 46,000 street trees. This coastal flooding had a variable impact on street trees, with some species recovering from salt stress while others exhibited high levels of mortality [4]. Modeled sea level rise projections suggest that by the year 2080, a category 2 storm would flood twice as many linear kilometers of NYC streets than were flooded during hurricane Sandy, affecting 97,000 street trees, more than double the number of trees flooded by the storm surge in 2012 [4]. The frequency of this flooding will likely increase with future climate change [5]. A greater understanding of tree species’ tolerance to periodic saltwater inundation can inform urban greening strategies in cities’ flood-prone areas. Little work has been done on which tree species are most tolerant to periodic saltwater flooding, however, there is a body of work focused on the relative tolerance of tree species to increased soil salinity caused by deicing salt used on streets and sidewalks. Increased soil salinity adversely affects plants at all stages of growth and development [6]. In trees, salt stress can cause a reduction in above-ground biomass and interferes with nutrient uptake [7,8]. In addition to the physiological stress caused by increased soil salinity, soil inundation causes many physiological changes in woody plants not adapted to flooding, including suppression of leaf formation and expansion, premature leaf abscission and senescence, shoot dieback, and inhibition of photosynthesis and carbohydrate transport, macronutrient absorption, and root formation and growth [9]. Tolerance to both flooding and salinity varies widely by tree species and genotype [9,10,11].
Saltwater intrusion from frequent tidal flooding and sea level rise has many biogeochemical consequences, which impact forested ecosystems. This includes soil salinization, which can subsequently cause osmotic stress in plant roots, prevent drainage, change carbon dynamics, and lead to sulfide toxicity in plants [12]. In addition, saltwater flooding of urban forested natural areas can lead to dominance of coastal ecosystems by more salt-tolerant invasive species [12].
Urban forest managers are currently managing for increased species diversity as they plan for the future [13]. Climate change adds complexity to these decisions because trees are long-lived and will experience warmer and drier or wetter conditions over their lifespan. In coastal cities, these management goals are further complicated by increased frequency and area of saltwater inundation. Here, urban forest managers will benefit from a greater understanding of the relative level of salt tolerance of tree species along with future scenarios of inland saltwater incursions along the coastline resulting from sea level rise.
As a land management agency, the NYC Department of Parks and Recreation (NYC Parks) operates at the nexus of climate adaptation and risk mitigation. In NYC, there is a growing focus on increasing canopy cover to mitigate the effects of a warmer climate. In 2017, NYC launched the “Cool Neighborhoods Initiative”, which highlights increasing street tree canopy cover as one way to mitigate the effects of climate change [14]. As a result, on average, every year the city of New York plants nearly 7700 new trees across its 5 boroughs (5-year average) [15]. However, coastal urban landscapes, such as NYC, face a dual challenge of not only increasing their tree canopy but streamlining species selection to develop an urban forest that is resilient in the face of an increase in extreme weather events and sea level rise.
Here, we describe an ArcGIS-based survey tool developed by NYC Parks that identifies tree planting areas within three tiers of coastal vulnerability along with a system that rates tree species based on their level of tolerance to coastal conditions. The overall goal of this effort is to create a decision support tool for NYC’s urban forest managers to make street tree planting decisions in areas that are likely to be impacted by saltwater flooding within the expected lifespan of street trees. This approach may be useful to other coastal cities engaged in creating a more resilient urban forest for the future.

2. Materials and Methods
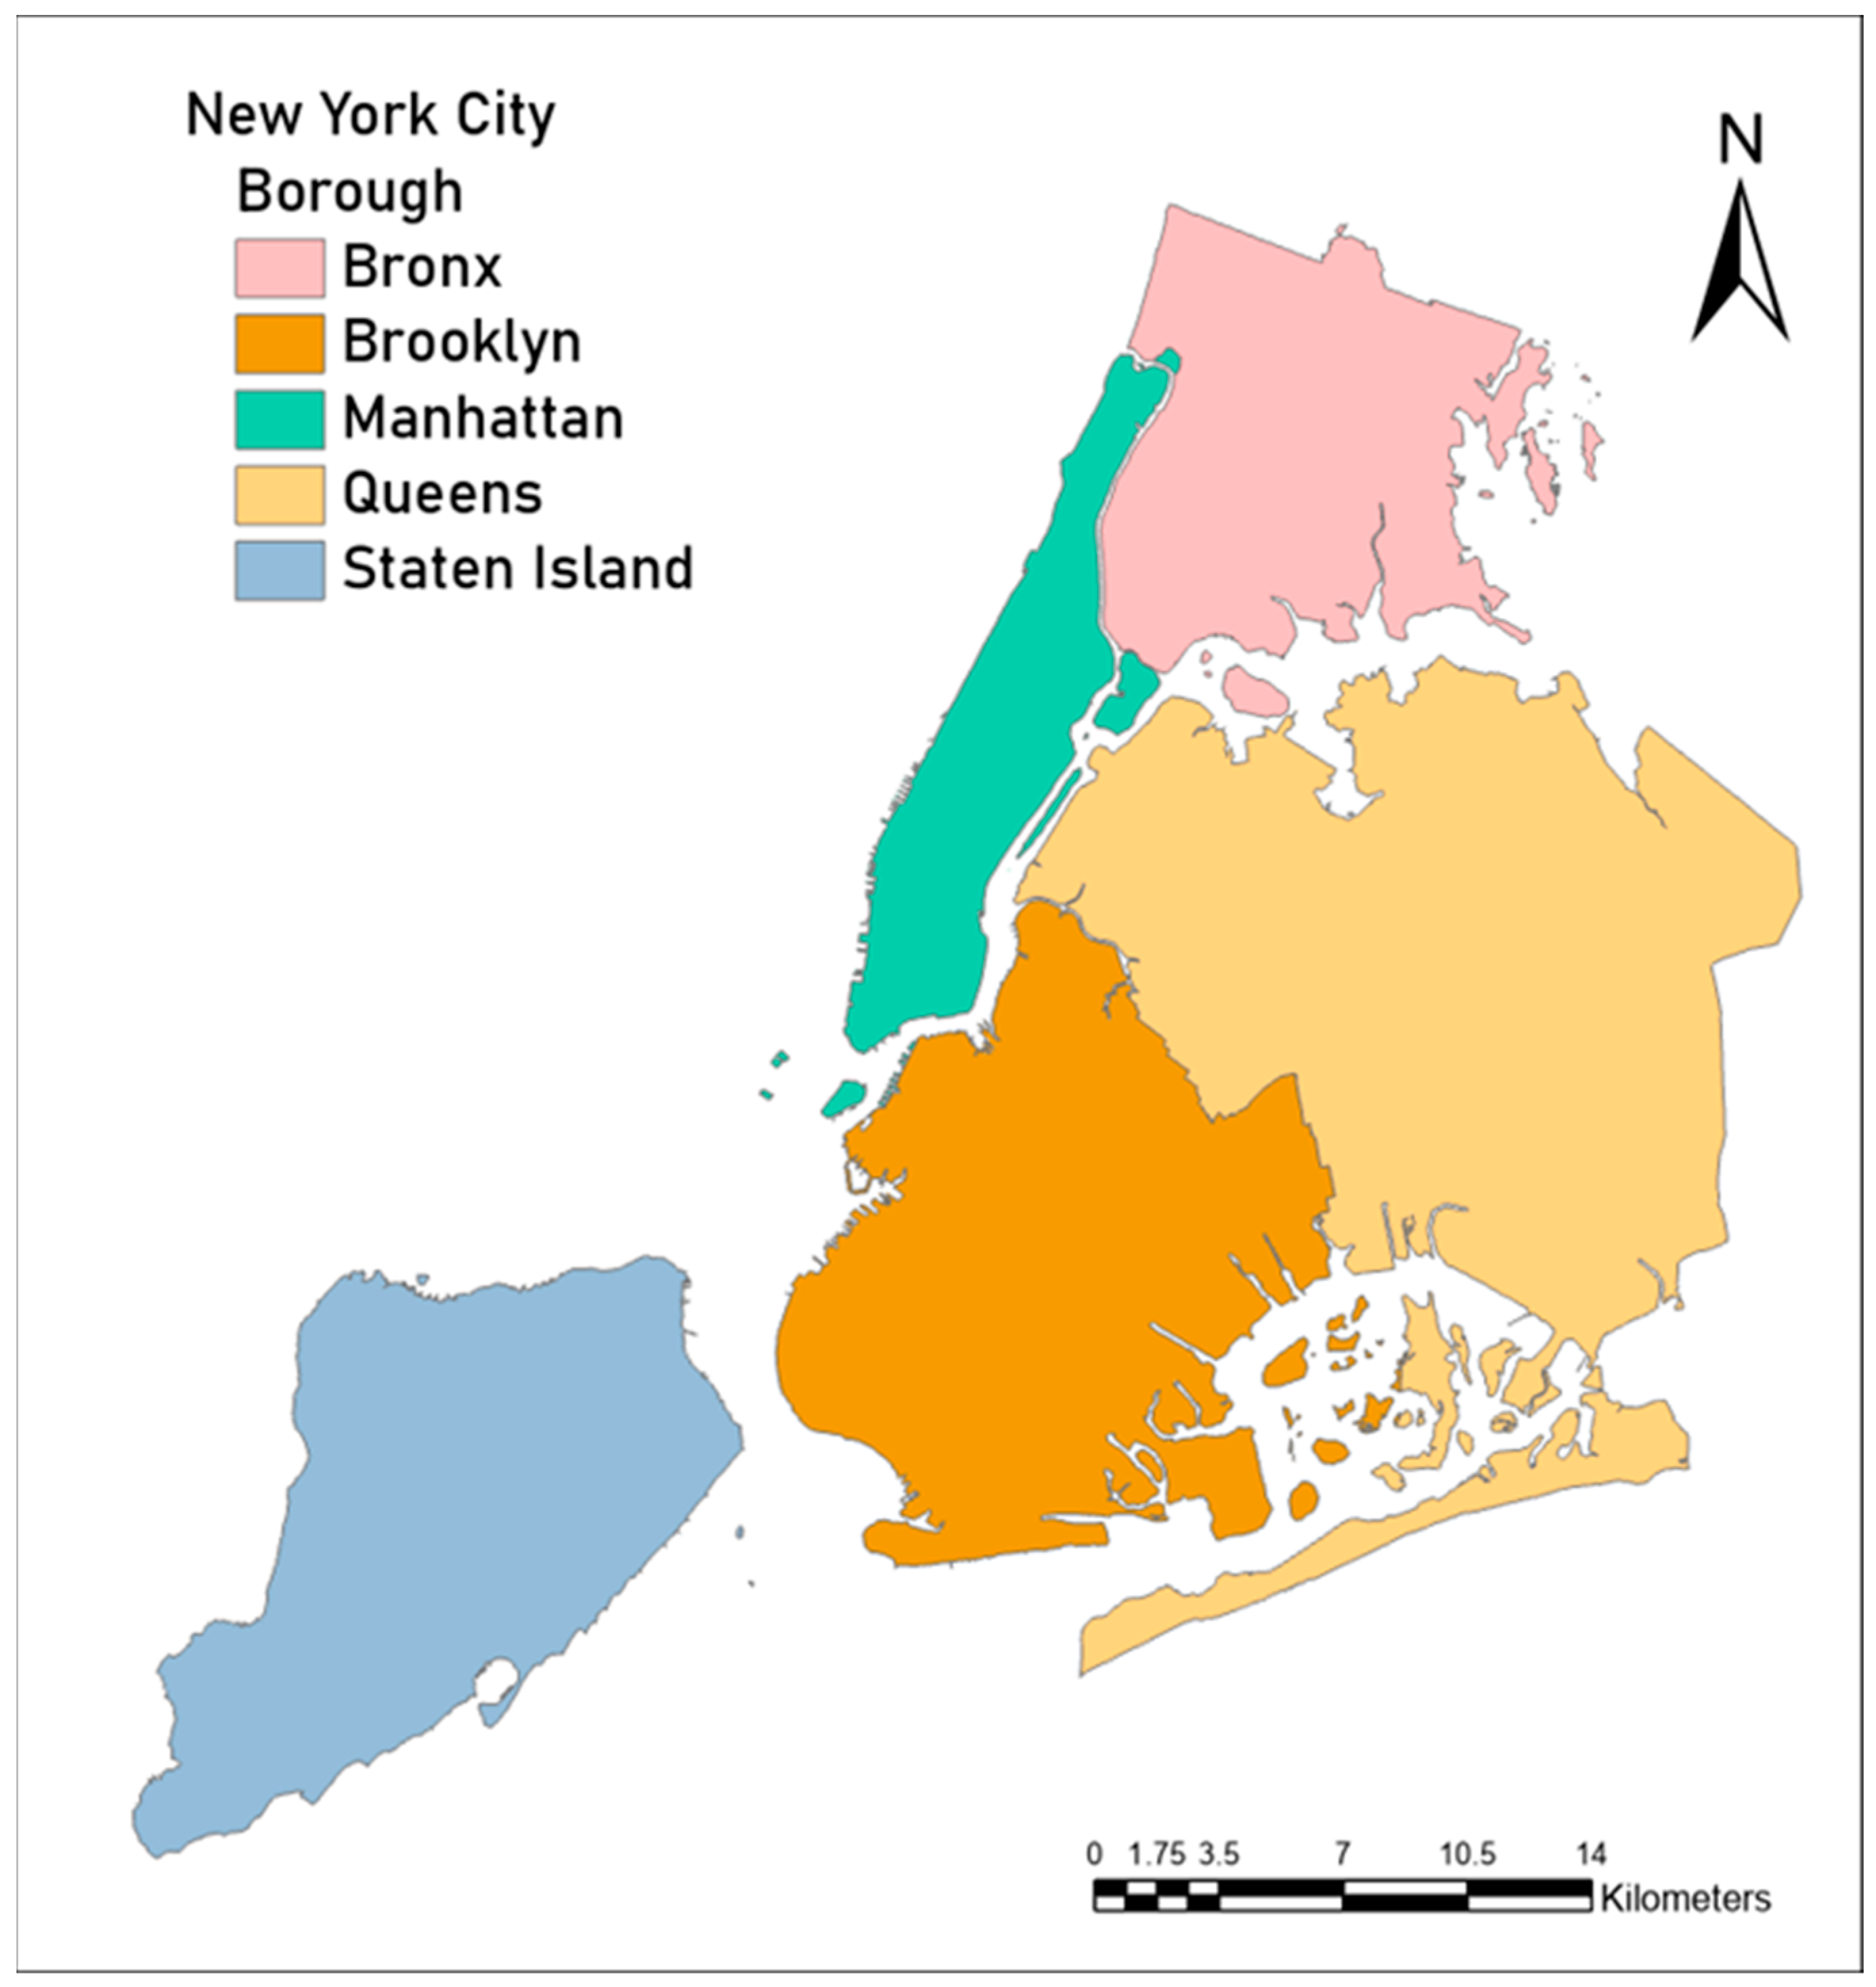
2.1. Study Area

New York City is the most densely populated city in the United States, covers a land area of 784 km2, and has a coastline that covers a linear distance of 837 km. There are over 660,000 street trees in the city that come under the jurisdiction of NYC Parks [16]. New York City contains five boroughs: Bronx, Brooklyn, Manhattan, Queens, and Staten Island (Figure 1). Tree management of street and park trees within NYC is managed by NYC Parks and is divided into four operations: (1) a tree planting team with sub-teams dedicated to each borough, (2) borough-level maintenance and operations units for structural management and removal of mature trees, (3) citywide permits and plan review team for tree preservation, replacement, and restitution, and (4) a team of foresters who repair sidewalk damage around existing trees.

2.2. Coastal Vulnerability Factors

Future climate projections suggest that storm frequency including tropical cyclones (hurricanes and tropical storms) is likely to increase [2,17]. In NYC, urban forest managers are most concerned about the increased frequency of offshore storms causing coastal flooding. As the sea level rises, flooding along with storm surge will be exacerbated, especially in high-risk areas [17]. In addition, there is an increased likelihood that areas previously considered safe from flooding could be impacted. Coastal vegetation will likely be impacted by high winds and increased salt spray. Consequently, as we consider street tree planting strategies for the NYC coastline, we focus on the following coastal vulnerability factors: (1) frequent exposure to high winds; (2) salt spray; (3) saltwater flooding. With these factors in mind, we developed a tool that considers which tree species are most tolerant to salt exposure and delineates appropriate planting zones based on proximity to the coast.

2.3. Species Tolerance to Coastal Vulnerability Factors

We created a Coastal Tree Species Palette by reviewing the literature for tree survival and resilience in post hurricane and tropical storm conditions. We focused on tree species that are suitable for urban planting in our geographical region. We relied on both scientific and management expertise ranging from measurement of physical tree damage to municipal arborist surveys [18,19]. Tolerance of tree species to coastal environmental factors (soil salinity, salt spray, and high-speed winds) was reported in the existing literature on a six-class scale, i.e., high, moderate, moderate to high, low to moderate, low, poor, and unknown, for species lacking tolerance data [18,19]. From these ratings, we adapted the ModFacs approach developed by Matthews et al. [20] and calculated the modifying factor scores for 44 tree species suitable for urban planting. Scores were then converted into categories of high, moderate, and low overall tolerance (Supplementary Material File S1). We assigned high-tolerance tree species to coastal tier 1, moderate-tolerance trees to coastal tier 2, and low-tolerance trees to coastal tier 3 (see below and Figure 2). Clearly, trees assigned to a lower tier can also be planted in any coastal tier with a higher number. For example, trees assigned to tier 1 are suitable for tier 3 but not vice versa.
To validate the resulting species palette, we assessed the survival and condition of species that were flooded during superstorm Sandy. We hypothesized that street trees that lived through the storm exhibited some tolerance to coastal vulnerability factors, i.e., high-speed winds, soil salinity, and salt spray. We overlaid the Sandy Inundation Zone layer [21] with NYC Parks Tree Point data [22] to select trees that experienced saltwater flooding during Sandy. Tree point features assessed during NYC Parks’ inspections include diameter at breast height (DBH), tree structure, and tree condition. We selected trees that made up at least 1 percent of the street tree population in the Sandy Inundation Zone with a DBH > 25.4 cm (10 inches), Structure = “Full”, and Condition = “Excellent”, “Fair”, or “Good”.

2.4. Coastal Tiers

We developed a geographical information system (GIS) layer delineating three areal zones corresponding to the species tolerance classes (see above). We refer to these zones as coastal tiers. A coastal tier can be defined as an area in proximity to the coastline that is vulnerable to saltwater flooding (Table 1). We used sea level rise projection data to quantify the average distance of water incursions from the coastline. To accomplish this, we (1) processed sea level rise data, (2) delineated coastal boundaries, (3) conducted proximity analysis, and (4) developed coastal tiers (Figure 3).

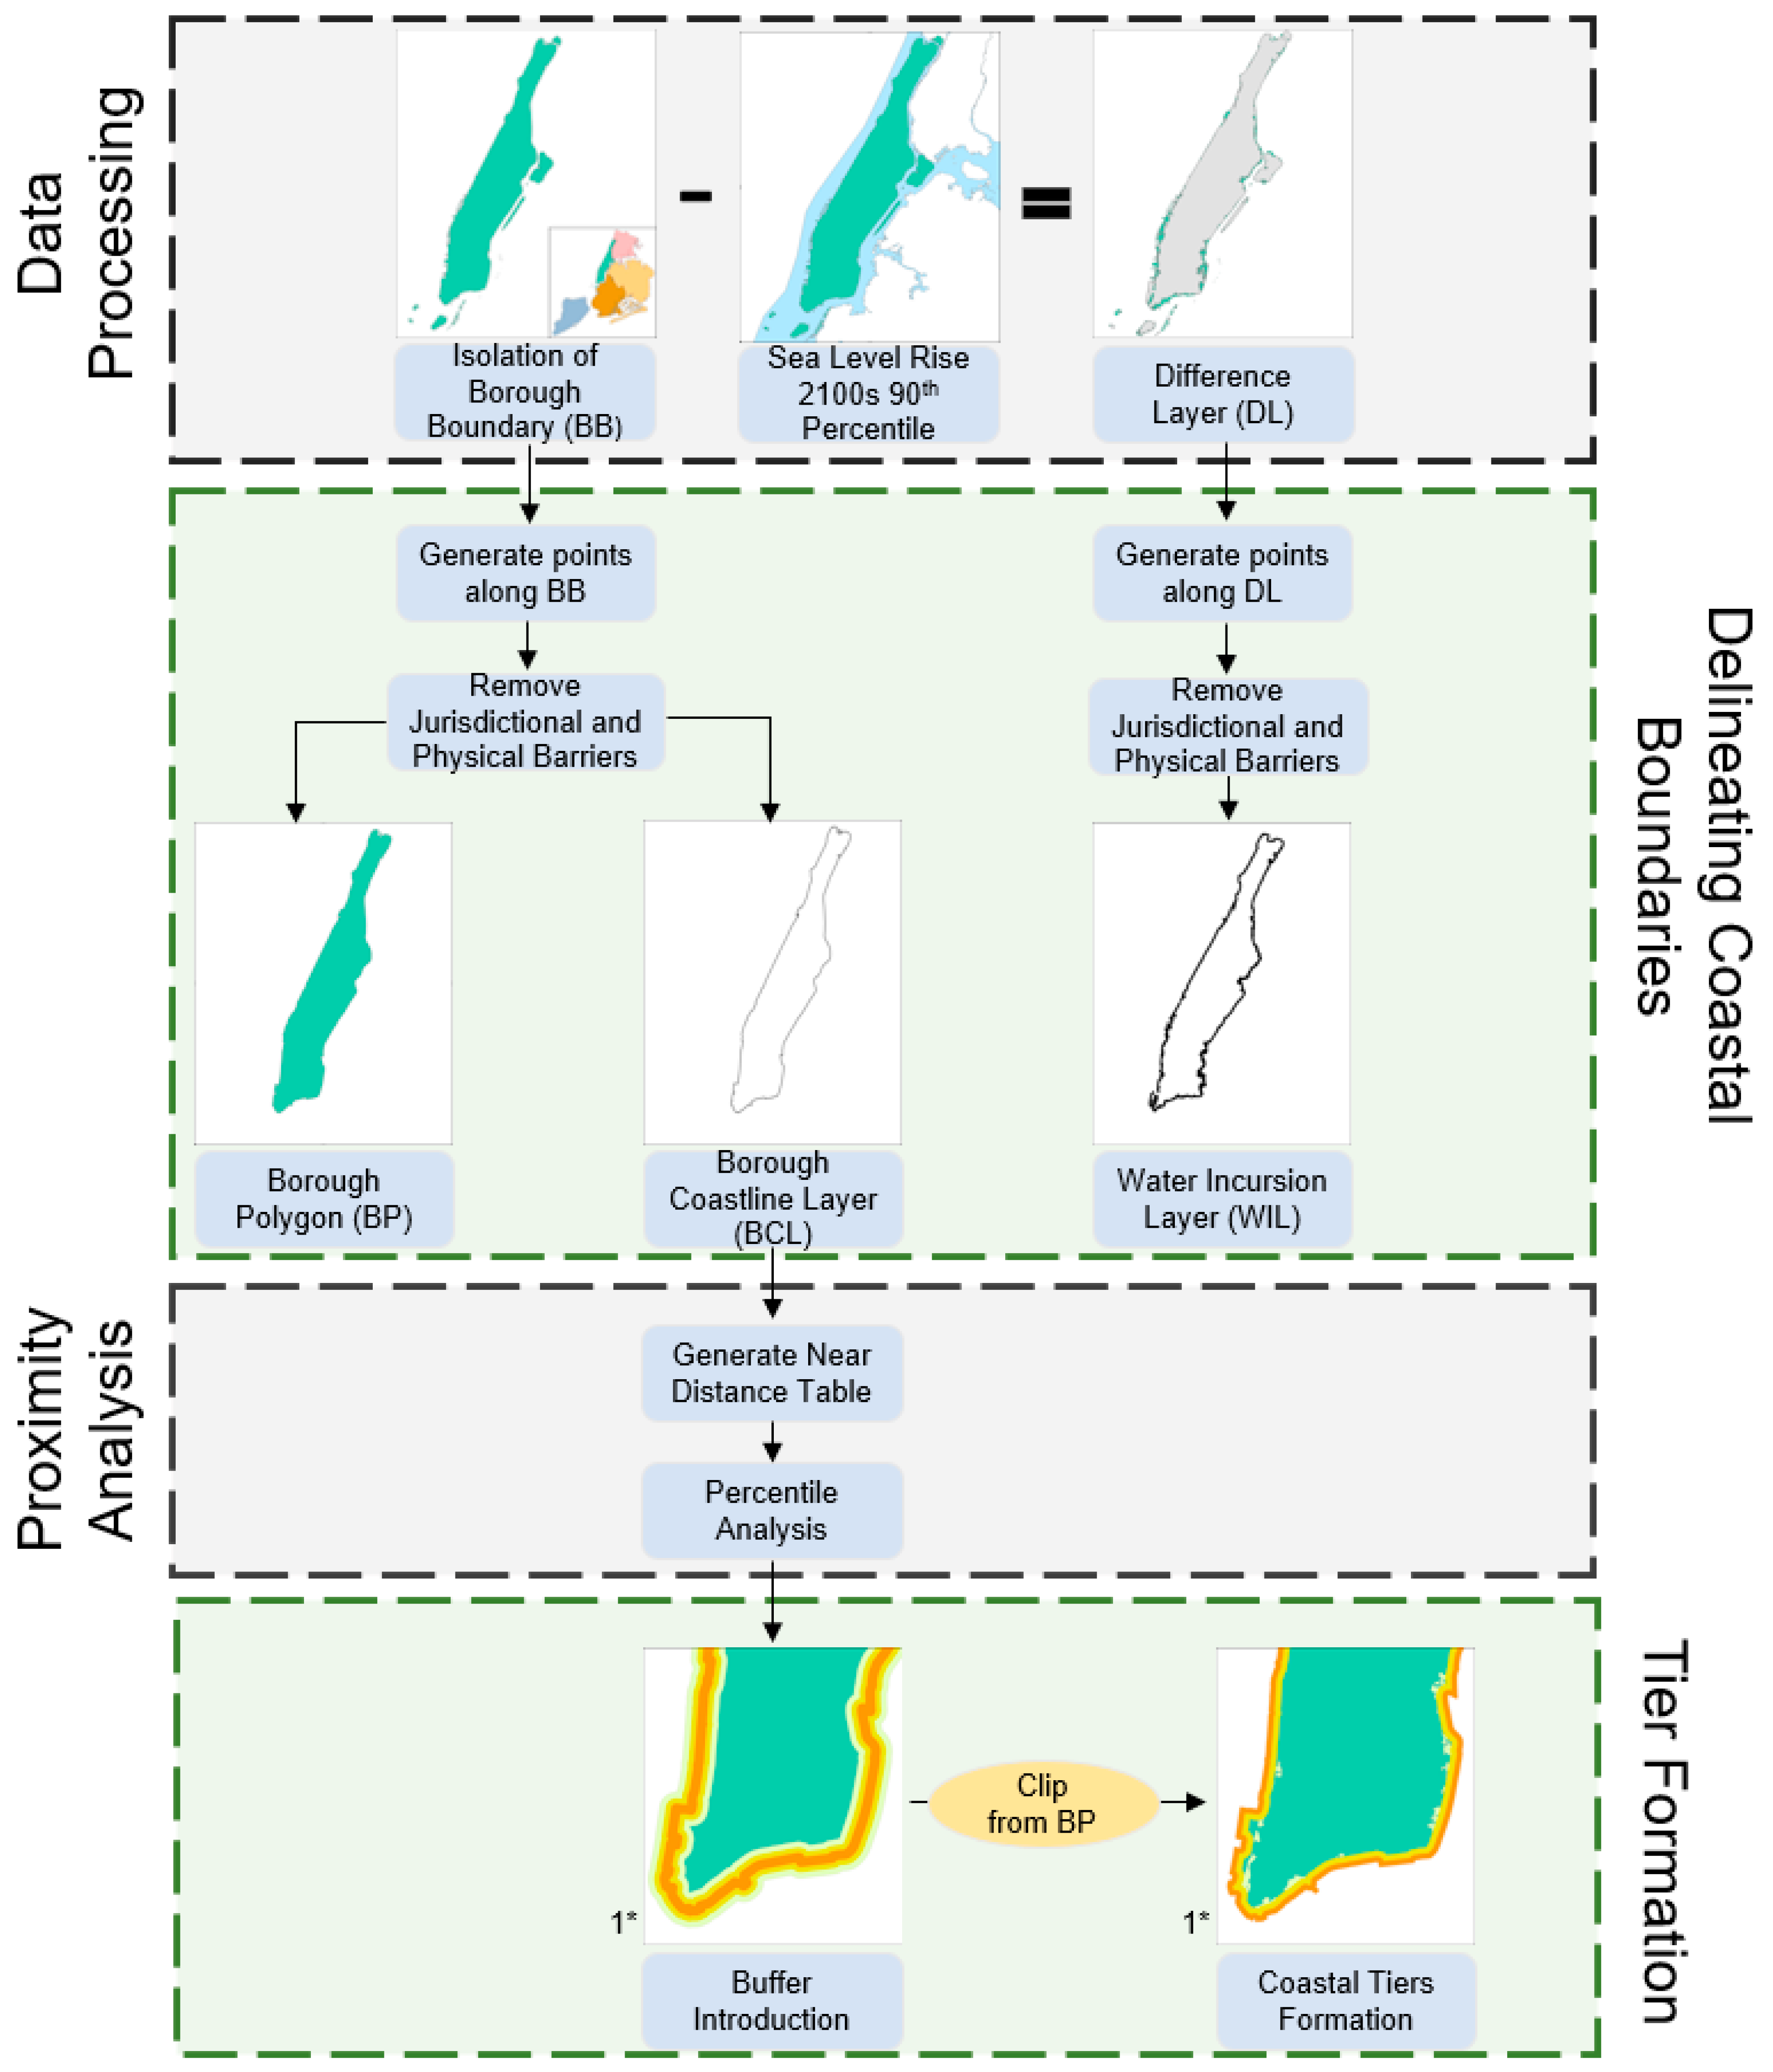
2.4.1. Sea Level Rise Data Processing

We used New York City’s Panel on Climate Change (NPCC) models on sea level rise for this project. These models include percentile projections (10th, 25th, 50th, and 90th) for the years 2020, 2050, 2080, and 2100 [23]. For our objective, we used the extreme SLR projection of 1.9 m (75 inches) by 2100 that falls within the 90th percentile of projected estimates. The 2100s projections portray an almost worst-case scenario, which is important for early identification of trees and areas at risk to guide management decisions for developing a more resilient urban tree canopy.
The NPCC SLR layer was a composite dataset of over 7000 pixelated polygons across the 5 boroughs. Since the New York City mainland consists of both low-lying and elevated areas, we hypothesized that not all boroughs will be impacted equally by SLR flooding. Therefore, the analysis was constrained to treat every borough as a separate landmass because of varied topography and NYC Parks’ borough-level managerial structure. Due to their connected landmass, the boroughs of Queens and Brooklyn were treated as a single unit.
To accurately calculate the distance of inland water incursions from the coastline, we subtracted the sea level rise layer from the borough area [24] to generate a new output feature class named Difference Layer (DL) (Figure 3). The DL is a polygon that delineates the estimated coastline in 2100 after a projected 1.9 m of SLR.

2.4.2. Coastal Boundary Delineation

Coastal infrastructure such as boardwalks, jetties, and piers were removed, as well as areas outside the jurisdiction of NYC Parks. Examples of areas outside NYC Parks’ jurisdiction include Riker’s Island, Governor’s Island, Liberty Island, Hoffman Island, LaGuardia airport, John F. Kennedy Airport, and Floyd Bennett Field.
Areas of Coney Island, Brighton Beach, and Rockaway Beach were projected to completely submerge during the occurrence of a 90th percentile SLR event in the 2100s, indicating high exposure to coastal vulnerability factors. Therefore, by definition, these were classified as coastal tier 1 (Table 1). As a result, these were eliminated while constructing the Borough Coastline Layer (BCL) for Brooklyn and Queens and were eliminated from the proximity analysis.

2.4.3. Proximity Analysis

The process of eliminating physical and jurisdictional barriers generated a feature polyline layer, the BCL (Figure 3), which was used as the starting point for estimating the distance of saltwater incursions. This distance was computed using the “Generate Near Table” geoprocessing tool that calculates the nearest distance and other proximity information between one or more feature classes or layers. While this tool can utilize point, polygon, polyline, and multipoint feature types, it does not accommodate multi-polygon feature analysis (ArcGIS Pro 3.2, Esri, Redlands, CA, USA). Therefore, we generated points at 15.24 m (50 feet) intervals along the DL to create a feature point layer called the Water Incursion Layer (WIL).
After further data cleaning, such as eliminating physical and jurisdictional barriers from the WIL, we ran the “Generate Near Table” tool with WIL and BCL as the input and near feature class, respectively.

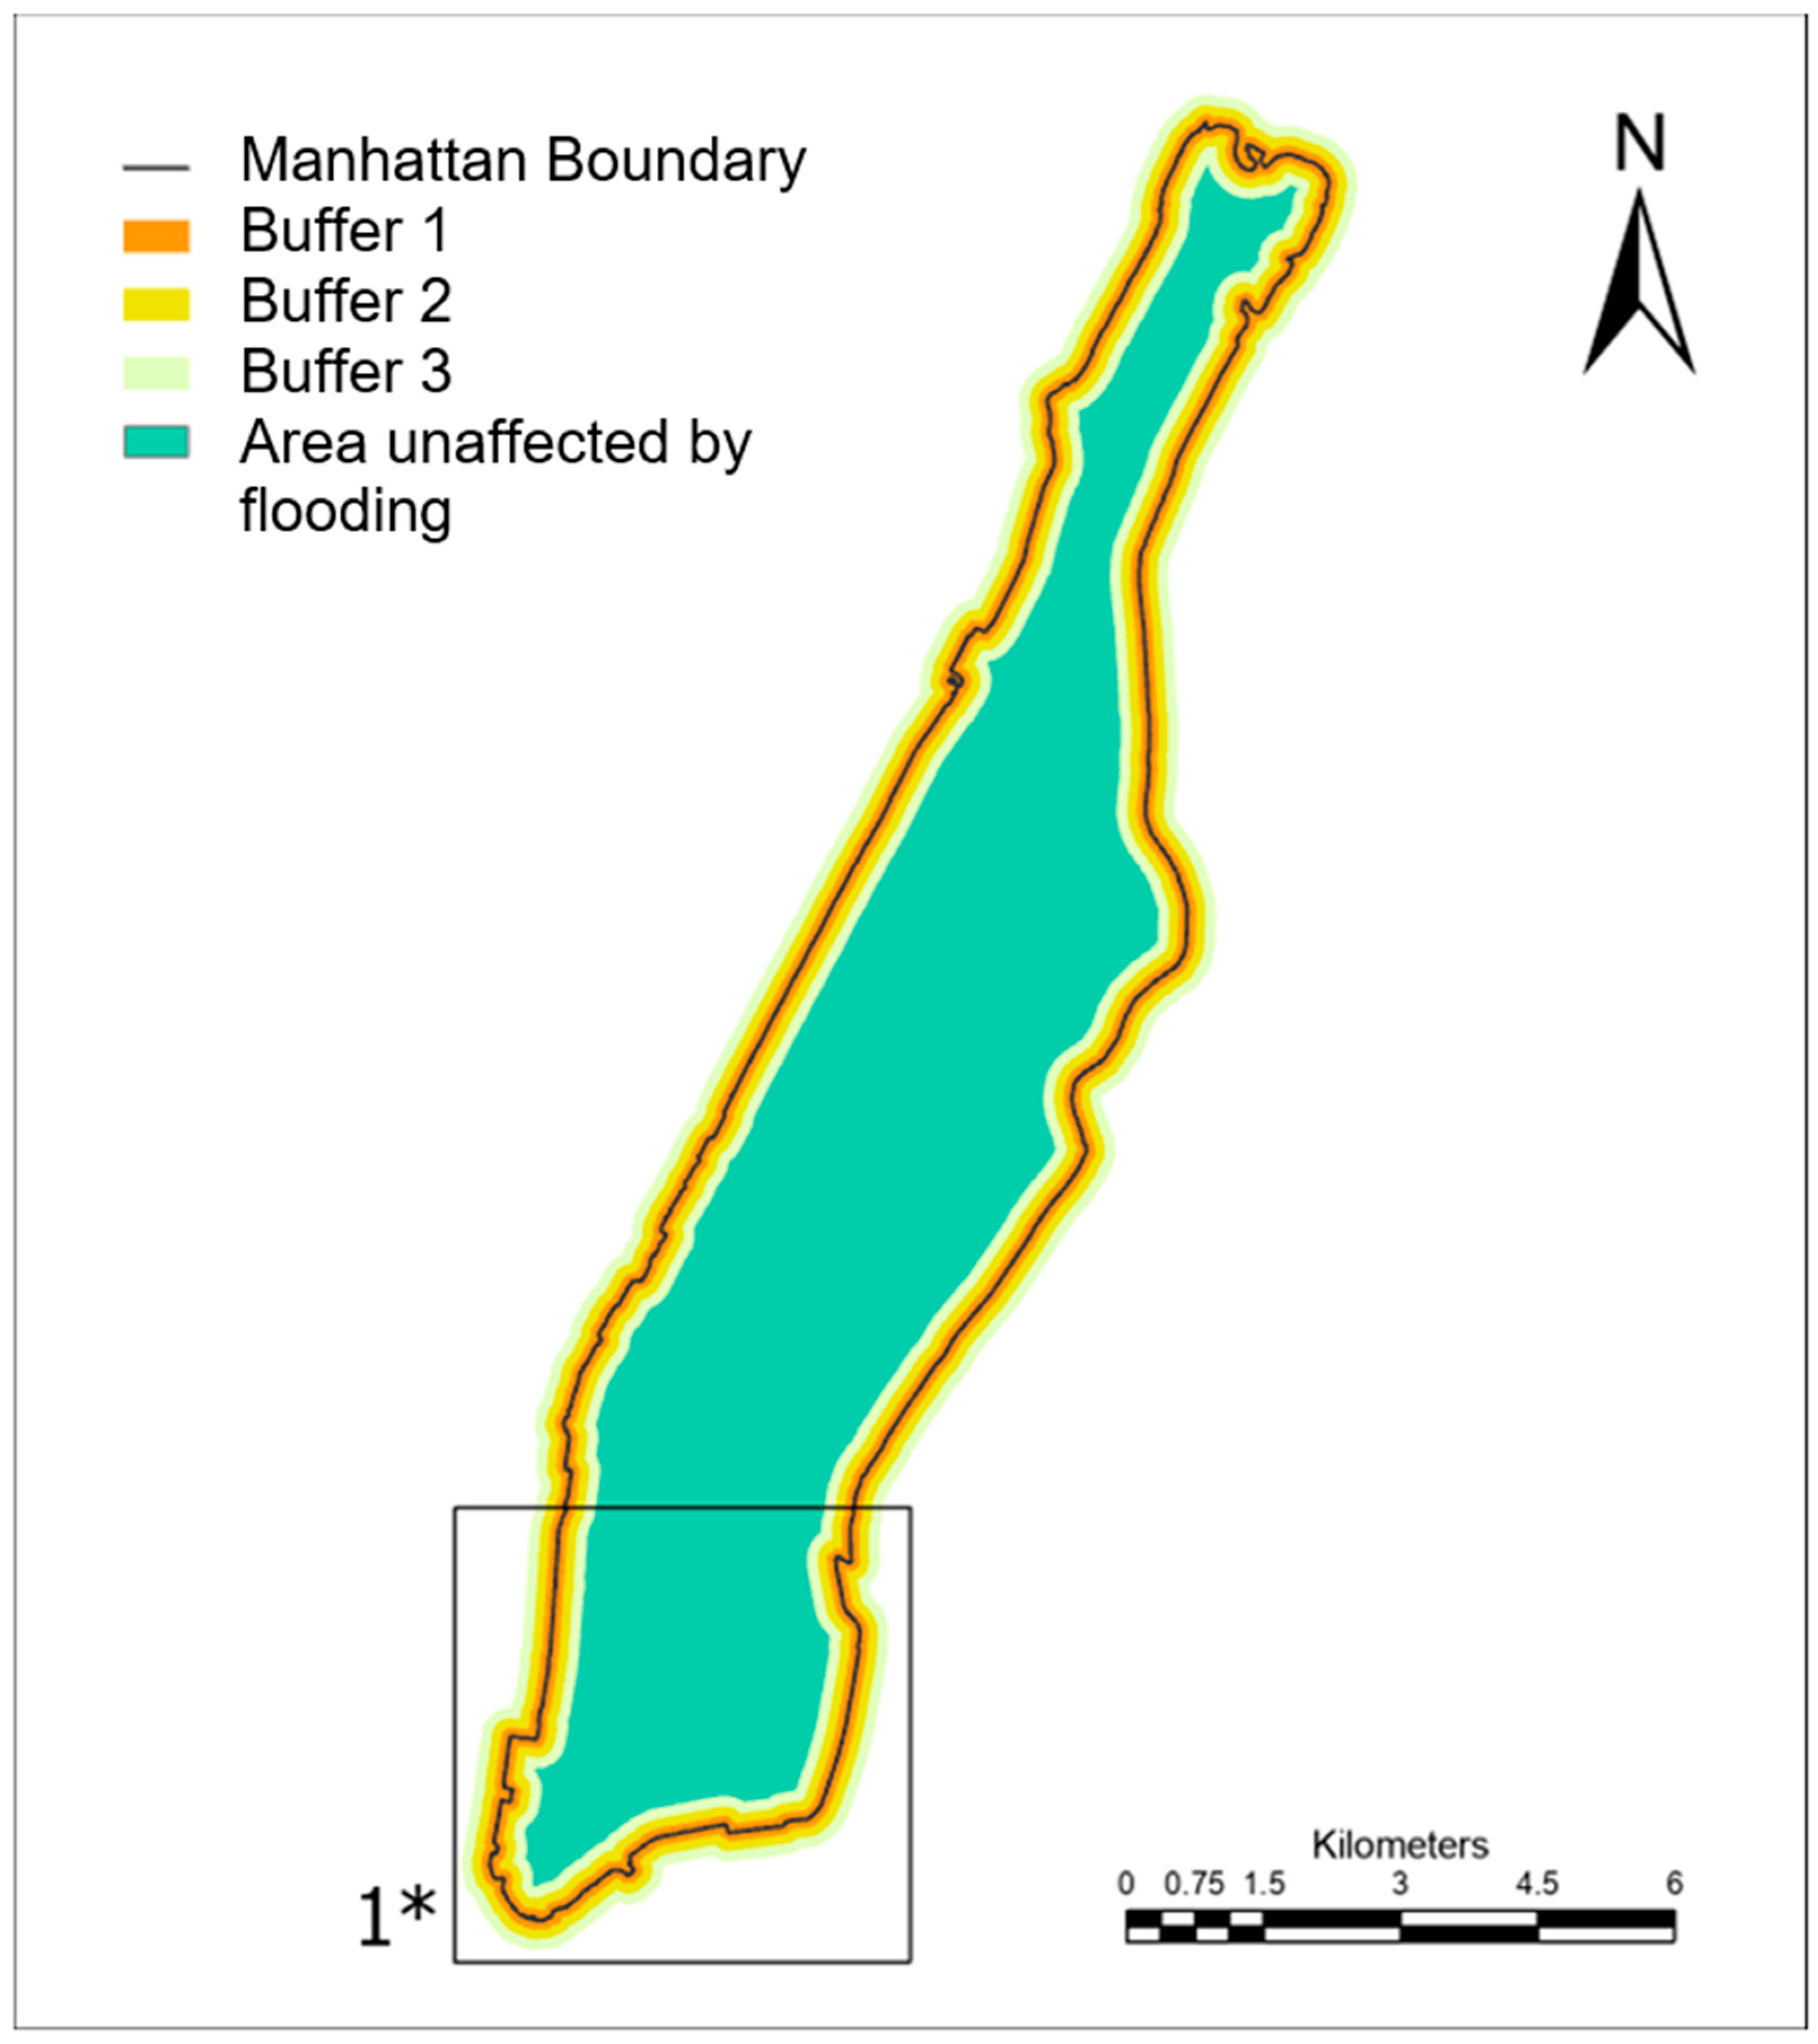
2.4.4. Coastal Tier Formation

The results of the proximity analysis were exported to a spreadsheet for further investigation. All data points with Near Distance field value < 0.3 m (<1.00 feet) were discarded as being outliers to avoid skewing the data average. The remaining data points were used to calculate percentile values corresponding to each coastal tier. We calculated the average distance of water incursions using the following data analysis command:
= P E R C E N T I L E . E X C ( a r r a y , k )
which returns the kth percentile of values in a range, where k is in the range 0…1, exclusive.
The value of k was substituted with 0.5, 0.75, and 0.9 for buffers 1, 2, and 3, respectively. With the objective to create a resilient coastal canopy, we used 50th percentile to determine the distance of the first buffer zone from the coastline. Our next data breaks were at 75th and 90th percentile to maximize the coverage of flood-prone areas by the tiers. Beyond 90th percentile, the projected incursions were not only sparse but significantly farther inland. Therefore, with applied management considerations, we used data points within 90th percentile to avoid limiting the species choice for inland areas while maximizing the coverage of areas prone to saltwater flooding.
Based on the percentile values, planar, round buffers around the BCL were then introduced using the “Buffer Analysis” geoprocessing tool (ArcGIS Pro 3.2, Esri, Redlands, CA, USA). We then clipped buffers from the borough area to delineate coastal tiers (Figure 3). To achieve non-overlapping tiers for operational purposes, areas of buffers 1 and 2 were extracted from buffers 2 and 3 correspondingly before the final clipping leading to coastal tiers. Additionally, we merged areas of Coney Island, Brighten Beach, and Rockaway Beach while generating tier 1 for Brooklyn and Queens.

3. Results

3.1. Species Palette

We found information on tree species tolerance to salt spray, soil salt, and wind for 44 tree species (Supplementary Material File S1). Out of these, 16 had high overall tolerance, 21 had moderate overall tolerance, while only 7 had low overall tolerance to coastal vulnerability factors. This means that 16/44 species were suitable for planting in coastal tier 1, 37 (high plus moderate overall tolerance) were suitable for planting in coastal tier 2, and all 44 (high, moderate, low) were suitable for planting in coastal tier 3.
The areas of NYC that were flooded during Sandy contain 24,000 trees. There are 19 species which make up at least 1 percent of the flooded tree population (Figure 4). Of the trees flooded during Sandy, 21,000 trees met our size and selection criteria suggesting some level of tolerance to associated coastal factors explaining their survival and growth post hurricane Sandy. Of the 19 species that constituted at least 1 percent of the population, only 6 (i.e., Gleditsia triacanthos L., Liquidambar styraciflua L., Quercus palustris Munchh., Quercus phellos L., Styphnolobium japonicum (L.) Schott, and Zelkova serrata (Thunb.) Makino) matched the species palette produced in this study (Supplementary Material File S1). Out of these, G. triacanthos and Q. phellos exhibit high tolerance to coastal vulnerability factors based on the ModFac scores, whereas L. stryaciflua, S. japonicum, and Z. serrata have moderate tolerance, and Q. palustris has a low overall tolerance. The species composition analysis further revealed some interesting population trends. London plane tree (Plantanus × acerifolia Mill. Ex Munchh.) contributed to 28.5% of the existing Sandy Inundation Zone population city-wide with over 7000 trees. Callery pear (Pyrus calleryana Decne.), Norway maple (Acer platanoides L.), and green ash (Fraxinus pennsylvanica Marshall) trees also contribute significantly to the existing population in the inundation zone.

3.2. Coastal Tiers

The configuration of coastal tiers indicated that not every borough was affected equally by rise in sea level. The data from proximity analysis showed that the boroughs of Brooklyn, Queens, and Staten Island had larger flood buffers compared to Bronx and Manhattan, suggesting that the latter are projected to experience less flooding in the future (Table 2). While more than 136,000 of the nearly 660,000 street trees in NYC exist in coastal tiers city-wide, the distribution of trees expected to be impacted by coastal vulnerability factors in the future varies between boroughs. For example, in tier 1, Brooklyn and Queens jointly have over 38,000 trees, and Staten Island has nearly 7500 trees, while Bronx and Manhattan contain 1836 and 8585 trees, respectively.
While tiers 1 and 2 were introduced as continuous buffers along the coastline, tier 3 is a discontinuous outline of areas prone to saltwater flooding in an event of sea level rise (Figure 3). We determined from observational data that trees farther inland are relatively less exposed to high-speed winds or wind-driven salt spray, therefore the largest factor at play was saltwater flooding. Because not all areas will be equally impacted by flooding due to varying topography, we concluded that a continuous buffer outlining tier 3 was not necessary for our purposes.

4. Discussion and Management Implications

Salt tolerance mechanisms in trees include exclusion of salt by roots, excretion by leaves, and storage of salt ions in cells to balance external water potential [25]. Research on salt tolerance mechanisms of forest trees along with breeding, selecting, or creating trees with high tolerance to saline soils is in its infancy [25]. Here, we rely on the existing literature and empirical evidence to rank tree species by their level of tolerance to salt impacts.
Our species composition analysis highlights the vulnerability of the existing tree canopy along NYC’s coastline with higher populations of London plane tree, pin oak, callery pear, Norway maple, and green ash. London plane trees were severely impacted by saltwater flooding during Sandy, indicating poor tolerance to saltwater flooding [4], which raises concerns about the sustainability of the street tree population in the coastal tiers. Furthermore, while the data on coastal suitability of callery pear and Norway maple species are limited, their shallow root systems make them susceptible to uprooting during high-speed winds. Considering a potential decline of coastal tree population, NYC Parks is working to diversify the street tree planting palette, with particular attention being given to tree species that may be more resilient to future climatic conditions. This has resulted in planting greater numbers of willow oak (Quercus phellos) and Japanese zelkova (Zelkova serrata), which, according to our analysis, have high and moderate tolerance to coastal vulnerability factors, respectively (Supplementary Material File S1).
Urban forest managers in coastal cities plan for increased temperatures and/or wetter or drier conditions in the future. In addition, they are faced with changing environmental conditions along the coast related to sea level rise, such as saltwater flooding and increased storm frequency and severity, which in turn can exacerbate injury by salt spray. The combination of these urban stressors can have an adverse effect on tree health, performance, and survival [26].
The existing ash trees (Fraxinus spp.) in the coastal areas of NYC add further complexity due to the ongoing emerald ash borer outbreak, indicating the need to replace the declining population with tree species tolerant to saltwater intrusion as well as prevalent pests. Many cities are setting or supporting goals for maintaining or increasing overall tree canopy cover, which includes “parts of a tree or trees, including the leaves, branches, and stems, that shade the ground when viewed from above”, mostly using remote sensing technology [27]. For example, Forest For All NYC, a multi-organizational coalition, outlines among its major objectives to achieve 30% canopy citywide by 2035 [28]. Other cities around the world are adopting the 3–30–300 rule as a framework for urban greening [29]. A key component of these goals is to preserve the existing urban tree canopy cover in addition to planting new trees. Our tool can help ensure the sustainability of trees planted in areas likely to be impacted by coastal vulnerability factors now and in the future.
The method and procedures we outline could be applicable to other coastal cities that are adopting nature-based solutions, such as increasing tree canopy cover in order to increase future coastal resilience [30,31]. Our species list can help other urban forest managers working with similar planting palettes. Additionally, the ModFacs approach used to develop the species list serves as a template for determining overall tolerance to coastal vulnerability factors for other species of interest to managers (e.g., in other climatic zones). It should be noted that our species list does not provide coastal tolerance ratings for all tree species currently being procured and planted by NYC Parks, nor does the list include species suitable for other geographic regions, due to lack of existing data and literature. Therefore, future research efforts that monitor and assess the health of existing trees in coastal tier 1 of NYC considering coastal vulnerability factors would help advance the knowledge of salt tolerance in specific tree species. Our efforts provide information for adopting a proactive approach focused on mitigating the impacts of future saltwater inundation on street trees.

5. Conclusions

While several studies have assessed damage from coastal storms as well as salt tolerance of various species [6,19,32,33], the creation of an overall tolerance score for coastal vulnerability paired with a GIS-based tool that allows managers to pair the most tolerant tree species with geographies that are most likely to experience saltwater inundation in the future is novel.
Trees provide many ecosystem services, and the importance of maintaining urban green spaces as a refuge was emphasized during the pandemic [34]. However, city trees face a set of environmental factors that they did not necessarily evolve with (e.g., higher temperatures [35], heavy metals [36], atmospheric pollutants [37], therefore, having knowledge of planting the right species at the right location can help mitigate and adapt to a changing climate. Sea level rise due to climate change means that coastal cities will face saltwater flooding that is both more frequent and severe (i.e., greater areas of inundation [4] putting a greater proportion of a coastal cities’ tree canopy at risk. This comes at a time when many cities are trying to increase their urban tree canopy cover.
These results highlight the vulnerability of existing street tree populations in areas in close proximity to the coast. For example, London plane tree and other species particularly susceptible to coastal vulnerability factors make up the majority of NYC’s street tree population. The methods outlined here allow NYC’s street tree planting teams to choose more tolerant species to plant in those geographic areas, which are more likely to experience saltwater flooding in the future.
We learned that there is limited information in the scientific literature on the relative tolerance of tree species to coastal vulnerability factors, and more research is needed. As cities begin to plant putatively tolerant species in zones impacted by coastal vulnerability factors, subsequent validation of their resilience could be very useful. As coastal cities work towards creating a tree canopy that is resilient to future climate impacts, our framework and template may be useful for other urban forest managers.

Supplementary Materials

The following supporting information can be downloaded at: https://www.mdpi.com/article/10.3390/f15010092/s1. Supplementary Material File S1: NYC Tree Planting Coastal Species List. References [4,15,18,38,39,40,41,42,43,44,45,46,47,48,49,50,51,52,53,54,55,56,57,58,59,60,61,62,63,64,65,66,67,68] are cited in Supplementary Materials.

Author Contributions

R.K.: Conceptualization, Methodology, Data curation, Investigation, Resources, Formal analysis, Software, Visualization, Writing—original draft. R.A.H.: Conceptualization, Validation, Writing—review and editing, Supervision. N.S.: Conceptualization, Validation, Writing—review and editing, Supervision. All authors have read and agreed to the published version of the manuscript.

Funding

This research received no external funding.

Data Availability Statement

Data are already published and publicly available, with those publications properly cited in this submission. Datasets utilized for this research are as follows: NYC Open Data 2022, Projected Sea Level Rise. Retrieved from https://data.cityofnewyork.us/City-Government/Projected-Sea-Level-Rise/6an6-9htp (accessed on 20 June 2022). NYC Open Data 2022, Sandy Inundation Zone. Retrieved from https://data.cityofnewyork.us/browse?q=Sandy+Inundation+Zone&sortBy=relevance (accessed on 20 June 2022). NYC Open Data 2022, Forestry Tree Points. Retrieved from https://data.cityofnewyork.us/Environment/Forestry-Tree-Points/hn5i-inap/data (accessed on 20 June 2022). NYC Open Data 2022, Borough Boundary. Retrieved from https://data.cityofnewyork.us/City-Government/Borough-Boundaries/tqmj-j8zm (accessed on 20 June 2022). NYC Parks Tree Count 2015. Retrieved from https://www.nycgovparks.org/trees/treescount (accessed on 20 June 2022).

Acknowledgments

The authors would like to acknowledge Haley Hix at the NYC Department of Parks and Recreation for her support with the tree species salt tolerance literature search.

Conflicts of Interest

The authors declare no conflicts of interest.

References

  1. Burkhard, B.; Kroll, F.; Nedkov, S.; Müller, F. Mapping Ecosystem Service Supply, Demand and Budgets. Ecol. Indic. 2012, 21, 17–29. [Google Scholar] [CrossRef]
  2. Rosenzweig, C.; Solecki, W. The Future We Don’t Want: How Climate Change Could Impact the World’s Greatest Cities; C40 Cities Secretariat: London, UK, 2018. [Google Scholar]
  3. Hanson, S.; Nicholls, R.; Ranger, N.; Hallegatte, S.; Corfee-Morlot, J.; Herweijer, C.; Chateau, J. A Global Ranking of Port Cities with High Exposure to Climate Extremes. Clim. Chang. 2011, 104, 89–111. [Google Scholar] [CrossRef]
  4. Hallett, R.; Johnson, M.L.; Sonti, N.F. Assessing the Tree Health Impacts of Salt Water Flooding in Coastal Cities: A Case Study in New York City. Landsc. Urban Plan. 2018, 177, 171–177. [Google Scholar] [CrossRef]
  5. Hallegatte, S.; Green, C.; Nicholls, R.J.; Corfee-Morlot, J. Future Flood Losses in Major Coastal Cities. Nat. Clim. Chang. 2013, 3, 802–806. [Google Scholar] [CrossRef]
  6. Dmuchowski, W.; Brągoszewska, P.; Gozdowski, D.; Baczewska-Dąbrowska, A.H.; Chojnacki, T.; Jozwiak, A.; Swiezewska, E.; Suwara, I.; Gworek, B. Strategies of Urban Trees for Mitigating Salt Stress: A Case Study of Eight Plant Species. Trees 2022, 36, 899–914. [Google Scholar] [CrossRef]
  7. Laffray, X.; Alaoui-Sehmer, L.; Bourioug, M.; Bourgeade, P.; Alaoui-Sossé, B.; Aleya, L. Effects of Sodium Chloride Salinity on Ecophysiological and Biochemical Parameters of Oak Seedlings (Quercus robur L.) from Use of de-Icing Salts for Winter Road Maintenance. Environ. Monit. Assess. 2018, 190, 266. [Google Scholar] [CrossRef]
  8. Plesa, I.; Hassan, M.A.; Sestras, A.F.; Vicente, O.; Boscaiu, M.; Sestras, R.E. Biochemical Markers of Salt Stress in European Larch (Larix decidua). Not. Sci. Biol. 2018, 10, 430–438. [Google Scholar] [CrossRef]
  9. Kozlowski, T.T. Responses of Woody Plants to Flooding and Salinity. Tree Physiol. 1997, 17, 490. [Google Scholar] [CrossRef]
  10. Allen, J.A.; Chambers, J.L.; Stine, M. Prospects for Increasing the Salt Tolerance of Forest Trees: A Review. Tree Physiol. 1994, 14, 843–853. [Google Scholar] [CrossRef]
  11. Paludan-Müller, G.; Saxe, H.; Pedersen, L.B.; Randrup, T.B. Differences in Salt Sensitivity of Four Deciduous Tree Species to Soil or Airborne Salt. Physiol. Plant. 2002, 114, 223–230. [Google Scholar] [CrossRef]
  12. Tully, K.; Gedan, K.; Epanchin-Niell, R.; Strong, A.; Bernhardt, E.S.; BenDor, T.; Mitchell, M.; Kominoski, J.; Jordan, T.E.; Neubauer, S.C.; et al. The Invisible Flood: The Chemistry, Ecology, and Social Implications of Coastal Saltwater Intrusion. BioScience 2019, 69, 368–378. [Google Scholar] [CrossRef]
  13. Doroski, D.A.; Ashton, M.S.; Duguid, M.C. The Future Urban Forest—A Survey of Tree Planting Programs in the Northeastern United States. Urban For. Urban Green. 2020, 55, 126816. [Google Scholar] [CrossRef]
  14. Shorris, A. Cool Neighborhoods NYC: A Comprehensive Approach to Keep Communities Safe in Extreme Heat; New York City Mayor’s Office: New York, NY, USA, 2017. [Google Scholar]
  15. Strauss, N.; NYC Department of Parks and Recreation, New York City, NY, USA. Personal communication, 2022.
  16. New York City Tree Map. Available online: https://tree-map.nycgovparks.org/ (accessed on 22 June 2022).
  17. Horton, R.; Little, C.; Gornitz, V.; Bader, D.; Oppenheimer, M. New York City Panel on Climate Change 2015 Report Chapter 2: Sea Level Rise and Coastal Storms. Ann. N. Y. Acad. Sci. 2015, 1336, 36–44. [Google Scholar] [CrossRef] [PubMed]
  18. Appleton, B.L.; Greene, V.; Smith, A.; French, S.; Kane, B.; Fox, L.J.; Downing, A.K.; Gilland, T. Trees and Shrubs That Tolerate Saline Soils and Salt Spray Drift; Communications and Marketing, College of Agriculture and Life Sciences, Virginia Polytechnic Institute and State University: Blacksburg, VA, USA, 2009. [Google Scholar]
  19. Duryea, M.; Kampf, E.; Littell, R. Hurricanes and the Urban Forest: I. Effects on Southeastern United States Coastal Plain Tree Species. Arboric. Urban For. 2007, 33, 83–97. [Google Scholar] [CrossRef]
  20. Matthews, S.N.; Iverson, L.R.; Prasad, A.M.; Peters, M.P.; Rodewald, P.G. Modifying Climate Change Habitat Models Using Tree Species-Specific Assessments of Model Uncertainty and Life History-Factors. For. Ecol. Manag. 2011, 262, 1460–1472. [Google Scholar] [CrossRef]
  21. NYC Open Data. Sandy Inundation Zone. 2022. Available online: https://data.cityofnewyork.us/browse?q=Sandy+Inundation+Zone&sortBy=relevance (accessed on 20 June 2022).
  22. NYC Open Data. Forestry Tree Points. 2022. Available online: https://data.cityofnewyork.us/Environment/Forestry-Tree-Points/hn5i-inap/data (accessed on 20 June 2022).
  23. NYC Open Data. Projected Sea Level Rise. 2022. Available online: https://data.cityofnewyork.us/City-Government/Projected-Sea-Level-Rise/6an6-9htp (accessed on 20 June 2022).
  24. NYC Open Data. Borough Boundaries. 2022. Available online: https://data.cityofnewyork.us/City-Government/Borough-Boundaries/tqmj-j8zm (accessed on 20 June 2022).
  25. Zhang, M.; Liu, Y.; Han, G.; Zhang, Y.; Wang, B.; Chen, M. Salt Tolerance Mechanisms in Trees: Research Progress. Trees 2021, 35, 717–730. [Google Scholar] [CrossRef]
  26. Czaja, M.; Kołton, A.; Muras, P. The Complex Issue of Urban Trees—Stress Factor Accumulation and Ecological Service Possibilities. Forests 2020, 11, 932. [Google Scholar] [CrossRef]
  27. Our Urban Forest. Available online: https://storymaps.arcgis.com/stories/5353de3dea91420faaa7faff0b32206b (accessed on 13 December 2023).
  28. Forest for All NYC. Available online: https://forestforall.nyc/ (accessed on 13 December 2023).
  29. Konijnendijk, C.C. Evidence-Based Guidelines for Greener, Healthier, More Resilient Neighbourhoods: Introducing the 3–30–300 Rule. J. For. Res. 2022, 34, 821–830. [Google Scholar] [CrossRef]
  30. Kabisch, N.; Frantzeskaki, N.; Pauleit, S.; Naumann, S.; Davis, M.; Artmann, M.; Haase, D.; Knapp, S.; Korn, H.; Stadler, J.; et al. Nature-Based Solutions to Climate Change Mitigation and Adaptation in Urban Areas: Perspectives on Indicators, Knowledge Gaps, Barriers, and Opportunities for Action. Ecol. Soc. 2016, 21, 39. [Google Scholar] [CrossRef]
  31. Powell, E.J.; Tyrrell, M.C.; Milliken, A.; Tirpak, J.M.; Staudinger, M.D. A Review of Coastal Management Approaches to Support the Integration of Ecological and Human Community Planning for Climate Change. J. Coast. Conserv. 2019, 23, 1–18. [Google Scholar] [CrossRef]
  32. Kim, M.; Song, K.; Chon, J. Key Coastal Landscape Patterns for Reducing Flood Vulnerability. Sci. Total Environ. 2021, 759, 143454. [Google Scholar] [CrossRef] [PubMed]
  33. Zhang, J. Coastal Saline Soil Rehabilitation and Utilization Based on Forestry Approaches in China; Springer: Berlin/Heidelberg, Germany, 2014; ISBN 978-3-642-39914-5. [Google Scholar]
  34. Campbell, L.K.; Svendsen, E.S.; Johnson, M.L.; Plitt, S. Not by Trees Alone: Centering Community in Urban Forestry. Landsc. Urban Plan. 2022, 224, 104445. [Google Scholar] [CrossRef]
  35. Zhou, B.; Rybski, D.; Kropp, J.P. The Role of City Size and Urban Form in the Surface Urban Heat Island. Sci. Rep. 2017, 7, 4791. [Google Scholar] [CrossRef] [PubMed]
  36. Krzyżaniak, M.; Świerk, D.; Antoszewski, P. Factors Influencing the Health Status of Trees in Parks and Forests of Urbanized Areas. Forests 2021, 12, 656. [Google Scholar] [CrossRef]
  37. Juráň, S.; Grace, J.; Urban, O. Temporal Changes in Ozone Concentrations and Their Impact on Vegetation. Atmosphere 2021, 12, 82. [Google Scholar] [CrossRef]
  38. Gilman, E.F.; Watson, D.G. Amelanchier canadensis: Shadblow Serviceberry. Available online: https://edis.ifas.ufl.edu/publication/ST074 (accessed on 13 December 2023).
  39. Gilman, E.F.; Watson, D.G. Amelanchier laevis: Allegheny Serviceberry. Available online: https://edis.ifas.ufl.edu/publication/ST075 (accessed on 13 December 2023).
  40. Shrubs for Difficult Sites. Cornell University|Cooperative Extension Monroe County. Available online: https://monroe.cce.cornell.edu/resources/shrubs-for-difficult-sites (accessed on 13 December 2023).
  41. Kushla, J. Storm-Resistant Trees for Mississippi Landscapes. Available online: https://extension.msstate.edu/publications/storm-resistant-trees-for-mississippi-landscapes (accessed on 13 December 2023).
  42. Fox, L.; Koci, J. Trees and Shrubs That Tolerate Saline Soils, Salt Spray and De-Icing Salts. Available online: https://www.pubs.ext.vt.edu/430/430-031/430-031.html (accessed on 13 December 2023).
  43. Betula populifolia: “Whitespire” (Asian White Birch, Japanese Gray Birch, Whitespire Japanese Birch)|North Carolina Extension Gardener Plant Toolbox. Available online: https://plants.ces.ncsu.edu/plants/betula-populifolia-whitespire/ (accessed on 13 December 2023).
  44. Salt Tolerant Plants. North Carolina Cooperative Extension. Available online: https://www.surfcitync.gov/DocumentCenter/View/54/Salt-Tolerant-Plants-PDF (accessed on 15 December 2023).
  45. Design and Planning for Flood Resiliency—Guidelines for NYC Parks. Available online: https://static.nycgovparks.org/images/pagefiles/128/NYCP-Design-and-Planning-Flood-Zone__5b0f0f5da8144.pdf (accessed on 13 December 2023).
  46. Duryea, M.L.; Kampf, E. Selecting Tropical and Subtropical Tree Species for Wind Resistance; EDIS 2007; University of Florida George A Smathers Libraries: Gainesville, FL, USA, 2007. [Google Scholar] [CrossRef]
  47. Duryea, M.L.; Kampf, E. Selecting Coastal Plain Species for Wind Resistance; IFAS Extension 2017; University of Florida: Gainesville, FL, USA, 2017. [Google Scholar]
  48. Gilman, E.F.; Watson, D.G.; Klein, R.W.; Koeser, A.K.; Hilbert, D.R.; McLean, D.C. Cornus florida: Flowering Dogwood. Available online: https://edis.ifas.ufl.edu/publication/ST185 (accessed on 13 December 2023).
  49. Jull, L.G. Winter Salt Injury and Salt-Tolerant Landscape Plants. Available online: https://hort.extension.wisc.edu/articles/winter-salt-injury-and-salt-tolerant-landscape-plants/ (accessed on 15 December 2023).
  50. Crataegus crus-galli: Cockspur Thorn, Cockspur Hawthorn, Dwarf Hawthorn PFAF Plant Database. Available online: https://pfaf.org/user/Plant.aspx?LatinName=Crataegus+crus-galli (accessed on 15 December 2023).
  51. Miyamoto, S.; Martinez, I.; Padilla, M.; Portillo, A.; Ornelas, D. Landscape Plant Lists for Salt Tolerance Assessment; Texas Agricultural Experiment Station: Austin, TX, USA, 2004. [Google Scholar]
  52. Gleditsia triacanthos. North Carolina State Extension. Available online: https://plants.ces.ncsu.edu/plants/gleditsia-triacanthos/ (accessed on 13 December 2023).
  53. Young, S.; Lamont, E.; Bustamante, V. Long Island Native Woody Plants for Landscaping and Restoration of Seaside Environments. Long Isl. Bot. Soc. 2016, 26, 16–17. [Google Scholar]
  54. Koelreuteria paniculata. Cornell University|Woody Plant Database. Available online: https://woodyplants.cals.cornell.edu/plant/131 (accessed on 13 December 2023).
  55. Gilman, E.F.; Watson, D.G. Malus spp.: Crabapple. Available online: https://hort.ifas.ufl.edu/database/documents/pdf/tree_fact_sheets/malsppa.pdf (accessed on 13 December 2023).
  56. Gilman, E.F.; Watson, D.G. Pinus parviflora: Japanese White Pine. Available online: https://hort.ifas.ufl.edu/trees/PINPARA.pdf (accessed on 15 December 2023).
  57. McKenzie, R. White Pine and Salt Tolerance. Available online: https://www.extension.purdue.edu/extmedia/fnr/fnr-faq-10-w.pdf (accessed on 17 December 2023).
  58. Gilman, E.F.; Watson, D.G. Pinus strobus: Eastern White Pine. Available online: https://edis.ifas.ufl.edu/publication/ST473 (accessed on 17 December 2023).
  59. Pinus sylvestris: Scots Pine, European Redwood. Available online: https://www.ebben.nl/en/treeebb/pisylves-pinus-sylvestris/pdf/ (accessed on 14 December 2023).
  60. Zencirkiran, M. Trends in Landscape, Agriculture, Forest and Natural Science; Cambridge Scholars Publishing: Newcastle upon Tyne, UK, 2019; ISBN 978-1-5275-4357-7. [Google Scholar]
  61. Gilman, E.F.; Watson, D.G. Quercus acutissima: Sawtooth Oak. Available online: https://edis.ifas.ufl.edu/publication/ST540 (accessed on 13 December 2023).
  62. Quercus acutissima: Sawtooth Oak. Available online: https://www.ebben.nl/en/treeebb/quacutis-quercus-acutissima/pdf/ (accessed on 13 December 2023).
  63. Shingle Oak Trees. Available online: https://www.midwestgardentips.com/trees-index-1/shingle-oak-trees (accessed on 13 December 2023).
  64. Quercus phellos. North Carolina State Extension. Available online: https://plants.ces.ncsu.edu/plants/quercus-phellos/ (accessed on 13 December 2023).
  65. Wind Resistance of Trees. Available online: https://blogs.ifas.ufl.edu/pinellasco/files/2018/03/wind-resistantance-of-trees.pdf (accessed on 13 December 2023).
  66. Species- Styphnolobium japonicum. Cornell University|Woody Plant Database. Available online: https://woodyplants.cals.cornell.edu/plant/234 (accessed on 13 December 2023).
  67. Gilman, E.F.; Watson, D.G.; Klein, R.W.; Koeser, A.K.; Hilbert, D.R.; McLean, D.C. Taxodium ascendens: Pondcypress. Available online: https://edis.ifas.ufl.edu/publication/ST619 (accessed on 13 December 2023).
  68. Landscape Plants—Zelkova serrata. Oregon State University. Available online: https://landscapeplants.oregonstate.edu/plants/zelkova-serrata (accessed on 13 December 2023).
Figure 1. The New York City study area.
Forests 15 00092 g001
Figure 2. Coastal buffers 1, 2, and 3 around Manhattan’s coastline (Borough Coastline Layer/BCL) showing the extent of flooding as a result of projected SLR. Coastal tiers develop inwardly from the BCL after further geoprocessing. 1* represents the zoomed area in Figure 3.
Forests 15 00092 g002
Figure 3. Methodology to develop GIS-based tool supporting species selection in coastal regions. 1* refers to the map legend in Figure 2 for symbology.
Forests 15 00092 g003
Figure 4. Species compositions of street trees existing in Sandy inundation zone in New York City. * highlights species exhibiting salt tolerance in the coastal species palette.
Forests 15 00092 g004
Table 1. Description of coastal tiers.
TierDescription
1Along the coastline, high exposure to high-speed winds, wind-driven salt spray, saltwater flooding, high likelihood of flooding in the event of sea level rise, only the most resilient tree species are suitable for planting.
2Slightly inland, moderate exposure to high-speed winds, wind-driven salt spray, saltwater flooding, likelihood of flooding during sea level rise is lower than Tier 1, tree species with moderate tolerance to coastal factors are suitable for planting.
3Farther inland, low to moderate exposure to high-speed winds, wind-driven salt spray, saltwater flooding, likelihood of flooding during sea level rise is minimal, tree species with low tolerance to coastal factors will thrive.
Table 2. Linear distance of coastal tiers from borough coastline.
Distance from Coastline in Meters
BoroughTier 1Tier 2Tier 3
Bronx0.3–58.258.3–156.7156.8–395
Manhattan0.3–97.5 97.6–197.8197.8–314.8
Brooklyn and Queens0.3–176.4176.5–412.0412.1–651
Staten Island0.3–205.1205.2–794.6794.7–1693
Disclaimer/Publisher’s Note: The statements, opinions and data contained in all publications are solely those of the individual author(s) and contributor(s) and not of MDPI and/or the editor(s). MDPI and/or the editor(s) disclaim responsibility for any injury to people or property resulting from any ideas, methods, instructions or products referred to in the content.

