Article

SegForest: A Segmentation Model for Remote Sensing Images

1
College of Information Science and Technology, Nanjing Forestry University, Nanjing 210037, China
2
College of Landscape Architecture, Nanjing Forestry University, Nanjing 210037, China
*
Author to whom correspondence should be addressed.
Forests 2023, 14(7), 1509; https://doi.org/10.3390/f14071509
Submission received: 10 June 2023 / Revised: 10 July 2023 / Accepted: 21 July 2023 / Published: 24 July 2023
(This article belongs to the Special Issue Artificial Intelligence and Machine Learning Applications in Forestry)

Abstract

:
The accurate estimation of forest area is of paramount importance for carbon sequestration projects, ecotourism and ecological safety. Forest segmentation using remote sensing images is a crucial technique for estimating forest area. However, due to the complex features, such as the size, shape and color of forest plots, traditional segmentation algorithms struggle to achieve accurate segmentation. Therefore, this study proposes a remote sensing image forest segmentation model named SegForest. To enhance the model, we introduce three new modules: multi-feature fusion (MFF), multi-scale multi-decoder (MSMD) and weight-based cross entropy loss function (WBCE) in the decoder. In addition, we propose two new forest remote sensing image segmentation binary datasets: DeepGlobe-Forest and Loveda-Forest. SegForest is compared with multiple advanced segmentation algorithms on these two datasets. On the DeepGlobe-Forest dataset, SegForest achieves a mean intersection over union (mIoU) of 83.39% and a mean accuracy (mAcc) of 91.00%. On the Loveda-Forest dataset, SegForest achieves a mIoU of 73.71% and a mAcc of 85.06%. These metrics outperform other algorithms in the comparative experiments. The experimental results of this paper demonstrate that by incorporating the three proposed modules, the SegForest model has strong performance and generalization ability in forest remote sensing image segmentation tasks.

1. Introduction

Forest ecosystems are a vital component of terrestrial ecosystems, representing the largest, most widespread, complex and resource-rich ecosystems on land. The interactions between forest ecosystems and the atmosphere, involving exchanges of energy, water, carbon dioxide and other compounds, significantly influence and regulate the climate. Forests play a pivotal role in global carbon cycling, water cycling, the mitigation of global climate change, climate regulation, soil conservation and environmental enhancement [1,2]. Moreover, apart from providing a diverse array of ecological services, the forest area exhibits a strong correlation with sustainable economic development [3] and assumes a critical role in carbon sequestration engineering, ecotourism and ecological security [4,5,6]. Therefore, effective forest resource management and monitoring is critical to ensure sustainable development. Remote sensing techniques, such as satellite and unmanned aerial vehicle (UAV) image segmentation are widely employed for forest area estimation and land survey [7,8,9]. Remote sensing image segmentation refers to the process of analyzing and processing remote sensing image data to partition different regions or objects within the image into distinct sub-regions or sub-objects based on their independent characteristics. However, traditional methods often exhibit low precision, along with high computational complexity and time consumption, making them unsuitable for complex forest remote sensing image segmentation applications. Therefore, improving the efficiency and precision of segmentation tasks in complex forest scenes remains a significant challenge.
Classic segmentation algorithms, including thresholding [10], edge-based [11], region-based [12], graph-based [13] and energy-based [14] techniques, are often limited by their computational complexity and struggle to achieve a satisfactory balance between computational efficiency and accuracy. Consequently, these algorithms may not be suitable for effectively processing forest remote sensing images. To address this problem, Wang et al. proposed a scalable graph-based clustering method called SGCNR, which implements non-negative relaxation to reduce computation complexity [15]. Although SGCNR showed some improvement over classic segmentation algorithms, its accuracy was limited and insufficient for precise forest parcel segmentation. Although other conventional machine learning techniques, such as random forest [16], support vector machine [17,18] and conditional random field [19], have enhanced accuracy and robustness, they may not fully meet the precision requirements for forest remote sensing image segmentation.
In recent years, deep convolutional neural networks (DCNNs) have demonstrated powerful feature extraction and object representation capabilities compared to traditional machine learning methods [20]. The most advanced methods based on full convolutional networks (FCNs) [21] have demonstrated great progress. For example, Wu et al. developed an FCN architecture optimized for polarimetric synthetic aperture radar (SAR) imagery to classify wetland complexes [22]. Li et al. improved the encoder architecture of U-Net++ and added a local attention mechanism for the accurate segmentation of forest remote sensing maps [23]. Nevertheless, fixed geometric configurations constrain local receptive fields and contextual information within a short range. The segmentation of forest remote sensing images remains a demanding task.
To overcome this limitation and increase the receptive field and contextual information over long-term features, self-attention mechanisms have gained widespread usage in computer vision [24,25,26]. Self-attention mechanisms have consequently been integrated with DCNNs by some researchers. Fu et al. proposed a recursive and parsimonious attention module and applied it to the ResNet model to achieve the high-precision recognition of remote sensing scenes [27]. Moreover, some researchers have implemented transformers in remote sensing image segmentation tasks [28]. Advanced self-attention mechanisms enable models to effectively capture various spatial-scale feature information in remote sensing image segmentation tasks, thereby improving segmentation accuracy, particularly when handling large area remote sensing images with complex spatial structures and features.
The encoders of different models can effectively extract the spatial feature information of various scales in remote sensing images by utilizing self-attention mechanisms. However, forest remote sensing images contain complex information of various sizes, colors and shapes, and it is crucial to make better use of multi-scale feature information obtained by encoders for improving the IoU performance of the segmentation models. To solve this issue, we propose SegForest, a high-performance segmentation network that fully utilizes the feature information of various scales. This paper introduces a multi-feature fusion (MFF) module to better fuse features of different scales. Furthermore, an innovative multilevel decoding multi-scale and multi-decoder (MSMD) module is proposed to utilize features at fine scales more extensively. To improve model training, we introduce the weight-based cross-entropy (WBCE) loss function designed specifically for the MSMD. Additionally, two datasets, DeepGlobe-Forest and Loveda-Forest, are specifically created for the forest remote sensing image segmentation tasks in this paper.

2. Datasets

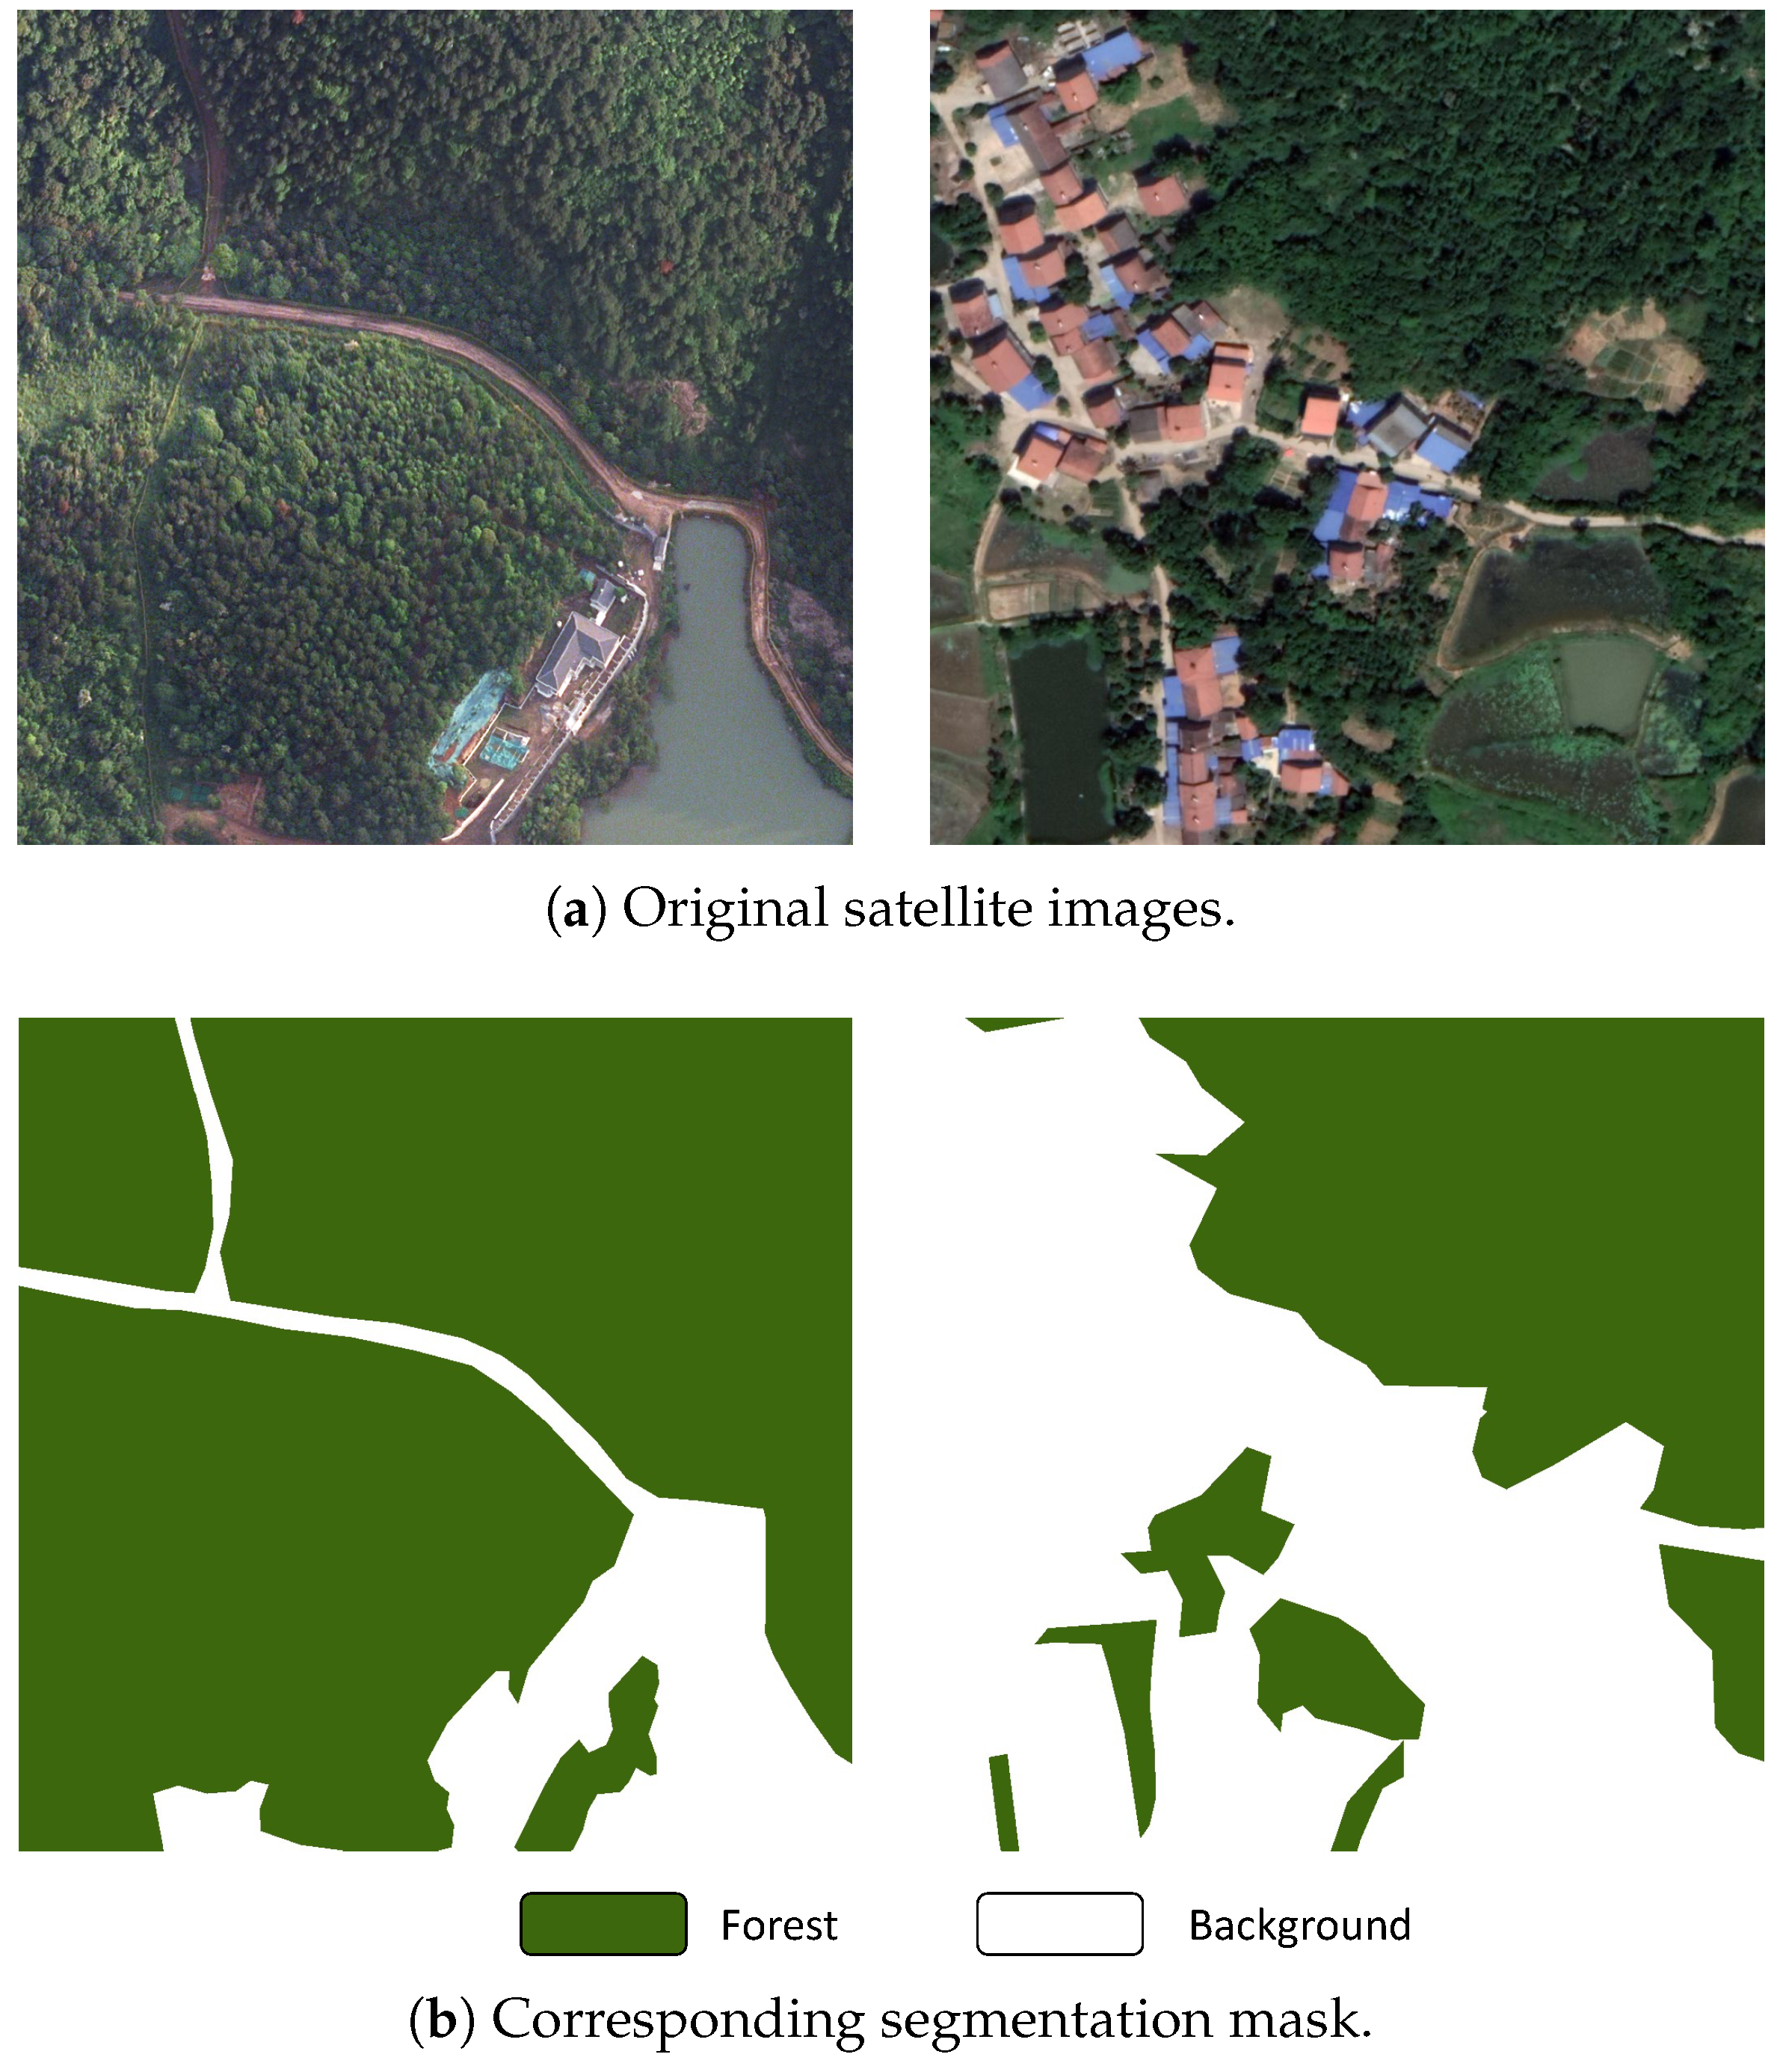
The satellite images used in DeepGlobe-Forest are extracted from the DigitalGlobe + Vivid Images dataset [29]. The images cover areas taken over Thailand, Indonesia and India. The ground resolution of the image pixels is 50 cm/pixel. These images consist of three channels (red, green and blue) each. Each of the original Geotiff images is 19,584 × 19,584 pixels. We crop 194 RGB images of resolution 2448 × 2448 from the original images. These images are labeled into two semantic categories, namely, forest and background. The class distribution can be seen in Table 1. Figure 1 shows some examples of DeepGlobe-Forest.
The Loveda-Forest dataset was created based on the Land-cOVE dataset for Domain Adaptation (Loveda) [30]. The Loveda dataset is constructed using 0.30 m images acquired in July 2016 from Nanjing, Changzhou and Wuhan, covering a total area of 536.15 km2 with red, green and blue bands at a spatial resolution of 0.30 m. Following geometric registration and preprocessing, each region is covered by non-overlapping images with a resolution of 1024 × 1024. We retain only the forest classification from the original dataset, while unifying other classifications as background classifications. To balance the number of forest and background pixels, we carefully select some images. We change the forest label from the original dataset to 1, while changing all other labels to 0 to serve as the background. Table 2 displays the class distribution, while partial examples of Loveda-Forest are shown in Figure 2.

3. Methods

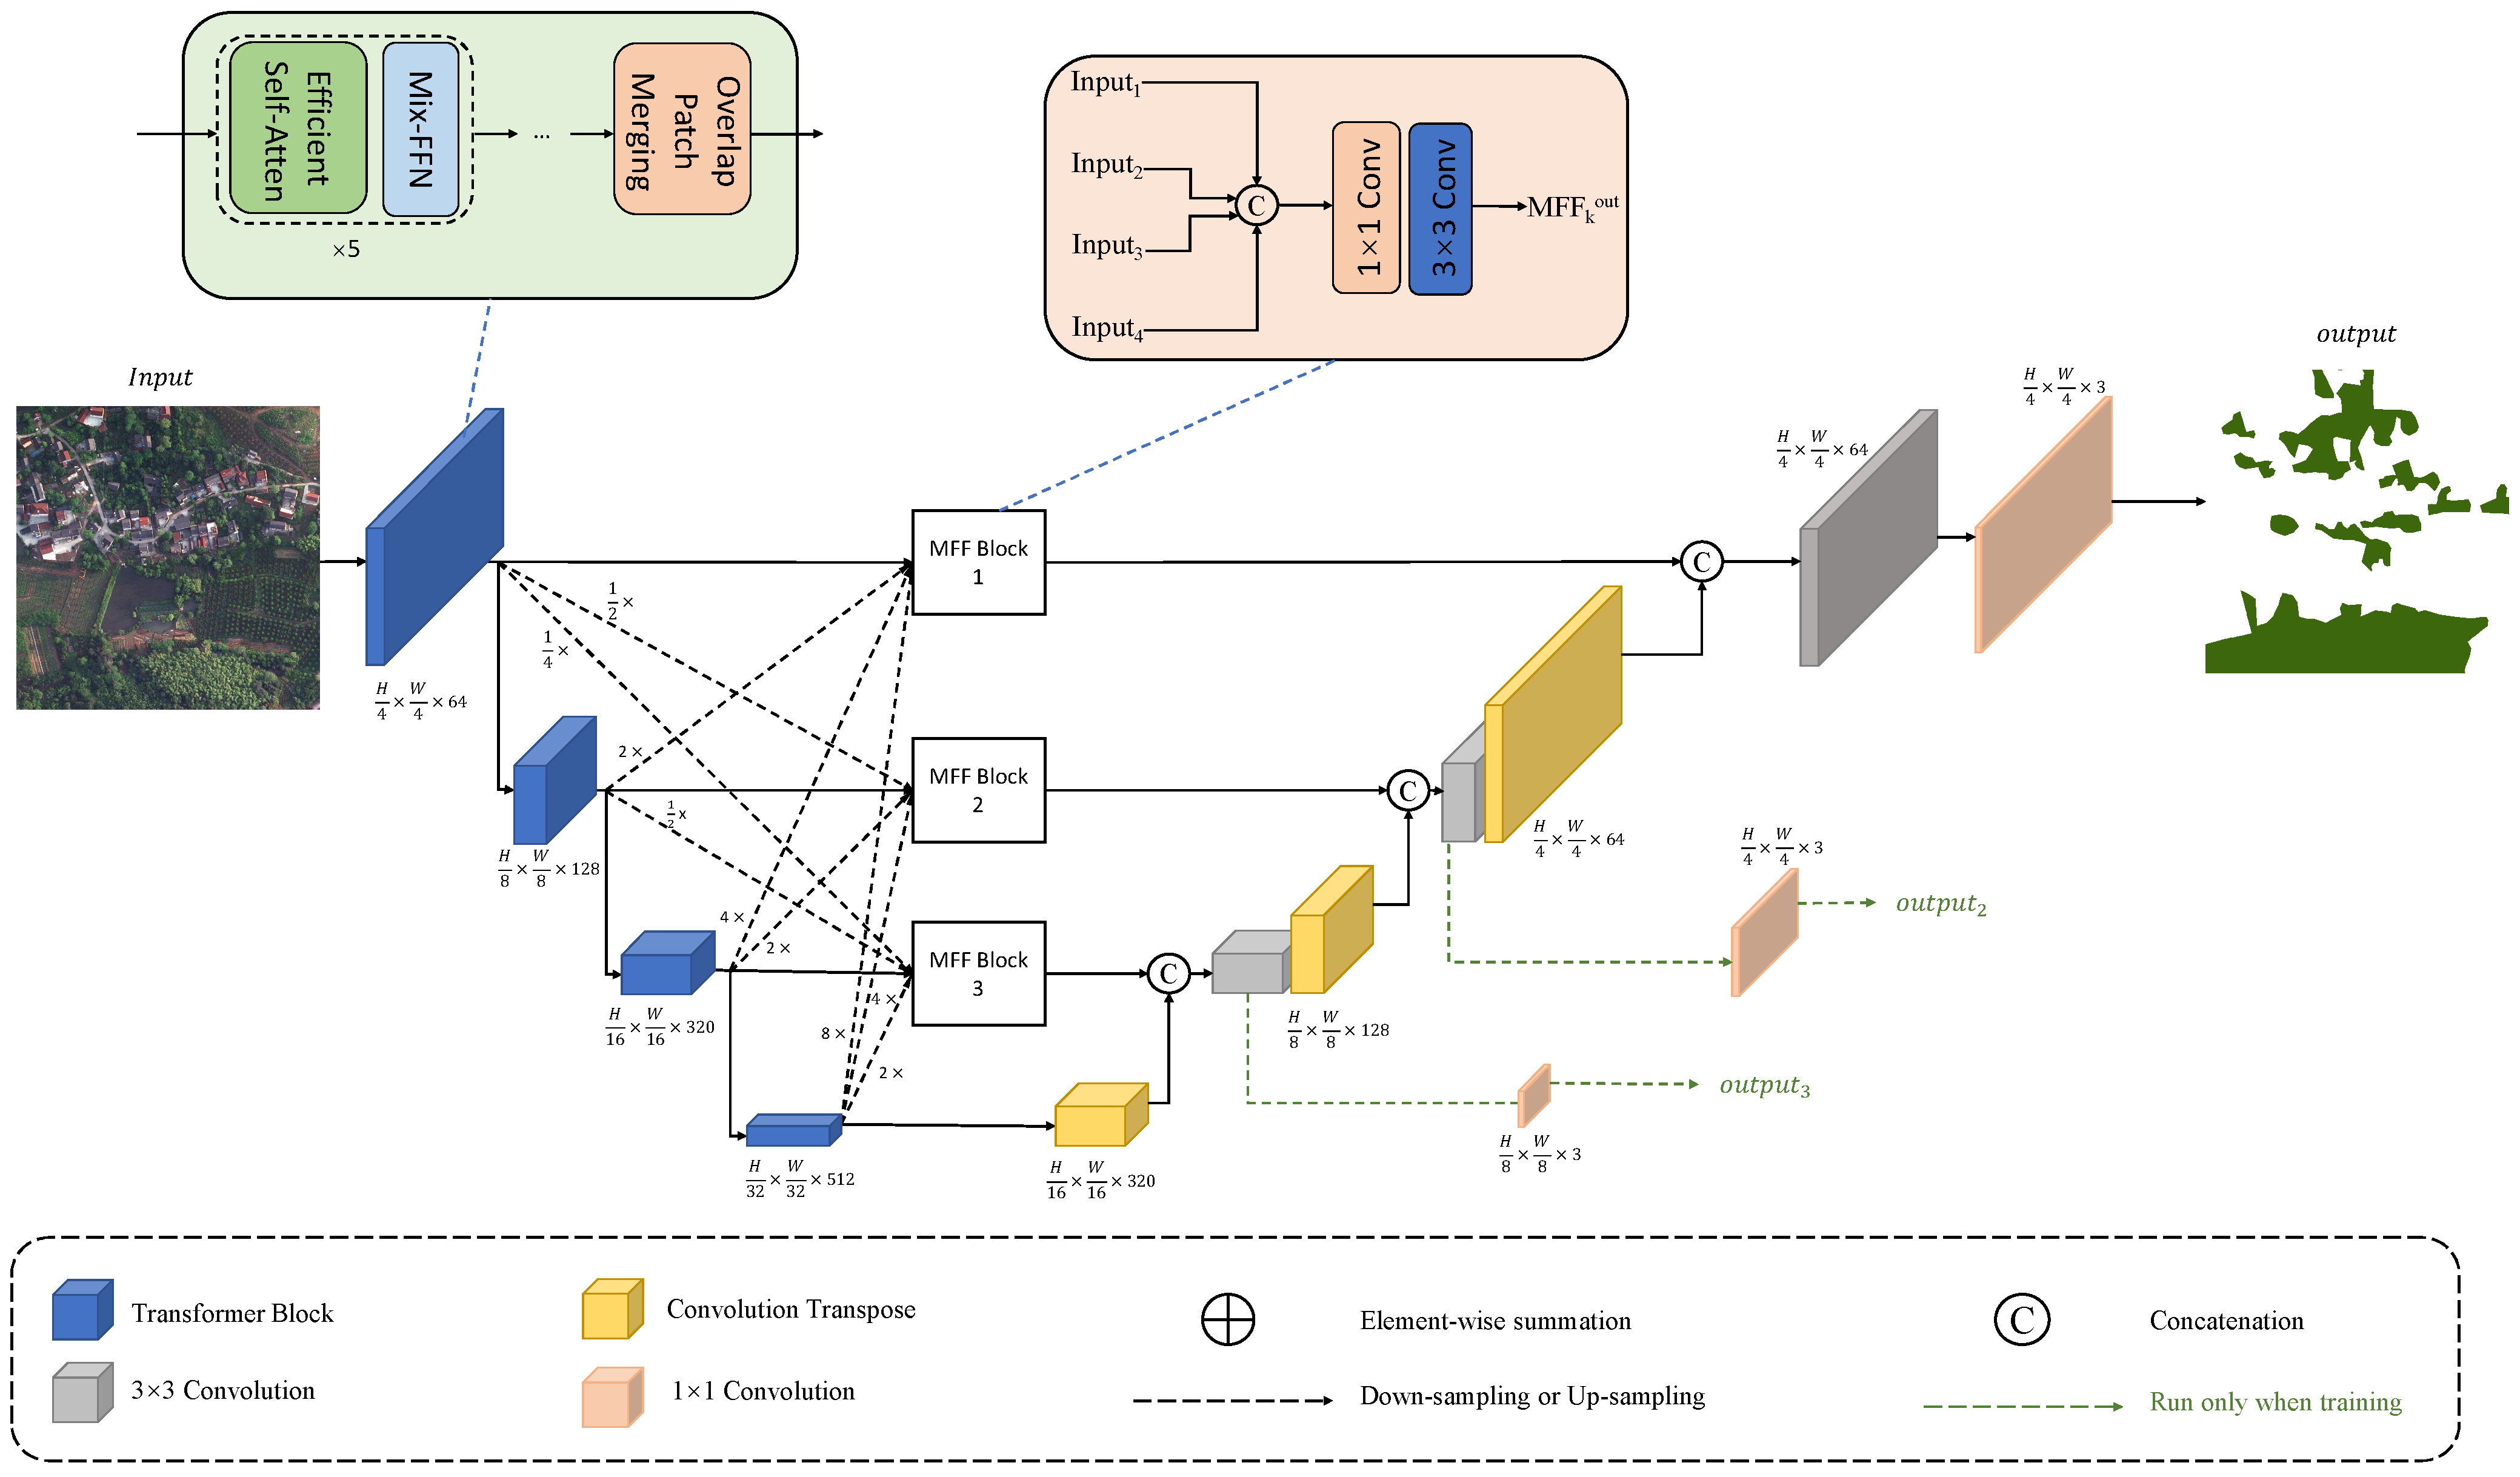
This section presents SegForest, an efficient and robust segmentation framework for remote sensing image forest segmentation. The SegForest model consists of two main components: a transformer encoder for extracting multi-scale features; and an efficient decoder for multi-scale feature fusion, resulting in the final semantic segmentation mask. The encoder design is based on SegFormer, but we redesigned the entire decoder structure due to its inefficiency in fusing multi-scale features. Figure 3 illustrates the structure of SegForest. The following section introduces the decoder that we designed.

3.1. Multi-Scale Feature Fusion

Traditionally, coarse-to-fine segmentation neural networks have typically relied solely on features from coarse-scale subnetworks within fine-scale subnetworks, restricting information flow. However, the diverse sizes of forest blocks in remote sensing images present a significant challenge, necessitating multi-scale features. If the decoder cannot effectively use the complex multi-scale features, accurate segmentation results are unachievable.
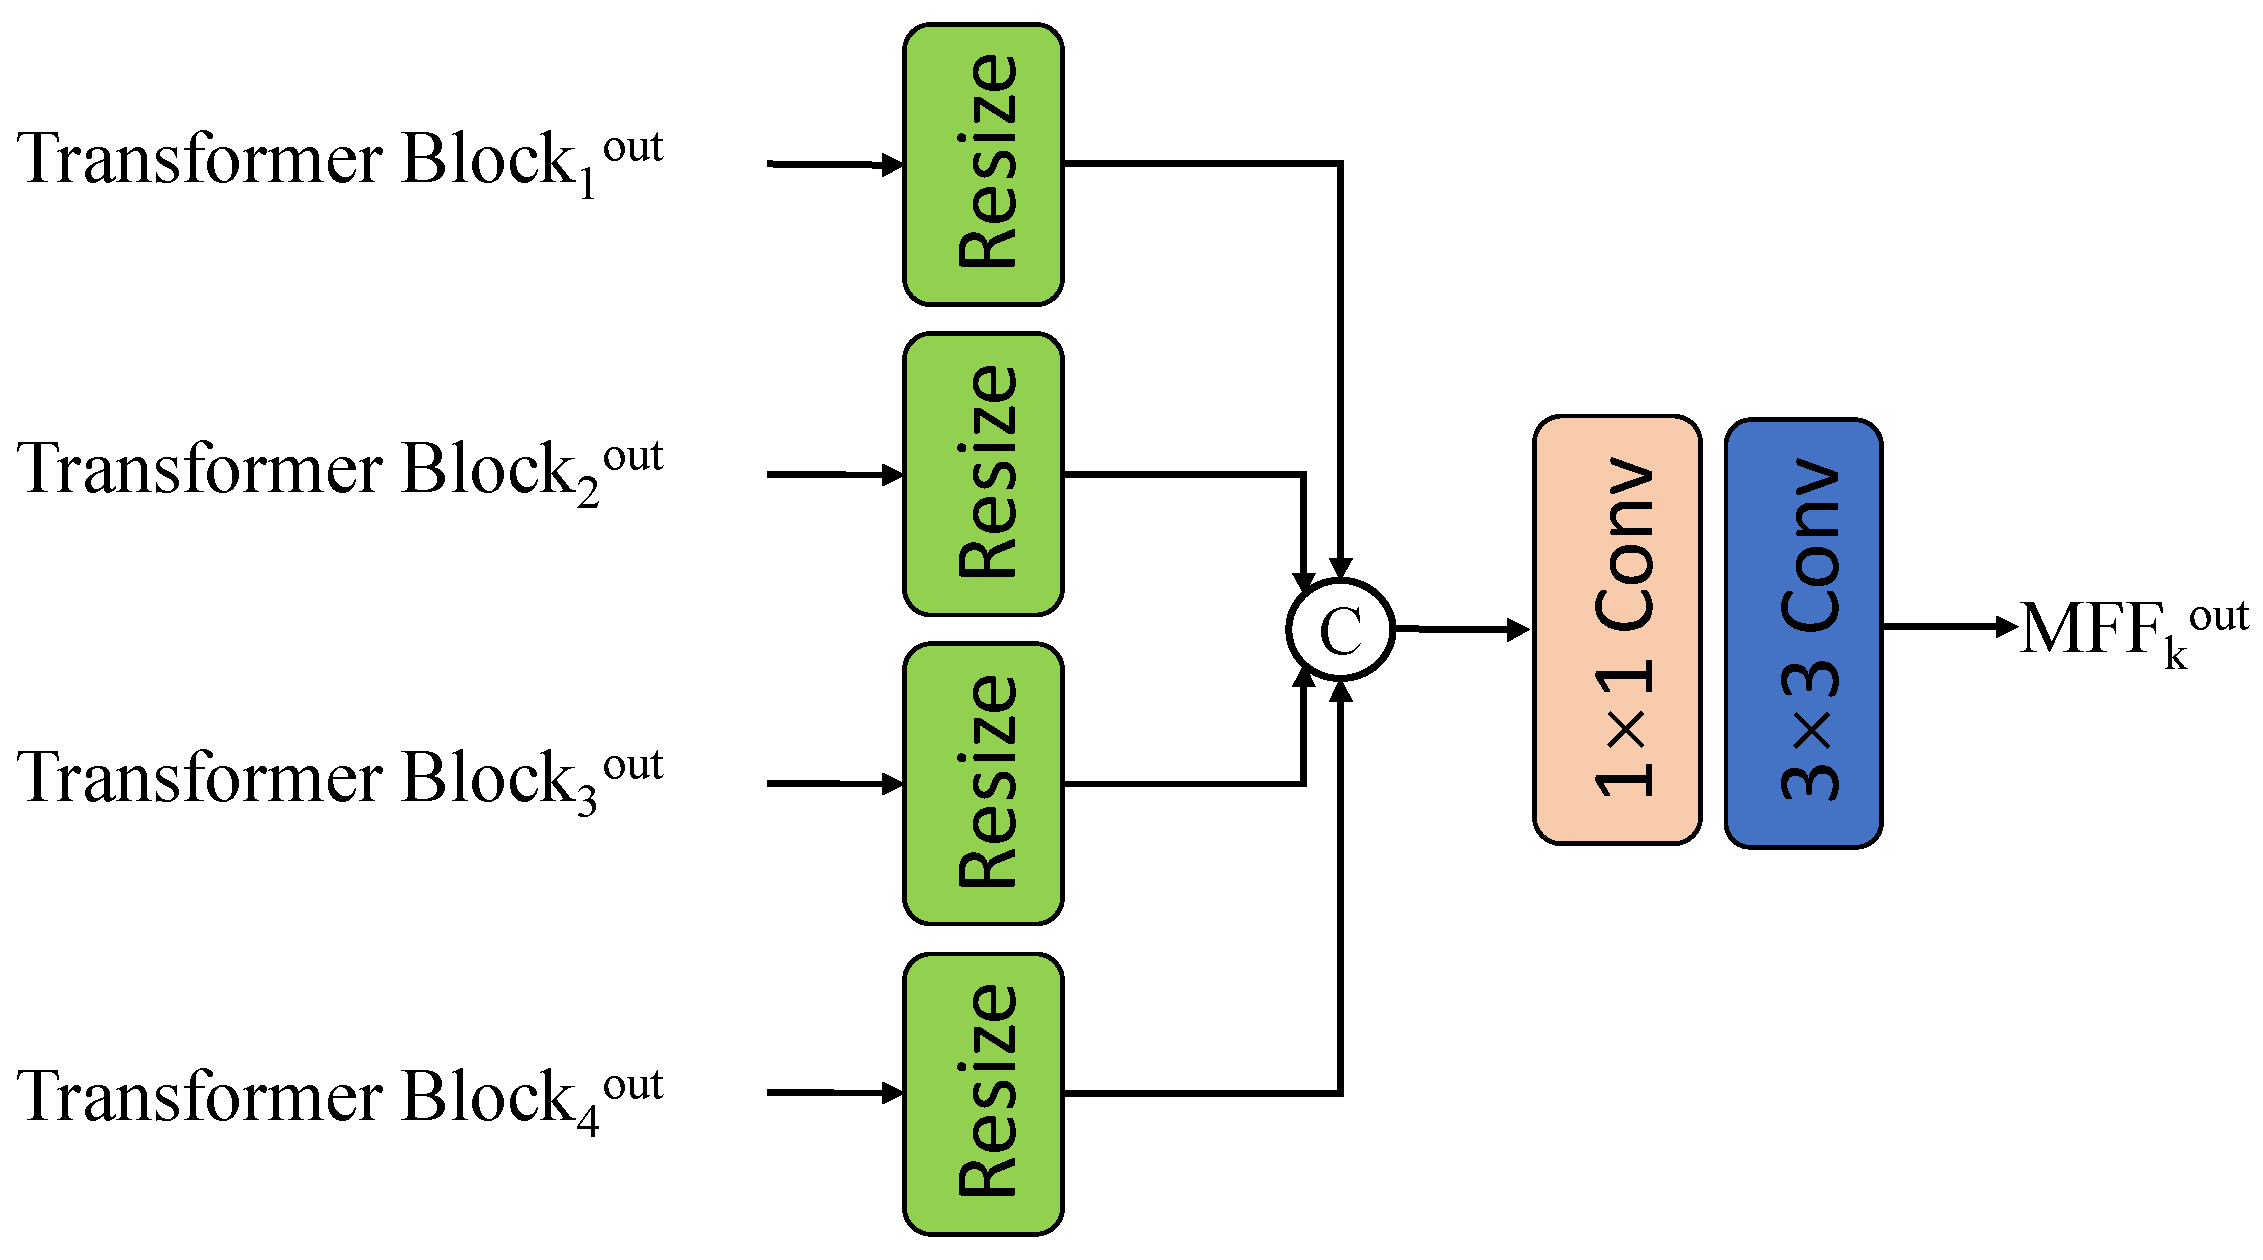
To optimize the utilization of multi-scale features, we propose the integration of a multi-scale feature fusion (MFF) module, as depicted in Figure 4. This module enables our model to produce information streams from various scales. The MFF block leverages the Transformer block’s results from each scale by employing convolutional layers to merge the multiscale features. In this model, the MFF formulation is as follows:
M F F 1 out = M F F 1 T B 1 out , T B 2 out , T B 3 out , T B 4 out ,
M F F 2 out = M F F 1 T B 1 out , T B 2 out , T B 3 out , T B 4 out ,
M F F 3 out = M F F 1 T B 1 out , T B 2 out , T B 3 out , T B 4 out ,
where T B k out is the feature map of the Kth scale output of the Transformer blocks, M F F k out denotes the MFF output of the K-th scale, ↑ represents upsampling, and ↓ represents downsampling. As a result, SegForest significantly enhances its multi-scale feature fusion ability and thus improves forest segmentation performance.

3.2. Multi-Scale Multi-Decoder

The decoder in SegFormer first performs an upsampling of the fine-scale features and then concatenates the features from all scales. Finally, the decoder outputs the resulting feature map through a convolution operation. However, this structure may result in the underutilization of the detailed features and the lack of effective fusion among different scales. To mitigate this issue, we introduce a novel multiscale multi-decoder (MSMD) structure in SegForest. The decoder architecture of the second and third levels can be observed in Figure 5a, and the first level’s decoder structure is depicted in Figure 5b.
In Figure 5, Transpose k + 1 out refers to the convolutional transpose output at a finer level of scale and MFF k out refers to the MFF output at the same level of scale. We chose convolutional transpose instead of upsampling to reduce the information loss caused by upsampling. The green dashed line in Figure 5a represents that this part only runs when training. We let the decoders of each scale output the result to calculate the loss during training so that each decoder can be trained to obtain better performance.
This multi-scale, multi-decoder structure allows the features at each scale to be fully utilized, allowing for more accurate results when dealing with forest segmentation of varying shapes and sizes.

3.3. Loss Function

The SegForest model employs a multi-scale multi-decoder structure. To optimize the model training, we suggest using a weight-based cross-entropy loss function (WBCE) in the following formula:
L o s s = 0.8 L o u t p u t + 0.13 L o u t p u t 2 + 0.07 L o u t p u t 3 ,
where L o u t p u t is the cross-entropy loss of the final output of the network, and L o u t p u t 2 and L o u t p u t 3 are the cross-entropy losses of the output of level 2 and level 3, respectively; see Figure 3. The formula for calculating the cross-entropy loss L for each component is shown below:
L = 1 b j = 1 b i = 1 n y log ( y ^ ) ( 1 y ) log ( 1 y ^ ) ,
where b is the batch size, n is the total number of samples within the training set, y is the true distribution, and y ^ is the probability distribution of the model output.
Experimental results show that the weight-based cross-entropy loss function improves model performance. Specifically, it enables the model to better handle the complex area, size and shape of the forests in remote sensing images by fusing the outputs of different scales.

4. Experiments

4.1. Experimental Settings

SegForest is implemented in PyTorch [31]. Training on the Globe-Forest and Loveda-Forest datasets is performed for 160,000 iterations with an initial learning rate of 0.00006, which is linearly decreased from the 1500th iteration onwards. A crop size of 512 × 512 is used on both datasets. We do not employ commonly used techniques, such as OHEM, auxiliary loss or class balance loss for simplicity. The experimental setup consists of a single RTX3060 graphics card, an i9-12900hs CPU and 64 GB of memory.

4.2. Evaluation Metrics

This study utilizes two evaluation metrics, intersection over union (IoU) [32] and accuracy (Acc), to assess the performance of the models. The formulas for calculating mIoU and IoU are presented below:
I o U = p i i j = 0 k p i j + j = 0 k p j i p i i ,
m I o U = 1 k + 1 i = 0 k p i i j = 0 k p i j + j = 0 k p j i p i i ,
where p i j denotes the prediction of category i into category j, and k + 1 is the total number of categories. Similarly, the accuracy and mAcc formulas are presented below:
A c c u r a c y = T P + T N T P + F P + F N + T N ,
m A c c = 1 k + 1 i = 0 k T P i + T N i T P i + F P i + F N i + T N i ,
where T P represents the true positive, T N the true negative, F P the false positive, F N the false negative, and k + 1 signifies the total number of categories.

4.3. Comparison to State of the Art Methods

We benchmark SegForest against multiple state-of-the-art models, including advanced fully convolutional segmentation models and transformer models, on two datasets: DeepGlobe-Forest and Loveda-Forest. The comparison comprises deeplabv3+ [33], pidnet [34], pspnet [35], knet [36], segformer [24], mask2former [25] and segnext [26,37].
Table 3 presents a summary of the results on DeepGlobe-Forest, which includes the mIoU and accuracy results. The highest evaluation index score is highlighted in bold. Our method outperforms the Segformer approach that uses the same encoder. Specifically, our approach improves mIoU by 2.54% and mAcc by 1.59%. The results indicate that Segformer’s simple and lightweight all-MLP (multi-layer perceptron) decoder cannot achieve the full potential of the encoder due to the complex size, edge and shape features of forest plots in remote sensing images. By incorporating our proposed multi-scale feature fusion module and multi-scale multi-decoder module to SegForest, our network demonstrates superior performance. In comparison to other benchmarks, SegForest exhibits the highest IoU in both the forest and background, which is crucial for the remote sensing image forest area and forest biomass estimation tasks that require forest area information. Pidnet records the highest accuracy in the forest category, which is only 0.01% higher than SegForest. Nevertheless, SegForest attains the highest score in the background category, as well as the mean accuracy. Figure 6 showcases some prediction result examples of each method on the DeepGlobe-Forest dataset. As illustrated in Figure 6, our method’s segmentation results are significantly closer to the ground truth on the forest edges, which is particularly important for forest expansion monitoring. The experiment demonstrates SegForest’s superior performance in forest segmentation from remote sensing images.
Table 4 presents the results obtained on Loveda-Forest, reporting values for mIoU and accuracy. The highest evaluation index score is highlighted in bold. SegForest outperforms Segformer in all scores, with improved mIoU and mAcc by 3.75% and 2.20%, respectively. Moreover, when compared with state-of-the-art methods, SegForest achieves the highest score for each IoU score, demonstrating its effectiveness. Knet exhibits the highest accuracy in forest classification, with a 1.13% advantage over SegForest, while Pspnet displays the highest accuracy in background classification, with a 2.04% benefit over SegForest. Nonetheless, SegForest achieves the highest mean accuracy, representing its balanced and comprehensive performance. Figure 7 presents the predictions obtained by the different methods on Loveda-Forest.

4.4. Ablation Studies

We conducted a series of ablation studies on the DeepGlobe-Forest dataset to assess the efficacy of the individual modules. The results of these studies are presented in Table 5, where MFF denotes the multi-feature fusion module, MSMD represents the multi-scale multi-decoder module, and WBCE denotes the weight-based cross-entropy loss function.
The addition of only the MFF module increases the model’s mIoU by 1.80% and mean accuracy by 0.57%. The MFF module improves performance by allowing the decoder to effectively leverage features across scales. The addition of only the MSMD module results in more modest improvements, increasing mIoU and mean accuracy by 0.24% and 0.04%, respectively. By adding the WBCE loss function, the performance is further improved, increasing the mIoU and mean accuracy by 1.02% and 0.59%, respectively. The MSMD and WBCE modules enable hierarchical decoding at different scales, thereby resulting in a significant performance boost. The best performance is achieved by adding all three modules simultaneously, improving the mIoU and mean accuracy by 2.54% and 1.59%, respectively, and enabling the model to better handle complex forest conditions in remote sensing images.

5. Discussion

Experimental comparisons show that SegForest outperforms other models for forest segmentation tasks, especially achieving the best mIoU and mAcc on the DeepGlobe-Forest and Loveda-Forest datasets. However, it is observed that SegForest does not always achieve the optimal accuracy. This issue may be due to the transformer encoder, which is not completely applicable to segmentation tasks. Therefore, there are plans to design a transformer encoder that is more suitable for segmentation tasks. Additionally, ablation studies were conducted on the DeepGlobe-Forest dataset to validate three proposed modules (MFF, MSMD and WBCE) and their performance differences. Specifically, the MFF module enables the model to obtain information flow from different scales and better fuse features from each scale. The MSMD module allows step-by-step decoding at different scales, enabling the model to fully utilize fine-scale features. Moreover, the WBCE module significantly improves post-training performance without increasing the model parameters. The integration of these three modules fortifies SegForest’s handling of intricate size, shape and color features of forest areas in remote sensing imagery. Further improvement measures will be explored to enhance SegForest’s performance, such as introducing more feature fusion strategies and more effective complexity control methods.
One of the challenges of this study is the dataset. Currently, we use the DeepGlobe-Forest and Loveda-Forest datasets, which have low spatial resolution and lack precise annotations. Therefore, a key focus of our future work is to develop a new, more detailed remote sensing image dataset specific to forest segmentation. We plan to use drones equipped with multispectral lenses to capture higher spatial resolution images and multispectral data, which will then be annotated more precisely. Additionally, we will design a network that incorporates multispectral features to achieve even higher accuracy in remote sensing image segmentation [38].

6. Conclusions

This study proposes SegForest, a powerful model for forest segmentation tasks in remote sensing images. We proposed three modules to enhance the utilization of different scales of feature information in the model, namely the multi-feature fusion (MFF) module, multi-scale multi-decoder (MSMD) module and weight-based cross-entropy (WBCE) loss function. Additionally, we introduced two forest remote sensing image segmentation datasets named DeepGlobe-Forest and Loveda-Forest. Both datasets are binary classification datasets, including forest and background pixels in equal quantity. We evaluated SegForest with numerous state-of-the-art methods on these two datasets, and it achieved the highest mIoU of 83.39% and 73.71% on DeepGlobe-Forest and Loveda-Forest, respectively, demonstrating its excellent performance. We also conducted a series of ablation studies to verify the performance of the three proposed modules.

Author Contributions

Conceptualization, H.W. and C.H.; Data curation, R.Z.; Formal analysis, H.W.; Funding acquisition, C.H.; Investigation, H.W. and C.H.; Methodology, H.W. and C.H.; Project administration, H.W.; Resources, H.W.; Software, H.W. and W.Q.; Supervision, C.H.; Validation, H.W., R.Z. and W.Q.; Visualization, H.W.; Writing—review and editing, H.W., C.H. and R.Z. All authors will be informed about each step of manuscript processing including submission, revision, revision reminder, etc. via emails from our system or assigned Assistant Editor. All authors have read and agreed to the published version of the manuscript.

Funding

This research was funded by Jiangsu Province Science and Technology Project-Basic Research Program (Natural Science Foundation)-Special Fund for Carbon Peak and Carbon Neutrality Science and Technology Innovation (No. BK20220016).

Data Availability Statement

The data presented in this study are available on request from the corresponding author.

Conflicts of Interest

The authors declare no conflict of interest. The funders had no role in the design of the study; in the collection, analyses, or interpretation of data; in the writing of the manuscript; or in the decision to publish the results.

References

  1. Pandey, R.; Bargali, S.S.; Bargali, K.; Karki, H.; Kumar, M.; Sahoo, U.K. Fine root dynamics and associated nutrient flux in Sal dominated forest ecosystems of Central Himalaya, India. Front. For. Glob. Chang. 2023, 5, 1064502. [Google Scholar] [CrossRef]
  2. Di Sacco, A.; Hardwick, K.A.; Blakesley, D.; Brancalion, P.H.S.; Breman, E.; Cecilio Rebola, L.; Chomba, S.; Dixon, K.; Elliott, S.; Ruyonga, G.; et al. Ten golden rules for reforestation to optimize carbon sequestration, biodiversity recovery and livelihood benefits. Glob. Chang. Biol. 2021, 27, 1328–1348. [Google Scholar] [CrossRef]
  3. Kilpeläinen, J.; Heikkinen, A.; Heinonen, K.; Hämäläinen, A. Towards sustainability? Forest-based circular bioeconomy business models in Finnish SMEs. Sustainability 2021, 13, 9419. [Google Scholar]
  4. Lewis, S.L.; López-González, G.; Sonké, B.; Affum-Baffoe, K.; Baker, T.R.; Ojo, L.O.; Phillips, O.L.; Reitsma, J.M.; White, L.J.T.; Comiskey, J.A.; et al. Asynchronous carbon sink saturation in African and Amazonian tropical forests. Nature 2019, 579, 80–87. [Google Scholar]
  5. Lin, J.; Chi, J.; Li, B.; Ju, W.; Xu, X.; Jin, W.; Lu, X.; Pan, D.; Ciais, P.; Yang, Y. Large Chinese land carbon sink estimated from atmospheric carbon dioxide data. Nature 2018, 560, 634–638. [Google Scholar]
  6. Yamamoto, Y.; Matsumoto, K. The effect of forest certification on conservation and sustainable forest management. J. Clean. Prod. 2022, 363, 132374. [Google Scholar] [CrossRef]
  7. Souza Jr, C.M.; Shimbo, J.Z.; Rosa, M.R.; Parente, L.L.; Alencar, A.A.; Rudorff, B.F.T.; Hasenack, H.; Matsumoto, M.; Ferreira, L.G.; Souza-Filho, P.W.M.; et al. Reconstructing Three Decades of Land Use and Land Cover Changes in Brazilian Biomes with Landsat Archive and Earth Engine. Remote Sens. 2020, 12, 2735. [Google Scholar] [CrossRef]
  8. Zhang, B.; Wang, X.; Yuan, X.; An, F.; Zhang, H.; Zhou, L.; Shi, J.; Yun, T. Simulating Wind Disturbances over Rubber Trees with Phenotypic Trait Analysis Using Terrestrial Laser Scanning. Forests 2022, 13, 1298. [Google Scholar] [CrossRef]
  9. Xue, X.; Jin, S.; An, F.; Zhang, H.; Fan, J.; Eichhorn, M.P.; Jin, C.; Chen, B.; Jiang, L.; Yun, T. Shortwave Radiation Calculation for Forest Plots Using Airborne LiDAR Data and Computer Graphics. Plant Phenomics 2022, 2022, 9856739. [Google Scholar] [CrossRef] [PubMed]
  10. Otsu, N. A threshold selection method from gray-level histograms. IEEE Trans. Syst. Man Cybern. 1979, 9, 62–66. [Google Scholar] [CrossRef] [Green Version]
  11. Canny, J.F. A computational approach to edge detection. IEEE Trans. Pattern Anal. Mach. Intell. 1986, PAMI-8, 679–698. [Google Scholar] [CrossRef]
  12. Malik, J.; Perona, P. Scale-space and edge detection using anisotropic diffusion. In Proceedings of the IEEE Computer Society Workshop on Computer Vision, Osaka, Japan, 4–7 December 1990; pp. 16–22. [Google Scholar]
  13. Felzenszwalb, P.F.; Huttenlocher, D.P. L1 graph-based active contours. In Proceedings of the International Conference on Computer Vision, Washington, DC, USA, 27 June–2 July 2004; Volume 1, pp. 64–71. [Google Scholar]
  14. Boykov, Y.; Kolmogorov, V. An experimental comparison of min-cut/max-flow algorithms for energy minimization in vision. IEEE Trans. Pattern Anal. Mach. Intell. 2001, 26, 1124–1137. [Google Scholar] [CrossRef] [Green Version]
  15. Wang, R.; Nie, F.; Wang, Z.; He, F.; Li, X. Scalable Graph-Based Clustering With Nonnegative Relaxation for Large Hyperspectral Image. IEEE Trans. Geosci. Remote Sens. 2019, 57, 7352–7364. [Google Scholar] [CrossRef]
  16. Belgiu, M.; Dragut, L. Random forest in remote sensing: A review of applications and future directions. Isprs J. Photogramm. Remote Sens. 2016, 114, 24–31. [Google Scholar] [CrossRef]
  17. Mountrakis, G.; Im, J.; Ogole, C. Support vector machines in remote sensing: A review. Isprs J. Photogramm. Remote Sens. 2011, 66, 247–259. [Google Scholar] [CrossRef]
  18. Sheykhmousa, M.; Mahdianpari, M.; Ghanbari, H.; Mohammadimanesh, F.; Ghamisi, P.; Homayouni, S. Support Vector Machine Versus Random Forest for Remote Sensing Image Classification: A Meta-Analysis and Systematic Review. IEEE J. Sel. Top. Appl. Earth Obs. Remote Sens. 2020, 13, 6308–6325. [Google Scholar] [CrossRef]
  19. Zhong, P.; Wang, R. A multiple conditional random fields ensemble model for urban area detection in remote sensing optical Images. IEEE Trans. Geosci. Remote Sens. 2007, 45, 3978–3988. [Google Scholar] [CrossRef]
  20. Kattenborn, T.; Leitloff, J.; Schiefer, F.; Hinz, S. Review on Convolutional Neural Networks (CNN) in vegetation remote sensing. Isprs J. Photogramm. Remote Sens. 2021, 173, 24–49. [Google Scholar] [CrossRef]
  21. Long, J.; Shelhamer, E.; Darrell, T. Fully convolutional networks for semantic segmentation. In Proceedings of the IEEE Conference on Computer Vision and Pattern Recognition, Boston, MA, USA, 7–12 June 2015; pp. 3431–3440. [Google Scholar]
  22. Wu, J.; Liu, S.; Wu, H.; Yang, W.; Hu, J.; Wang, J. A new fully convolutional neural network for semantic segmentation of polarimetric SAR imagery in complex land cover ecosystem. Remote Sens. 2019, 11, 1748. [Google Scholar]
  23. Li, Y.; Yu, X.; Jiang, Z.; Wu, L.; Lu, S. Application of a Novel Multiscale Global Graph Convolutional Neural Network to Improve the Accuracy of Forest Type Classification Using Aerial Photographs. IEEE Trans. Geosci. Remote Sens. 2021, 59, 6874–6888. [Google Scholar]
  24. Deng, C.; Xiong, Y.; Yu, T.; Liu, R.; Li, X.; Xu, G.; Wang, J.; Zou, J. SegFormer: Simple and Efficient Design for Semantic Segmentation with Transformers. In Proceedings of the IEEE/CVF International Conference on Computer Vision (ICCV), Montreal, BC, Canada, 11–17 October 2021; pp. 13103–13112. [Google Scholar]
  25. Liu, Z.; Shi, Q.; Chen, J.; Zhu, Q.; Zhang, J. Mask2Former: From Mask Encoding to Spatial Broadcasting Transformer for Object Detection. In Proceedings of the IEEE/CVF Conference on Computer Vision and Pattern Recognition (CVPR), Nashville, TN, USA, 19–25 June 2021; pp. 143–152. [Google Scholar]
  26. Guo, M.H.; Lu, C.Z.; Hou, Q.; Liu, Z.; Cheng, M.M.; Hu, S.M. SegNeXt: Rethinking Convolutional Attention Design for Semantic Segmentation. arXiv 2022, arXiv:2209.08575. [Google Scholar]
  27. Fu, L.; Zhang, D.; Ye, Q. Recurrent Thrifty Attention Network for Remote Sensing Scene Recognition. IEEE Trans. Geosci. Remote Sens. 2021, 59, 8257–8268. [Google Scholar] [CrossRef]
  28. Aleissaee, A.A.; Kumar, A.; Anwer, R.M.; Khan, S.; Cholakkal, H.; Xia, G.S.; Khan, F.S. Transformers in Remote Sensing: A Survey. Remote Sens. 2023, 15, 1860. [Google Scholar] [CrossRef]
  29. Demir, I.K.; Koperski, K.; Lindenbaum, D.; Pang, G.; Huang, B.; Basu, S.; Hughes, F.; Tuia, D.; Raska, R.; Kressner, A.A.; et al. DeepGlobe 2018: A Challenge to Parse the Earth through Satellite Images. In Proceedings of the IEEE Conference on Computer Vision and Pattern Recognition Workshops, Salt Lake City, UT, USA, 18–22 June 2018; pp. 172–182. [Google Scholar]
  30. Sankaranarayanan, S.S.; Balaji, Y.; Jain, H.; Chellappa, R.; Castillo-Rubio, F.J.; Petersson, L.; Carneiro, G. LoveDA: A Remote Sensing Land-Cover Dataset for Domain Adaptive Semantic Segmentation. In Proceedings of the IEEE/CVF Conference on Computer Vision and Pattern Recognition Workshops, Seattle, WA, USA, 14–19 June 2020; pp. 703–704. [Google Scholar]
  31. Paszke, A.; Gross, S.; Chintala, S.; Chanan, G.; Yang, E.; DeVito, Z.; Lin, Z.; Desmaison, A.; Antiga, L.; Lerer, A. Automatic Differentiation in PyTorch. 2017. Available online: http://xxx.lanl.gov/abs/arXiv:1502.03167v3 (accessed on 28 October 2017).
  32. Badrinarayanan, V.; Kendall, A.; Cipolla, R. SegNet: A Deep Convolutional Encoder-Decoder Architecture for Image Segmentation. In Proceedings of the European Conference on Computer Vision, Honolulu, HI, USA, 21–26 July 2017; pp. 23–37. [Google Scholar]
  33. Chen, L.C.; Zhu, Y.; Papandreou, G.; Schroff, F.; Adam, H. Encoder-decoder with atrous separable convolution for semantic image segmentation. In Proceedings of the European Conference on Computer Vision (ECCV), Munich, Germany, 8–14 September 2018; pp. 801–818. [Google Scholar]
  34. Wei, X.Y.; Tang, Y.R.; Lai, Y.K.; Liu, X. Learning Pixel-wise Non-linear Regression for Single Image Super-resolution Using Convolutional Neural Network. IEEE Trans. Image Process. 2018, 27, 381–392. [Google Scholar]
  35. Zhao, H.; Shi, J.; Qi, X.; Wang, X.; Jia, J. Pyramid scene parsing network. In Proceedings of the IEEE Conference on Computer Vision and Pattern Recognition (CVPR), Honolulu, HI, USA, 21–26 July 2017; pp. 2881–2890. [Google Scholar]
  36. Zhang, W.; Pang, J.; Chen, K.; Loy, C.C. K-Net: Towards Unified Image Segmentation. In Proceedings of the Advances in Neural Information Processing Systems 34 (NEURIPS 2021), Online, 6–14 December 2021; Volume 34. [Google Scholar]
  37. Guo, M.H.; Lu, C.Z.; Liu, Z.N.; Cheng, M.M.; Hu, S.M. Visual Attention Network. arXiv 2022, arXiv:2202.09741. [Google Scholar]
  38. Vali, A.; Comai, S.; Matteucci, M. Deep Learning for Land Use and Land Cover Classification Based on Hyperspectral and Multispectral Earth Observation Data: A Review. Remote Sens. 2020, 12, 2495. [Google Scholar] [CrossRef]
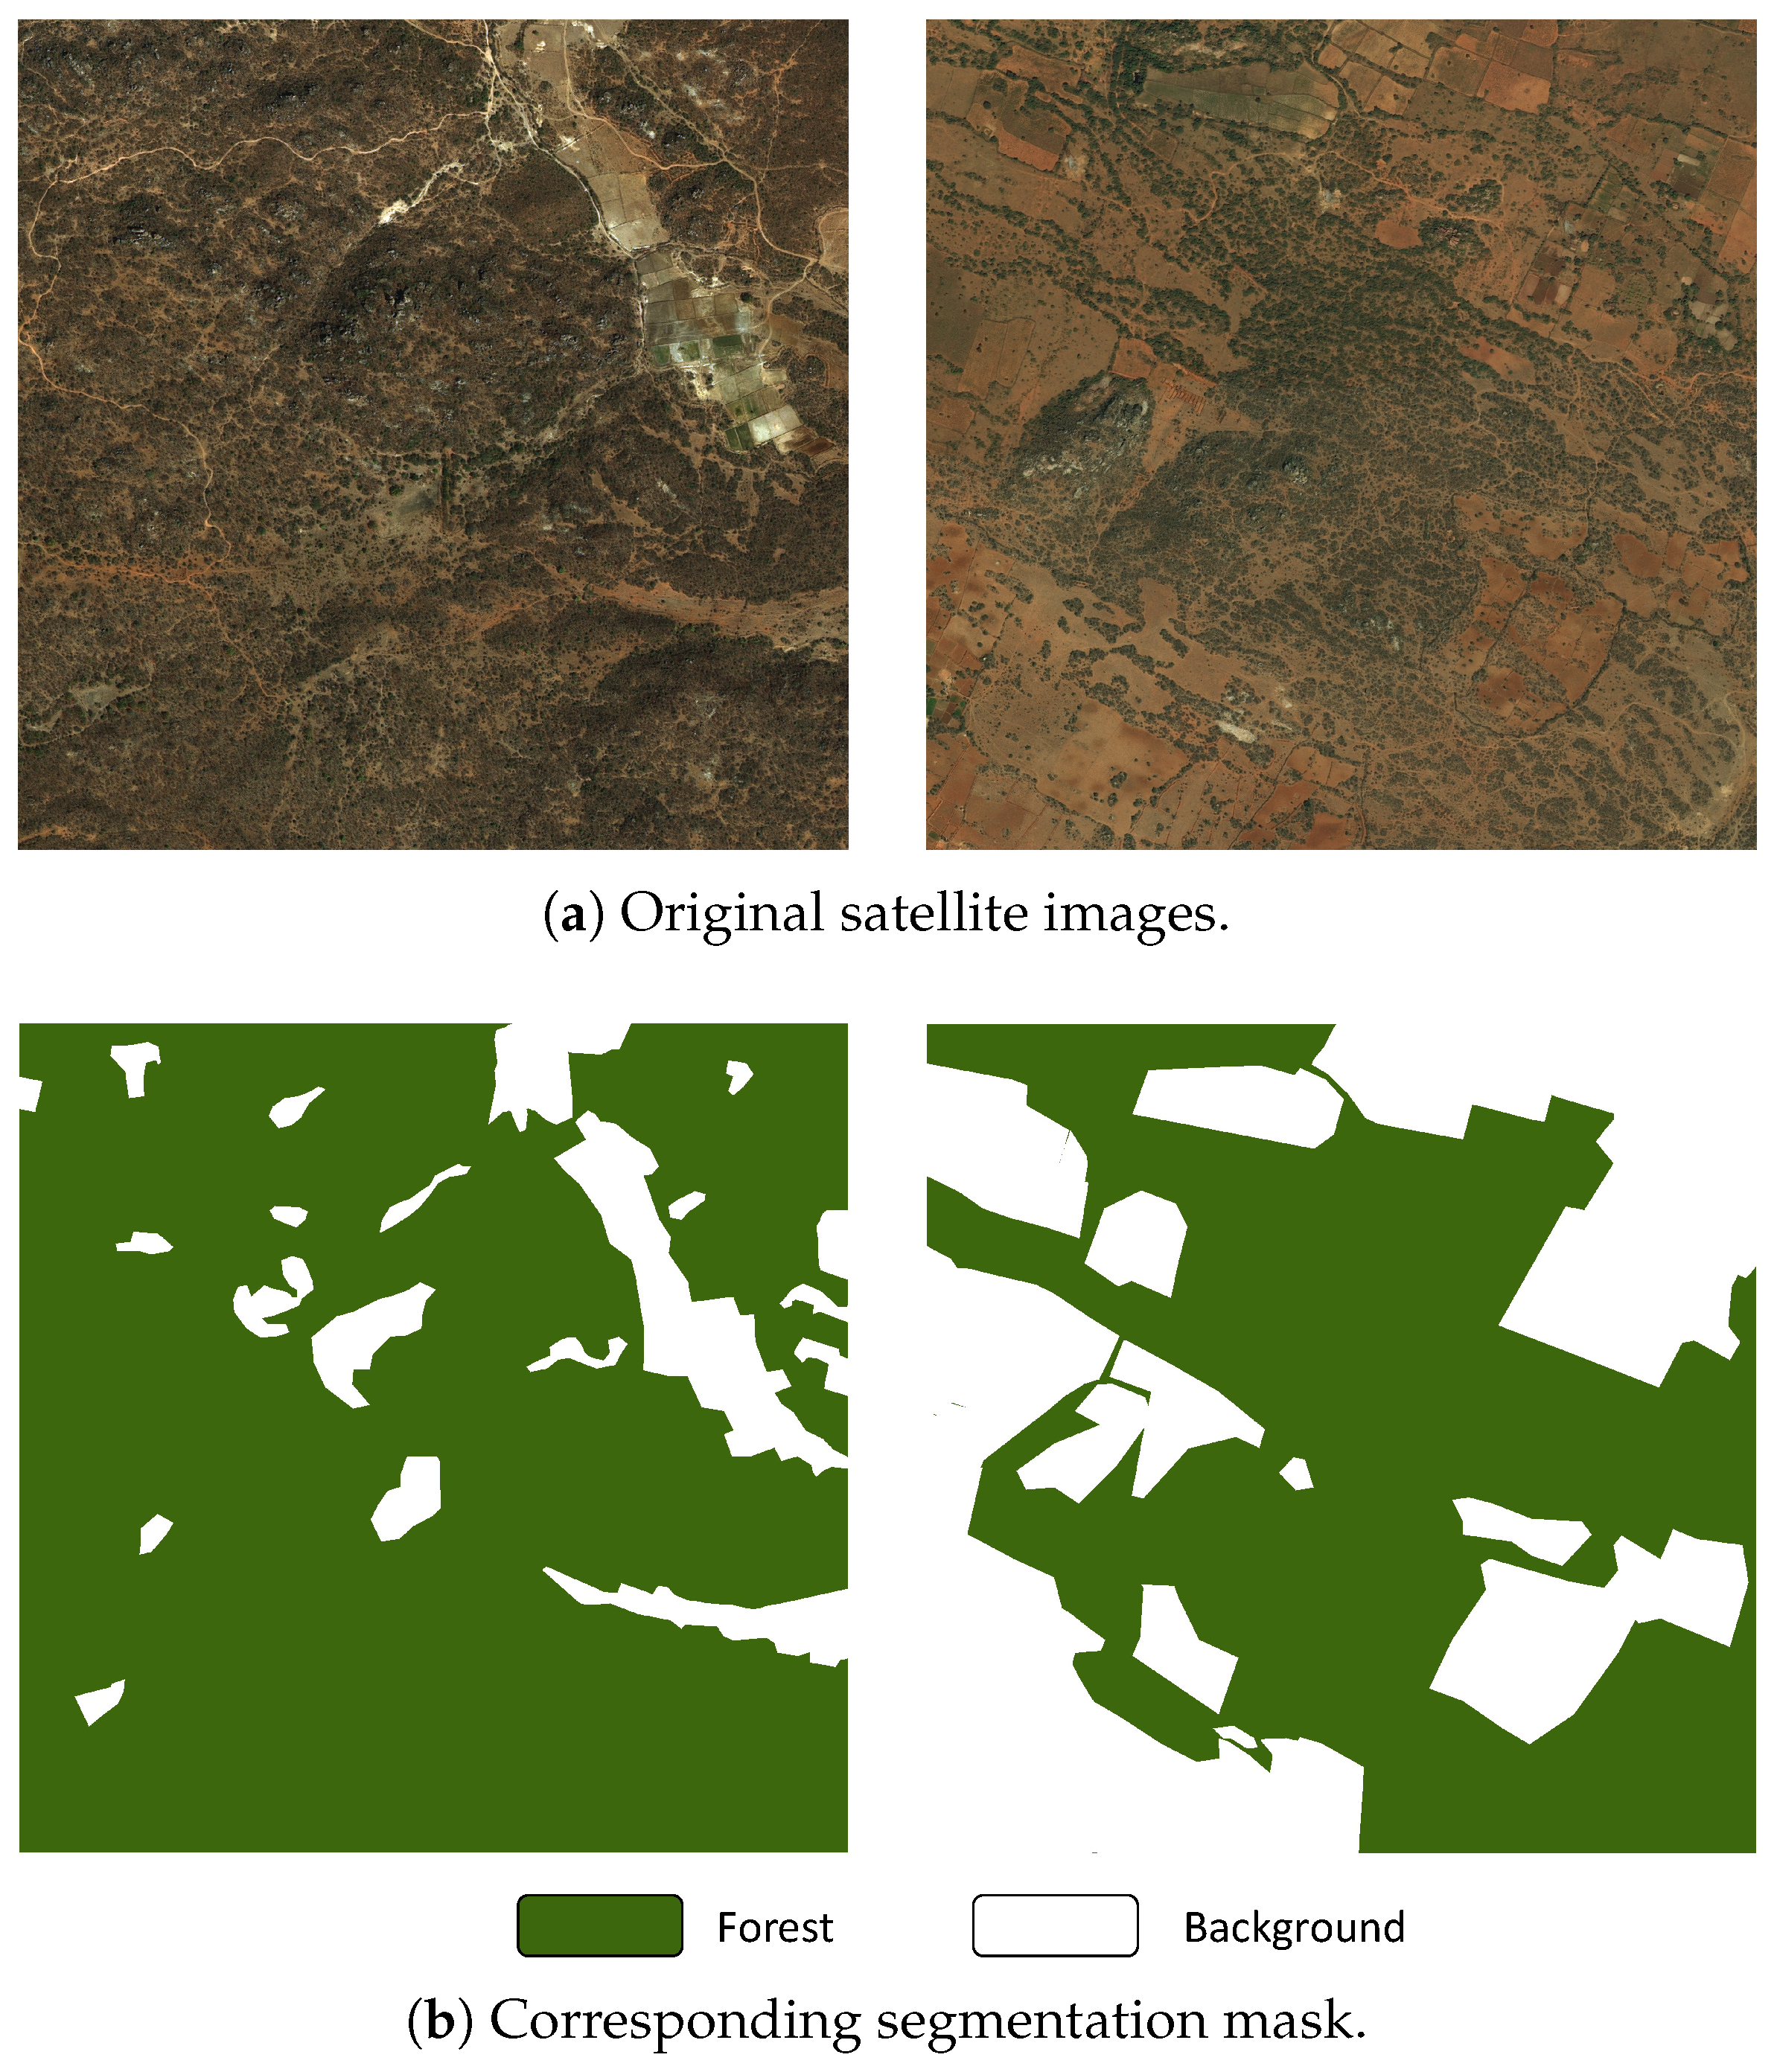
Figure 1. Some examples of DeepGlobe-Forest dataset.
Forests 14 01509 g001
Figure 2. Some examples of Loveda-Forest dataset.
Forests 14 01509 g002
Figure 3. The structure of SegForest.
Forests 14 01509 g003
Figure 4. The structure of MFF module.
Forests 14 01509 g004
Figure 5. The structure of MSMD module.
Forests 14 01509 g005
Figure 6. Example results of each method’s prediction on the DeepGlobe-Forest dataset.
Forests 14 01509 g006
Figure 7. Example results of each method’s prediction on the Loveda-Forest dataset.
Forests 14 01509 g007
Table 1. Class distributions in the DeepGlobe-Forest dataset.
ClassLabelPixel CountProportion
Background0537.13 M46.20%
Forest1625.46 M53.80%
Table 2. Class distributions in the Loveda-Forest dataset.
ClassLabelPixel CountProportion
Background0332.37 M48.32%
Forest1355.49 M51.68%
Table 3. Performance of models on DeepGlobe-Forest dataset.
IoUmIoUAccuracymAcc
ForestBackgroundForestBackground
Deeplabv3+77.6979.6778.6887.4288.7088.06
Pidnet-s78.7880.9679.8787.3590.2188.78
Pspnet79.8680.7980.3391.1787.2289.20
Knet-s3-r5080.2381.2280.7391.2487.6389.44
Segformer79.9881.7180.8589.0289.8089.41
Mask2former80.5281.6181.0691.0988.1789.63
Segnext80.6081.8481.2290.6988.7189.70
SegForest82.8083.9983.3991.7990.2091.00
Bold font means the best performance.
Table 4. Performance of models on Loveda-Forest dataset.
IoUmIoUAccuracymAcc
ForestBackgroundForestBackground
Deeplabv3+64.2275.8870.0580.3784.8582.61
Pidnet-s64.3674.0869.2284.8280.8582.84
Pspnet62.6877.0869.8873.9389.1881.56
Knet-s3-r5065.9976.1671.0884.1183.4583.78
Segformer64.6376.3170.4780.3685.3582.86
Mask2former65.6776.8371.2581.6985.3083.50
Segnext64.4276.9670.6978.3187.0182.66
SegForest68.3879.0473.7182.9887.1485.06
Bold font means the best performance.
Table 5. Results of ablation studies on DeepGlobe-Forest dataset.
MFFMSMDWBCEIoUmIoUAccuracymAcc
ForestBackgroundForestBackground
79.9881.7180.8589.0289.8089.41
81.5483.7582.6589.8390.1389.98
80.5381.6481.0988.7190.1889.45
81.3182.9082.1189.9590.1290.04
82.8083.9983.3991.7990.2091.00
✓ indicates the addition of this module.
Disclaimer/Publisher’s Note: The statements, opinions and data contained in all publications are solely those of the individual author(s) and contributor(s) and not of MDPI and/or the editor(s). MDPI and/or the editor(s) disclaim responsibility for any injury to people or property resulting from any ideas, methods, instructions or products referred to in the content.