1. Introduction
Using wood as the base material, wood structural buildings have renewable raw materials, a low carbon and energy saving processing process and are biodegradable. The products can replace a large number of concrete, cement, steel and other building materials, helping to reduce carbon emissions and enabling global green development [
1]. With the improvement of people’s standards of living, Betula(
Betula costata) wood provides a large amount in savings, has a greater economic value and is a high-quality wood. Betula is light brown with a bright surface, high mechanical strength and elasticity [
2].
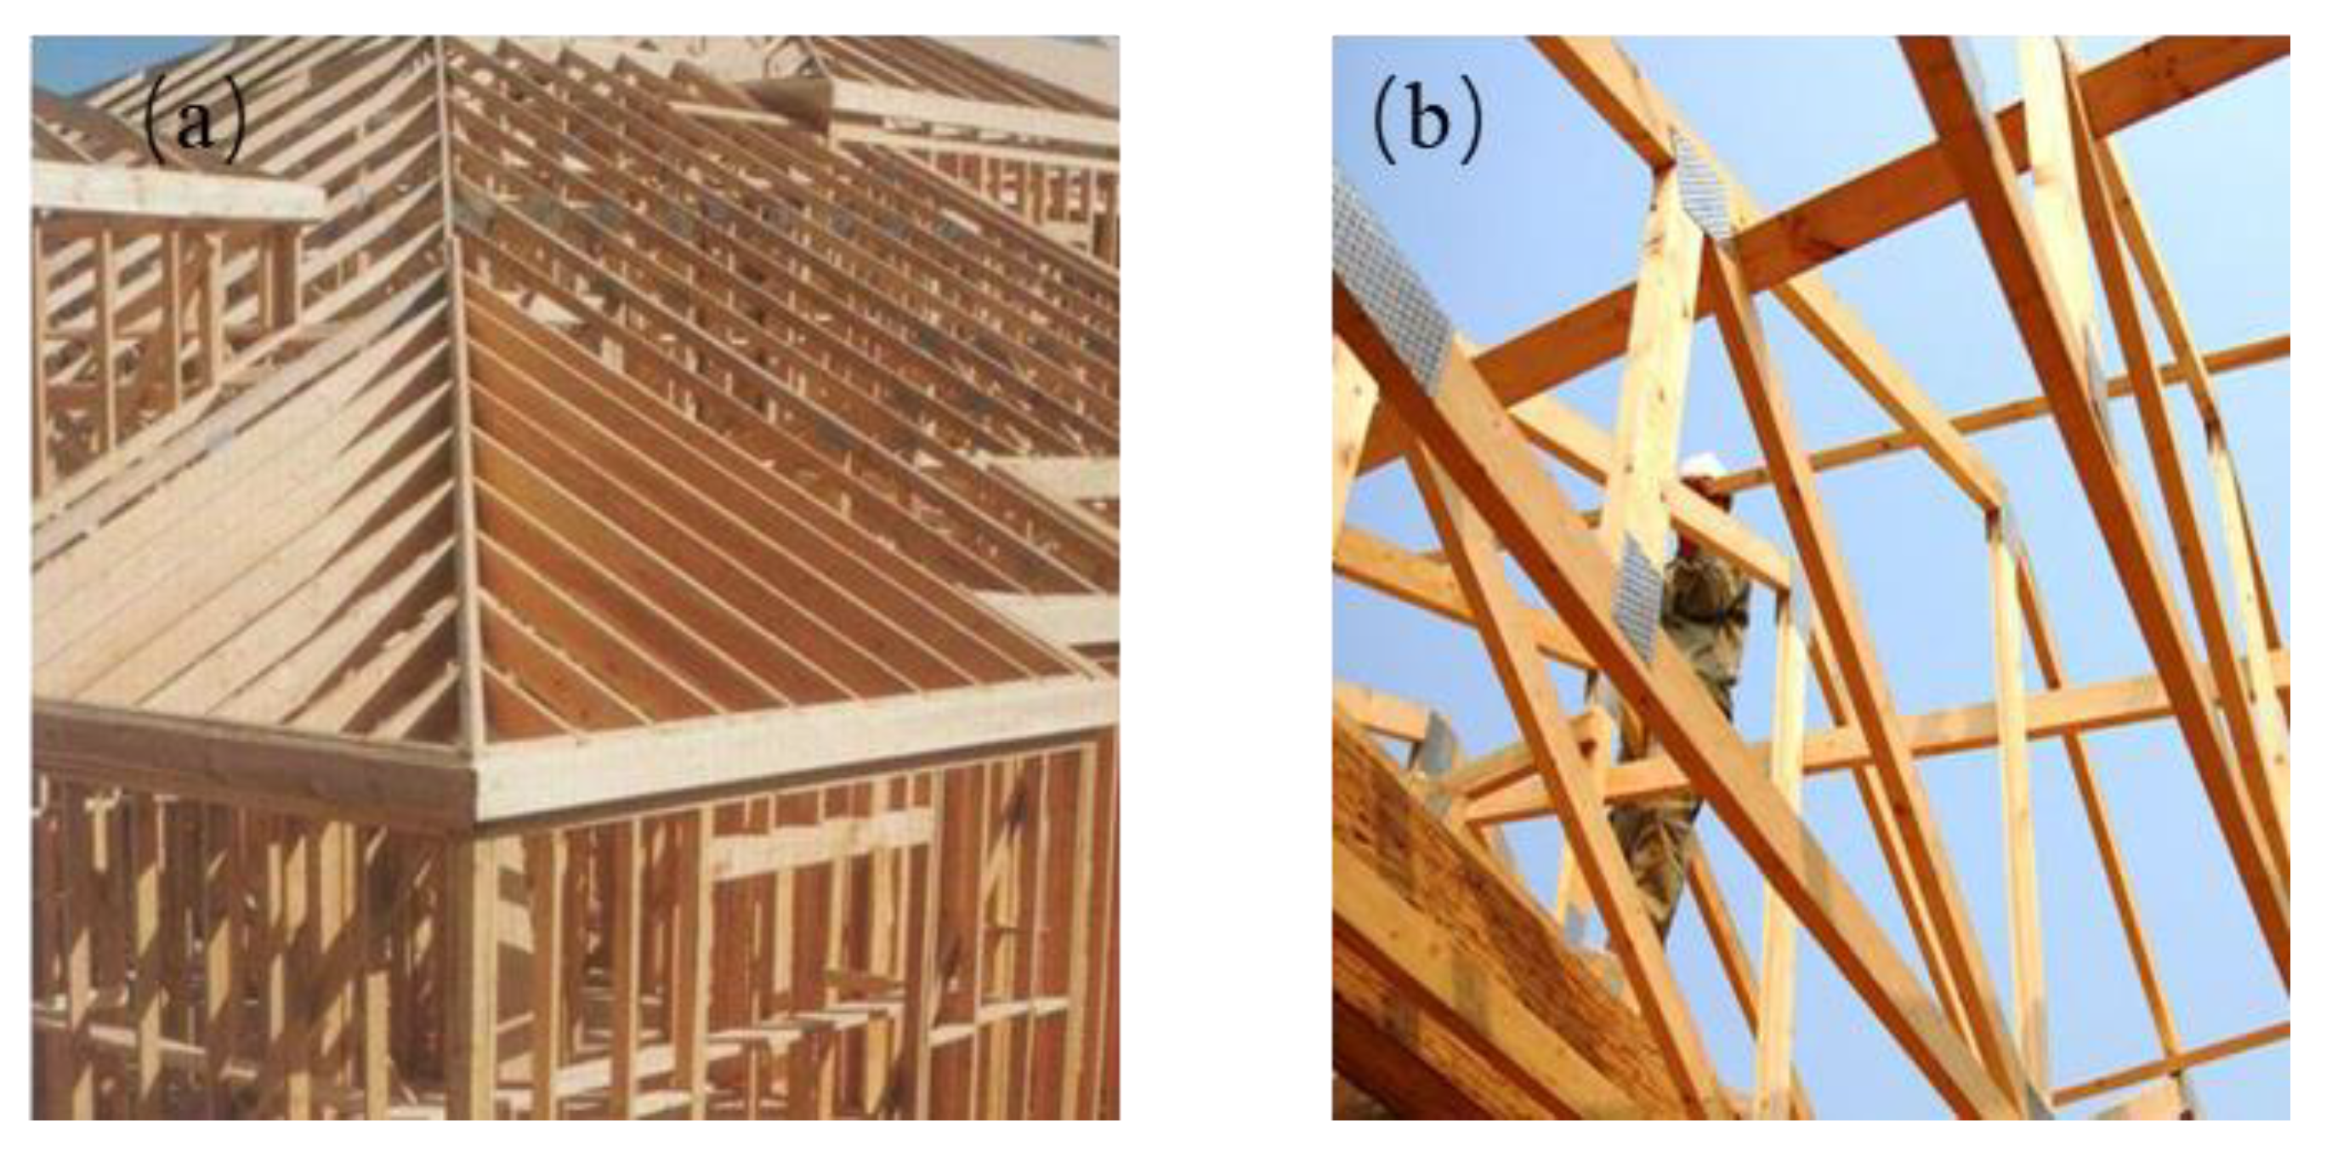
Betula’s processing performance is better, the material is expensive and most of the Betula is used as furniture in some places. Although the cost of Betula for structural timber is high, a small amount of Betula is used for structure construction. Betula as a building material has many advantages, with a smooth surface, good strength and toughness, easy processing, it is not prone to deformation and so on. Solid wood has shown a rapid growth trend by virtue of its advantages, such as environmental protection, flexible design and competitive cost (
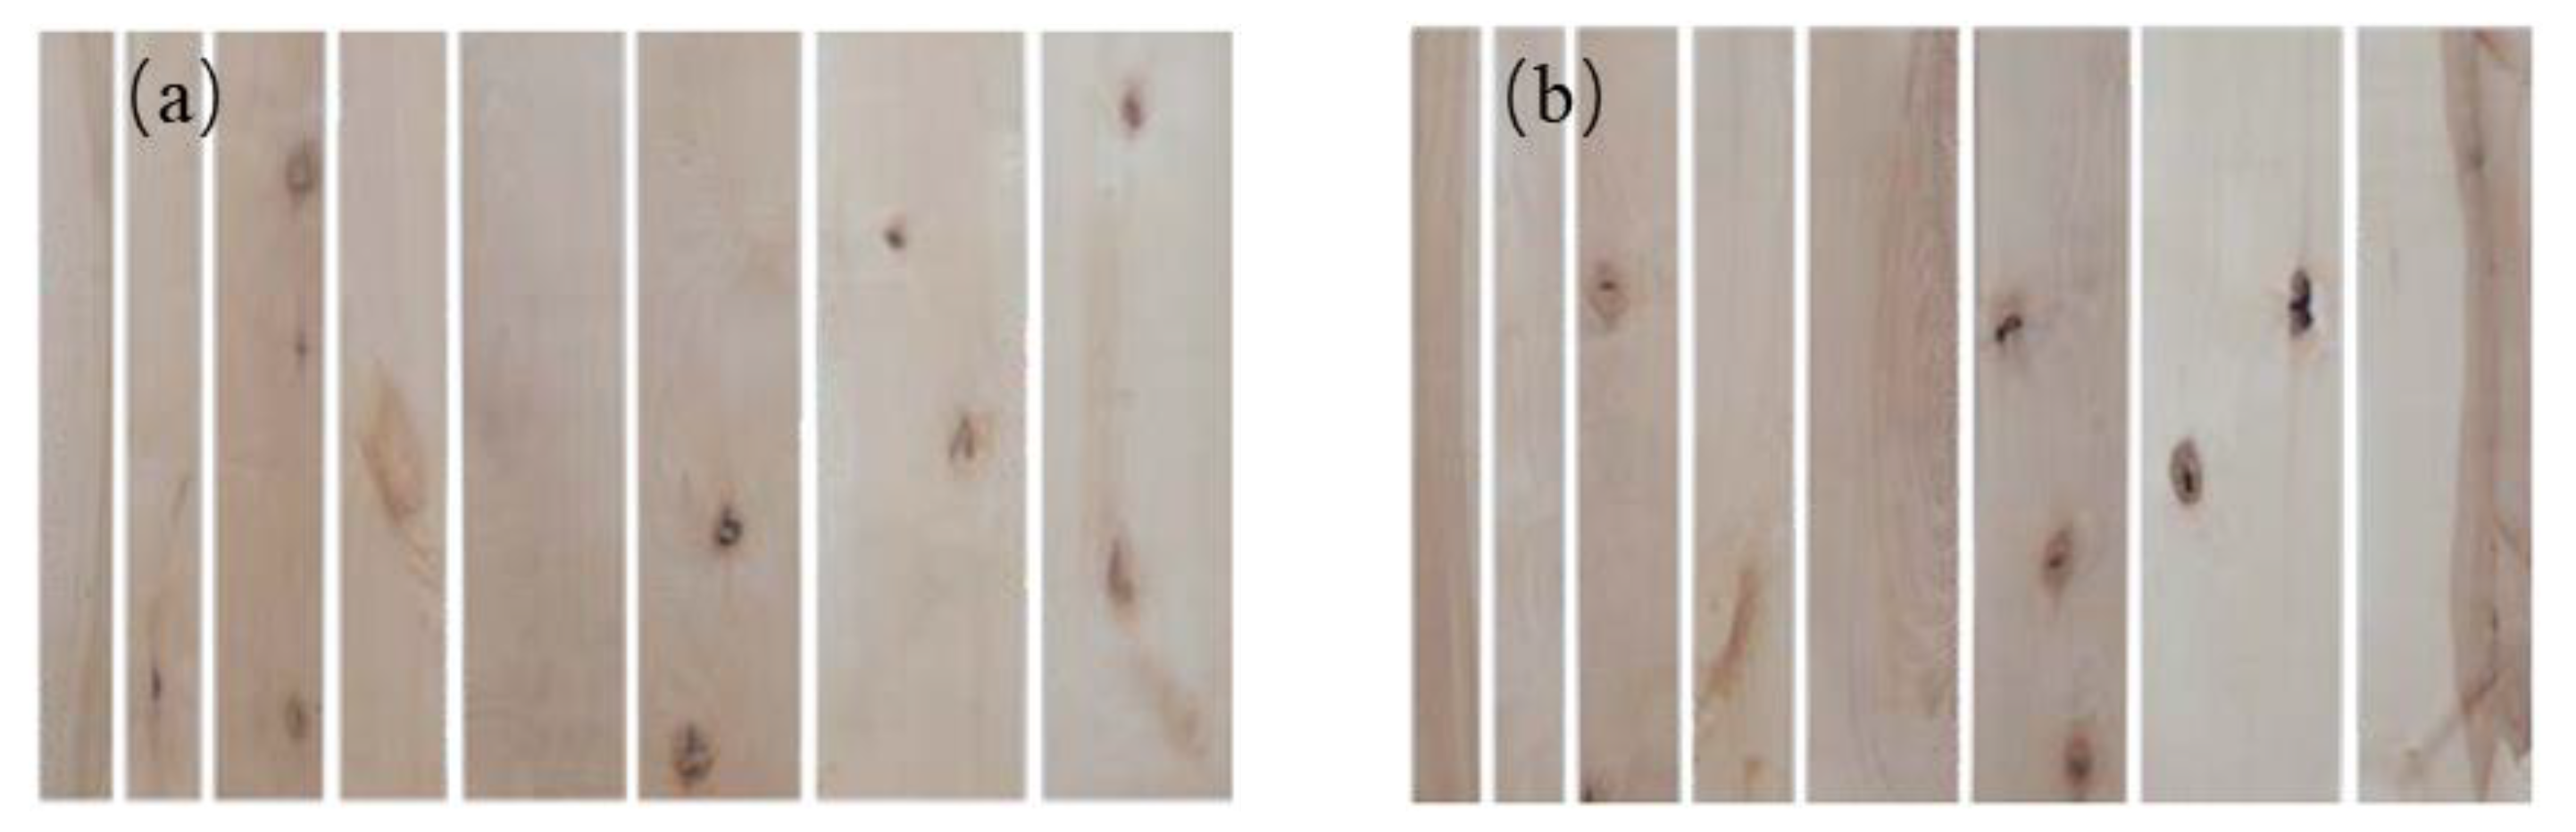
Figure 1). Compared with wood-based panels, Betula solid wood materials have the characteristics of a higher-utilization rate of wood, environmental protection and health, unique natural texture, good color and a long service life (
Figure 2). Betula material is unique in the design, manufacture and production technology of wood structure building components. It is necessary to combine the production process of wood materials with the design and development of wood structure building components. According to the different components of a wooden structure building, different quality grades of solid timber can be selected as raw materials. The value of Betula is determined by many factors, not least of which is the defect of the wood. Many scholars have concluded that wood defects have an impact on the strength, quality, processing and economic value of the sawn timber used in wood structures [
3]. Therefore, defect detection is an important step in wood processing.
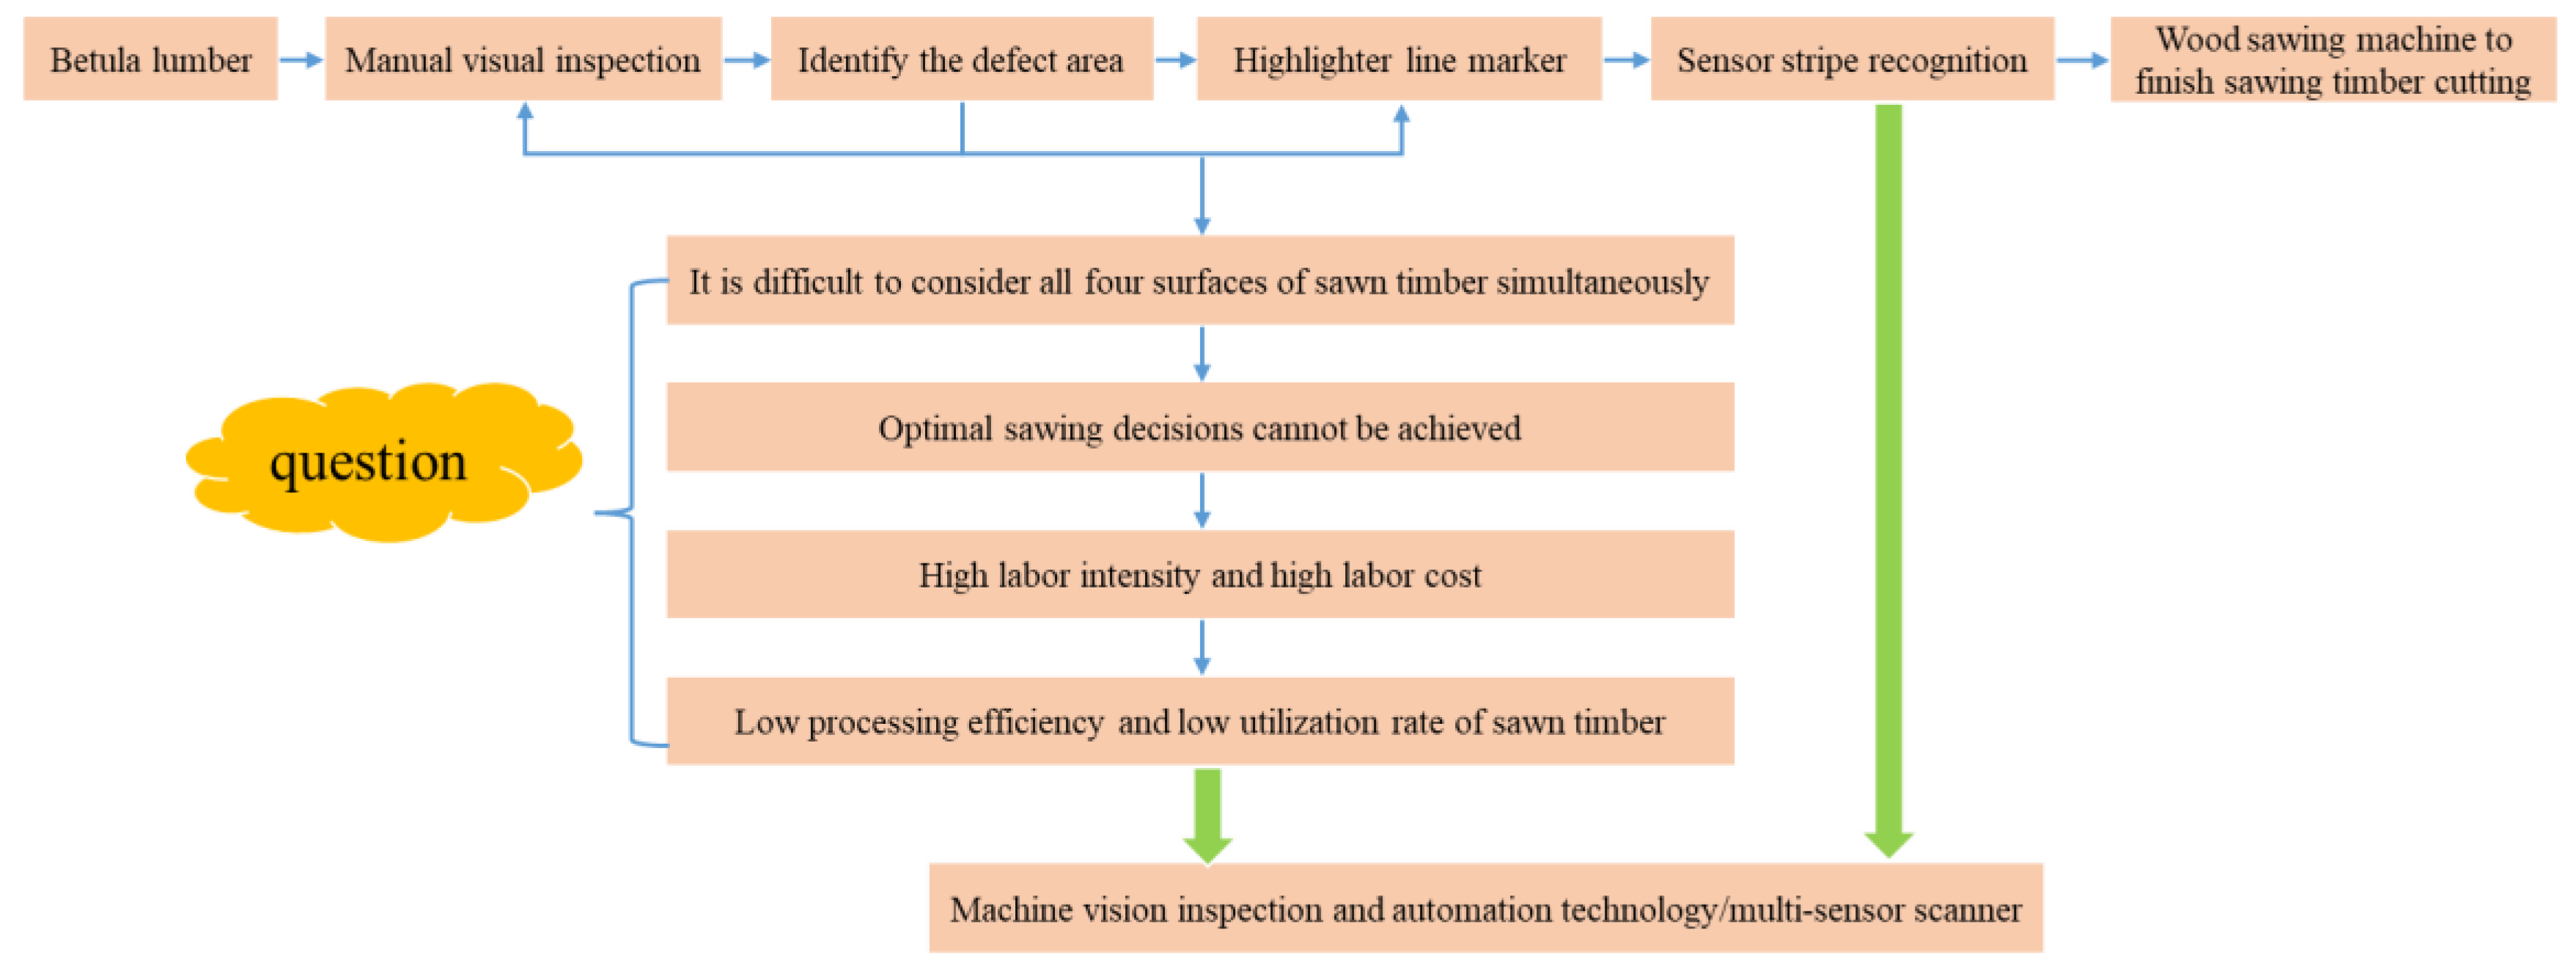
At present, some wood processing and production equipment is simple, with a low degree of automation, mostly single manual operation and the process has not realized standardized production. Some enterprises use manual visual markings to judge the defects of sawn timber in advance and use highlighters to mark the defective area. A wood-sawing machine can complete the timber cutting operation according to the marking instructions (
Figure 3). Manual visual markings require the manual handling of wood, and it is difficult to visually mark the four surfaces of large-sized Betula timber, which means it is inefficient and difficult to make quick statistical and optimization decisions [
4]. Due to the fast production line speed, it has been challenging for timber inspectors to calculate the speed mentally, making it difficult to obtain large-size timber characteristics. In the face of problems such as the low detection efficiency of wood surface defects, large limitation of artificial batching and lack of intelligent optimization sawing equipment, which has led to a large input of Betula processing costs, uneven quality, low utilization rate of wood resources and serious waste, machine vision detection and automation technology are combined to replace artificial visual marking with multi-sensor technology. In order to maximize the value of wood production, wood processing plants can reduce labor costs by improving the processing efficiency and yield of the wood. Therefore, the wood processing industry can also gradually move toward the direction of automation and intelligent development. University of Turin, Italy, M. Brunetti et al. [
5] studied the methods of artificial visual inspection and machine inspection of wood, and the test results showed that machine inspection has a high flexibility and can effectively improve production efficiency.
The core and most challenging part of timber detection and classification are computer processing power, computer computing power, data storage ability and scanner sensor accuracy ability [
6]. Department of Forestry and Natural Resources, Purdue University, United State, Logan Wells [
7] and R. Gazo [
8], in collaboration with Microtec, Italy, developed a surface-quality detection and classification method for structural lumber based on the grading rules of the NHLA in the United States. Centre de Recherche en Automatique de Nancy, France, V. Bombardier [
9] built a numerical model of knot identification and an improved defect identification system based on the characteristics of the timber surface. Virginia Tech., United State, F. M. Megahed [
10] introduced a machine vision detection system for industrial applications, and studied a detection method for timber surface-knots based on image analysis and other methods.
Many non-destructive defect detection technologies have rapidly developed, including X-ray, nuclear magnetic resonance detection, stress wave, ultrasonic, infrared and laserto detect, and these methods help identify lumber defects [
11,
12]. For some of the above methods, if a separate sensor or a separate method is used, sometimes it is difficult to intuitively and accurately find the location of the defect. In order to improve the accuracy of defect detection, the appearance quality of timber can be visually scanned by machine vision technology, and a variety of sensors can be added to the machine vision system. The algorithm of a machine vision system mainly designs and extracts some features from wood images, including color, texture and a gray-level co-occurrence matrix (GLCM), to represent defects [
13,
14]. The system trains some defect classifiers, such as a matching algorithm, support vector machine (SVM), neural network and deep learning, to determine the defect region [
15,
16]. Luleå University of Technology, Sweden, T. Pahlberg [
17] fused a Block Match algorithm and Speeded-Up Robust Features (SURF) algorithm to achieve the detection of the defect features of Scottish pine, obtaining good matching accuracy and improving the recognition rate.
National University of Science and Technology in Islamabad, Pakistan, K. Kamala [
18] proposed a new method for the automatic detection of wood based on a machine vision method using GLCM, texture feature extractor and a feedforward backpropagation neural network as a classifier. The square error (MSE) of the training data was 0.0718. The overall average classification accuracy was 90.5%. Urmia University, Iran, A. Mahram [
19] combined GLCM, local binary pattern (LBP) and a statistical moment method to obtain an efficient classification, recognition pattern and feature extraction algorithm for defects. Principal component analysis (PCA) and linear discriminant analysis (LDA) were used to reduce the dimension feature vector, and SVM and K-nearest neighbor (KNN) were used to detect defects. University of Telkom, Indonesia, F. Akhyar [
20] optimized the baseline and framework of YOLOv4 model architecture based on a deep learning algorithm and developed the wood defects detection system.
Intelligent automation systems include sensors, machine vision recognition, image information processing, optimization decision, data acquisition and so on. Machine learning is a science of artificial intelligence, and its application in the wood processing industry is of great significance. A wood intelligent system adopts computer science and machine vision technology to simulate human brain learning and decision-making, it automatically analyzes and obtains rules from graphic data and it completes the acquisition of defects. The research and development of intelligent automation systems aims to obtain high-accuracy images with a high-speed algorithm and highly resilient algorithm. The definition of a high-precision image is that the camera acquires pictures with higher pixel points, resulting in better image quality and clarity. In contrast, lower resolution images tend to have fewer pixels and less image details. A high speed algorithm is an algorithm designed for fast execution and is used in many productions with more stringent speed requirements. A highly resilient algorithm is an algorithm designed to continue to operate even if one or more of its components fail, and it is capable of working properly on a set of undamaged modules.
With the rapid development of digital image processing technology and pattern recognition technology, computer processing power and image sensor accuracy have been improved. In this paper, we study the intelligent automatic optimization technology of wood materials, establish a rapid nondestructive testing system for wood defects in the field of wood processing and inspection, improve the accuracy of wood defect identification and classification based on machine vision and realize nondestructive, rapid, continuous and comprehensive automatic classification and processing of Betula solid timber. The Betula was obtained from Latvia, Europe. Through the research and development of the key technologies of intelligent wood manufacturing and its industrial application, the traditional wood processing industry uses modern high-tech information technology to innovate, change the traditional processing mode, research material characteristics as well as the comprehensive utilization of product development and form an intelligent and industrialized production mode. We will promote the standardized, serialized and intensive production of various products. It is of great significance to promote the comprehensive and efficient use of natural resources by forest product processing enterprises, improve the independent innovation ability and competitiveness of the forest product industry, activate and integrate resources, promote the transformation and upgrading of the wood processing industry and promote the development of forestry science and technology, as well as the economy and society.
2. Methodology and Method
2.1. Betula Species Identification
Betula bark has a white, gray, yellow-white, reddish-brown, brown or black-brown smooth surface, and sometimes there are transverse cracks, longitudinal cracks, thin layer peeling or massive peeling phenomena (
Figure 4). Betula bark contains resin, has transverse perforations, usually flakes transversely and is thick and deeply furred on older trunks, cracked into irregular segments. Betula is yellowish-white or brownish and glossy with slightly distinct rings (
Figure 5). The diameter of the orifice is small, but it is distinguishable to the naked eye. The wood ray on the diameter section is orange and speckled yellow, the wood fiber binds tightly and after sawing the section has a smooth and uniform color.
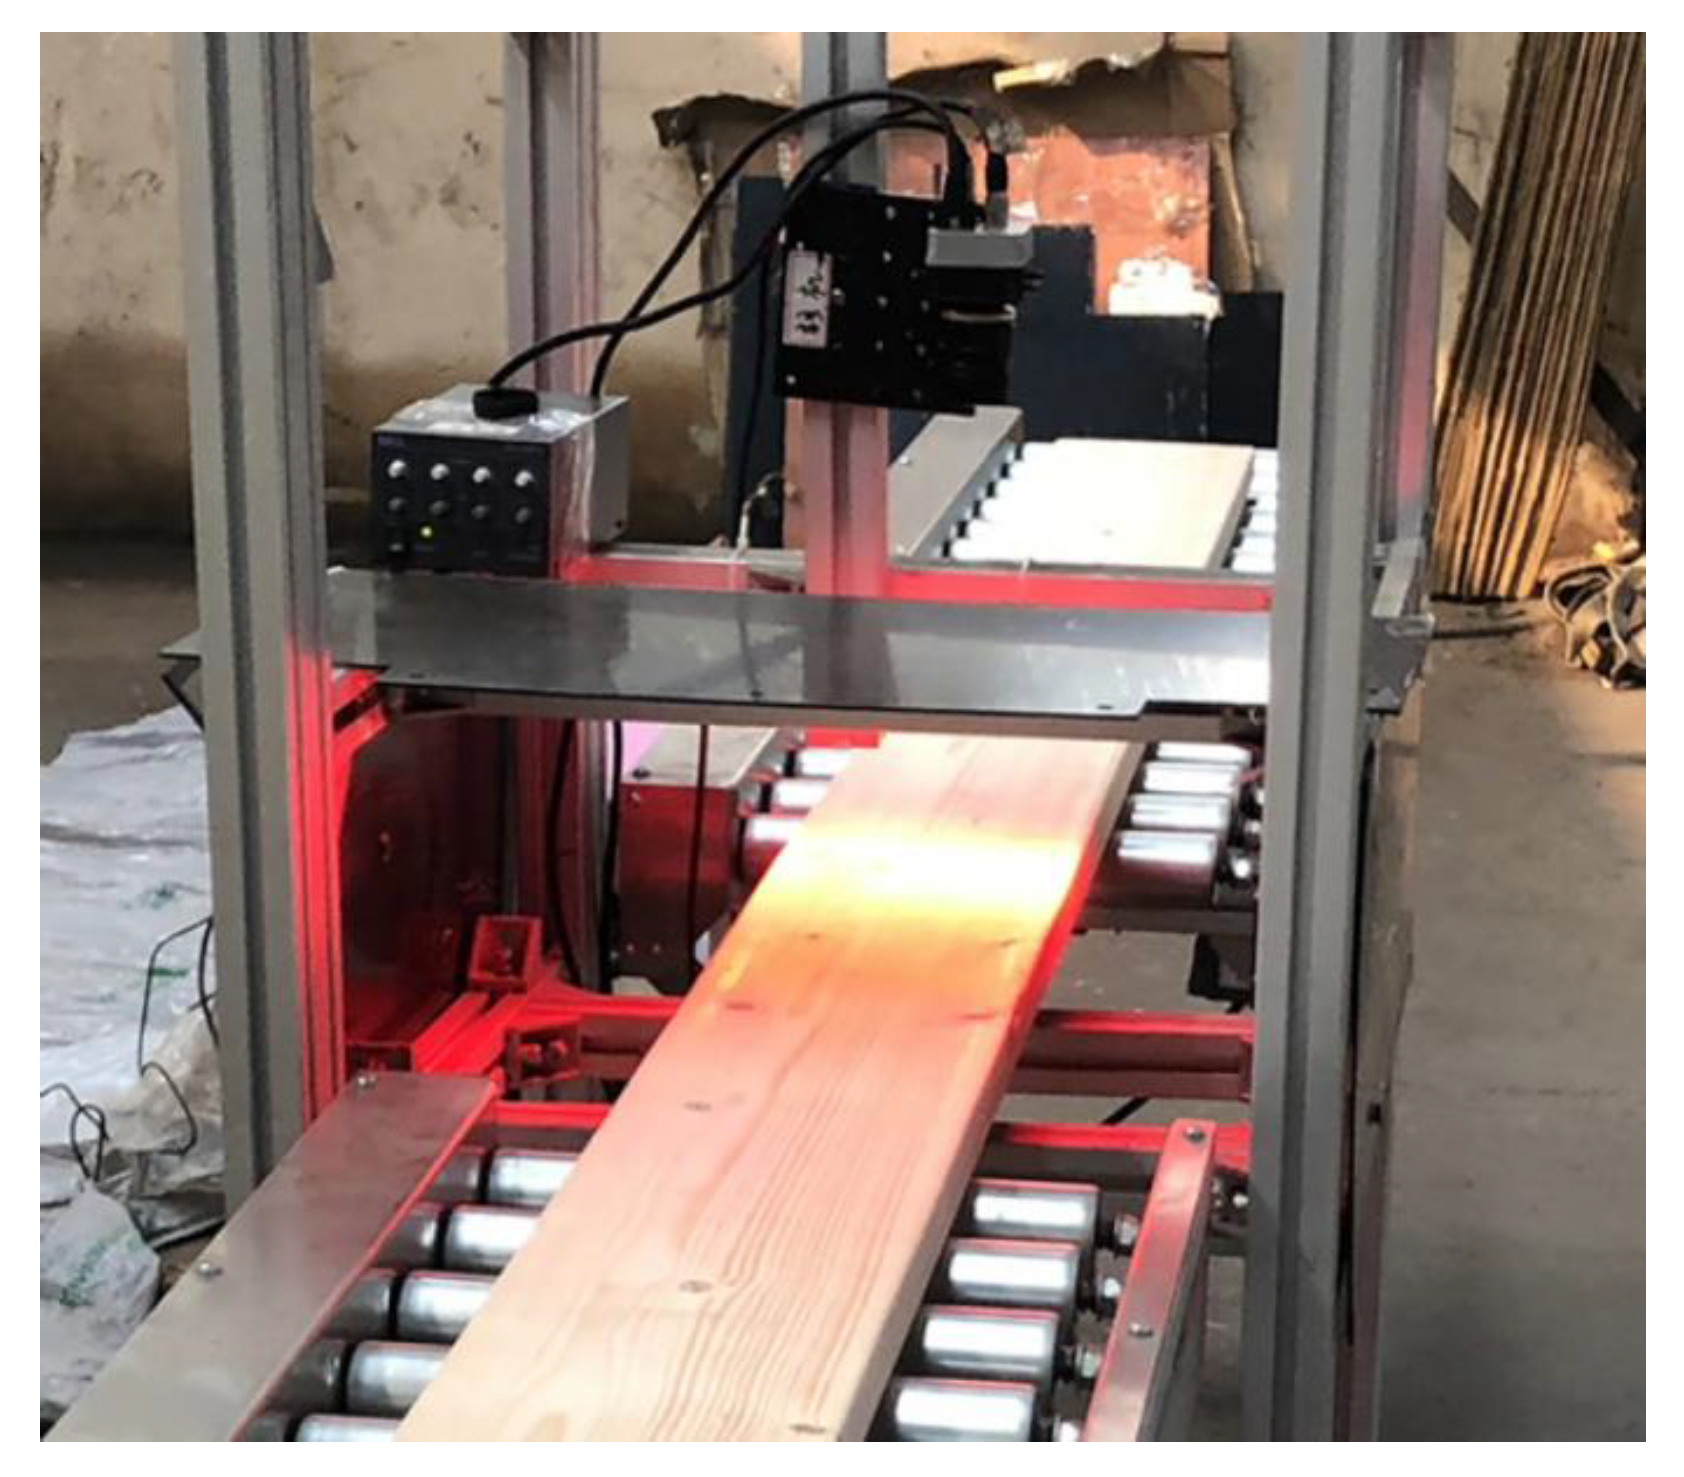
The sensors of the image data acquisition and detection equipment mainly capture images from the camera and red stripe light source. The horizontal measuring instrument is used to measure the angle between the light source and the camera in a vertical direction. The FLUKE illuminometer is used to measure the illumination of the light source. The position of the detection system sensor and light source is shown in
Figure 6. We adjusted the inclination degree of the strip light and the vertical angle between the camera to 60° and kept it fixed. A light source device was designed which can automatically adjust the height and brightness. The device had a wide transverse radiation range and high brightness to better distinguish the object from the background. By adjusting the appropriate light source, the characteristics of Betula could be clearly captured, which was conducive to the processing and analysis of the acquired images.
We scanned and imaged the bark stump face image data of the tree species. The camera scanned the image data under the lens and sent the final image to the computer for image processing. Different tree species were photographed using a Basler raL2048-48 gm line-scan camera with 2048 pixel per line resolution and 51 kHz line-scan rate. The camera was from the German Basler manufacturing company, located in Ahrensburg, Germany, founded in 1988, with 30 years of experience in the field of vision technology, is the world’s leading computer vision expert. The following is the basic information of the obtained images: 2048 × 2048 pixels, 2 k resolution and a bit depth of 8. First, different tree species images were collected and annotated, then image transformation expansion was performed and finally the tree species instance segmentation model was trained to achieve tree species recording and recognition.
According to the triangular projection relationship of machine vision, the actual size of the wood corresponding to the image pixel is related to the camera detection accuracy, focal length, working distance of the camera and optical path position. After we determined the accuracy requirements of the wood images, the sensor selection was carried out and the system structure distribution was designed. The camera imaging distribution is shown in
Figure 7. In a similar triangle relationship of machine vision, different imaging coordinate systems were defined to carry out the imaging transformation. We first converted the camera coordinate system to the physical coordinate system, and then converted the physical coordinate system to the pixel coordinate system. In the process of the object being detected, we required an accuracy of 0.1 mm, that is, the surface area measured in units of 1 mm with 10 pixels on the wood. The resolution of each pixel represents the clarity of each pixel. In this system, the image has 10 pixels per millimeter, the pixel density can meet the recognition requirements of the system and the detailed changes of the wood are presented in a clear form. The camera sensor pixel size (H × V) was 7 µm × 7 µm and the camera sensor resolution (H × V) was 2048 px × 1 px. The effective number of bits-per-pixel component of each channel of the image was 8 and can represent 256 different colors.
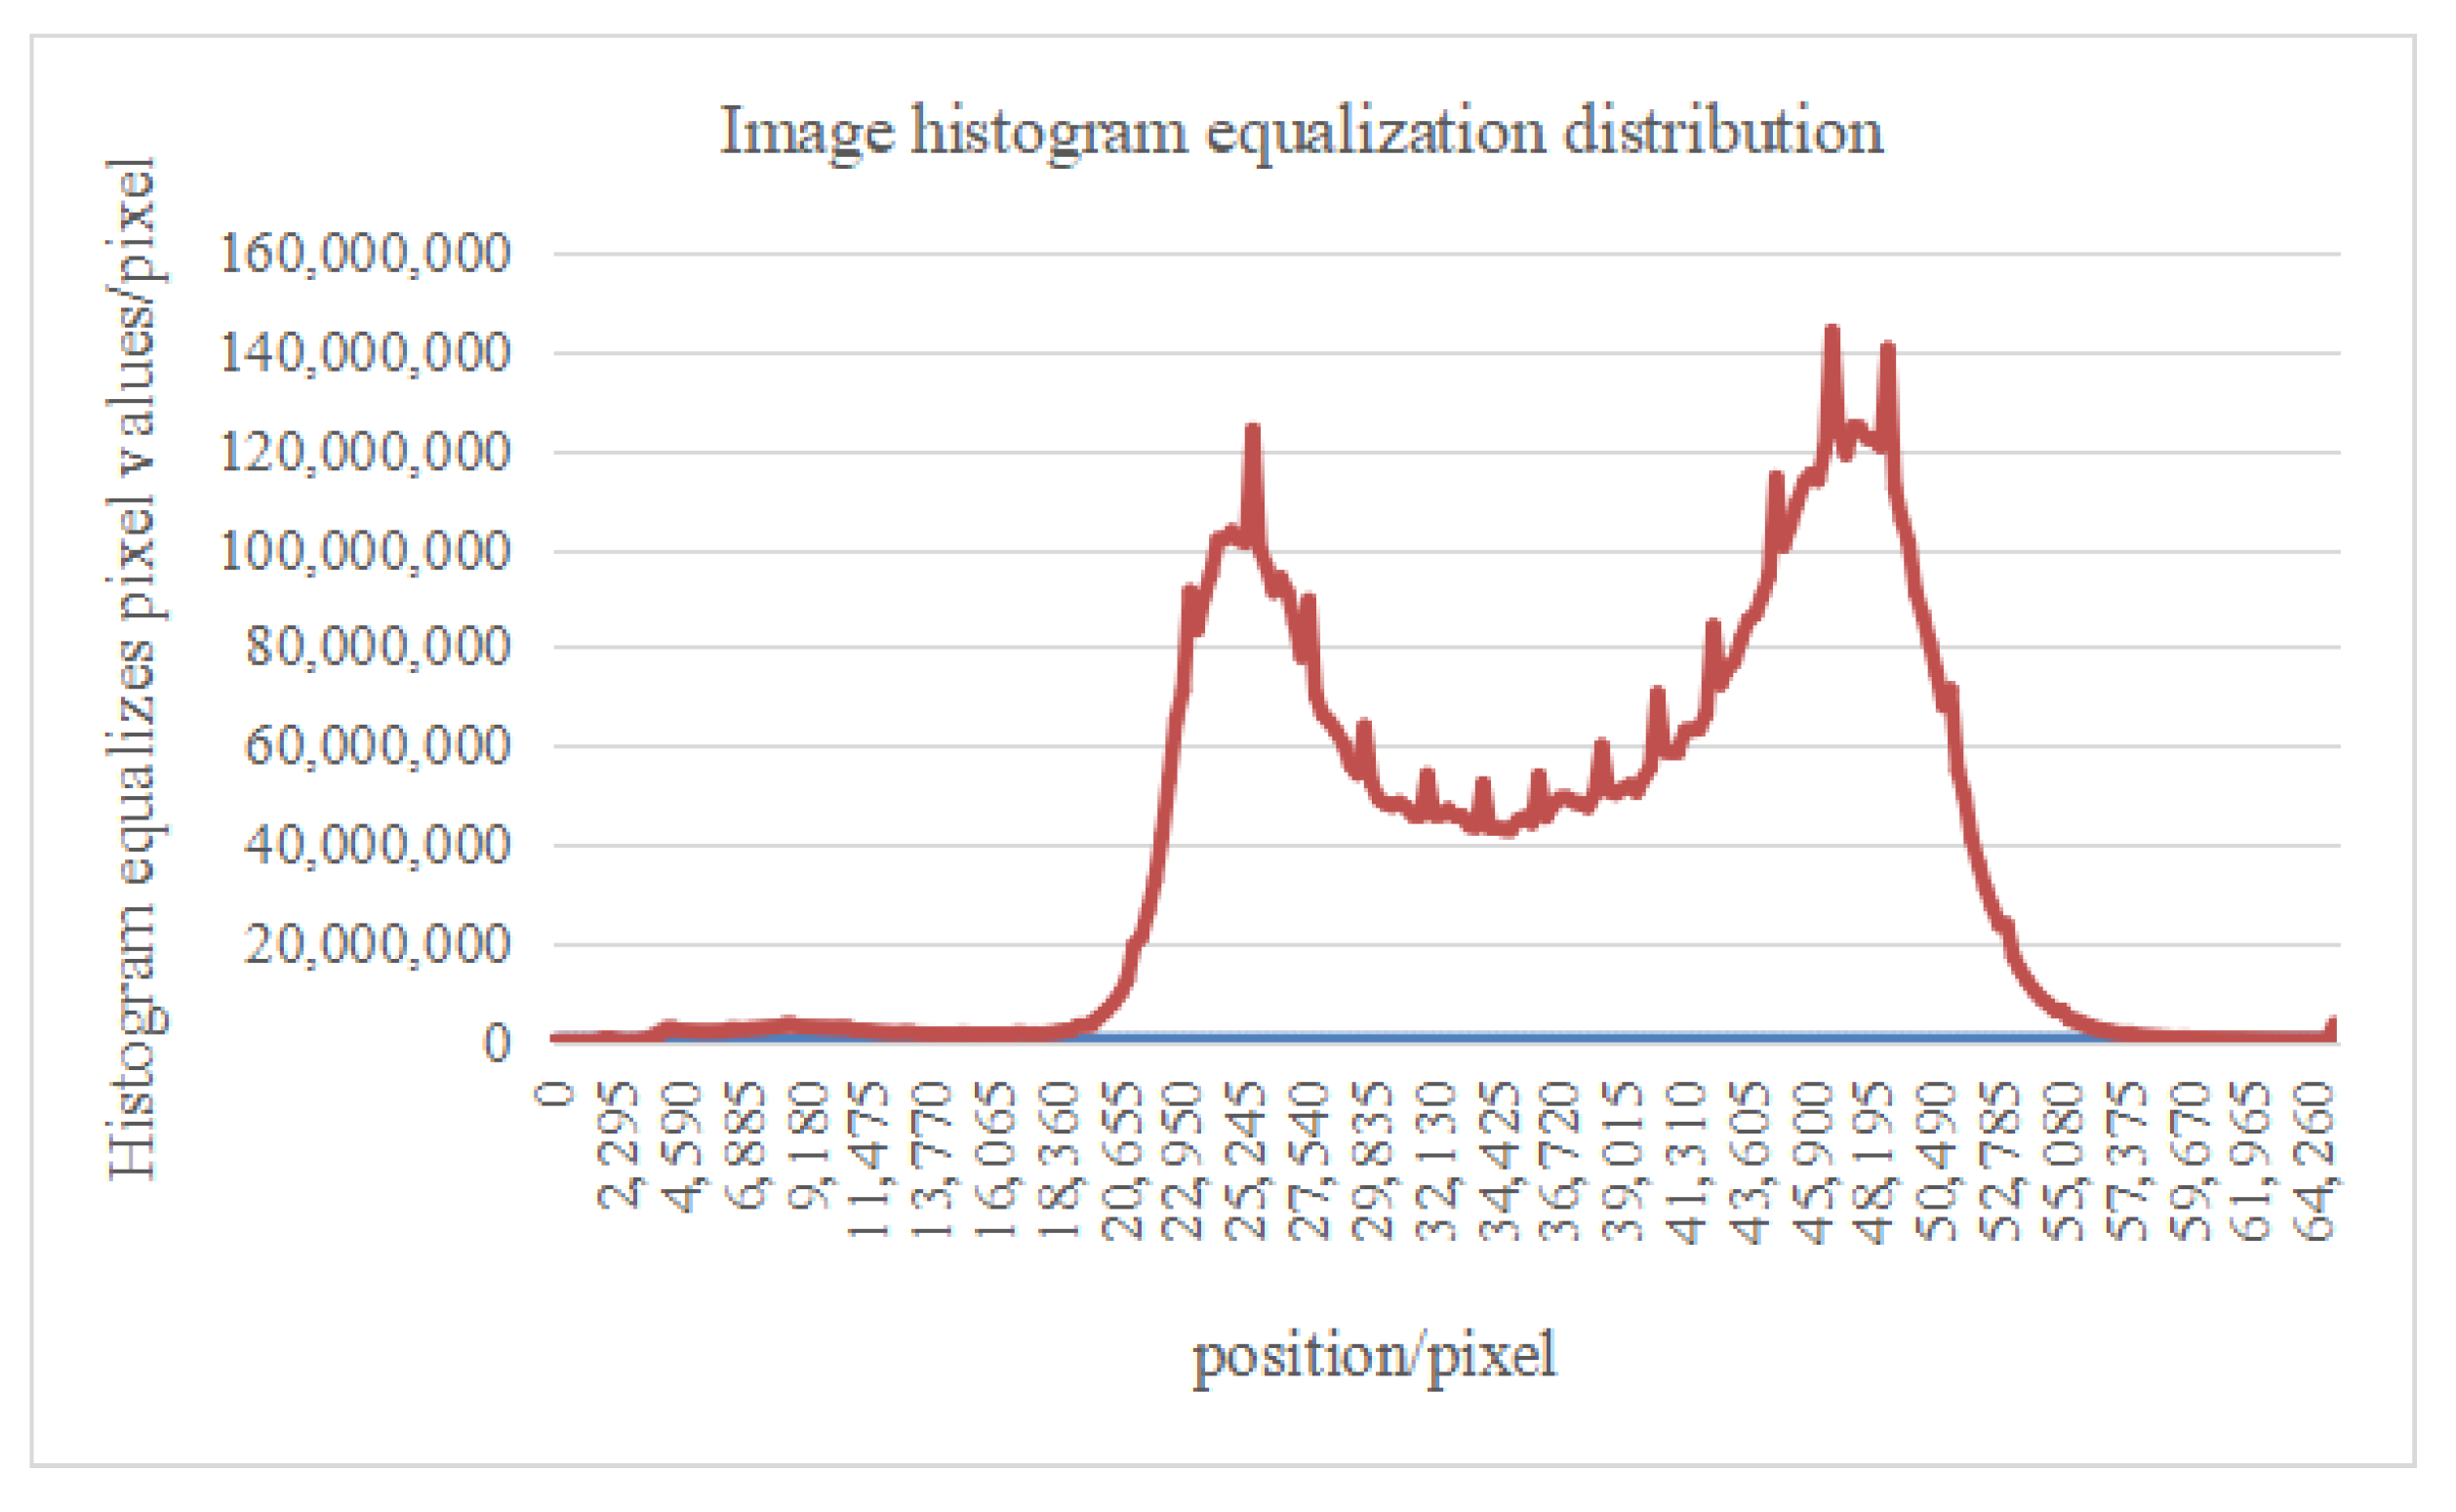
Bark and stump face image data of Betula, spruce, Douglas Fir, larch and red pine were collected. Images of different tree species were intercepted based on region of Interest (ROI), and parts containing two or more complete feature primitives were intercepted. Betula characteristics were acquired by the shooting equipment, and then the ROI region was captured after the display by electronic equipment. The acquired images had different degrees of image distortion, and the gray scale was slightly black or white, affecting the accuracy of feature extraction. Histogram equalization was used to process the image to solve the problem of gray concentration and improve the image characteristics and quality. Histogram equalization used the image histogram to adjust the contrast. Through the intensity transform function, the image contrast was increased, the image clarity was improved and the image features were improved. The processing result of the image histogram equalization algorithm is shown in
Figure 8. The visualization of the wood image features automatically extracted by the deep learning model was used to form a Betula, spruce, Douglas fir, larch, red pine and other tree species classification feature database. After a series of convolution and pooling operations, the deep abstract features of the images were extracted and generated, and these feature matrices were converted into one-dimensional vectors as the input of the fully connected layer, which completed the task of tree species classification (
Figure 9).
2.2. Log Sawing Optimization
During log sawing, computed tomography (CT) technology was used to scan the internal features of logs in real time, and we obtained the characteristic information of defect type, size and location in the log space. The repeated physical sawing of logs was simulated by computer software, and the sawing value of different sawing modes applied to the same log sample was compared. The sawing simulation study was carried out to optimize the sawing parameters (sawing mode, sawing position etc.), determine the best mode of log optimization sawing and maximize the value of the sawing products (
Figure 10).
Before sawing the logs, we placed them in the scanning system and scanned them using CT technology. During the CT scan, the largest log was 500 mm in diameter. The scanning equipment shot X-rays through the log and recorded the data reflected back. Log moisture and density affected the selection of the CT scanning parameters. When the log has high moisture content, lower scanning parameters are needed to avoid image blurring [
21]. Additionally, logs with higher density require higher scanning parameters to obtain a better image quality by the X-rays. The log data obtained by the scanner were collected, and the data were converted into computer graphics to obtain a three-dimensional image of the internal structure of the log. The image can be used to detect defects and diseases inside the log and measure the internal features of the log in three dimensions. The 3D image reconstruction was performed by a computer vision algorithm, which converted the scanned data into a 3D coordinate system and used geometric algorithms to calculate the image. We converted the three-dimensional structural data into a two-dimensional structure of a virtual sawn timber surface and calculated variable based on the two-dimensional structure to obtain log information. The location and size of the defects were determined based on image processing technology. We determined the sawing method based on sawn timber grading rules [
22].
In the log optimization cutting process, the cutting process was modeled and the linear programming algorithm was used to find the best cutting scheme. Each cutting scheme was represented as a linear programming problem, and the linear programming algorithm was used to solve the optimal solution to minimize material waste.
The linear programming algorithm is shown as follows:
Constraints:
where
V represents the total timber volume of the
k scheme, mm
3;
qnk represents the corresponding quantity of the
n scheme timber;
wk represents timbers width of the
k scheme and
hk represents timbers height of the
k scheme.
By solving the target problem of timber yield Y1, several excellent sawing schemes can be obtained. All the sawing schemes were taken out to obtain the corresponding timber yield, and the scheme with the maximum timber yield was selected as the final sawing scheme.
The down-sawing method of log defects was adopted. According to the distribution of defects in logs, serious defects should be concentrated or removed. General defects should be properly dispersed on a few sawn timbers, so as to minimize the impact of defects on the quality of the sawn timber. When the knots in the log are large but few, parallel to the knot under sawing, the knot is, as much as possible, concentrated on a few sawn timbers. When the knots are small and of a large quantity, the log is vertically sawed down to the knot so that the knot is circular. When there is edge rot in the log, the board is sawed according to the width of decay. Both diameter cracks and ring cracks should be sawed down parallel to the crack direction to make the crack concentrate on a few timbers as much as possible.
2.3. Solid Sawn Timber Longitudinal Multiblade Sawing
On the basis of log optimization sawing, the timber was cut lengthwise. Longitudinal cutting plays a very important role in wood processing, because longitudinal optimization is also an important process to improve the yield of sawn timber. Variations in wood defects result in an average of 8% of wood being wasted when sawing using a traditional fixed multi-blade saw. To solve the above problems, the width, quality, edge bark width and defect location of the wood were scanned, the scanned information the evaluation requirement were input and the different quality areas of the sawn timber were divided. The software simulated different sawing sizes, positions and combination modes, and the optimal longitudinal sawing mode of the timber was calculated (
Figure 11).
The optimal sawing mode was adopted, the unequal width was adopted in the longitudinal sawing and the yield was taken as the optimization objective. The sawing position was adjusted according to the timber width and timber defect, so as to avoid sawn timber defects as much as possible, improve the yield of sawn timber and reasonably consider economic factors. Based on the optimization decision, automatic control technology was used to adjust the position of the blade to maximize the yield of wood. A saw blade motor, a driving wheel and a guide wheel for a transport chain plate were arranged in a longitudinal sawing frame. The transport chain plate was equipped with a prismatic guide rail, and the sawing section was turned by a pair of sliding rods. Thus, the accurate steering movement of the transport chain plate and the precise sawing of the wood could be ensured. We optimized the longitudinal sawing of timber fast calculation of the best cutting scheme. The saw blade was efficiently and automatically positioned according to the calculation results. This process can be used in the selection of circular saw machine and multi-blade saw switching, which is better used in the building materials industry.
2.4. Solid Sawn Timber Optimizing Cross-Cut
2.4.1. Betula Sawn Timber Detection and Optimization
Based on the machine vision and deep learning algorithms, the surface defects of sawn timber were extracted and the wood morphology and feature extraction algorithms were studied so as to accurately identify and locate defects and improve efficiency. Through the computer automatic learning algorithm, the defect classification and recognition models were established to reduce the error rate of recognition, and the sawn timber defects were efficiently and accurately identified. The sawn timber surface intelligent grading technology, based on machine vision, was studied to form a production line scheme for the classification and complete processing of sawn timber surface defects. The defect database of Betula sawn timber was established. The regional target detection technology based on deep learning was used to collect sufficient data information from the defect images of the Betula sawn timber, and the different defects image database was increased by labeling a large number of defect categories and framing samples of defect characteristics. The identification, classification and processing technology of sawn timber were studied, and non-destructive testing and classification methods were applied to improve the mechanical properties, utilization rate and quality of the structural sawn timber applications (
Figure 12). The optimized crosscut was able to satisfy the processing size range of Betula sawn timber: length: 1200 mm–6300 mm; width: 30 mm–150 mm; thickness: 12 mm–100 mm. Detection speed: 150 m/min or 214 m/min; the two running speeds can be adjusted.
The working parameters of the scanner station were the following: processor was a 12th Gen IntelR Core(TM)i9-12900K 3.20 GHz, with RAM 64.0 GB, the system type was a 64-bit operating system based on a ×64 processor, Windows 11 system, GPU model: NVIDIA GeForce RTX 3090. Gen IntelR Core(TM)i9-12900Kwas from Intel Corporation in the United States, received equipment in Beijing, China. The image parameters collected by the camera sensor were a resolution of 2048 × 12,288 pixels and bit depth of 8.
According to the camera triangle imaging model, there are three coordinate systems in the camera imaging process (which can also be regarded as four with the world coordinate system): the camera coordinate system (also known as the optical center coordinate system), the physical (imaging plane) coordinate system and the pixel coordinate system. We converted the image coordinate system
u-
v to the world coordinate system
x-
y-
z. As shown in
Figure 13, the vision imaging model takes
O as the optical center, and the plane
W passes through the feature point
P1 and is parallel to the imaging plane.
P1Q1 is the image of the wood feature size
P1M on the plane
W.
P′
1Q′
1 is the image of the feature size
P1M on the imaging plane and
O″ is the intersection of the plane
W and the optical axis [
23].
According to the principle of triangular similarity imaging,
P1Q1 =
L,
P′
1M′
1 =
s′,
OO″ =
H,
f represents the focal length and the distance from the camera’s optical center to the physical imaging plane. The relationship between the above four parameters is as follows:
In the imaging conversion process, the camera coordinate system is transferred to the physical coordinate system, and the conversion formula is as follows:
In the formula, X, Y and Z indicate that there is a point P(X,Y,Z) in the camera coordinate system, and X′, and Y′ indicate that it is P′ (X′,Y′) projected into the imaging plane coordinate system, and the coordinate value of the detected object on the imaging plane can be calculated.
Convert the physical coordinate system to the pixel coordinate system, and the conversion formula is as follows:
In the formula, α and β represent the scaling multiple of the X′ axis and Y′ axis, respectively, and cx and cy represent the offset value of the coordinate points, respectively. The coordinate value p(u,v) of the detected object in the pixel plane can be calculated.
In the image detection system, the camera sensor resolution (H × V) was 2048 px × 1 px and the camera sensor pixel size (H × V) was 7 µm × 7 µm and the number of effective bits per pixel component of each channel of the image was 8. On the timber image, we detected the surface area of the actual timber with the 10 matrix pixel points representing 1 mm as a unit, and the resolution = 1 mm (the size of the actual timber)/10 pixel (the number of pixels of timber detected on the image) = 0.1 mm/pixel. The minimum observable dimension of timber object that could be observed on this image matrix was 0.1 mm.
The machine vision image processing system converts pixels into digital signals based on information such as brightness, color and distribution. After digital image preprocessing, image segmentation, morphological processing, feature extraction and pattern recognition, the image of the sawn timber surface defect is processed and analyzed. Based on deep learning convolution and matrix multiplication, the first layer detects the edges, corners, sharp or non-smooth areas of defects, and the second layer combines the results of the first layer detection to detect the location, grain, shape, etc. of different defects and passes these combinations to the next layer. According to the digital signal, various operations are carried out to extract the features of the target, and then output the results according to the preset tolerance and other conditions to achieve automatic detection, identification, positioning and measurement functions, as shown in
Figure 14.
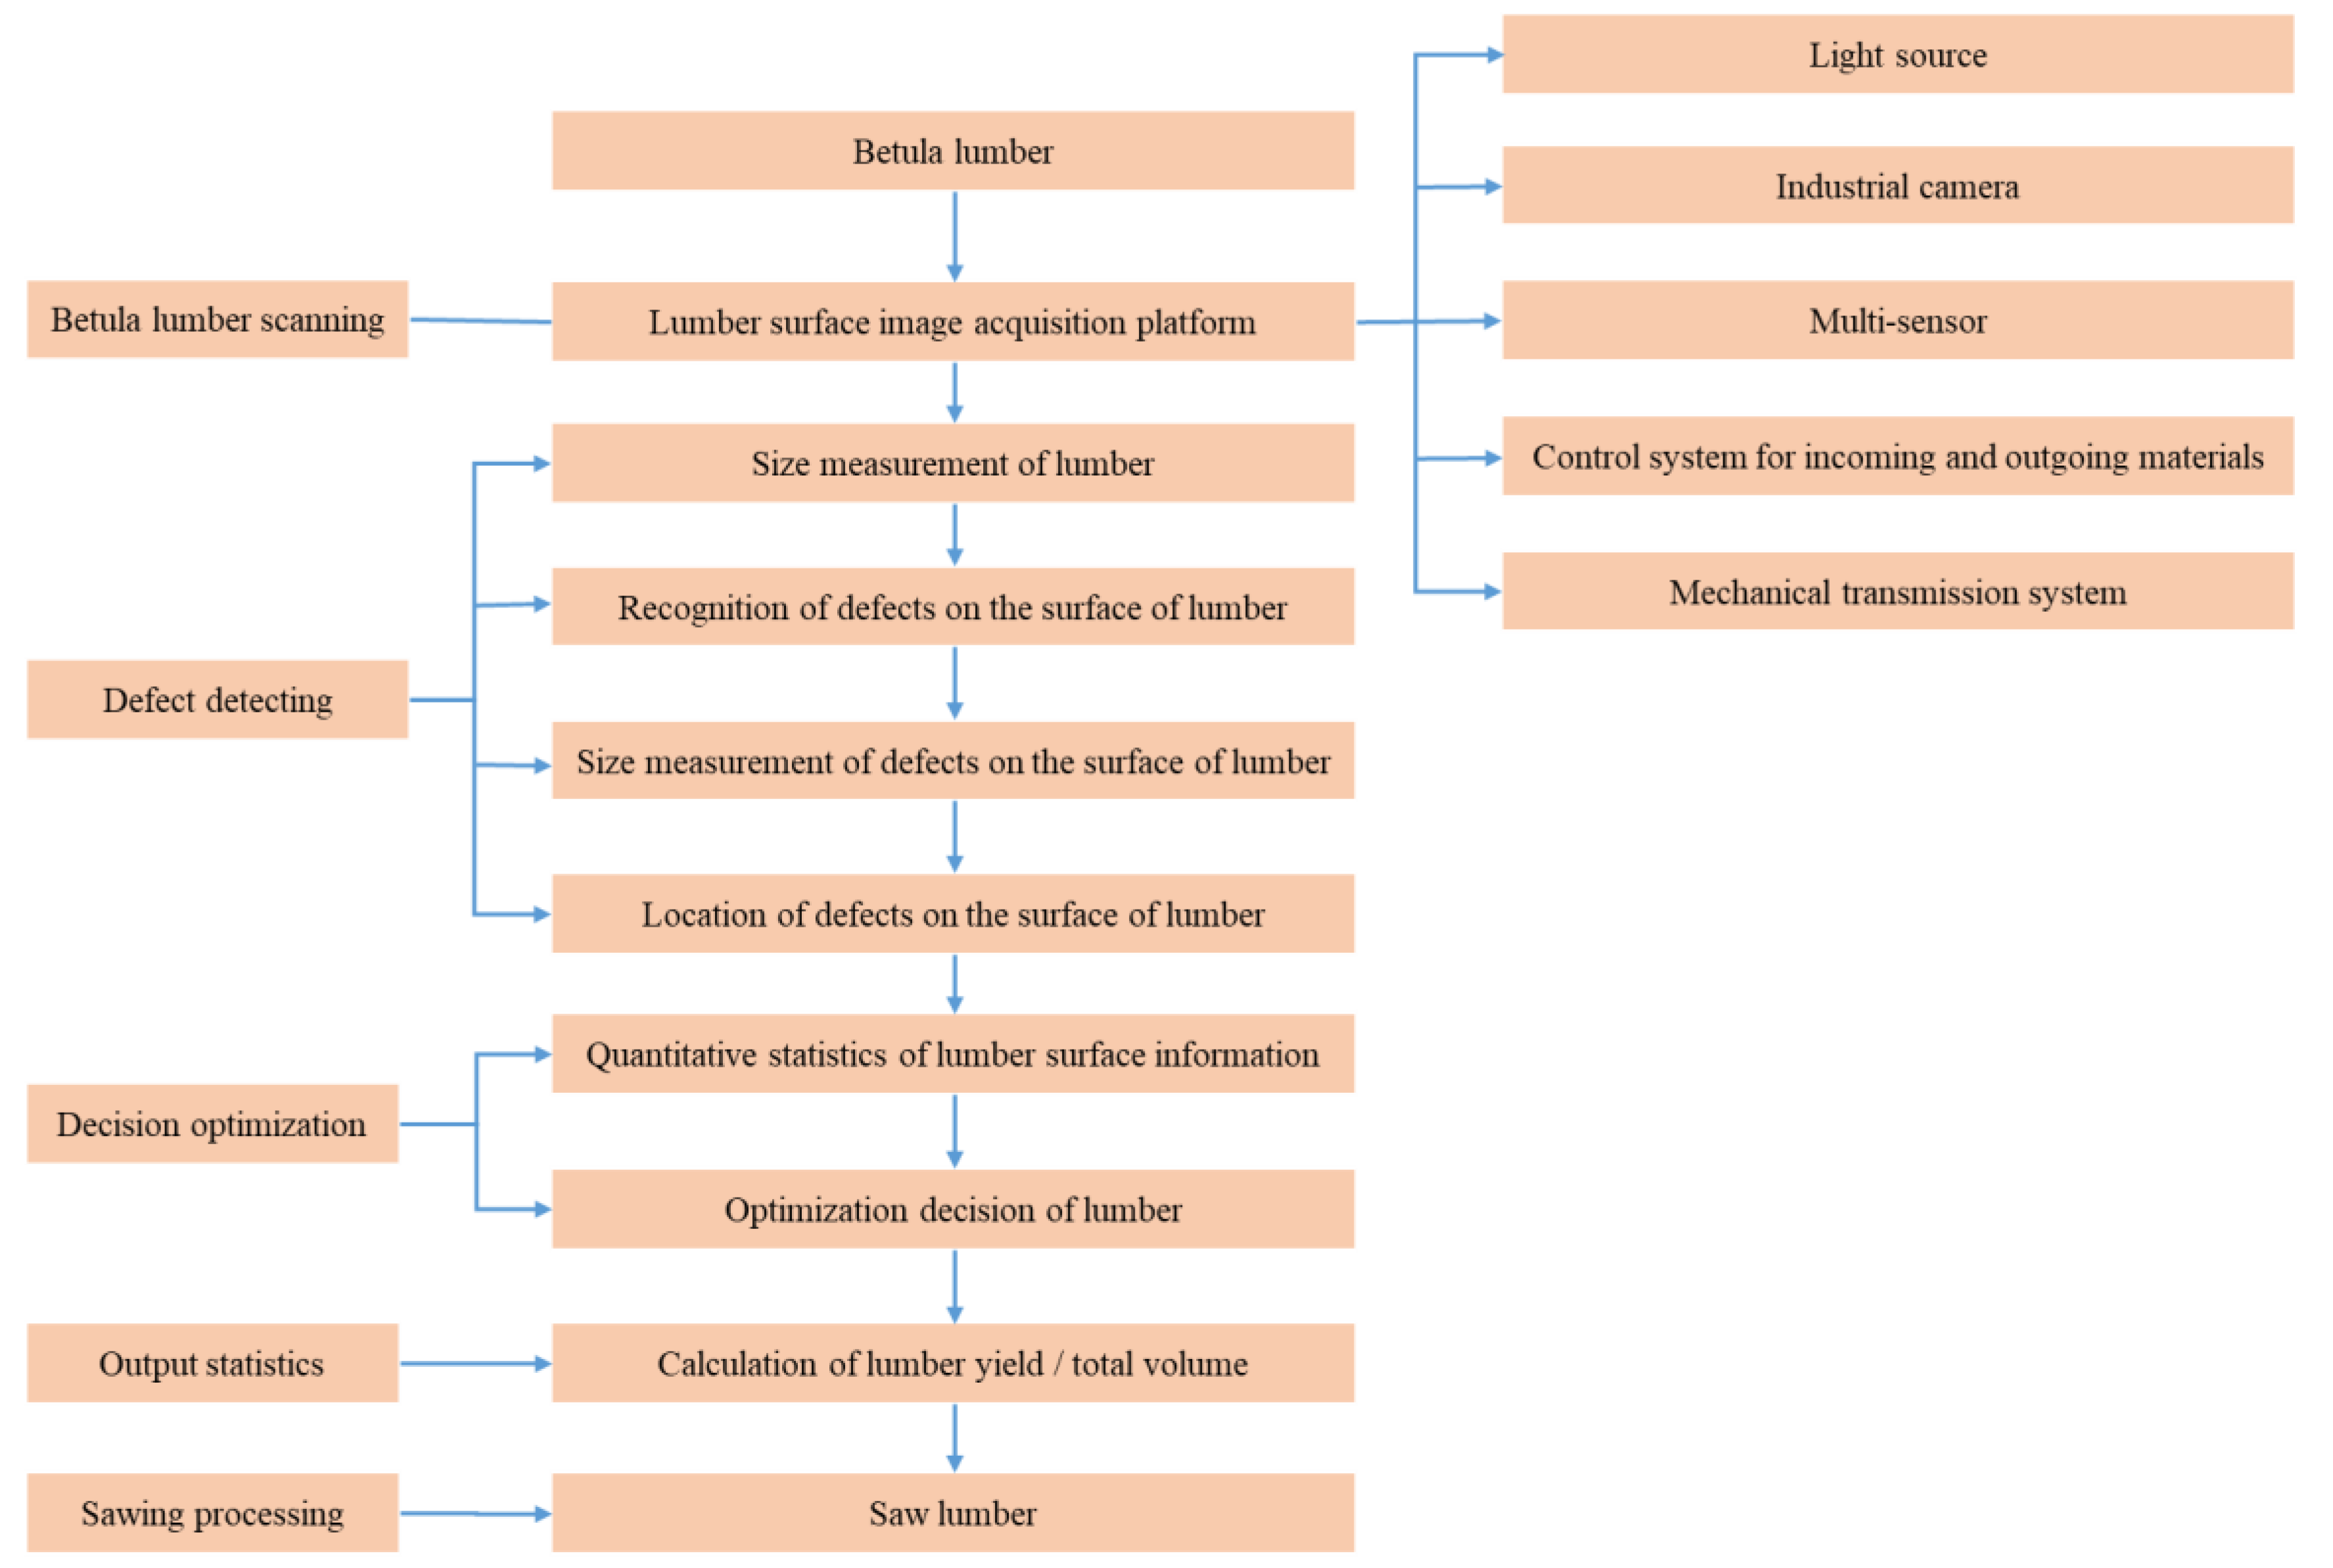
Timber detection and optimization software consists of three steps: (1) timber image scanning, (2) image processing and (3) optimization processing, as shown in
Figure 15. Sawn timber scanning can obtain better quality images by multi-sensor technology for later application analysis. The upper computer controls the instructions to start and stop the sawn timber scanning, and image processing is used to identify and classify the defects. Considering the requirements of the factory and quality control requirements, the best sawing scheme was designated to optimize the sawn timber processing, as shown in
Figure 16.
2.4.2. Optimized Sawing Procedure
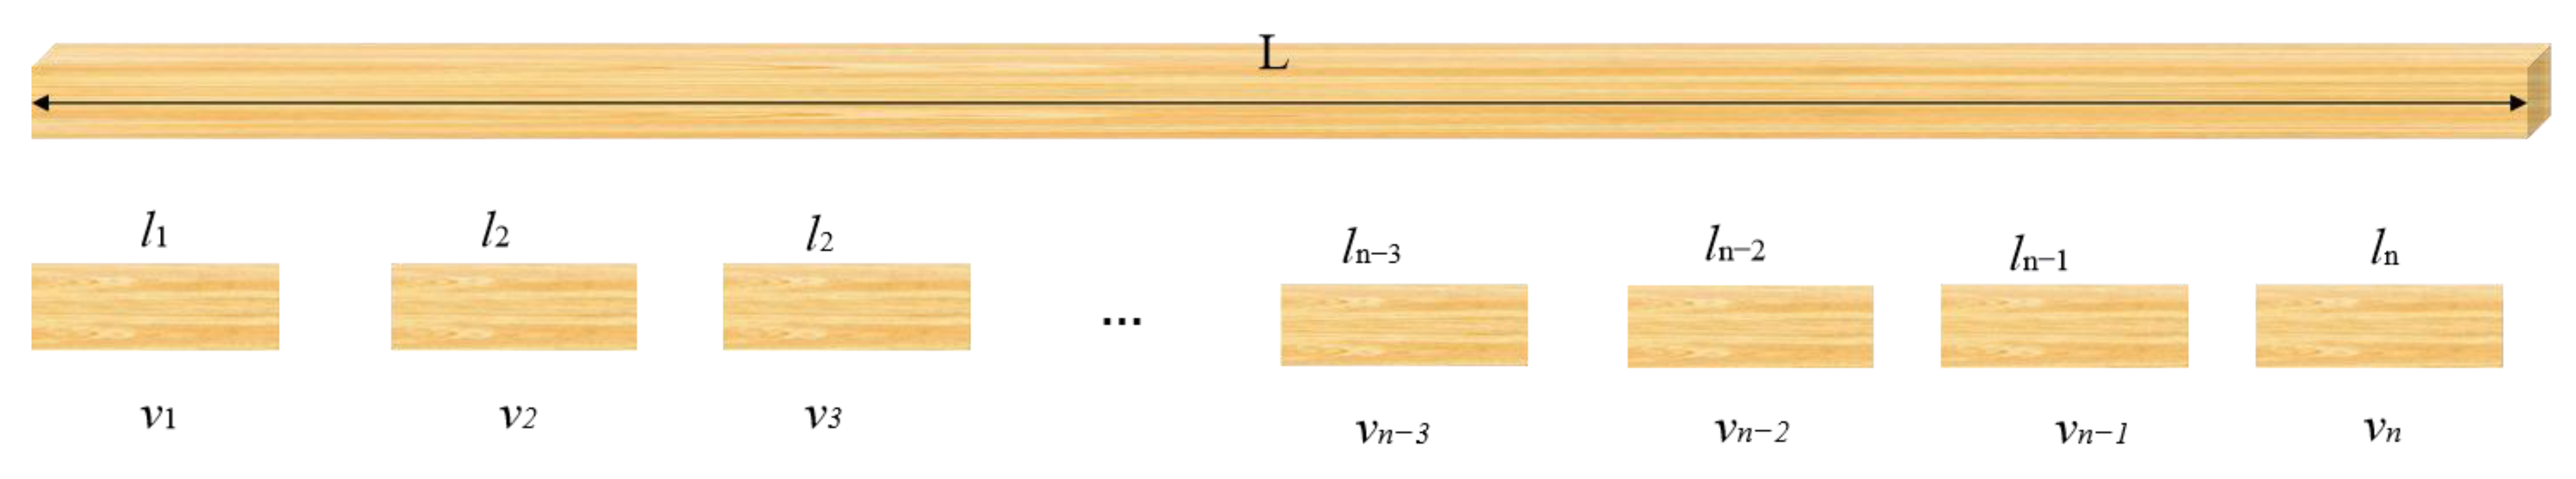
After the longitudinal sawing of the sawn timber, the cross-cutting operation was carried out, considering the two objectives of the yield and economic value. For the yield target, it was regarded as a whole piece of sawn timber with an available length of
L to be sawn laterally, and the length was
l1,
ll2,
ll3, …
ln billets (small pieces of sawn timber after cross-cutting) which were combined in width. The higher the total billet length
Z1, the larger the material yield, but the total length cannot exceed the available length. For the economic value target, the corresponding blank value and quantity in the blank combination were calculated. The higher the total blank value
V, the better the overall economic value, as shown in
Figure 17. The integration of the above two objectives and constraints is:
Constraints:
where
L represents the total blanks length of the
k scheme, mm;
Vt represents the total billet value of the
k scheme;
vk represents the corresponding value of the
k scheme and
qnk represents the corresponding quantity of the
n scheme billet.
By solving the above double objective problem, multiple sets of sawing schemes were achieved (
S1,
S2,
S3, …,
Sn). We took out all the sawing schemes, simulated sawing the original timber with defects to obtain the corresponding lumber yield (
y1,
y2,...
yn) and selected the scheme with the maximum yield as the final sawing scheme. The sawing scheme with higher timber yield and better economic value was AA obtained, as shown in
Figure 18.
Final solution objective:
(1) Based on the machine vision method, defect features were extracted, defect classification, as well as a recognition model and tree species defect database were established, image processing algorithms with high robustness, fast processing speed and high recognition accuracy were studied, non-destructive testing and classification methods of machine vision were optimized, key problems of online rapid defect detection were solved and production quality and processing efficiency were improved.
(2) We constructed an engineering database of wood structural building materials, proposed a quality evaluation method for solid wood and wood structure building components and established a processing standard for sawn timber suitable for wood structures. According to the wood quality evaluation standard and production scale, the optimization method of wood board was studied to improve the comprehensive utilization rate of wood.
(3) We constructed a wood intelligent automatic optimization sawing demonstration production line to achieve the intelligent automatic optimization of wood, as well as the sawing and efficient intelligent automatic production of wood.
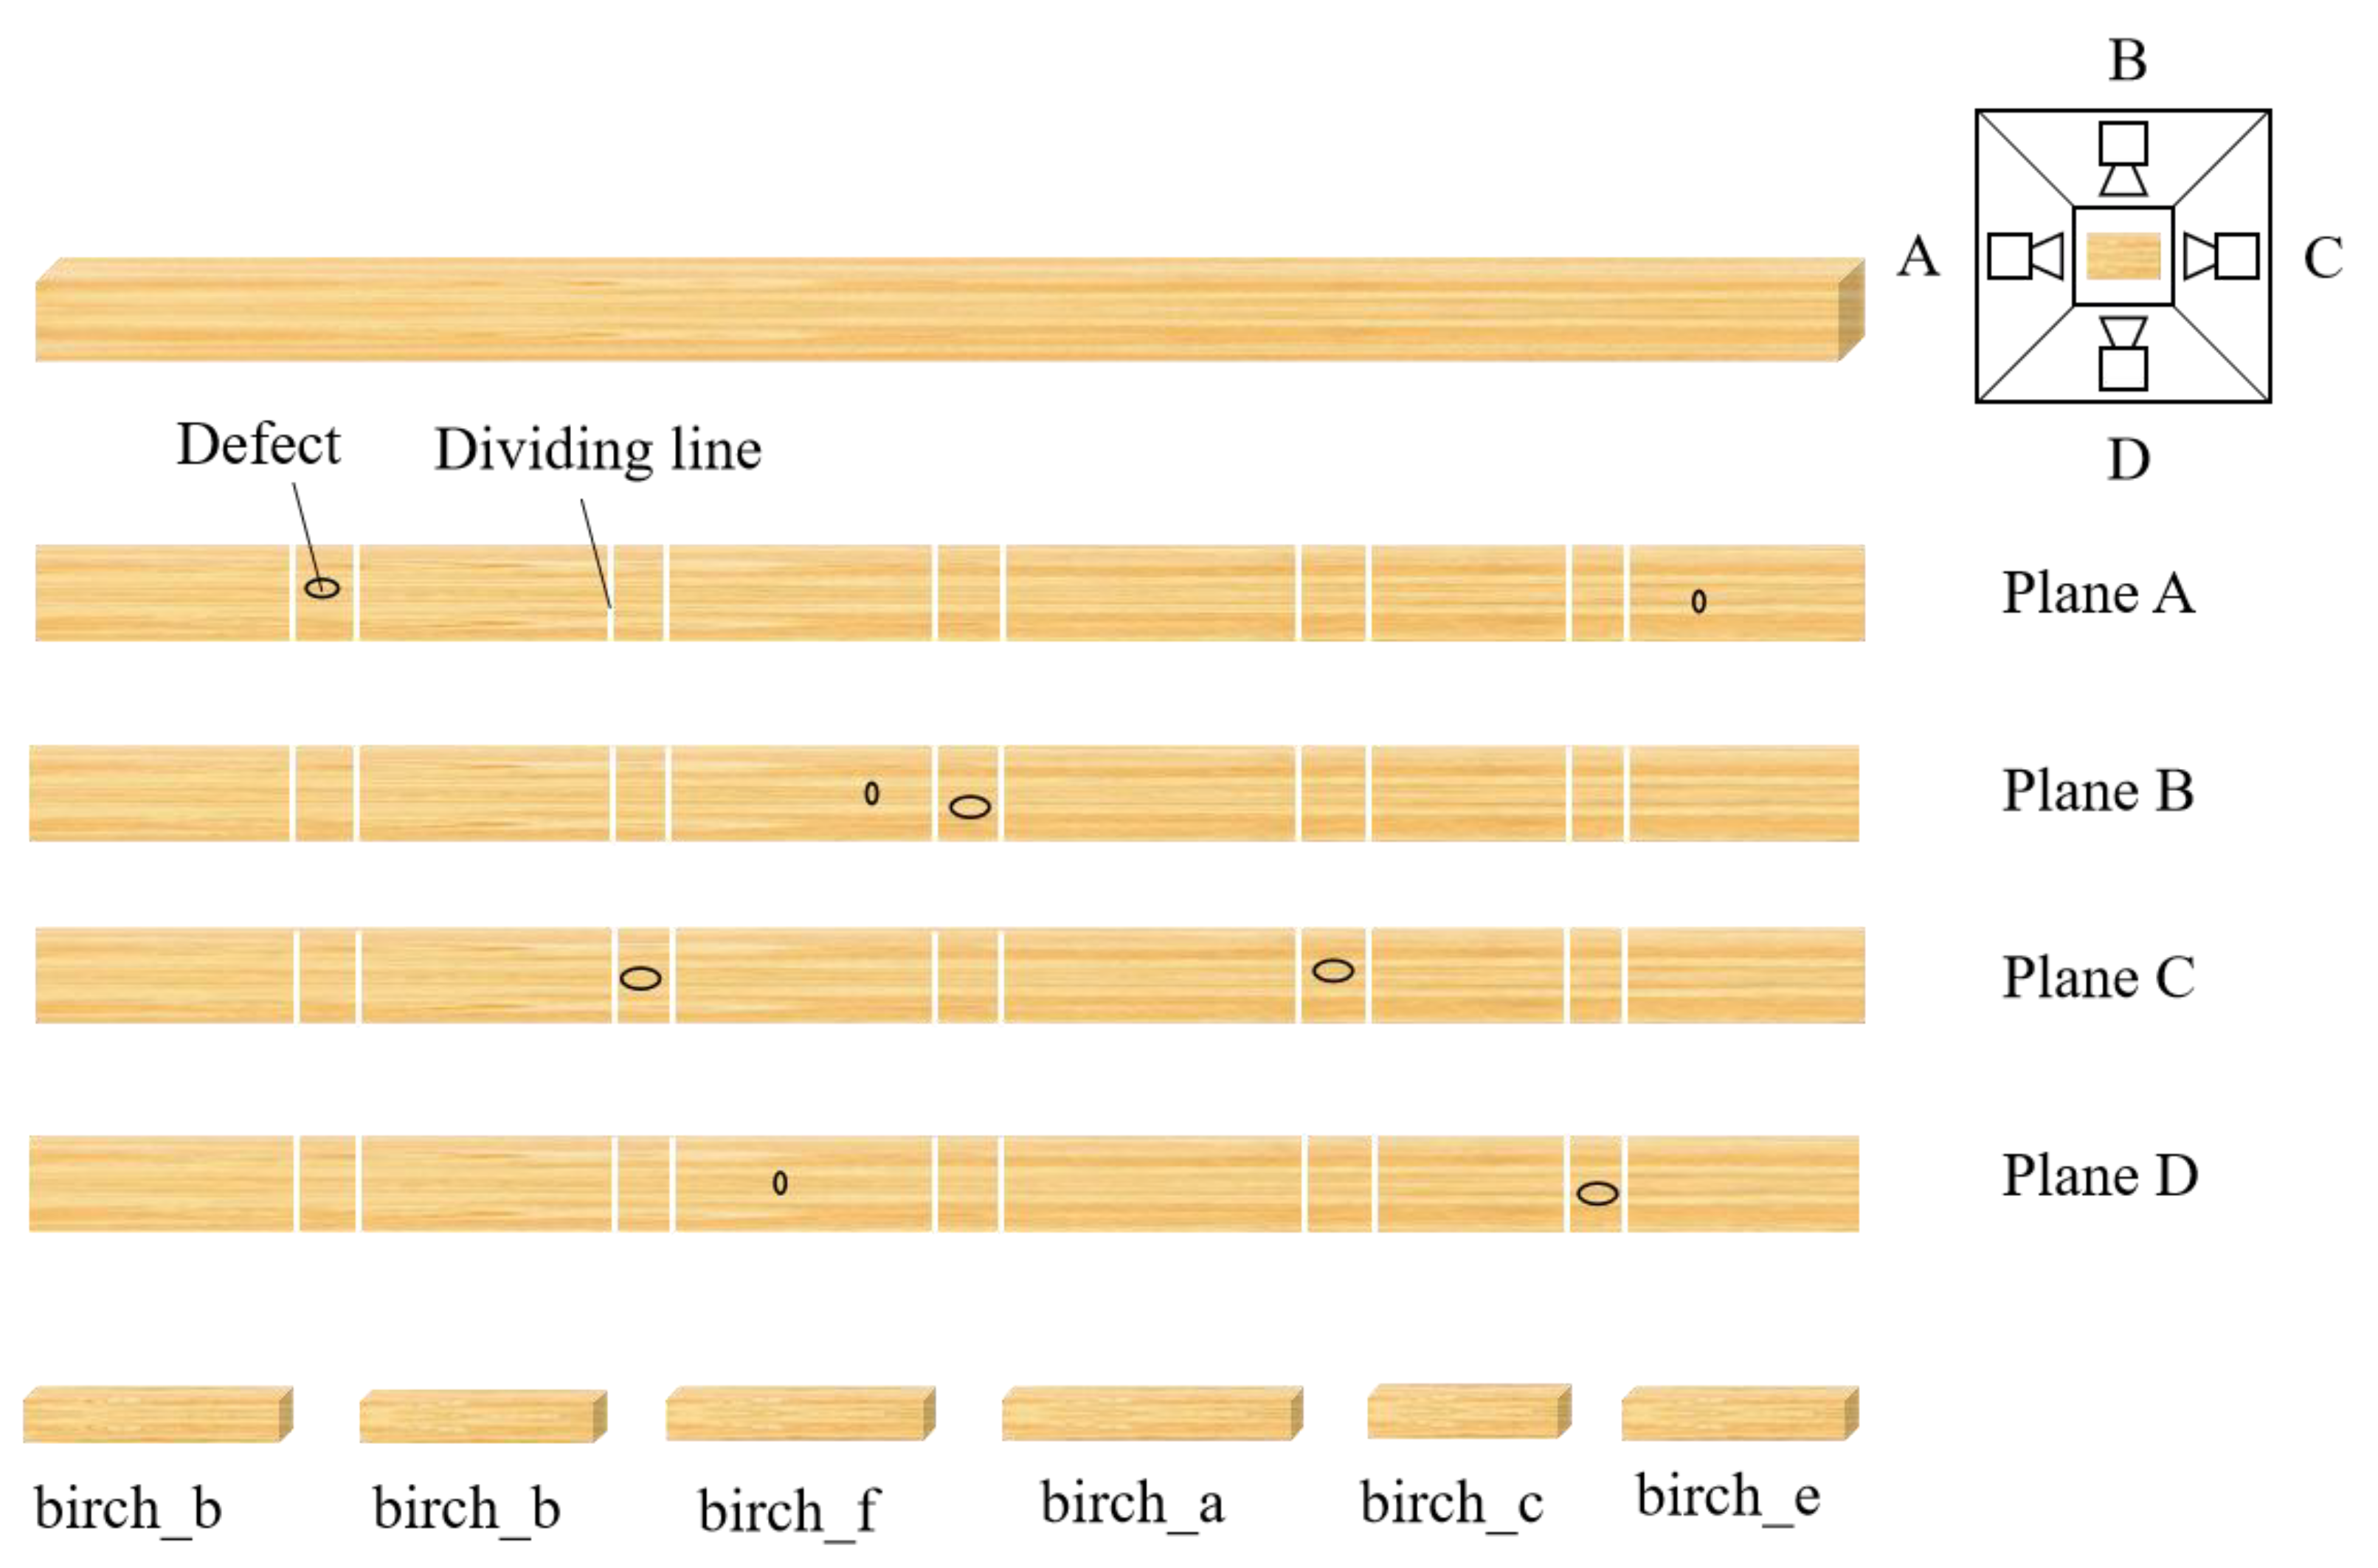
2.4.3. Material Standard Setting of Betula SAWN Timber
We established a wood information digital intelligent manufacturing basic engineering database. By combining database technology with computer aided engineering design process and management, the sawn timber design, manufacturing, management and even operation of timber structure were integrated on the basis of a unified database.
Not all surface defects of Betula sawn timber need to be removed in the application of building materials. Some defects of a relatively small size are allowed, which requires the manufacturer to set the detection type and size. Material standards were thus set to provide a flexible processing platform for wood production. According to the requirements of sawn timber with different application functions, the processing plant limits the defect size of sawn timber with different values. Among them, birch_a, birch_b, birch_c, birch_d, etc. respectively represent Betula sawn timber of different value (quality) grades, ranked from top to bottom. The processing plant can also consider customer requirements, industry standards and product requirements, limit the defect size of sawn timber of different values and produce wood that meets the actual use requirements, as shown in
Table 1.
3. Results and Analysis
The logs were sawn into timber and all pieces of timber were planed. The timber was kiln-dried to moisture contents between 12% and 15% using drying temperatures of 70°C–80 °C and relative humidity of 60–70%. The density range of timber was 0.5 g/cm3~0.7 g/cm3. Four thousand pieces of timber with different types of defects on the surface were randomly selected for detection and optimization. In the experiment, the timber length was approximately 4000 mm, the width was approximately 58 mm and the thickness was approximately 43 mm. The factory application experiment was completed at Fujian Dushi Wooden Industry Co., Ltd. of Shaowu City, Fujian Province, China. The environmental temperature of that day was 29 °C and the relative humidity was 73%. In the wood processing plant, we tested the surface defects of Betula sawn timber, including bark, dead knot, crack, heartwood, hole, inbark, material lack, wane, material lack + wane, mineral, sound knot, under thickness and under width.
3.1. Testing and Verification Procedure of Sawn Timber Optimizing Cross-Cut
During 2021–2023, we scanned, inspected and optimized Betula sawn timber. Sawn timbers for the test were in a total of 10 packages, and each pack contained 400 sticks. Optimizing cross-cut equipment (Scanner) was used to measure the size of the sawn timber, detect the defect types, measure the size and position information of defects, optimize the sawing strategy and calculate the yield of Betula sawn timber. Manual visual inspection was carried out to determine and classify the defects of sawn timber, and a vernier caliper, triangle ruler, tape measure and other tools were used to measure and locate the defects. The defect detection results of the equipment were compared with the results from manual measurement, and the detection and decision results of the two methods were recorded. We compared the comprehensive utilization value of optimizing crosscuts with the comprehensive utilization value of the manual marking sawn timber used in some production lines. The production cost and efficiency of the Betula sawn timber with optimizing crosscuts were calculated.
3.2. Betula Sawn Timber Defect Detection Accuracy
Four surface defects of Betula sawn timber were detected by scanner, as shown in
Table 2. The test results show that the scanner easily misidentifies the hole as knot. Misidentification is easy between dead knots and sound knots. In general, the detection accuracy of dead knots is higher than that of sound knots. Misidentification is easy between sound knots and the mineral thread. The stain on the surface of sawn timber (non-defect area) is easy to be detected as a mineral, sound knot and other defects, which reduces the recognition rate of minerals and sound knots. The color of heartwood is similar to that of sawn timber. Light bark is easily mistaken for mineral threads.
For some defects of a relatively small size, it is not necessary to determine the correct sawing position of the timber. This defect can be allowed without affecting the surface quality of the sawn timber. We set the defect size requirements to be detected through standard parameters.
It is difficult for human eyes to detect defects that are not very large, such as material lack, wane, under thickness and under width. The scanner equipment can accomplish a better detection. The scanner was set according to the defect size standard of wood structure components to screen out the defect area of sawn timber which is not allowed, such as under thickness, to guide the later processing. In the test process, we tested and verified material lack, wane, the under thickness and the under width, and the effect was good. Due to the poor effect of manual visual inspection for material lack, wane, under thickness and under width, the detection data were not compared with manual visual data in advance.
Based on the above analysis, we found that the detection accuracy of bark, dead knot, cracking and heartwood was higher than 85%. The identification accuracy of some defect types was affected, and the detection accuracy of hole and mineral defects was relatively low (
Figure 19). The scanner had misidentifications between defects, but it was still able to find the defects, and the average missed detection rate was low, 0.084.
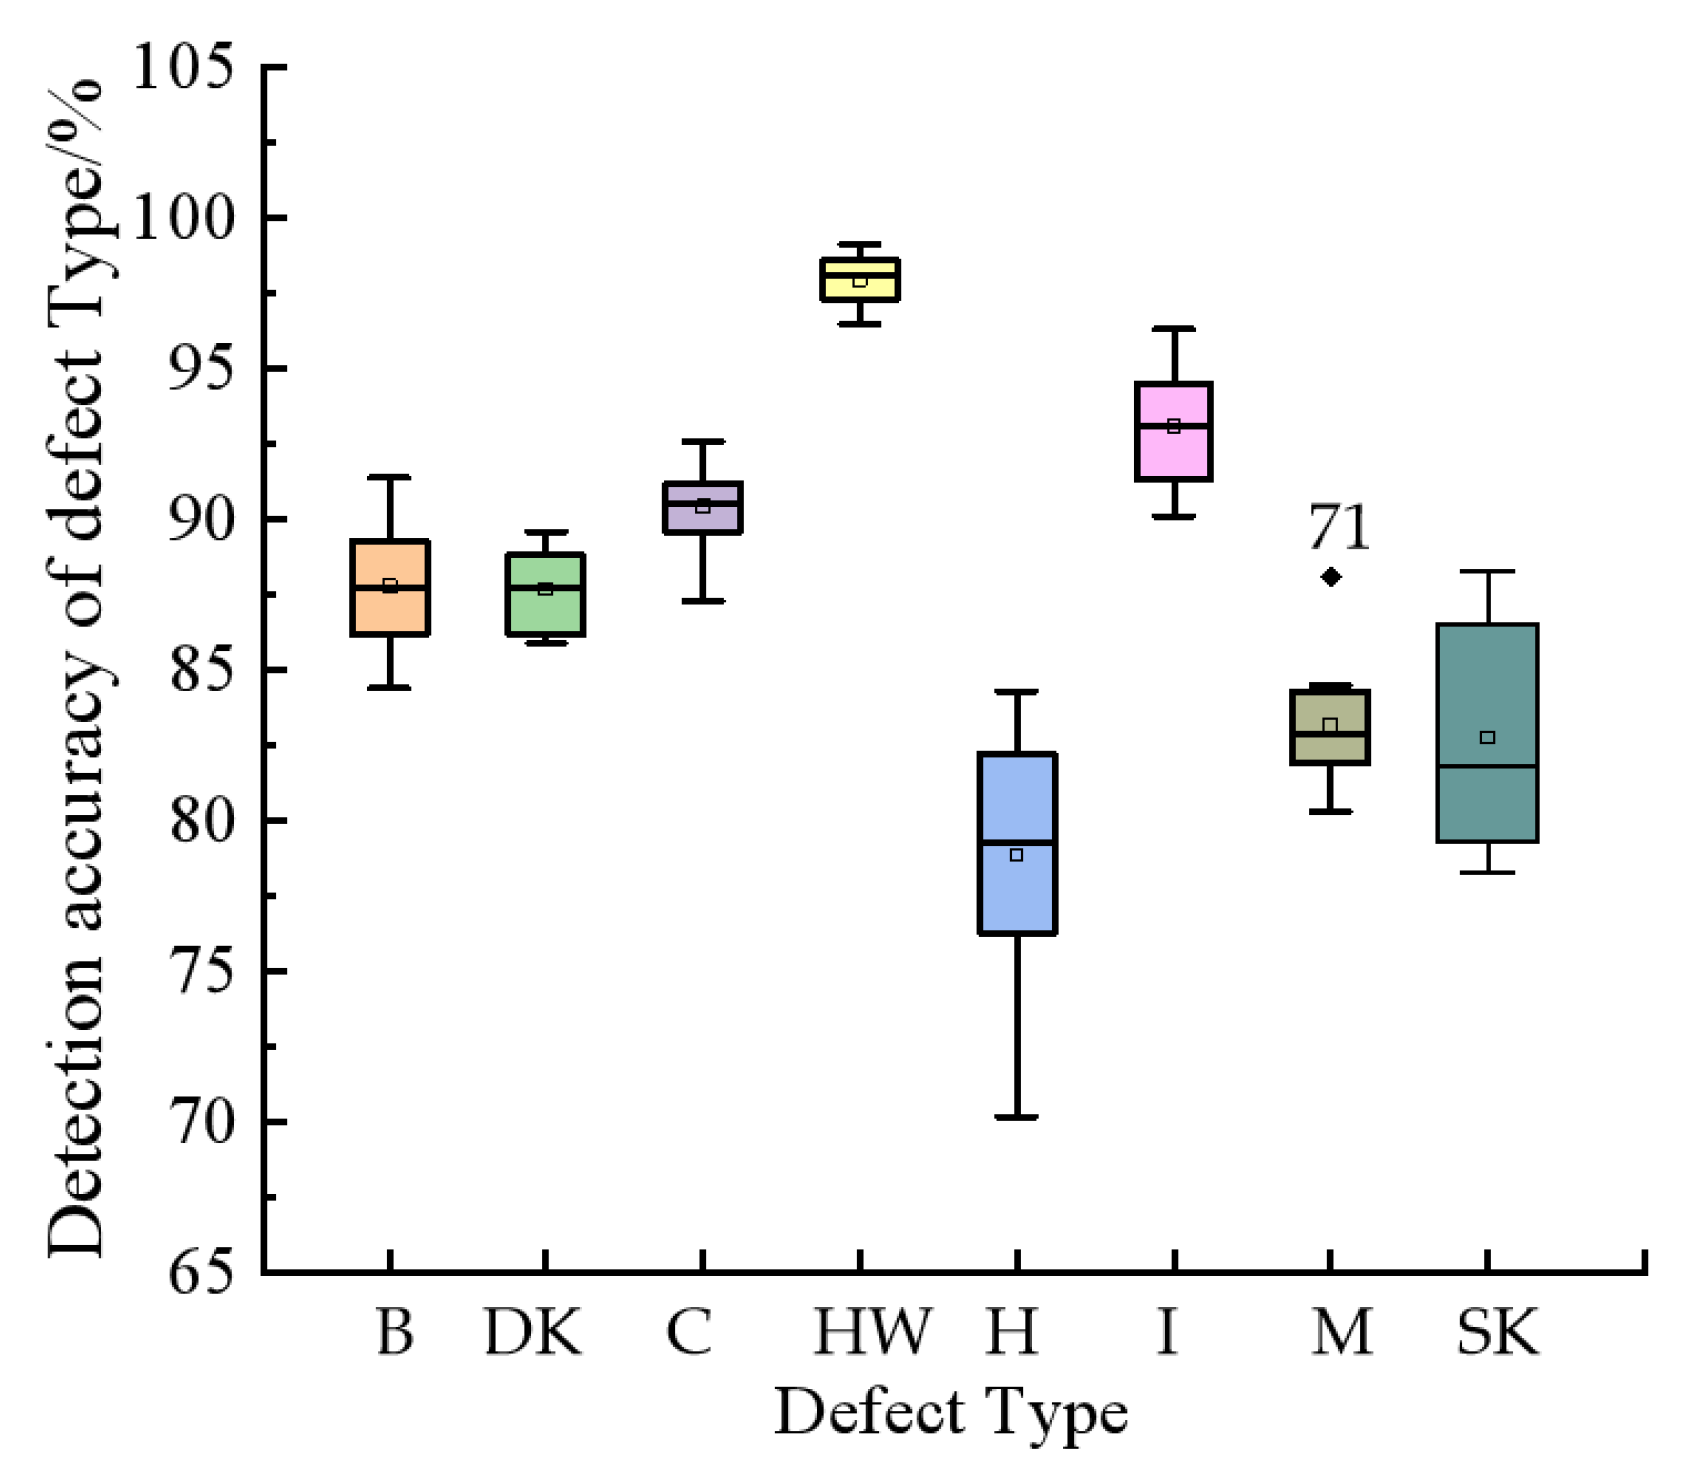
The average value of the detection accuracy of different defect types of 10 packets of sawn timber samples was calculated, and the detection accuracy of the defects of 10 packets of timber samples (400 pieces per packet) was plotted by boxplot (
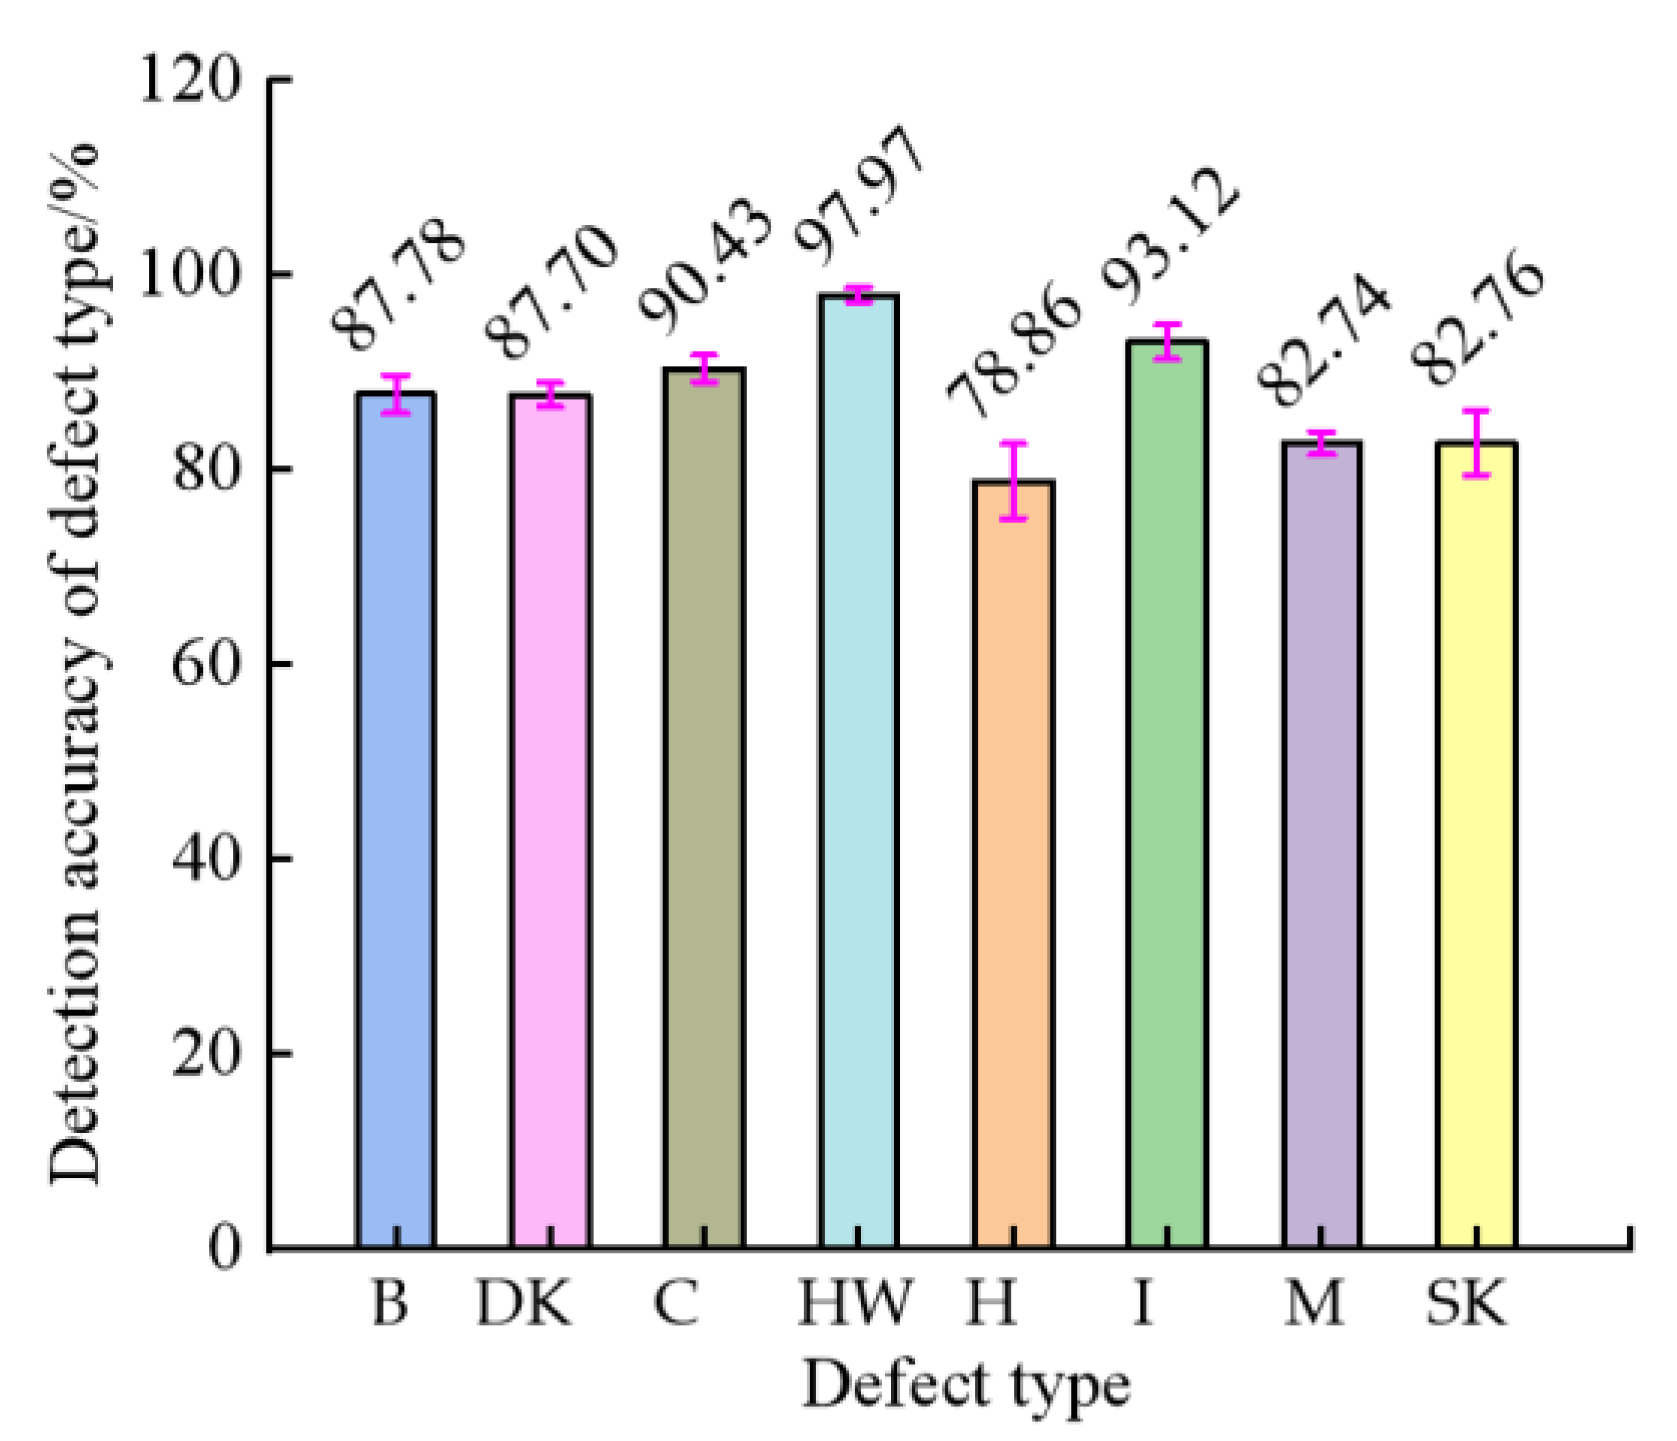
Figure 20). An outlier value labeled 71 was obtained in the figure, and the outlier value was 88.1%. The interquartile range (IQR) in the boxplot is the difference between the upper quartile and the lower quartile, where the upper limit = upper quartile + 1.5IQR, lower limit = lower quartile − 1.5IQR. Upper quartile position: 8.25, lower quartile position: 2.75, median position: 5.5. Considering the particularity of the sample data, the method of mean replacement was used in the outliers of one sample data. A bar chart of mean error was drawn (
Figure 21). According to the variation trend of the mean value in
Figure 21, it was concluded that the heartwood had the highest detection accuracy (97.97%), followed by the Inbark detection accuracy (93.12%). Among the 10 groups of timber samples, the error of the heartwood and dead joint defect types was relatively large, while the error value of the other groups was small. Through the homogeneity test of variance (
p < 0.05), we found that the difference in detection accuracy of different defect types in each group was statistically significant.
Under the condition that the surface defect type identification of the timber is correct, the measurement accuracy of the defect size and position is counted (
Table 3). In the inspection of each package of timber by scanner, the defect length, width and defect positioning accuracy of the
X and
Y axis were all greater than 80% (
Figure 22). Negative values easily appeared in the location and identification of timber defects (such as under width), especially in the
Y-axis direction.
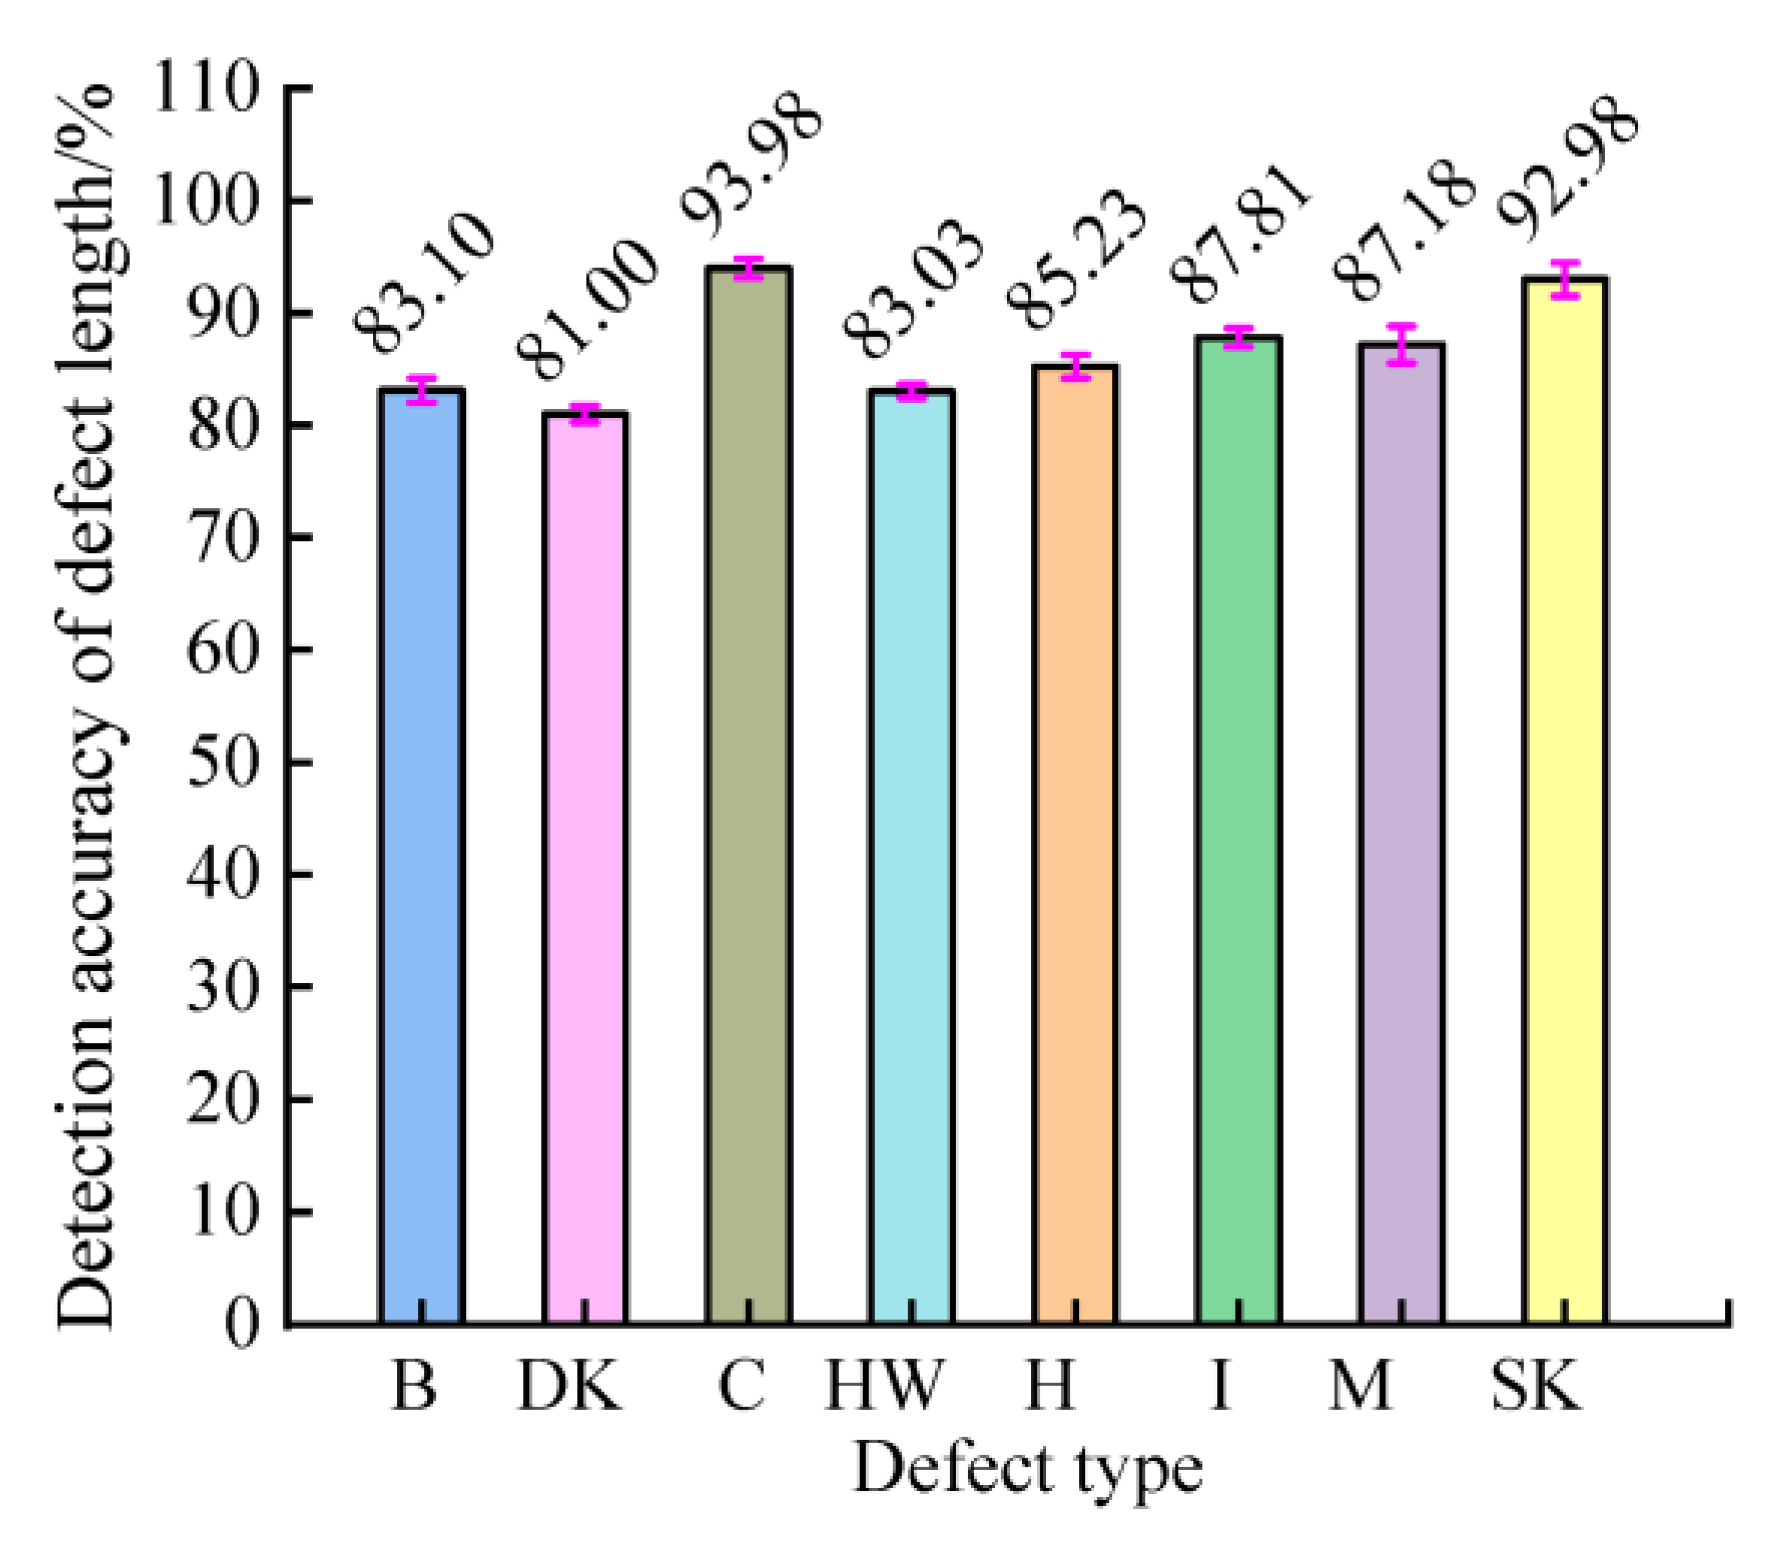
The average value of the detection accuracy of the different defect sizes (length) of 10 packets of timber samples was calculated, and the detection accuracy of the defects of 10 packets of timber samples (400 pieces per packet) was plotted by boxplot (
Figure 23). Three outlier values labeled 35, 44, 68 were obtained in the figure, and the outlier values were 98.6%, 86.3% and 84.34%. Considering the particularity of the sample data, the method of mean replacement was used for the outliers of three sample data. A bar chart of mean error was drawn (
Figure 24). According to the variation trend of the mean value in
Figure 24, it can be seen that the identification accuracy of crack and sound knot size (length) was relatively high, and the mean detection accuracy of crack length and sound knot was 93.98% and 92.98%, respectively. The error value of 10 groups of data for each defect was small. We used the homogeneity test of variance (
p < 0.05), to demonstrate that the difference in detection accuracy of the different sizes (length) in each group was statistically significant.
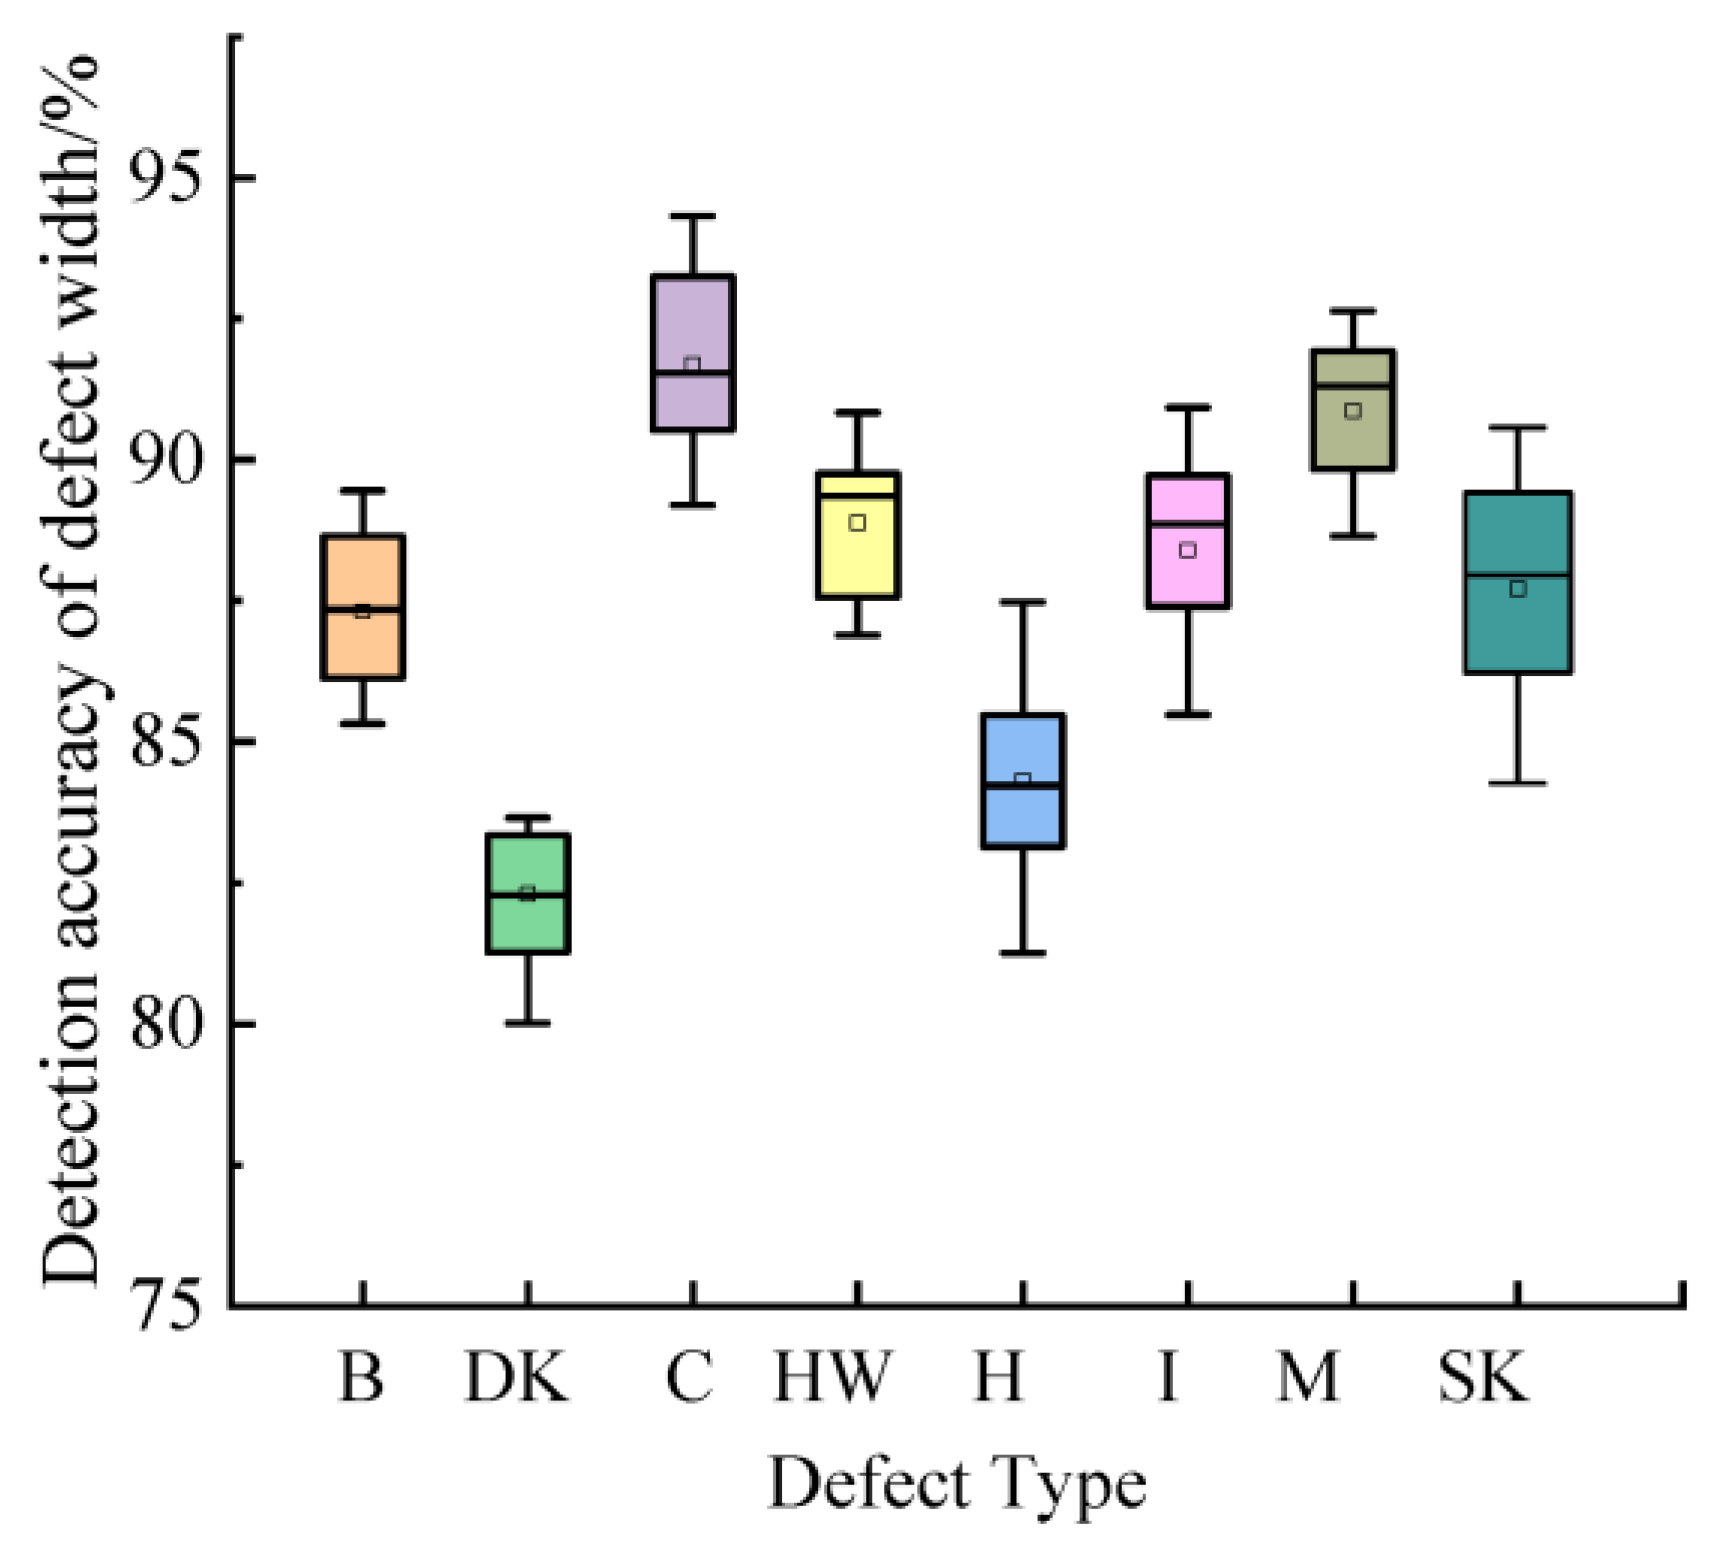
The average value of the detection accuracy of the different defect sizes (width) of 10 packets of timber samples was calculated, and the detection accuracy of the defects of 10 packets of timber samples (400 pieces per packet) was plotted by boxplot (
Figure 25). It was a normal value in the picture figure. A bar chart of mean error was drawn (
Figure 26). According to the variation trend of the mean value in
Figure 26, it can be seen that the identification accuracy of crack and mineral size (width) was relatively high, and the mean detection accuracy of crack width and mineral was 91.70% and 90.87%, respectively. The error value of 10 groups of data for each defect was small. We used the homogeneity test of variance (
p < 0.05), to demonstrate that the difference in detection accuracy of different defect sizes (width) in each group was statistically significant.
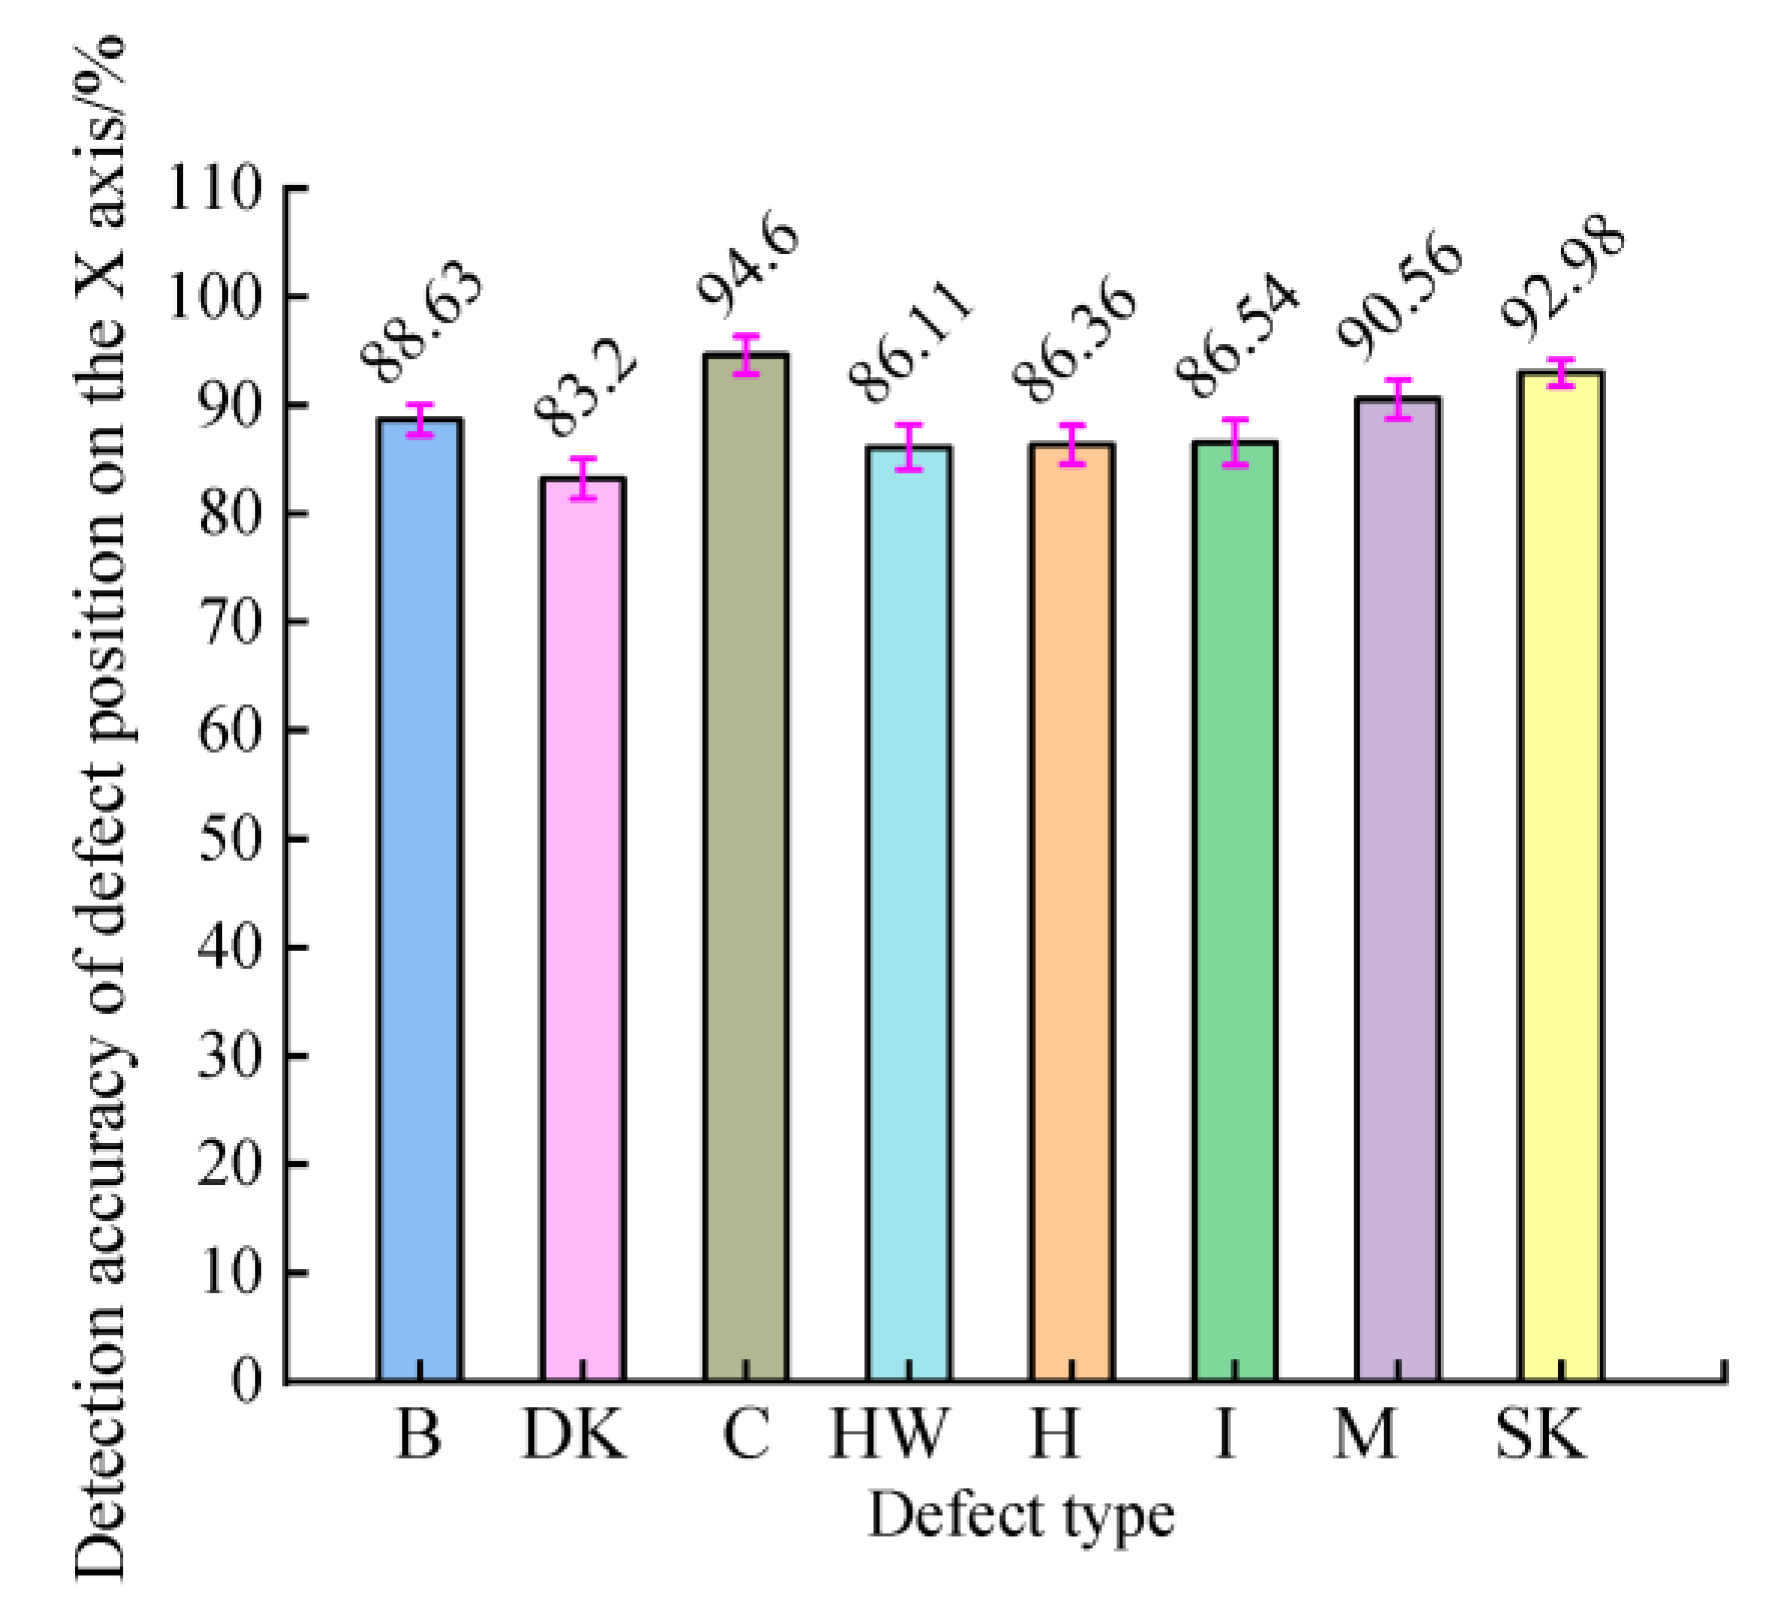
The average value of the detection accuracy of different defect positions (on the X axis) of 10 packets of timber samples was calculated, and the detection accuracy of the defects of 10 packets of timber samples (400 pieces per packet) was plotted by boxplot (
Figure 27). Two outliers value labeled 15, 55 were obtained in the figure, and the outlier value was 90.61% and 90.26%, respectively. Considering the particularity of the sample data, the method of mean replacement was used for the outliers of the two sample data. A bar chart of mean error was drawn (
Figure 28). According to the variation trend of the mean value in
Figure 28, it can be seen that the identification accuracy of crack, sound knot and bark position (on the X axis) was relatively high, and the mean detection accuracy of crack position (on the X axis) and sound knot was 94.60%, 92.98% and 88.63%, respectively. The error value of 10 groups of data for each defect was small. We used the homogeneity test of variance (
p < 0.05), to demonstrate that the difference in detection accuracy of different defect positions (on the X axis) in each group was statistically significant.
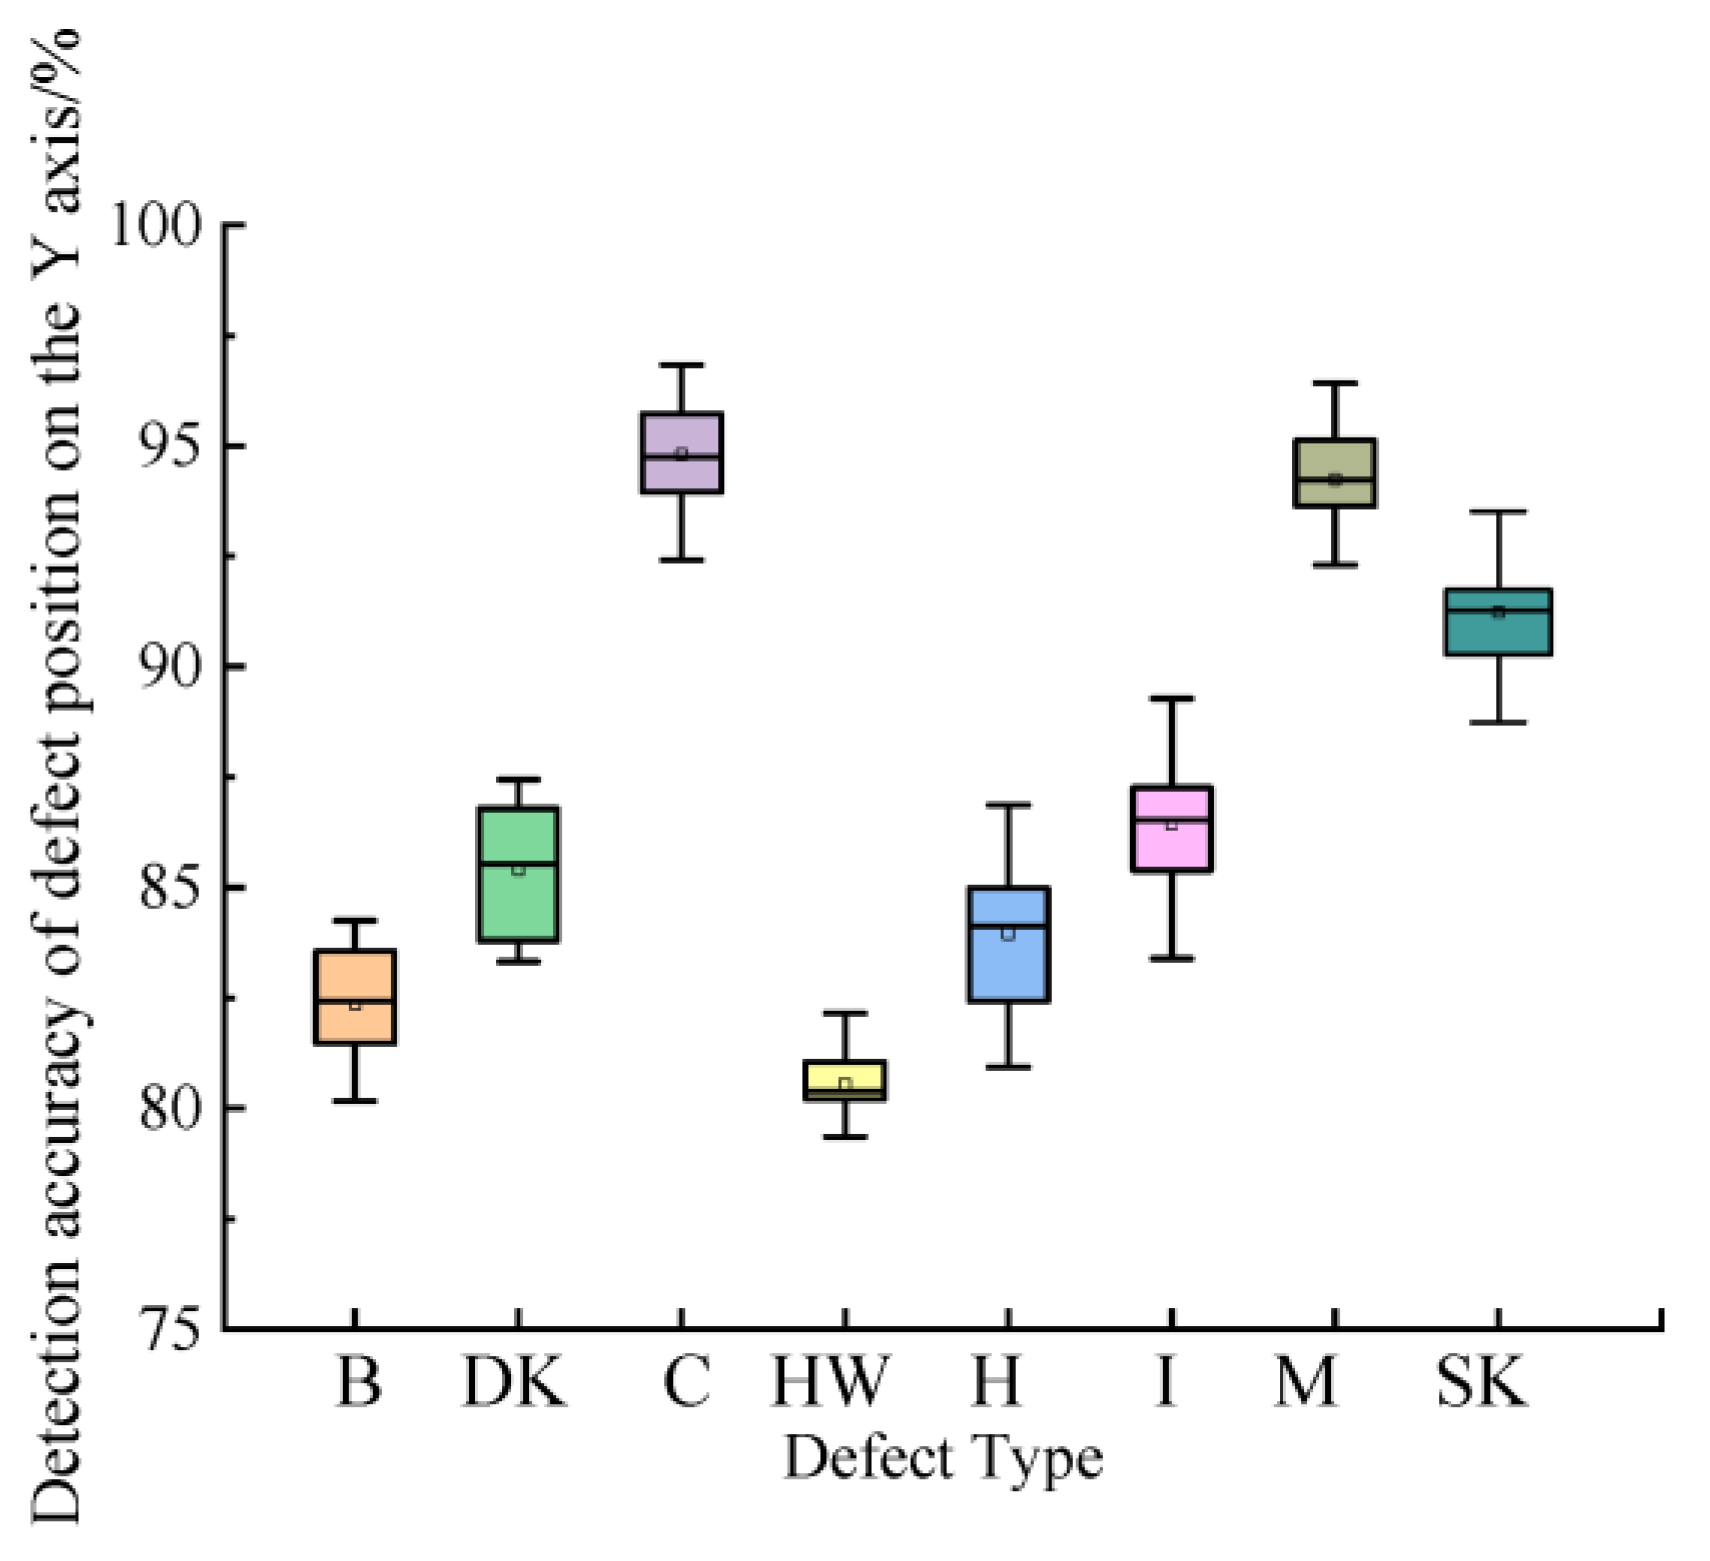
The average value of the detection accuracy of different defect positions (on the Y axis) of 10 packets of timber samples was calculated, and the detection accuracy of the defects of 10 packets of timber samples (400 pieces per packet) was plotted by boxplot (
Figure 29). It was a normal value in the picture figure. A bar chart of mean error was drawn (
Figure 30). According to the variation trend of the mean value in
Figure 30, it can be seen that the identification accuracy of crack and mineral position (on the Y axis) was relatively high, and the mean detection accuracy of crack position (on the Y axis) and mineral was 94.80% and 94.23%, respectively. The error value of 10 groups of data for each defect was small. We used the homogeneity test of variance (
p < 0.05), to demonstrate that the difference in detection accuracy of different defect positions (on the Y axis) in each group was statistically significant.
The accuracy of the length and width detection of timber affects the defect location. The scanner had a high detection accuracy for the size (length, width and thickness). The average measurement error of the length, width and thickness of the timbers were 0.31%, 1.16% and 1.18%, respectively (
Table 4), which were within the allowable range. We selected 10 timbers for six tests. The standard deviation of length (STDEV) was less than 4, the standard deviation of width (STDEV) was less than 4 and the standard deviation of width and thickness (STDEV) was less than 2. The stability of the scanner timber size detection was better.
3.3. Betula Solid Sawn Timbers Yield
The scanner was able to realize the statistical function of the total timber length, total timber volume and total timber yield in the production (
Table 5). The yield of timber was fitted by Gaussian function, as shown in
Figure 31.
The yield of Betula timbers was mainly 81–90%, followed by 71–80% and 90–100%. The experiment proves that the yield of this batch of timbers was high. Based on the above test results, timber meet the requirements of production and processing.
3.4. Comparison of the Comprehensive Utilization Value of Optimized Sawing Timber and Manual Marking Sawing Timbers
After 100 packets of Betula sawn timber were tested, the timber yield of different values was counted. According to the different quality of timber, the utilization value of this batch of optimized sawn timber was calculated. According to
Figure 32 (distribution of yield of Betula timber), the total yield of this batch of materials is calculated: yield 60% (≤60%) × timber number of × single timber volume + yield 65% (61–70%) × timber number of × single timber volume + yield 75% (71%–80%) × timber number of × single timber volume + yield 85% (81–90%) × timber number of × single timber volume + yield 95% (91–100%) × timber number of × single timber volume 60% × 30 × 0.010 + 65% × 85 × 0.010 + 75% × 835 × 0.010+85% × 2321 × 0.010 + 95% × 726 × 0.010 = 33.56 m
3.
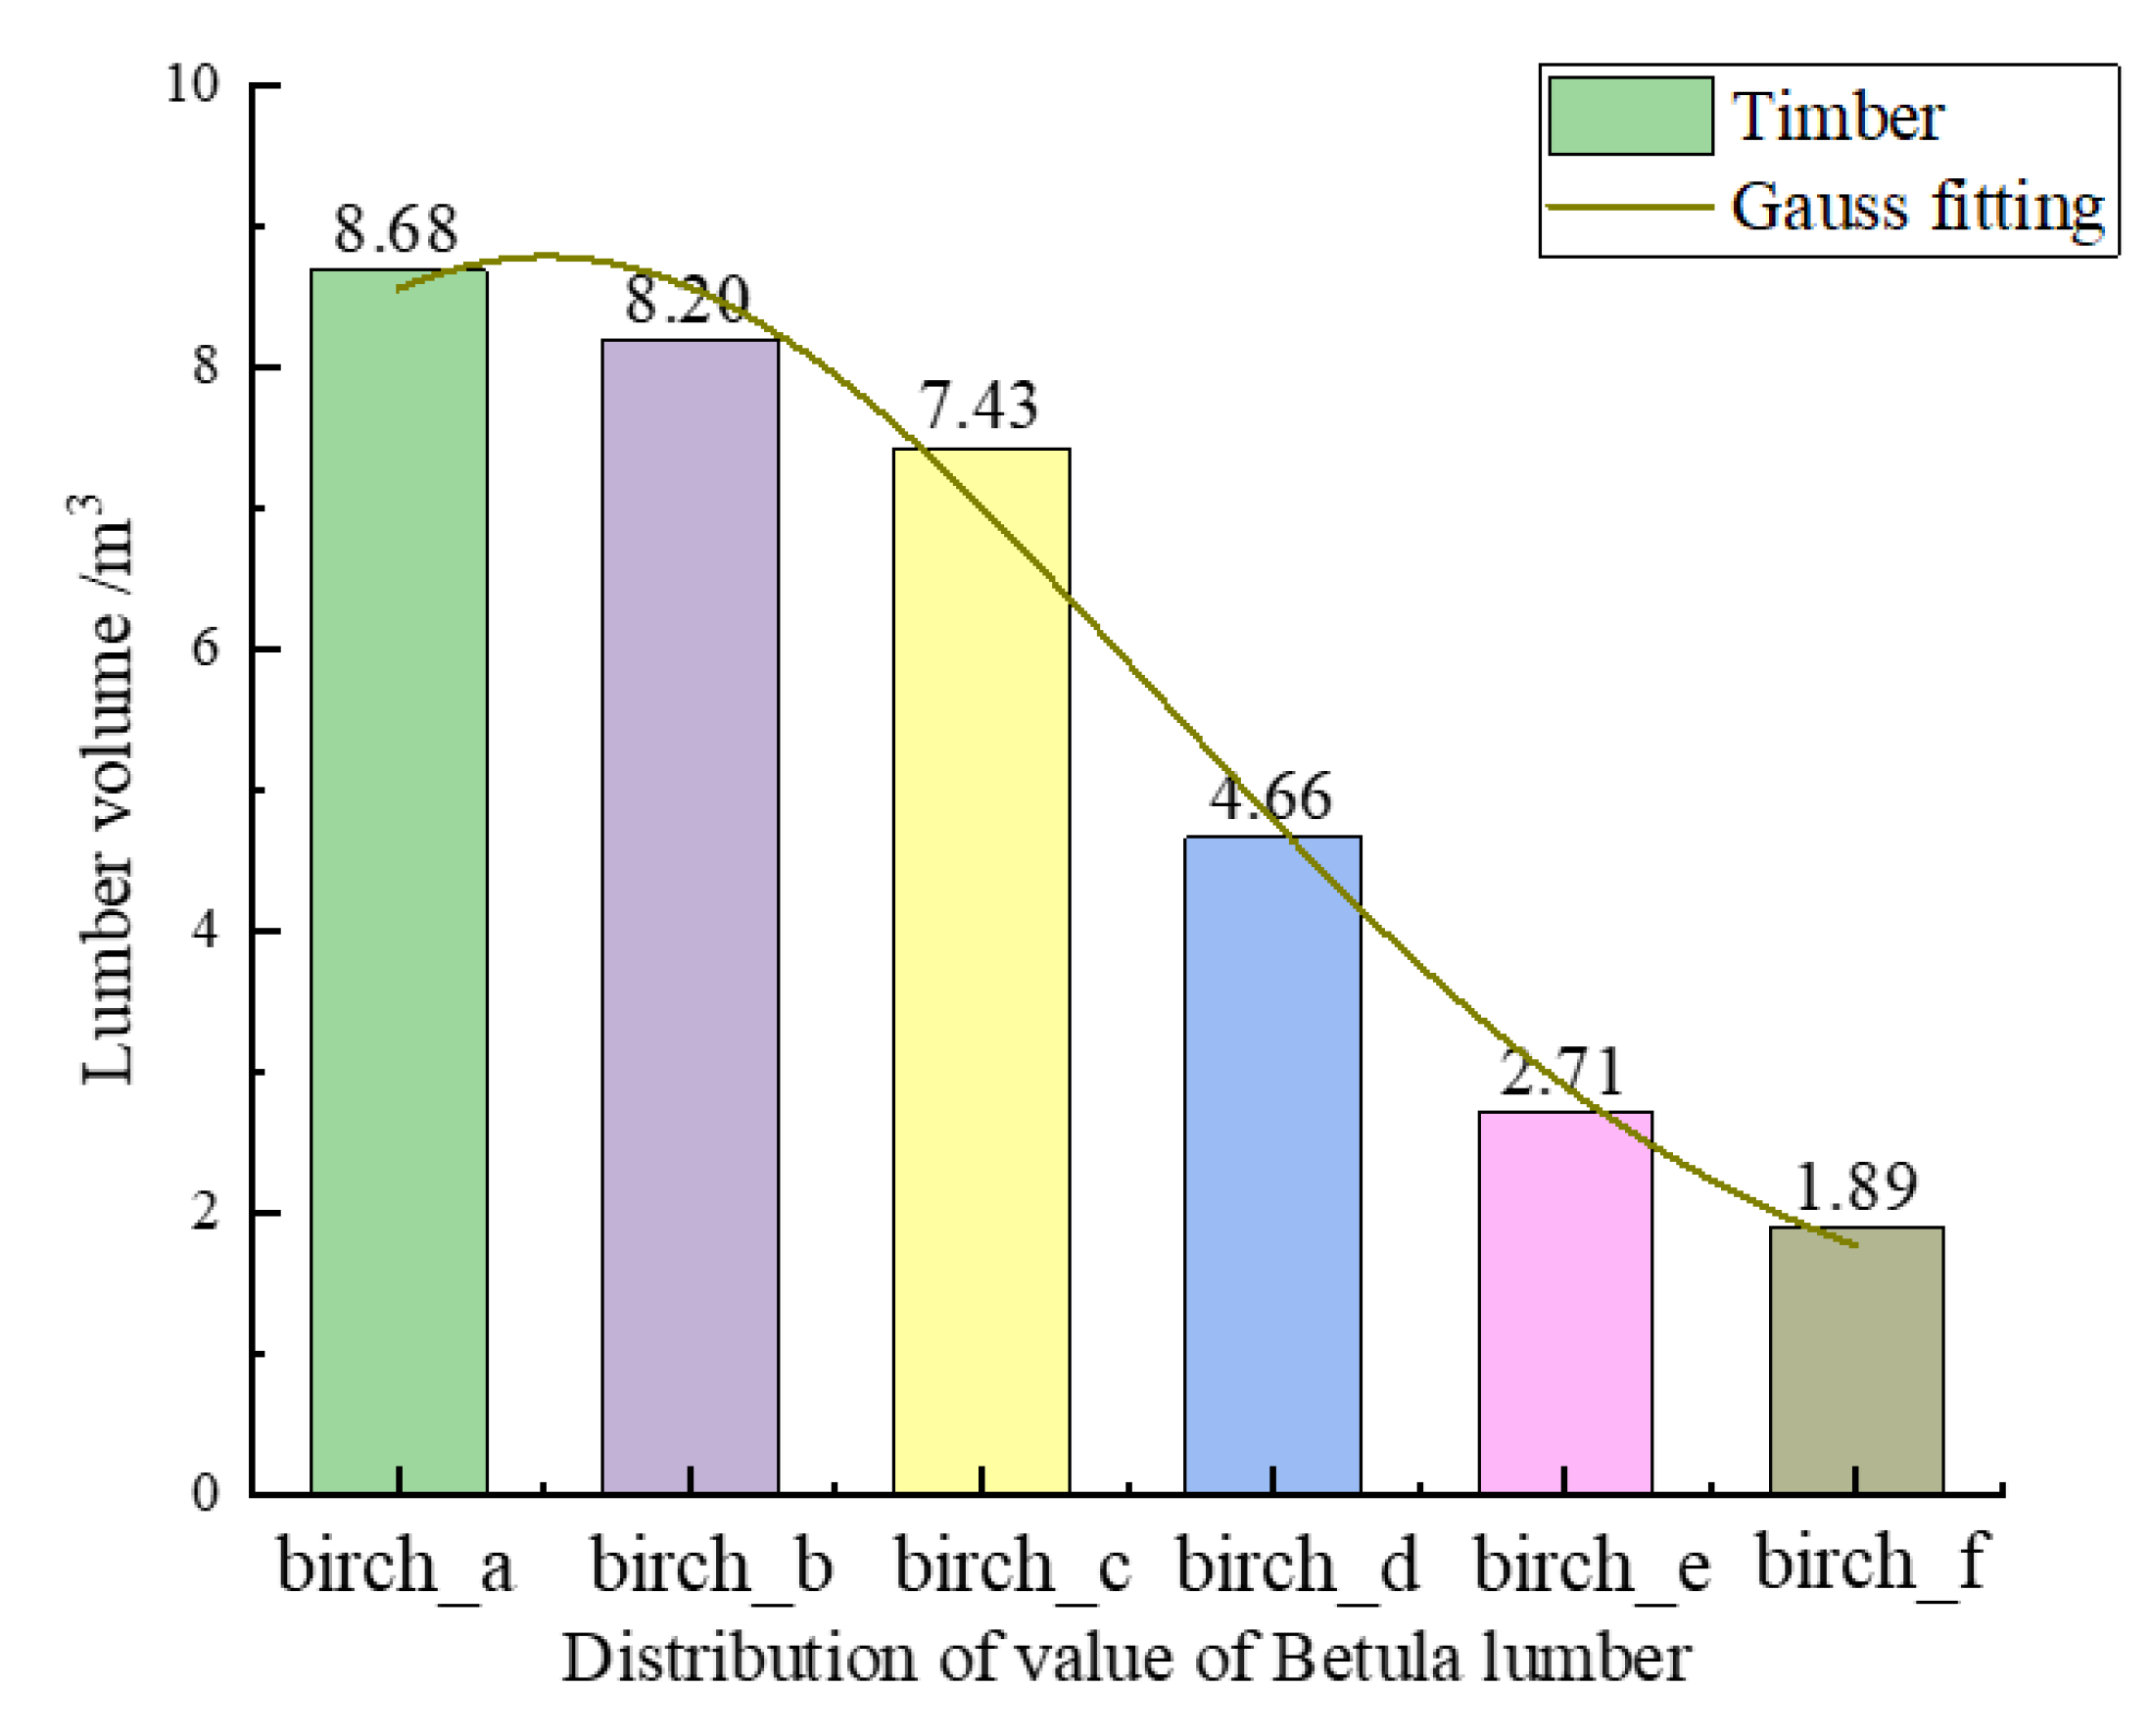
According to the total yield, the volume distribution of Betula timber with different values was calculated, as shown in
Figure 25. We calculated the utilization value of a whole batch of materials: total volume × ratio1 × value1 (birch_a) + total volume × ratio2 × value2 (birch_b) +…+ total volume × ratio 6 × value 6 (birch_f) = 33.56 × 25.85% × 407.40 USD
$ (2800 CNY¥) + 33.56 × 24.43% × 392.85 USD
$ (2700 CNY¥) + 33.56 × 22.13% × 378.30 USD
$ (2600 CNY¥) +33.56 × 22.13% × 363.75 USD
$ (2500 CNY¥) + 33.56 × 13.90% × 349.20 USD
$ (2400 CNY¥) + 33.56 × 8.08% × 334.65 USD
$ (2300 CNY¥) + 33.56 × 5.63% × 320.10 USD
$ (2300 CNY¥) = 12,844.52 USD
$ (88,241.89 CNY¥). Therefore, the comprehensive utilization value of scanner-optimized sawn timber was 12,844.52 USD
$. When the manual marking method was used on the sawn timber, according to the value of Betula sawn timber of 334.65 USD
$ (2300 CNY¥), the comprehensive utilization value of timber was calculated, and the comprehensive utilization value = 33.56 × 334.65 USD
$ (2300 CNY¥) = 11,236.27 USD
$ (77,193.19 CNY¥). After adopting the optimized scanner, the comprehensive utilization value of timber increased by 1608.25 USD
$ (11,048.69 CNY¥), an increase of 14.13%. If 12,000 m
3 is produced per month, the annual comprehensive utilization value of timber can be increased by 690,026.20 USD
$ (4,740,480 CNY¥).
3.5. Cost and Efficiency Calculation
Combined with Betula timber processing technology, the manual visual inspection process was replaced by the scanner program. With the same production capacity, 3–4 workers can be saved. If the average person is 724.13 USD$ (5000 CNY¥)/month, the annual savings can be 34,758.43 USD$ (240,000 CNY¥). Combining timber detection and optimization algorithms with wood processing equipment can form an unmanned production line, which can not only save labor costs, but also promote the development of unmanned wood plants. According to the production test, the yield of timber increased by 10–15% after the application of the scanner equipment. If the production rate is 1000 m3 per month, and 334.65 USD$ (2300 CNY¥) per cubic meter, the annual savings can be 1000 × (10–15%) × 2300 × 12 = 399,700–599,600 USD$ (2,760,000–4,140,000 CNY¥). If we classify the value of timber according to different uses, we improve the additional value of the products and increase the value by at least 144,826.79 USD$ (1,000,000 CNY¥) every year. The scanner application improves the working environment of workers, produces a high yield, reduces labor intensity and reduces the industrial injury accident rate.
In the machine vision inspection system, the sawn timber scanning time is 0.311 s, and the image analysis time is 0.368 s. The scanner speed is 150 m/min, 214 m/min, the minimum distance between timbers (open signal) is 1500 mm, the minimum time interval between timbers (open signal) is 1500 ms and the average decision-making speed of this process can reach at least 60 m/min. Manual marking and highlighter detection of 20 m/min when using the scanner can process more than 6,451,200 m per year, 16,089.2928 m3. Compared with manual detection, machine detection can also save manual rest time.
4. Conclusions
The research carried out the research and development and industrial application of key technologies of intelligent manufacturing of wood structure building materials, and the construction of intelligent automatic optimization sawing production line of wood structure building components can realize the automatic and flexible manufacturing goals of prefabricated components. Intelligent automated detection and optimization grading can improve the precision and production efficiency of wood processing, lay the foundation for the formation of a complete set of intelligent production system for the future wood industry, and has high theoretical value and broad market application prospects.
In the process of test analysis, taking the detection of Betula solid timber algorithms and optimizing crosscuts as an example, in general, the average detection accuracy of defect types of timber was 89.69%, the average detection accuracy of size was 89.69% and the average localization accuracy was 92.25%. The average yield of Betula timber was 82.29%, and the Betula timber could be scanned and decided at the highest detection speed of 702 ft/min (214 m/min) to verify the applicability of the system. Detection errors could be further reduced by improving the defect detection, which is currently in the works. We can compare the defect detection results with the manual measurement results, record the detection and decision results of the two methods and count the items of detection error. These data can guide the later improvements of the detection algorithm.
In the production application, the automatic intelligent processing system of Betula structural building materials hhadas a good ability of detection, classification, sawing and optimization, saving labor, labor cost, productivity and improving the yield of Betula sawn timber and the added value of materials. The application and promotion of mechanical design, automation technology, machine vision inspection, deep learning recognition, optimization sawing algorithms, electronic design automation and other technologies and methods are of great significance to improve the automation and intelligence level of the wood processing industry.


